Abstract
Urban agglomerations in plateau regions often face severe landscape fragmentation and cross-boundary ecological pressures, highlighting the need for coordinated eco-logical planning for sustainable urban development. We coupled species–landscape interactions and multi-ecological services to construct sustainable ecological security patterns (ESPs) and establish a collaborative optimization framework. Specifically, we integrated MaxEnt-derived habit suitability with InVEST-based ecosystem services to identify ecological sources (ESs) and analysis the environmental impacts on species distribution. Based on this, we built a multi-factor resistance surface and employed circuit theory to extract ecological corridors (ECs) and critical nodes (pinch points and barrier points). Then, we quantitatively compared two simulated scenarios (barrier points restoration and stepping stone augmentation) to assess the spatial priority of ecological nodes. We identified 48 ESs (26,410.48 km2, mainly distributed in Chuxiong, Yuxi, Honghe, and Kunming), 115 ECs (2670.02 km, with a west-dense and east-sparse spatial pattern), 43 pinch points, and 39 barrier points. Scenario simulation shows that repairing 39 barrier nodes increases network connectivity by an average of 33.52% and global network efficiency by 19.44%, whereas adding steeping stones yields improvements of 20.09% and 5.56%, respectively, indicating that barrier-node restoration produces larger contribution in both connectivity and efficiency at the global scale. Leveraging EN construction and scenario simulation, we developed an ESP-based sustainable framework for collaborative optimization in plateau urban agglomerations. The framework specifies agglomeration-specific coordination pathways, which are expected to provide a transferable blueprint for biodiversity conservation, ecosystem optimization, and sustainable development.
1. Introduction
Urban agglomerations consist of multiple cities as fundamental units, which have exhibited significant characteristics of corrdination and have replaced individual cities as the predominant spatial organizational form of socio-economic organization [,,]. However, rapid urbanization has disrupted ecological security patterns (ESPs) through urban expansion, landscape fragmentation, habitat loss, etc. [,,,]. Due to the fragile structure, highly sensitivity, complex topography and administrative borders, these pressures are amplified in plateau regions [,,]. The ecosystems of plateau urban agglomerations exhibit distinct characteristics in terms of biodiversity and land use: biodiversity is often highly concentrated yet fragile, significantly influenced by topography and climate; land use, constrained by natural conditions, is prone to fragmentation. In the CYUA, abundant ecological resources coexist with intensive human activities, giving rise to unique ecological challenges. Consequently, optimizing ESPs is essential to address these challenges and has become an urgent requirement for keeping achieving long-term regional ecological security and sustainable development [,].
As a core concept in landscape ecology, ESPs quantify the functional connectivity and stability by constructing ecological networks [,,]. The construction of ESPs typically follow a general framework—identifying ecological sources (ESs), constructing ecological corridors (ECs), and extracting critical nodes [,]. The identification of ESs primarily includes: (1) utilizing ecological zones with superior habitat quality indices [,]; (2) applying morphological analysis (such as Multi-scale Spatial Pattern Analysis, MSPA) [,,]; (3) multidimensional and multi-indicator approaches [,,]. On this basis, a resistance-surface is constructed to further extract ECs. Resistance-surface describe landscape obstructions to ecological flows, which are generally developed based on land use types, natural and human factors [,,,]. Then, a method named minimum cumulative resistance (MCR) calculates least-cost corridors by accumulating cell-based resistance along candidate routes and selecting the paths (ECs) with the lowest total movement cost [,]. Recently, circuit theory conceptualizes species dispersal as random movements through conductive pathways, which better aligns with biological movement characteristics [,,]. Therefore, circuit theory has now been widely applied for ECs extraction [,]. Despite these progresses, existing ESPs construction usually identify ESs based on a single dimension (landscape pattern or ecosystem services) and without a comprehensive perspective, which leads to the limitation in representing real scenarios [,]. Coupling species distributions with landscape pattern yields source areas that align with realized habitat suitability and dispersal needs []. Similarly, existing resistance surfaces lack environmental predictors that actually shape species occurrence. Incorporating these predictors and their contributions to species distributions into resistance weighting can produce more realistic movement costs and more accurately representation of spatial heterogeneity [].
Moreover, due to the well-documented spatial spillover and transferability of ecological risks in urban agglomerations [,], various risks are correlated across regions rather than isolated. This cross-regional impact results in the limitation of existing territorial governance []. Recent studies indicated that the collaborative pattern in urban agglomerations are effective for integrating ecological–productive resources and optimizing spatial allocation, thereby improving current territorial governance [,]. However, from the perspective of urban planning, the limited resources are generally not enough to restore all ecological components, which resulted in an unclear optimization objection [,]. Additionally, there will be various demands by the uneven economic capacity and development priorities across cities, leading to inconsistent strategies. Thus, it remains largely unclear how to identify responsible agents and target objects of collaborative optimization in plateau urban agglomerations and to convert existing ESP into implementable strategies.
This study proposed a comprehensive framework to explore collaborative optimization of ecological security patterns in a plateau urban agglomeration. We here use the Central Yunnan Urban Agglomeration (CYUA) as the study area, as CYUA is a typical plateau urban agglomeration with diverse geographical and environmental conditions. The objectives include the following: (1) Integrating species–landscape dynamic interactions to construct ESPs; (2) Simulating and evaluating optimization ESPs based on complex theory; (3) Constructing the spatial prioritized products of ecological nodes and developing a collaborative optimization framework. To achieve these objectives, we integrate MaxEnt-derived habitat suitability for nationally key protected bird species with InVEST-based ecosystem services to delineate Ess. Then we adopt an Analytic Hierarchy Process (AHP)-weighted to construct a resistance surface, with weights revised by species–environment contributions, and applied circuit theory and Linkage Mapper to extract ECs and identify critical nodes (pinch points and barriers) [,,,]. Based on the construction of ESP, we designed two cross-boundary optimization scenarios—(I) restoring barrier nodes and (II) adding stepping-stone nodes—and assessed the improvements in network structure (α, β, γ) and robustness through network efficiency at a global scale, with targeted and random node-attack simulations. We further ranked ESs and nodes by efficiency loss to derive a spatial priority map that links evidence from simulations to actionable coordination. Finally, we discussed the cross-regional coordination requirements and city-specific collaborative implementation pathways, we expected that this collaborative optimization framework will not only strengthen ecological resilience in CYUA, but also provide transferable guidance for areas facing similar ecological development scenarios.
2. Materials and Methods
2.1. Study Area
The CYUA is one of the 19 national-level urban agglomerations designated for strategic cultivation, and serves as the essential area for advancing ecological civilization construction in Yunnan Province. Located in central Yunnan Province (24°20′–26°35′ N, 101°40′–104°00′ E), the CYUA covers an area of 111,400 km2, accounting for 29.07% of the total area of Yunnan Province (Figure 1). According to the 2020 “Development Plan for the Central Yunnan Urban Agglomeration” issued by the Yunnan Provincial People’s Government, the spatial extent of CYUA includes the prefecture-level cities of Kunming, Qujing, Yuxi, Chuxiong Yi Autonomous Prefecture, and seven counties (cities) from the northern part of Honghe Prefecture, totaling 49 county-level administrative units (counties, county-level cities, and districts) [].
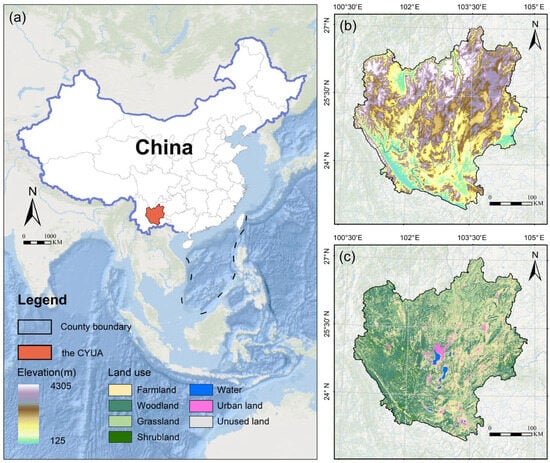
Figure 1.
Geographic location (a); elevation (b) and land use (c) of the research area.
As the core area of the “Three Rivers and Six Lakes” system, the CYUA provides rich ecological resources to provide vital ECs and critical habitats for numerous species, while also delivering critical ecosystem services, including water source conservation and soil retention, which are crucial for urban development. However, as the most densely populated and economically dynamic region in Yunnan, the CYUA had a permanent population of 21.96 million (46.5% of the provincial total) and GDP of 1507.395 billion CNY (61.5% of provincial GDP) by 2020, thereby confronting severe pressure from resource overexploitation and acute human–land conflicts. Intensive anthropogenic disturbances have led to habitat fragmentation, causing a sharp decline in biodiversity and critically threatening the persistence and movement of key species, posing unprecedented challenges to the regional ecosystem.
2.2. Data Sources
The species distribution data utilized in this research were acquired as follows: legally protected species were identified based on the “National List of Key Protected Wild Animals” (2022 Edition) []. Subsequently, through cross-validation between the “China Biodiversity Red List: Vertebrates (2020)” [] and the IUCN Red List [], we identified 26 nationally first-class protected avian species within CYUA that possess both legal protection status and scientific assessment rarity, serving as research subjects (Table 1). Finally, 2082 spatial occurrence records of rare avian species were collected.

Table 1.
Information and taxonomic data of avian.
26 avian species spanning 7 taxonomic orders and 11 families were incorporated into the MaxEnt model for predicting potential species distributions. According to distinct ecological habits and behavioral preferences, avian species were categorized into six ecological groups: songbirds, shorebirds, waterbirds, scansorial birds, terrestrial birds, and raptors. To guarantee model precision and reduce spatial deviation, a single occurrence point was retained within each 30 m × 30 m grid cell for congeneric ecological groups, resulting in a final dataset of 657 avian occurrence points for this study.
The raster data used in this study include land cover, population, precipitation levels, evapotranspiration rates, soil, bedrock depth measurements, bioclimatic variables, Digital Elevation Model (DEM), and Normalized Difference Vegetation Index (NDVI). Vector data, including road networks, species distribution records, and administrative boundaries. All datasets were unified to the WGS_1984_Albers coordinate system, with raster data resampled to 30 m spatial resolution to ensure data consistency (Table 2).
Table 2.
Data sources and properties.
2.3. Methods
The research framework follows three critical steps: (1) Integrating MaxEnt and InVEST models to identify Ess and applying circuit theory to simulate ecological flow paths and construct ESP for plateau urban agglomerations. (2) Designing and simulating two optimization scenarios (barrier repair and stepping stone addition) based on the constructed EN for quantitative assessment of connectivity and robustness enhancements, enabling identification of optimal spatial configuration strategies. (3) Quantifying contributions of ecological nodes to network robustness via node-attack simulations and determining conservation and restoration priorities, culminating in a collaborative optimization strategy framework for ESP. The technical framework is shown in Figure 2.
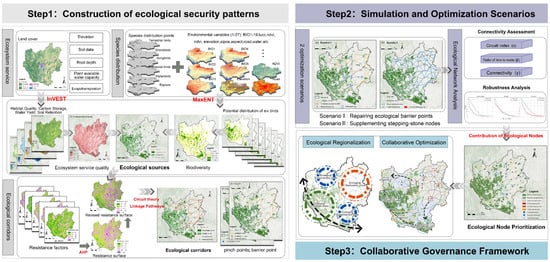
Figure 2.
Research framework.
2.3.1. ESs Identification Based on MaxEnt and InVEST Models
ESs serve as crucial zones for providing ecosystem services and sustaining biodiversity. The identification of ESs constitutes a critical foundation for EN construction. Extending the ES concept from landscape-scale to species-scale patterns, this research incorporated species–landscape interactions at the patch level and, combined with key species distribution data, provides a more precise basis for identifying ESs.
Habitat suitability probabilities for key indicator species were derived using MaxEnt modeling. The workflow comprised the following parts: (1) constructing training sets with 75% of avian indicator species occurrence records, while reserving 25% for independent validation; (2) parameterizing models with Logistic output format and default settings; (3) executing optimization across 104 cycles; and (4) ensuring model robustness through 10-replicate cross-validation. This workflow guarantees stable predictions of species distribution. Model predictive performance was assessed via the Receiver Operating Characteristic (ROC) curve and Area Under the Curve (AUC). AUC values exhibited significant positive correlations with the explanatory capacity of climatic variables, with high AUC characterizing models with excellent discriminative capacity for species distribution patterns []. To address the interspecific heterogeneity in avian ecological requirements, this study decomposed shared niche demands through functional trait-based grouping of bird species. We developed 27 explanatory variables encompassing climate (e.g., BioClim variables), habitat attributes (NDVI, Elevation), and anthropogenic pressures (Population, Road density). Multicollinearity among environmental variables and low-importance covariates may affect the accuracy of the model. Consequently, Jackknife testing was implemented by loading all variables into MaxEnt and removing those with zero permutation importance to prevent overfitting caused by variable autocorrelation []. Pearson correlation analysis was applied to the remaining variables, retaining covariates with higher permutation importance where |r| > 0.8.
Ecosystem services are important indicators that represent the functional importance of an ecosystem []. In assessing the comprehensive level of ecosystem services in the CYUA, four indicators were selected: habitat quality, carbon storage, water yield, and soil retention. The primary basis for their selection lies in the natural context of the CYUA and existing relevant research [,,]. These four indicators systematically encompass key ecological dimensions, including biodiversity conservation, climate change response, water supply, and soil security maintenance. Based on the InVEST model, this study quantified and assessed four ecosystem services. Subsequently, given that these four services collectively form the foundation for regional ecological security and human well-being, and considering their synergistic and non-substitutable nature, an equal-weight assignment was applied to integrate the assessment indicators through spatially weighted overlay analysis. This process ultimately generated a spatial distribution map representing the comprehensive level of ecosystem services across the CYUA. The detailed calculation method was delineated in Table 3 [].
Table 3.
Formulas and models for simulating ecosystem services.
Our objective is to identify areas that are not only highly suitable for the survival of key species but also capable of delivering high-level ecosystem services, thereby qualifying as ESs. This approach requires both indicators to simultaneously achieve high values in order to elevate the composite habitat suitability score. Accordingly, we applied an equal-weight multiplicative method to integrate the two indicators and derive the habitat suitability index. The resulting composite suitability values were then normalized to a uniform [0, 1] range. Ultimately, the habitat was then classified into four suitability zones: low (0–0.25), medium (0.25–0.5), relatively high (0.5–0.75), and high (0.75–1.0). Ecological patches with a suitability value greater than 0.5 and an area exceeded an area of 50 km2 were identified as ESs, among which those with high suitability are designated as core ESs.
2.3.2. Identification of Ecological Resistance Surface
Ecological resistance surfaces reflect the facilitation degree of species migration, energy transformation, and information exchange across landscape units, with appropriate resistance surface construction serving as the foundation for extracting ENs. This study developed a comprehensively revised resistance surface through regional landscape features, human disturbance, habitat quality, and avian-specific habitat demands. Five fundamental resistance factors capturing natural attributes and human disturbances were selected: land use type, elevation, slope, NDVI, and distances to roads. The selections of these factors were based on existing studies [,,] and considerations of natural environmental characteristics in the CYUA area and ecological requirements of species. Among these factors, changes in land use type significantly influence the spatial configuration of ECs []. Areas with high vegetation coverage, such as woodlands, shrublands, and grasslands [], generally provide food and shelter for species migration and thereby facilitate corridor expansion. Elevation and slope affect the energetic costs of species movement; the inclusion of these two factors aligns with the complex topographic characteristics in CYUA []. Furthermore, distances to roads impede the reproduction and dispersal of flora and fauna, which reflect the impacts of human activities on ecological processes in the context of urbanization. The integration of multiple resistance factors represents the conditions that affect biological movement in the study area, thereby enhancing the practical relevance and applicability. With reference to empirical studies on ecological resistance surface construction [,], the resistance values of each factor were classified into five tiers using ArcGIS 10.8. Subsequently, the Analytical Hierarchy Process (AHP) was employed to assign weights to each factor, and a baseline resistance surface was generated through spatial overlay integration (Table 4). Ultimately, this base resistance surface was revised using environmental factor contribution values derived from avian distribution models.
Table 4.
Resistance coefficient values for ecological resistance surface factors.
2.3.3. Extraction of ECs and Critical Nodes
Employing the Linkage Mapper toolbox, we imported the integrated ecological resistance surface data to extract least-cost paths for species migration and energy flow among ESs in the CYUA designated as ECs. The calculation formula for least-cost paths is as follows:
The denotes the Normalized Least-Cost Corridor connecting source areas A and B; denote the Cost-Weighted Distances from the search window to source A and source B, respectively; denotes the Least-Cost Distance, which is the cumulative cost-weighted distance along the optimal (least-cost) path connecting source areas A and B.
Critical nodes are important regions that actively regulate or enhance ecological processes, functioning as a junction for connectivity between ES. In this study, identified barrier points and pinch points were classified as critical nodes, which conservation and restoration can effectively maintain ecological processes and optimize regional ecosystem functionality.
Ecological pinch points are critical zones defined through circuit theory that sustain connectivity in ENs, representing areas with high current density along ECs. Higher current density values directly correlate with increased species migration probability, which plays an irreplaceable role in preserving landscape connectivity across protected areas. This study employed the Pinch point Mapper module within the Linkage Mapper toolbox to identify regions with high current density concentration.
Ecological barrier points refer to potential areas where restoration could significantly improve connectivity in ENs, representing the regions that hinder species movement between protected areas within wildlife corridors—conventionally identified by calculating cumulative current recovery values. This study employed the Barrier Mapper module in Linkage Mapper to identify these barriers by calculating cumulative current recovery values.
2.3.4. Scenarios Setting for Simulating and Optimizing the ESP
Based on the identification results of critical nodes, we set up two optimization scenarios: barrier points restoration and stepping-stone augmentation to address structural deficiencies in connectivity and stability of current urban ENs, providing scientific references for optimizing ESPs.
Scenario I: Repairing ecological barrier points to enhance corridor connectivity for EN optimization. Corridors with more than one barrier point area or corridors below average length and one obstacle point area were classified as unconnected corridors. Targeted repair of barrier points reconnects these corridors, resolving disconnection in the EN.
Scenario II: Supplementing stepping-stone nodes to enhance connectivity in protected area networks. Based on criteria including forest coverage, non-urbanized land, pinch point locations, and ecosystem service values > 0.75 to select discrete patches as stepping stones. These patches act as ecological intermediate stations, increasing ecological node density and strengthening corridor connectivity, thereby optimizing the network structure.
2.3.5. Assement of Optimized ENs Characteristics
- (1)
- Assessment of ENs connectivity
Employing three topological metrics: circuit closure (α), node-edge ratio (β), and network connectivity (γ) to measure the complexity and ecological efficacy of protected area networks before and after optimization. The α-index characterizes the degree of closed loops in the network, the β-index denotes the average number of connections per ES, reflecting structural complexity, and the γ-index represents the extent to which all sources are interconnected [,].
where l is the number of corridors, and v is the number of connection points.
- (2)
- Robustness evaluation of ENs
EN’s robustness reflects the ability of the network to maintain normal functioning after node or edge disruption, with higher robustness indicating stronger resistance and stability. Network efficiency serves as a critical metric for assessing the resilience of an EN, quantifying the capacity to sustain material-energy flow under external disturbances, with higher values indicating superior operational efficacy. We utilize network efficiency as an indicator for assessing EN robustness. A Python 3.8-based platform was used to test network robustness through both targeted attacks and random attacks. The formula for calculating network efficiency is as follows:
The E denotes the network efficiency, with a value range of [0, 1]; n represents the number of connection points; signifies the distance between nodes i and j.
- (3)
- Priority Assessment of Ecological Nodes
Ecological nodes refer to areas possessing critical ecological functions and particular structures, which play an essential role in maintaining the stability and connectivity of ENs. A greater reduction in network efficiency following an attack on an ecological node indicates higher node importance, thereby meaning its priority of conservation or rehabilitation. Based on assessing ENs’ robustness, we rank the priority of ESs, barrier points, and stepping stones by quantifying the network efficiency reduction post-node attack.
3. Results
3.1. Spatial Patterns of ESs
3.1.1. Species Distribution and Response Mechanisms
ROC testing indicates that six ecological groups exhibited an average AUC of 0.94 (range: 0.902–0.972), demonstrating high predictive accuracy of the model (Figure 3). As shown in Figure 4, for all species, the top five mean contributions of environmental variables predicted by the model were Road, Bio7, Land Cover, Bio14, and POP, with individual contribution rates of 23.21%, 21.03%, 13.26%, 8.70%, and 8.21%, respectively. The above five factors were considered as the primary drivers, collectively accounting for 74.43% of the variation. In contrast, Temperature Seasonality (Bio4) and Elevation had the lowest contributions of 0.62% and 0.58%, respectively, indicating that they had the minimal influence on key bird habitat suitability.
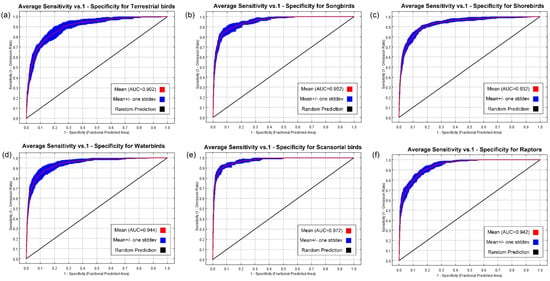
Figure 3.
ROC test for species distribution models of (a) Terrestrial birds; (b) Songbirds; (c) Shorebirds; (d) Waterbirds; (e) Scansorial birds; (f) Raptors.
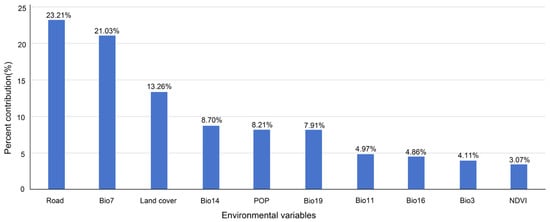
Figure 4.
Average contribution of each environmental factor.
Spatial distribution patterns reveal the following:
- Terrestrial birds exhibit the most considerable hotspot extent, concentrated within the Yuanjiang EC in the western part of CYUA and nature reserves in Chuxiong.
- Raptors, shorebirds, and waterbirds exhibit comparable spatial patterns, mainly distributed across urban built-up areas in Kunming and Mengzi in the northern part of Honghe, with some suitable habitat spillover into Forested mountainous zones in CYUA’s eastern, northern, and northwestern parts.
- Scansorial birds exhibit dispersed habitat suitability patterns in forested mountainous areas across central, western, and southern regions of CYUA.
- Songbirds demonstrate homogeneous suitable habitat distribution concentrated in Kunming, Songming, Chuxiong, and Mengzi urban built-up areas.
Integrating habitat suitability results of six bird groups, we applied Jenks’ natural breaks to reclassify the model outputs, generating the spatial distribution map of key avian suitability regions in CYUA (Figure 5). The suitability distribution results show that the highly suitable area for key birds covers 4142.16 km2, accounting for 3.71% of the total area, and is concentrated in the central, western, and southern parts of the CYUA. The land cover types of these habitats include forest land, grassland, and cultivated land, with lower elevations. The suitable areas exhibit a strong spatial aggregation pattern, with the highly suitable areas forming two hotspot regions center on Chuxiong and Mengzi, gradually spreading toward the urban peripheries.
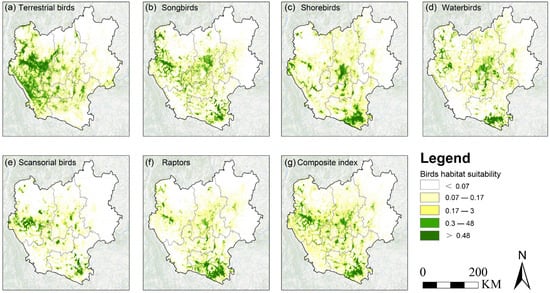
Figure 5.
Potential geographical distribution of (a) Terrestrial birds; (b) Songbirds; (c) Shorebirds; (d) Waterbirds; (e) Scansorial birds; (f) Raptors; (g) Composite index.
3.1.2. Ecosystem Service
Quantitative results of habitat quality, carbon sequestration storage, water Yield, and soil retention from the InVEST model were subjected to spatial weighted overlay analysis. The spatial distribution pattern of the comprehensive ecosystem service level in the CYUA was obtained through Jenks’ natural breaks for spatial reclassification (Figure 6). The results show that the average value of ecosystem service is 0.544, demonstrating robust regional provision but with considerable moderate-capacity zones. Highly ecosystem service areas concentrate in the eastern, southern, and southwestern peripheries. Relatively high areas exhibit extensive dispersion within forest ecosystems, while medium and low level areas concentrate in topographically fragmented eastern regions with high cultivated land concentration.
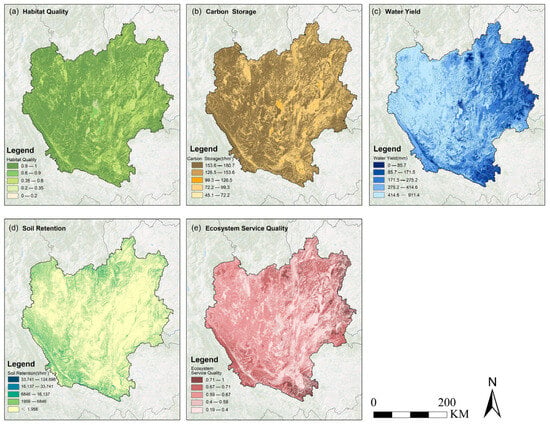
Figure 6.
Spatial distributions of (a) Habitat Quality; (b) Carbon Storage; (c) Water Yield; (d) Soil Retention; (e) Ecosystem Service Quality.
To evaluate the model’s rationality, we compared the InVEST model’s quantitative outputs with findings from the CYUA and existing studies in similar regions regarding spatial distribution patterns [,,]. The comparison reveals that previous studies reported similarly high ecosystem service values in analogous areas, and the observed spatial heterogeneity patterns broadly align with our results.
3.1.3. Spatial Distribution of ESs in CYUA
Spatial integration of vector data acquired from MaxENT and InVEST models identified 48 ecological sources, with an average size of 550.21 km2. They range from a minimum of 50.18 km2 to a maximum of 14,324.48 km2 and cumulatively cover 26,410.48 km2 (23.71% of the study area) (Figure 7). The spatial pattern of ESs demonstrates a southwest-northeast density gradient, primarily concentrated in southern Chuxiong, northern Honghe, central Kunming, and western Yuxi. The composition of these ESs is dominated by grassland and shrubland, supplemented by natural ecological elements such as forests and water bodies (Table 5).
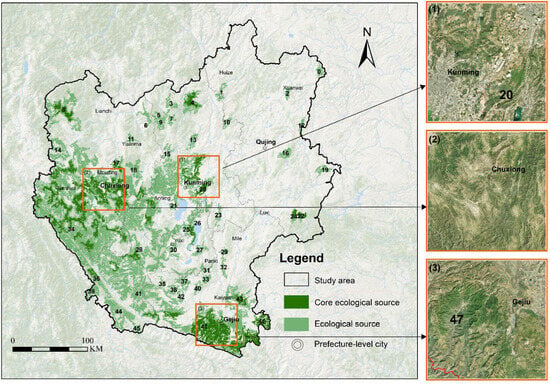
Figure 7.
ESs identification results.
Table 5.
Area and proportion statistics of land use types in ESs.
3.2. Construction of ESPs
3.2.1. Ecological Resistance Surface and Corridors
Low ecological resistance value concentrates in western forest-grassland regions with low-altitude planar landscapes, sparse road networks, and minimal anthropogenic disturbance, providing optimal habitats for key species. Contrastingly, high resistance areas occur in rapidly urbanizing eastern Kunming and Qujing, where the core urban zone of Kunming exhibits the highest population density and road network intensity, consequently registering peak ecological resistance values (Figure 8).
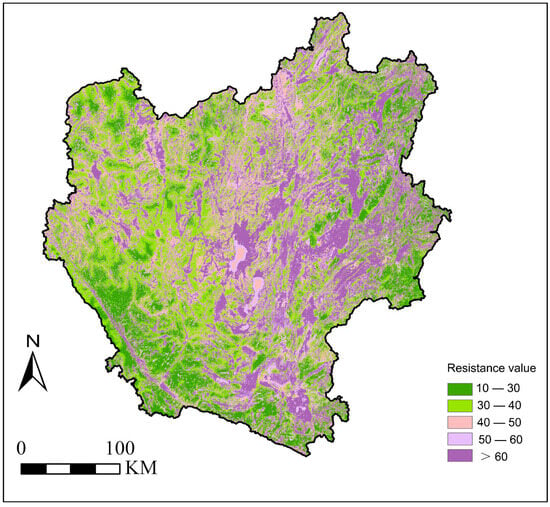
Figure 8.
Comprehensive ecological resistance surface.
Within CYUA, 115 ECs were identified, totalling 2670.02 km, with maximum and mean lengths of 132.03 km and 23.22 km, respectively (Figure 9). The southwestern region, with high species richness and significant ESs, features short, densely clustered corridors. Contrastingly, eastern areas with fewer ESs display longer east–west-oriented corridors. Northern regions demonstrate denser corridor networks and closer connectivity compared to the east, attributable to small-sized ESs functioning as stepping stones, effectively reducing migration costs while enhancing inter-source connectivity.
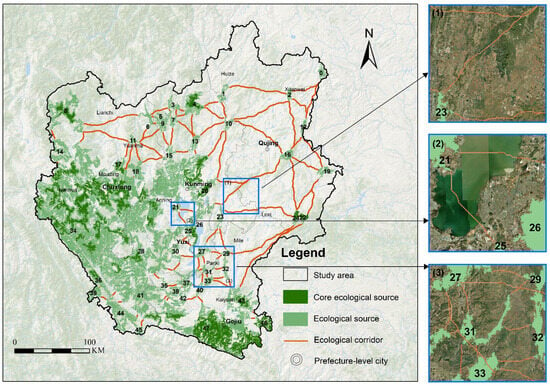
Figure 9.
ECs identification results.
3.2.2. Critical Nodes
This study identified 82 critical nodes, including 43 ecological pinch points (Figure 10b) and 39 ecological barrier points (Figure 10d). Spatially, the pinch points demonstrate a southeastern aggregation and northwestern dispersion pattern, forming high-density clusters within Kunming, Qujing, and Yuxi. Barrier points are primarily distributed in highly urbanized zones such as northern Kunming-Chuxiong, southern Qujing, and eastern Yuxi, reflecting constraints on ecological connectivity imposed by high-intensity urbanization.
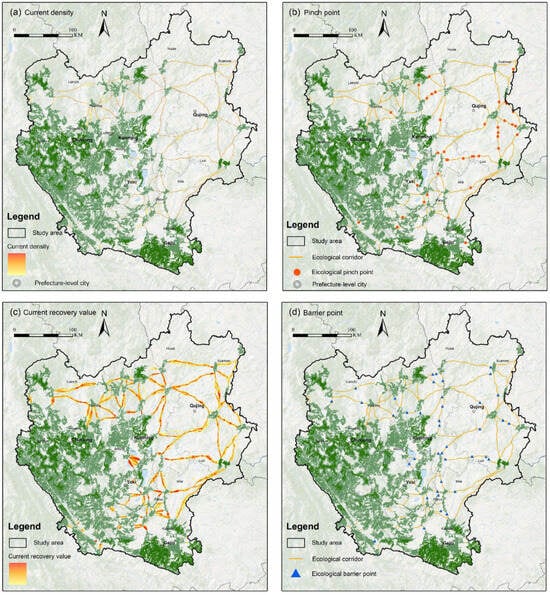
Figure 10.
Identification of ecological nodes (a) current density, (b) pinch point, (c) current recovery value and (d) barrier point.
3.3. Simulation and Optimization Scenarios of ESP
3.3.1. Evaluation of EN Characteristics
- (1)
- Assessment of ecological network connectivity
In scenario I, we implemented barrier restoration at 39 sites (total area: 526.55 km2), primarily in Kunming and Qujing, while identifying 23 disconnected corridors (total length: 683.6 km) in the CYUA. In Scenario 2, we added 20 ecological stepping stones (total area: 239.49 km2, mean size: 11.97 km2), which are concentrated in Qujing. After adding the stepping stones, the identified corridor increased to 151, totaling 4219.36 km. Most of the newly added corridors are located northeast of the study area (Figure 11; Table 6).
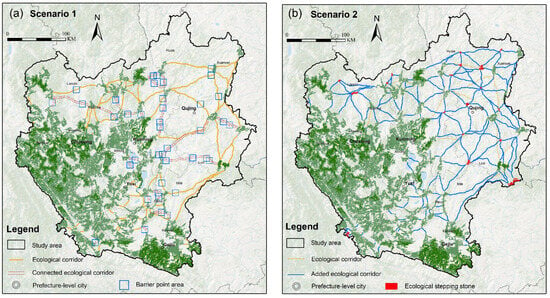
Figure 11.
ENs under two optimization scenarios.
Table 6.
Restoration of ecological barriers and addition of stepping stones across prefectures.
Both optimization scenarios increased EC density and source connectivity while enhancing network structural indices compared to current conditions. In scenario 1, α, β, and γ indices increased by 51.02%, 25.65%, and 23.88%, respectively, with α and γ being the highest among all scenarios, indicating that there are more closed loops in the network and a high degree of connectivity between ESs in this scenario (Table 7).
Table 7.
Structural Indices of ENs under current conditions and two scenarios.
In Scenario Ⅱ, α, β, and γ indices increased by 30.61%, 16.23%, and 13.43%, respectively. The addition of ecological stepping stones substantially improved connectivity, reducing effective dispersal distances and promoting cross-landscape energy flow. Both optimization measures effectively increased circuitry loops and habitat linkages compared to current conditions. This increased topological complexity directly contributed to enhanced ecosystem stability and disturbance resilience.
- (2)
- Evaluation of ecological robustness
EN’s stability was assessed through targeted and random attack strategies. Targeted attacks deliberately remove key nodes identified via topological centrality metrics that maximize disruption to network robustness and energy transfer efficiency. Random attacks stochastically remove spatially distributed nodes, simulating an undirected disturbance with a uniform probability distribution. System resilience was quantified through network efficiency responses to targeted and stochastic attacks. Resilience attributes were quantified through network efficiency responses to targeted and random attacks. Initial efficiency measured 0.360, rising to 0.430 post-barrier restoration (Scenario Ⅰ) and 0.380 post-stepping stone addition (Scenario Ⅱ), demonstrating optimal network robustness and functional performance of Scenario Ⅰ.
Under targeted attacks, the efficiency of the current network plummeted from 0.36 to 0.06 after 10 nodes were removed, with a decelerated decline thereafter. Efficiency approached zero at 30 node removal. In Scenario 1, the network efficiency decreased from 0.43 to 0.16 after 10 nodes were attacked, approaching zero at 42 nodes removed. Scenario 2 showed efficiency dropping from 0.33 to 0.13 at 10 node removal, approaching zero at 60 node removal.
Under random attacks, the efficiency of the current network slowly decreased from 0.36 to 0.23 after 10 nodes were removed. Efficiency approached zero at 35 node removals. In Scenario 1, the network efficiency underwent two sharp drops when the number of attacked nodes reached 7 and 10, respectively, but remained stable above 0.15. In Scenario 2, the network efficiency was maintained above 0.15 when the number of attacked nodes was less than 22, after which it plummeted to 0.07. Efficiency approached zero when the number exceeded 60 (Figure 12).
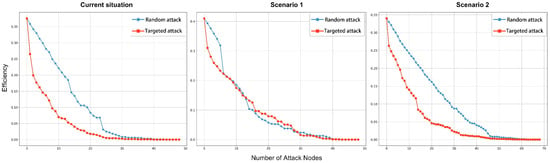
Figure 12.
Robustness of ENs under different scenarios.
Comparative evaluation of the two optimized scenarios against the current EN reveals that Scenario Ⅰ delivers the most substantial improvements. Especially under targeted attacks, the optimized Scenario Ⅰ shows significantly enhanced network connectivity and stability. This approach maintains the potential EN structure while demonstrating better connectivity and stronger disturbance resistance. Although Scenario Ⅱ reduces biological migration paths and achieves higher network structure indices compared to the current network, its robustness remains notably inferior to Scenario Ⅰ, with limited capacity to sustain material and energy flows when subjected to external disturbances.
Moreover, a comparison of the two simulation scenarios reveals that variations in key parameters (e.g., corridor pathways, node locations) exert significant influences on the simulation outcomes. Specifically, Scenario I yields greater improvements in the α, β, and γ indices, indicating that the restoration of node locations is more effective than corridor expansion in optimizing the ecological network. This is because critical ecological nodes are situated directly along key pathways of ecological flows, and alterations to these nodes have more pronounced impacts on the resistance surface. Changes in overall network efficiency further validate the sensitivity of these parameters. Under targeted attacks, Scenario I demonstrates superior network robustness, which suggests that node locations (i.e., repairing critical barriers) contribute more significantly to network stability than incremental adjustments of corridor pathways.
3.3.2. Spatial Priority of Ecological Nodes
Utilizing the decline in network efficiency following node attacks, we prioritized ESs, barrier points, and stepping stones in the ENs, offering scientific guidance for collaborative optimization of ESPs (Figure 13). Spatially, primary ESs (IDs: 30, 31, 32, 33, 35, 36, 47, 49, 54, 57, 67) exhibit a balanced distribution pattern, among which large ESs > 1000 km2 (IDs: 54, 67) are situated in the southwestern region of the CYUA. These large patches, remote from high-density urbanized regions, constitute primary areas for ecological protection. Primary barrier points (IDs: 0, 2, 4, 5, 8, 12, 15, 17, 25) are concentrated in highly urbanized regions of Kunming, Qujing, and northern Chuxiong, whereas those in Yuxi and Honghe demonstrate lower restoration priority. Primary stepping stones (IDs: 2, 5, 11, 13, 15, 19) are predominantly located in Qujing and Kunming, where ESs are sparsely distributed. The addition of stepping stones between sources can significantly improve network efficiency.
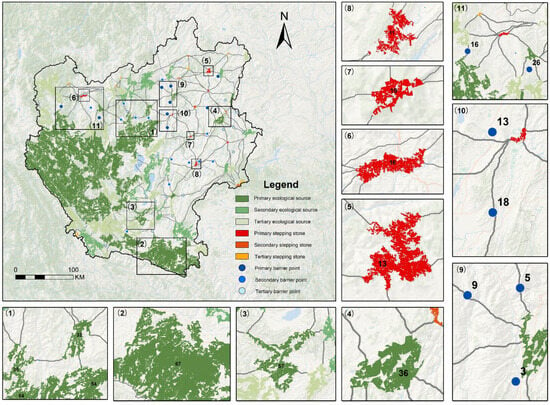
Figure 13.
Spatial distribution of hierarchical ecological nodes.
4. Discussion
4.1. Integrating Species Distribution and Ecosystem Services
Conventional ES identification generally selects protected areas and high-quality habitat zones, or uses MSPA to delineate core patches. These approaches are accessible and costs less computational resources. However, they overlook the ecological requirements of focal species and miss biodiversity hotspots where ecosystem-service scores are only moderate. Taking the single-indicator-based MSPA method for ESs identification as an example (Figure 14), ecologically valuable land categories (foreground) and other land categories (background) were generated from the land cover data. The foreground areas were classified into seven landscape types. Following existing studies [,], forest land and grassland were selected as foreground values, while other land use types were set as background values. Areas with a core zone greater than 50 km2 were extracted as ESs. A total of 66 ecological sources were identified, covering 33,678.0216 km2, accounting for 30.23% of the study area. The primary land cover types within these sources were forest land (66.7%) and grassland (33.3%). Subsequently, a comparative analysis was conducted between the ESs identified using the MSPA-based method and those identified using the integrated-indicator method proposed in this study. The results demonstrate that the ecological sources identified by the comprehensive method exhibit a greater diversity of land cover types, comprising Grass (39.7%), Shrub (38.2%), Forest (18.1%), Cropland (3.6%), and Water (0.4%). By providing diversified habitats, enhancing system stability and resilience, and promoting the efficient operation of ecological processes, this method offers a more comprehensive reflection of the “species-landscape” relationships []. Consequently, the ecological sources identified through this approach are poised to play a more sustainable and central role in safeguarding regional ecological security and conserving biodiversity. Given the diverse ecological environment characteristics and landscape patterns of the CYUA, using only a single indicator to identify ESs is not enough to fully reflect the complex interrelationships between “species and landscape”. Therefore, this research comprehensively considers ecosystem quality, species diversity, and the survival demands of species, and proposes a refined identification method for ESs that combines ecosystem service functions with species distribution. This method enables us to identify areas with unexceptional ecosystem services but high species diversity, and cover numerous important species as ESs for research. We found that Kunming, Chuxiong, and Yuxi are illustrative: despite unremarkable ecosystem-service levels, they sustain rich biodiversity and several key species. Compared to the ecosystem-service-only method, the combined method expands ES coverage and reduces misclassification. Therefore, Incorporating species distribution patterns into ES identification significantly enhances outcome precision, thereby providing a scientific foundation imperative for biodiversity conservation and habitat management strategies.
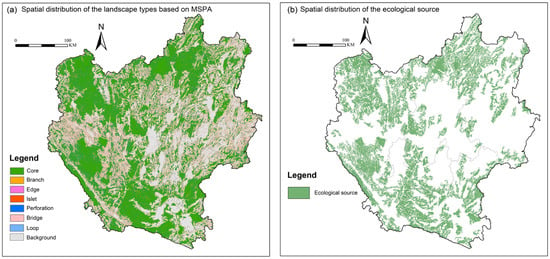
Figure 14.
(a) Spatial distribution of the landscape types based on MSPA; (b) spatial distribution of the ecological source.
4.2. EN Assessment with Node-Attack Simulations
Enhancing the connectivity and stability of ENs is a crucial objective for ecological optimization in urban agglomerations. We quantify these properties using standard network metrics (α, β, γ) and global network efficiency as a robustness proxy. Results reveal an overall declining trend in EN robustness as the number of attacked nodes increases (Figure 11). Targeted attacks on high-significance nodes produces a steeper loss of robustness, highlighting exposing the system’s dependence on critical nodes. In contrast, both optimized ENs maintain higher efficiency during targeted attacks on critical nodes. Consequently, restoring barrier nodes and adding stepping stones positively enhance connectivity robustness. For plateau urban agglomerations, the findings provide implementable guidance for mitigating ecological deterioration and strengthen EN connectivity. Plateau areas face ecological pressures such as ecosystem vulnerability and landscape fragmentation, which leading to the reduction in EN connectivity and biodiversity. ENs assessment improves the precision in priority critical nodes, enabling efficient responses to environmental deterioration. For instance, targeted protection and restoration of critical nodes in the study area enhances network stability while reducing adverse effects from external disruptions. Within the environmental contexts of high-altitude urban areas, the optimized network scenarios significantly decrease species migration distance and movement barriers, ensuring connectivity of ECs and alleviating the negative impacts of high urbanization on ecosystems. This establishes a scientific basis for biodiversity protection and ecosystem restoration. The advantages of enhanced ENs demonstrate pronounced efficacy in plateau urban zones characterized by ecological vulnerability and intense urbanization, safeguarding ecosystem integrity and persistent species viability.
4.3. Collaborative Optimization of ESPs
The CYUA displays a pronounced west–east disparity in ecological resources. The Eastern region (Kunming, Qujing) demonstrates developed economic development but scarce ecological resources, which is regarded as an ecological recipient region. In contrast, western areas (Chuxiong, Yuxi, Honghe) maintain richer ecological resources but a less developed economy, operating as an ecological compensation region. Spatial decoupling of ecological resources and economic development frequently triggers transgression of ecological thresholds in economic clusters through excessive development, thereby initiating cascading ecological risks, including deterioration of ecosystem services and erosion of biodiversity [,]. However, spatial decoupling of ecological resources and economic development carries potential advantages []. Through policy-driven spatial planning, ecological–economic complementary collaboration can be cultivated within the urban agglomeration []. Regions abundant in ecological resources focus on provisioning ecosystem services, including water retention functions and carbon sequestration, whereas economic clusters establish ecological compensation mechanisms to support conservation reciprocally. Therefore, addressing this issue within the broader context of optimized internal collaboration in the urban agglomeration is essential to resolving this contradiction.
Our research establishes a coordinated optimization framework for ESPs, which refines a spatial allocation of ecological resources to form a collaborative network across regional scales, providing a scientific foundation for sustainability and ecosystem safeguarding in urban agglomerations.
Strategy 1: Multi-level optimization strategy based on ecological node priority (Table 8). Despite providing a strategic blueprint for enhancing the stability of global ecological connectivity within the urban agglomeration based on two optimization scenarios: adding stepping stones and restoring barrier points, the proposed stepping stones are concentrated in the economically more developed regions of Kunming and Qujing. Nevertheless, their implementation is constrained by the dual pressures of land scarcity and urbanization. Moreover, the restoration costs for ecological barrier points are generally high, while existing land use configurations present an unavoidable challenge. Furthermore, ESs constitute 23% of the total study area. Implementing comprehensive conservation measures not only strains socioeconomic resources but also constrains urban development. Consequently, node prioritization-based optimization strategies within the urban agglomeration represent a critical approach to balance ecological conservation and urbanization conflicts.
Table 8.
Priority-based multi-level optimization strategies for ecological nodes.
Strategy 2: Diversified Ecological Compensation Mechanism (Figure 15). As the primary ecological recipient region within the CYUA, Kunming and Qujing derive ecosystem services directly or indirectly mediated by the ecological compensation region, functioning as focal regions for ecological barrier remediation and stepping stones deployment. Achieving equilibrium between ecological conservation and economic development necessitates establishing a cross-city ecocompensation mechanism linking the ecological recipient region (Kunming–Qujing) and the ecological compensation region (Chuxiong–Yuxi–Honghe). Primarily, a government-led mechanism should be established to quantify ecocompensation standards based on ecosystem service valuation. Then compensation should be provided to local governments and communities in ESs where development is restricted, aiming to cover basic remand and strengthen the capacity of these regions to deliver ecosystem services. Secondly, for primary ecological nodes within ecological recipient regions where urban development constraints impede conservation and restoration strategies, off-site compensation mechanisms can be implemented to secure ecological protection in alternative zones in exchange for development rights. Furthermore, it facilitates local governments and enterprises in economically advanced regions through technical and financial assistance, fostering green industries and catalyzing the growth of green sectors, including organic agriculture, eco-tourism, and research collaboration. This initiative facilitates the conversion of ecological advantages in compensation zones into industrial benefits, thereby increasing ecological products’ value-added capacity and market competitiveness and further catalyzing private capital engagement in ecological protection and restoration efforts.
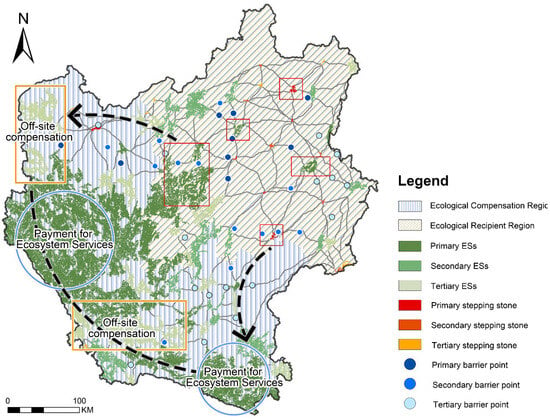
Figure 15.
Diversified ecological compensation mechanism.
Strategy 3: Coordinated Optimization Policy Recommendations for Urban Agglomerations (Figure 16). An eco-network-based optimization framework demarcates three functional zones: conservation areas, restoration corridors, and enhancement clusters. Accurate spatial demarcation of these sectors provides theoretical foundations and actionable guidance for developing urban agglomeration ecological security strategies. Based on this framework, three collaborative policy recommendations are proposed to counter prevailing ecological challenges effectively: (i) Enforcing rigorous ecological spatial governance in urban agglomeration. Strictly delineate ecological conservation redlines based on ecological node assessment results, guaranteeing inviolability of core habitats against urban expansion and guiding industrial transition to relocate outside redline zones. (ii) Deepen cross-administrative regional ecological coordination. Implement a coordinated eco-governance framework across the five municipal prefectures in CYUA, standardize ecological regulation, enhance interregional articulation of ecological planning components, and guarantee integrated spatial governance of ecological redlines and urban growth boundaries via a unified spatial database system. (iii) Guarantee policy implementation, public ecological conservation awareness must be elevated, and community engagement in ecological governance must be catalyzed, thereby securing essential social espousal.
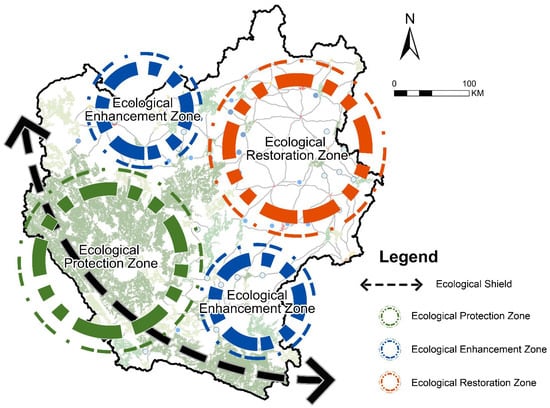
Figure 16.
Ecological optimization zone.
4.4. Limitations and Future Work
In this study, the scenario simulation of the ESP was designed to maximize global ecological benefits. It identifies a “theoretically optimal solution” for the spatial ecological optimization of the CYUA and proposes a collaborative ESP optimization framework based on the simulation results. Nevertheless, translating these findings into actionable plans inevitably involves navigating a series of complex constraints, such as socioeconomic costs, land tenure issues, and policy challenges.
First are the high socioeconomic costs and land opportunity costs. The process of ecological restoration and conservation in urban agglomerations inevitably involves significant economic expenditures. For instance, the identification results of ecological nodes indicate that high-priority ecological obstacle points are primarily located in highly urbanized areas, such as northern Kunming and western Qujing. Ecological restoration in these areas would necessarily entail substantial direct investments, including land expropriation compensation, resident or enterprise relocation and resettlement, soil improvement, and vegetation rehabilitation. Land opportunity cost also represents one of the core challenges in the ecological restoration process. Many of the identified barrier points and potential stepping stones are situated in economically developed regions with strong land development demand, such as the peripheries of the core urban areas of Kunming and Qujing. Allocating these areas for ecological use implies foregoing the substantial economic benefits that could be derived from commercial development, industrial construction, or residential projects. Secondly, there are complex land tenure issues and stakeholder conflicts. Spatially, ecological nodes often span lands with different ownership types. An ideal ecological stepping stone may be jointly owned by multiple households or village collectives, making coordinated and unified ecological management highly challenging. At the same time, ecological conservation objectives may directly conflict with the economic development aspirations of landowners. For example, requiring farmers to engage in ecological protection on their contracted lands instead of cultivating cash crops is challenging to implement without reasonable compensation. Similarly, the restoration of barrier points in urban areas may impact the production and operations of existing enterprises, potentially triggering resistance. Moreover, the implementation of management strategies faces barriers stemming from interdepartmental coordination. The ecological network optimization proposed in this study spans multiple administrative regions. At the same time, existing authority over land use regulation, fiscal budgeting, and project approval is primarily vested in individual municipal and county governments. Establishing effective cross-regional coordination mechanisms, along with cost-sharing and benefit-sharing arrangements, poses a significant challenge in translating management strategies into practice. Furthermore, the inadequate integration of the ecological security pattern with other key planning frameworks—such as the National Economic and Social Development Plan, territorial spatial planning, and transportation planning—may result in the gradual encroachment on ecological land during subsequent development phases.
This study focuses primarily on spatial optimization from an ecological perspective, with limited consideration given to detailed socioeconomic cost assessments and stakeholder analysis. This is mainly due to the considerable challenges in obtaining unified, high-precision data at the regional scale—such as land prices, resettlement costs, and the willingness of different stakeholders to accept compensation. Future research could be advanced in the following directions:
- Integrate land economic valuation into the ESP optimization model by developing multi-objective optimization algorithms that balance ecological benefits and economic costs simultaneously, thereby identifying a cost–benefit optimum.
- Conduct micro-scale case studies focusing on several critical ecological nodes to thoroughly examine land tenure arrangements, stakeholder composition, and their respective interests. The aim is to design concrete and acceptable compensation or co-management schemes that can inform broader regional implementation.
5. Conclusions
Urban agglomerations’ evolution transforms regional relationships from competition to collaboration. Collaborative optimization of ESPs in urban agglomerations is important in achieving mutually economic–ecological enhancement and sustainable agglomeration development. To evaluate the profit of diverse optimization strategies on ESP, we designed two simulated scenarios: Scenario I (barrier points restoration) and Scenario II (stepping stone augmentation). A comparative quantitative assessment of EN characteristics was performed for the current state and two scenarios, and priority rankings for ecological nodes were derived. The results indicate that the ES identification method enables the identification of both high ecosystem service regions and critical habitats supporting key species despite unremarkable ecosystem service levels. Simulation assessment results show that barrier point restoration outperforms stepping stone augmentation globally. We established a collaborative optimization framework for ESPs in CYUA based on node prioritization. The framework develops a collaborative network across a regional scale and provides a scientific basis for mitigating biodiversity decline in plateau urban agglomerations, enhancing ecological resilience, and advancing cross-regional ecological collaborative governance. In ecological security planning, similar approaches can be employed for plateau urban agglomerations with comparable conditions, particularly through collaborative optimization among city clusters. This includes mechanisms for shared ecological compensation, cross-administrative coordination policies, and spatial planning based on node prioritization, all aimed at enhancing overall ecological resilience and sustainable development.
Author Contributions
Conceptualization, Y.S. and W.-L.H.; methodology, Y.S.; software, P.L. and W.-L.H.; validation, Y.S.; formal analysis, Y.S. and W.-L.H.; investigation, W.-L.H.; resources, P.L. and Y.S.; data curation, P.L.; writing—original draft preparation, P.L.; writing—review and editing, Y.S. and W.-L.H.; visualization, P.L.; supervision, Y.S.; project administration, Y.S.; funding acquisition, Y.S. All authors have read and agreed to the published version of the manuscript.
Funding
This research was funded by the National Natural Science Foundation of China (51968064), Yunnan Province High-level Talents Training Support Program (YNWR–CYJS–2020–022), the Science Research Fund Project of the Yunnan Provincial Department of Education (2024Y589), and the First—rate (A) Discipline Landscape Architecture Construction Funding of Yunnan Province, China.
Data Availability Statement
Data will be made available upon request. If you have any questions, please contact the only corresponding author, “Yuhong Song”.
Acknowledgments
We would like to thank the anonymous reviewers for their valuable comments and suggestions for improving this paper.
Conflicts of Interest
The authors declare no conflicts of interest.
Abbreviations
The following abbreviations are used in this manuscript:
| EN | ecological network |
| CYUA | Central Yunnan Urban Agglomeration |
| ES | ecological source |
| EC | ecological corridor |
| ESP | ecological security pattern |
| MCR | Minimum Cumulative Resistance |
| NDVI | The Normalized Difference Vegetation Index |
| AHP | The Analytic Hierarchy Process |
References
- Fang, C.; Yu, D. Urban Agglomeration: An Evolving Concept of an Emerging Phenomenon. Landsc. Urban Plan. 2017, 162, 126–136. [Google Scholar] [CrossRef]
- Jiang, N.; Jiang, W. How Does Regional Integration Policy Affect Urban Resilience? Evidence from Urban Agglomeration in China. Environ. Impact Assess. Rev. 2024, 104, 107298. [Google Scholar] [CrossRef]
- Yu, T.; Jia, S.; Dai, B.; Cui, X. Spatial Configuration and Layout Optimization of the Ecological Networks in a High-Population-Density Urban Agglomeration: A Case Study of the Central Plains Urban Agglomeration. Land 2025, 14, 768. [Google Scholar] [CrossRef]
- Kattel, G.R.; Elkadi, H.; Meikle, H. Developing a Complementary Framework for Urban Ecology. Urban For. Urban Green. 2013, 12, 498–508. [Google Scholar] [CrossRef]
- Peng, J.; Liu, Y.; Wu, J.; Lv, H.; Hu, X. Linking Ecosystem Services and Landscape Patterns to Assess Urban Ecosystem Health: A Case Study in Shenzhen City, China. Landsc. Urban Plan. 2015, 143, 56–68. [Google Scholar] [CrossRef]
- Zhang, T.; Sun, Y.; Zhang, X.; Yin, L.; Zhang, B. Potential Heterogeneity of Urban Ecological Resilience and Urbanization in Multiple Urban Agglomerations from a Landscape Perspective. J. Environ. Manag. 2023, 342, 118129. [Google Scholar] [CrossRef]
- Dong, X.; Wang, F.; Fu, M. Research Progress and Prospects for Constructing Ecological Security Pattern Based on Ecological Network. Ecol. Indic. 2024, 168, 112800. [Google Scholar] [CrossRef]
- Gong, Z.; Liu, W.; Guo, J.; Su, Y.; Gao, Y.; Bu, W.; Ren, J.; Li, C. How to Achieve the Ecological Sustainability Goal of Ecologically Fragile Areas on the Qinghai-Tibet Plateau: A Multi-Scenario Simulation of Lanzhou-Xining Urban Agglomerations. Land 2024, 13, 1730. [Google Scholar] [CrossRef]
- Zhang, X.; Yin, Q.; Zheng, Z.; Sun, S.; Huang, J. Dynamic Changes and Key Drivers of Ecosystem Service Values in Populous Zones on the Tibetan Plateau: A 35-Year Analysis. Ecol. Indic. 2024, 167, 112620. [Google Scholar] [CrossRef]
- Lai, J.; Qi, S. Construction of Ecological Security Pattern Based on Ecological Protection Red Line, Machine Learning Algorithms, and Circuit Theory: A Case Study of Kunming City, China. J. Clean. Prod. 2025, 520, 146117. [Google Scholar] [CrossRef]
- Fan, F.; Liu, Y.; Chen, J.; Dong, J. Scenario-Based Ecological Security Patterns to Indicate Landscape Sustainability: A Case Study on the Qinghai-Tibet Plateau. Landsc. Ecol. 2021, 36, 2175–2188. [Google Scholar] [CrossRef]
- Wang, Z.; Shi, P.; Shi, J.; Zhang, X.; Yao, L. Research on Land Use Pattern and Ecological Risk of Lanzhou–Xining Urban Agglomeration from the Perspective of Terrain Gradient. Land 2023, 12, 996. [Google Scholar] [CrossRef]
- Collinge, S.K. Spatial Arrangement of Habitat Patches and Corridors: Clues from Ecological Field Experiments. Landsc. Urban Plan. 1998, 42, 157–168. [Google Scholar] [CrossRef]
- Vuilleumier, S.; Prélaz-Droux, R. Map of Ecological Networks for Landscape Planning. Landsc. Urban Plan. 2002, 58, 157–170. [Google Scholar] [CrossRef]
- Fu, B.; Liu, Y.; Zhao, W.; Wu, J. The Emerging “Pattern-Process-Service-Sustainability” Paradigm in Landscape Ecology. Landsc. Ecol. 2025, 40, 54. [Google Scholar] [CrossRef]
- Jordán, F. A Reliability-Theory Approach to Corridor Design. Ecol. Model. 2000, 128, 211–220. [Google Scholar] [CrossRef]
- Wang, Y.; Yu, Q.; Avirmed, B.; Zhao, J.; Sun, W.; Liu, Y.; Cui, H.; Khishigjargal, M.; Oyuntuya, S.; Dambadarjaa, N.; et al. The Response of Ecosystem Services to Ecological Spatial Network Patterns in China’s Arid and Semi-Arid Regions. Ecol. Indic. 2025, 172, 113300. [Google Scholar] [CrossRef]
- Yu, K. Security Patterns and Surface Model in Landscape Ecological Planning. Landsc. Urban Plan. 1996, 36, 1–17. [Google Scholar] [CrossRef]
- Zhang, Y.-Z.; Jiang, Z.-Y.; Li, Y.-Y.; Yang, Z.-G.; Wang, X.-H.; Li, X.-B. Construction and Optimization of an Urban Ecological Security Pattern Based on Habitat Quality Assessment and the Minimum Cumulative Resistance Model in Shenzhen City, China. Forests 2021, 12, 847. [Google Scholar] [CrossRef]
- Wang, Y.; Zhang, L.; Song, Y. Study on the Construction of the Ecological Security Pattern of the Lancang River Basin (Yunnan Section) Based on InVEST-MSPA-Circuit Theory. Sustainability 2022, 15, 477. [Google Scholar] [CrossRef]
- Wei, Z.; Dong, B.; Xu, W.; Xu, Z.; Qu, J.; Wang, H.; Han, Y. The Construction of International Wetland Urban Ecological Security Pattern Coupled with MSPA and ESF. Environ. Sci. Pollut. Res. 2024, 31, 61162–61180. [Google Scholar] [CrossRef]
- Zhang, F.; Jia, Y.; Liu, X.; Li, T.; Gao, Q. Application of MSPA-MCR Models to Construct Ecological Security Pattern in the Basin: A Case Study of Dawen River Basin. Ecol. Indic. 2024, 160, 111887. [Google Scholar] [CrossRef]
- Wang, C.; Yu, C.; Chen, T.; Feng, Z.; Hu, Y.; Wu, K. Can the Establishment of Ecological Security Patterns Improve Ecological Protection? An Example of Nanchang, China. Sci. Total Environ. 2020, 740, 140051. [Google Scholar] [CrossRef] [PubMed]
- Wu, S.; Zhao, C.; Yang, L.; Huang, D.; Wu, Y.; Xiao, P. Spatial and Temporal Evolution Analysis of Ecological Security Pattern in Hubei Province Based on Ecosystem Service Supply and Demand Analysis. Ecol. Indic. 2024, 162, 112051. [Google Scholar] [CrossRef]
- Huang, G.; Hu, W.; Du, J.; Jia, Y.; Zhou, Z.; Lei, G.; Saintilan, N.; Wen, L.; Wang, Y. Identification and Scenario-Based Optimization of Ecological Corridor Networks for Waterbirds in Typical Coastal Wetlands. Ecol. Indic. 2025, 171, 113147. [Google Scholar] [CrossRef]
- Miquelle, D.G.; Rozhnov, V.V.; Ermoshin, V.; Murzin, A.A.; Nikolaev, I.G.; Hernandez-Blanco, J.A.; Naidenko, S.V. Identifying Ecological Corridors for Amur Tigers (Panthera Tigris Altaica) and Amur Leopards (Panthera Pardus Orientalis). Integr. Zool. 2015, 10, 389–402. [Google Scholar] [CrossRef]
- Correa Ayram, C.A.; Mendoza, M.E.; Etter, A.; Salicrup, D.R.P. Habitat Connectivity in Biodiversity Conservation: A Review of Recent Studies and Applications. Prog. Phys. Geogr. Earth Environ. 2016, 40, 7–37. [Google Scholar] [CrossRef]
- Rouget, M.; Cowling, R.M.; Lombard, A.T.; Knight, A.T.; Kerley, G.I.H. Designing Large-Scale Conservation Corridors for Pattern and Process. Conserv. Biol. 2006, 20, 549–561. [Google Scholar] [CrossRef]
- Van Der Windt, H.J.; Swart, J.A.A. Ecological Corridors, Connecting Science and Politics: The Case of the Green River in the Netherlands. J. Appl. Ecol. 2008, 45, 124–132. [Google Scholar] [CrossRef]
- Luo, L.; Yang, C.; Chen, R.; Liu, W. Comprehensive Land Consolidation Zoning Based on Minimum Cumulative Resistance Model—A Case Study of Chongqing, Southwest China. Land 2023, 12, 1935. [Google Scholar] [CrossRef]
- Wei, H.; Zhu, H.; Chen, J.; Jiao, H.; Li, P.; Xiong, L. Construction and Optimization of Ecological Security Pattern in the Loess Plateau of China Based on the Minimum Cumulative Resistance (MCR) Model. Remote Sens. 2022, 14, 5906. [Google Scholar] [CrossRef]
- An, Y.; Liu, S.; Sun, Y.; Shi, F.; Beazley, R. Construction and Optimization of an Ecological Network Based on Morphological Spatial Pattern Analysis and Circuit Theory. Landsc. Ecol. 2021, 36, 2059–2076. [Google Scholar] [CrossRef]
- Sun, D.; Wu, X.; Wen, H.; Ma, X.; Zhang, F.; Ji, Q.; Zhang, J. Ecological Security Pattern Based on XGBoost-MCR Model: A Case Study of the Three Gorges Reservoir Region. J. Clean. Prod. 2024, 470, 143252. [Google Scholar] [CrossRef]
- Li, X.; Zhu, G.; Sun, J.; Wu, L.; Peng, Y. Research on the Coordination of Transportation Network and Ecological Corridors Based on Maxent Model and Circuit Theory in the Giant Panda National Park, China. Land 2025, 14, 1465. [Google Scholar] [CrossRef]
- Grafius, D.R.; Corstanje, R.; Siriwardena, G.M.; Plummer, K.E.; Harris, J.A. A Bird’s Eye View: Using Circuit Theory to Study Urban Landscape Connectivity for Birds. Landsc. Ecol. 2017, 32, 1771–1787. [Google Scholar] [CrossRef]
- Peng, J.; Yang, Y.; Liu, Y.; Hu, Y.; Du, Y.; Meersmans, J.; Qiu, S. Linking Ecosystem Services and Circuit Theory to Identify Ecological Security Patterns. Sci. Total Environ. 2018, 644, 781–790. [Google Scholar] [CrossRef]
- Hou, Y.; Liu, Y.; Wu, Z.; Zeng, H. Construction of Regional Multi-Scenario Spatially Balanced Ecological Security Pattern Based on Self-Organizing Feature Map: A Case Study of Guangzhou, China. Ecol. Inform. 2024, 82, 102690. [Google Scholar] [CrossRef]
- Peng, J.; Xu, D.; Tang, H.; Jiang, H.; Dong, J.; Wu, J. A Landscape Ecological Approach to Spatial Conservation Planning—Ecological Security Pattern. Trends Ecol. Evol. 2025, 40, 1010–1022. [Google Scholar] [CrossRef]
- Pan, Y.; Tian, Y.; Wu, Y.; Fu, M. A Comprehensive Approach for the Spatial Optimization of the Biodiversity Conservation Network in the Qinling Mountains, China. Landsc. Ecol. 2025, 40, 11. [Google Scholar] [CrossRef]
- Men, D.; Pan, J. Integrating Key Species Distribution and Ecosystem Service Flows to Build Directed Ecological Network: Evidence from the Shiyang River Basin, China. J. Environ. Manag. 2025, 381, 125183. [Google Scholar] [CrossRef]
- Peng, W.; Yang, J.; Wagner, F.; Mauzerall, D.L. Substantial Air Quality and Climate Co-Benefits Achievable Now with Sectoral Mitigation Strategies in China. Sci. Total Environ. 2017, 598, 1076–1084. [Google Scholar] [CrossRef]
- Zhang, W.; Liu, G.; Gonella, F.; Xu, L.; Yang, Z. Research on Collaborative Management and Optimization of Ecological Risks in Urban Agglomeration. J. Clean. Prod. 2022, 372, 133735. [Google Scholar] [CrossRef]
- Zhang, W.; Liu, G.; Yang, Z. Urban Agglomeration Ecological Risk Transfer Model Based on Bayesian and Ecological Network. Resour. Conserv. Recycl. 2020, 161, 105006. [Google Scholar] [CrossRef]
- Ran, Y.; Lei, D.; Li, J.; Gao, L.; Mo, J.; Liu, X. Identification of Crucial Areas of Territorial Ecological Restoration Based on Ecological Security Pattern: A Case Study of the Central Yunnan Urban Agglomeration, China. Ecol. Indic. 2022, 143, 109318. [Google Scholar] [CrossRef]
- Ouyang, X.; Xu, J.; Li, J.; Wei, X.; Li, Y. Land Space Optimization of Urban-Agriculture-Ecological Functions in the Changsha-Zhuzhou-Xiangtan Urban Agglomeration, China. Land Use Policy 2022, 117, 106112. [Google Scholar] [CrossRef]
- Duggan, I.C. Urban Planning Provides Potential for Lake Restoration through Catchment Re-Vegetation. Urban For. Urban Green. 2012, 11, 95–99. [Google Scholar] [CrossRef]
- Cai, A.; Wang, J.; MacLachlan, I.; Zhu, L. Modeling the Trade-Offs between Urban Development and Ecological Process Based on Landscape Multi-Functionality and Regional Ecological Networks. J. Environ. Plan. Manag. 2020, 63, 2357–2379. [Google Scholar] [CrossRef]
- Wang, J.; Bai, Y.; Huang, Z.; Ashraf, A.; Ali, M.; Fang, Z.; Lu, X. Identifying Ecological Security Patterns to Prioritize Conservation and restoration: A Case Study in Xishuangbanna Tropical Region, China. J. Clean. Prod. 2024, 444, 141222. [Google Scholar] [CrossRef]
- Shen, Z.; Yin, H.; Kong, F.; Wu, W.; Sun, H.; Su, J.; Tian, S. Enhancing Ecological Network Establishment with Explicit Species Information and Spatially Coordinated Optimization for Supporting Urban Landscape Planning and Management. Landsc. Urban Plan. 2024, 248, 105079. [Google Scholar] [CrossRef]
- Wu, Q.; Cao, Y.; Zhang, Y.; Su, D.; Fang, X. Linking Ecosystem Services Trade-Offs, Human Preferences and Future Scenario Simulations to Ecological Security Patterns: A Novel Methodology for Reconciling Conflicting Ecological Functions. Appl. Geogr. 2025, 176, 103534. [Google Scholar] [CrossRef]
- Hsu, W.-L.; Zhuang, Z.; Li, C.; Zhao, J. Optimization of Land Use Patterns in a Typical Coal Resource-Based City Based on the Ecosystem Service Relationships of ‘Food–Carbon–Recreation’. Land 2025, 14, 661. [Google Scholar] [CrossRef]
- Deng, R.; Ding, X.; Wang, J. Landscape Ecological Risk Assessment and Spatial Pattern Evolution Analysis of the Central Yunnan Urban Agglomeration from 1995 to 2020 Based on Land Use/Cover Change. Sustainability 2023, 15, 16641. [Google Scholar] [CrossRef]
- State Forestry and Grassland Administration, Ministry of Agriculture and Rural Affairs. National List of Key Protected Wild Animals; 2021 ed.; State Forestry and Grassland Administration: Beijing, China, 2021. Available online: https://www.forestry.gov.cn/c/www/gkzfwj/272561.jhtml (accessed on 20 May 2025).
- Ministry of Ecology and Environment, Chinese Academy of Sciences. China Biodiversity Red List: Vertebrates; 2020 ed.; Ministry of Ecology and Environment: Beijing, China, 2020. Available online: https://www.mee.gov.cn/xxgk2018/xxgk/xxgk01/202305/t20230522_1030745.html (accessed on 20 May 2025).
- International Union for Conservation of Nature. Ursus Maritimus. The IUCN Red List of Threatened Species2020. 2020. Available online: https://marine.gov.scot/sma/content/iucn-red-list-threatened-species-version-2020-2 (accessed on 20 May 2025).
- Gumbs, R.; Gray, C.L.; Hoffmann, M.; Molina-Venegas, R.; Owen, N.R.; Pollock, L.J. Conserving Avian Evolutionary History Can Effectively Safeguard Future Benefits for People. Sci. Adv. 2023, 9, eadh4686. [Google Scholar] [CrossRef] [PubMed]
- Austin, M. Species Distribution Models and Ecological Theory: A Critical Assessment and Some Possible New Approaches. Ecol. Model. 2007, 200, 1–19. [Google Scholar] [CrossRef]
- Ferraro, K.M.; Ferraro, A.L.; Lundgren, E.; Sommer, N.R. The Use and Abuse of Ecosystem Service Concepts and Terms. Biol. Conserv. 2025, 308, 111218. [Google Scholar] [CrossRef]
- Jin, L.; Xu, Q.; Yi, J.; Zhong, X. Integrating CVOR-GWLR-Circuit Model into Construction of Ecological Security Pattern in Yunnan Province, China. Environ. Sci. Pollut. Res. 2022, 29, 81520–81545. [Google Scholar] [CrossRef]
- Li, W.; Kang, J.; Wang, Y. Integrating Ecosystem Services Supply-Demand Balance into Landscape Ecological Risk and Its Driving Forces Assessment in Southwest China. J. Clean. Prod. 2024, 475, 143671. [Google Scholar] [CrossRef]
- Wang, R.; Bai, Y.; Huang, Z.; Fang, Z.; Alatalo, J.M.; Tao, L.; Guo, G. Drought Exacerbates the Trade-Offs and Distributional Imbalances of Regional Ecosystem Services: A Case Study in Yunnan Province, China. Reg. Environ. Change 2025, 25, 38. [Google Scholar] [CrossRef]
- Zhang, J.; Wang, M.; Liu, K.; Chen, S.; Zhao, Z. Social-Ecological System Sustainability in China from the Perspective of Supply-Demand Balance for Ecosystem Services. J. Clean. Prod. 2025, 497, 145039. [Google Scholar] [CrossRef]
- Lin, Y.; Liu, F.; Ma, Z.; Zhao, J.; Xue, H. Constructing an Ecological Security Pattern Coupled with Climate Change and Ecosystem Service Valuation: A Case Study of Yunnan Province. Sustainability 2025, 17, 9193. [Google Scholar] [CrossRef]
- Tong, A.; Zhou, Y.; Chen, T.; Qu, Z. Constructing an Ecological Spatial Network Optimization Framework from the Pattern–Process–Function Perspective: A Case Study in Wuhan. Remote Sens. 2025, 17, 2548. [Google Scholar] [CrossRef]
- Wei, W.; Zhang, Y.; Wei, X.; Xie, B.; Ma, Z.; Liu, C.; Yu, L.; Zhou, J.; Shi, W.; Liu, T.; et al. Construction and Optimization of Ecological Security Patterns Based on Ecosystem Service Function and Ecosystem Sensitivity in the Important Ecological Functional Area—A Case Study in the Yellow River Basin. Ecol. Eng. 2025, 215, 107609. [Google Scholar] [CrossRef]
- Yue, Z.; Yu, W.; Xu, Y.; Hua, Y.; Tong, X.; Wang, L. Nonlinear Interactions between Fractional Vegetation Coverage and Plant Diversity across Urban Land-Use Types: Insights from the Grand Canal Region. Ecol. Indic. 2025, 179, 114221. [Google Scholar] [CrossRef]
- Yang, C.; Xu, H.; Li, Q.; Wang, X.; Tang, B.; Chen, J.; Tu, W.; Zhang, Y.; Shi, T.; Chen, M.; et al. Global Loss of Mountain Vegetated Landscapes and Its Impact on Biodiversity Conservation. Nat. Commun. 2025, 16, 8971. [Google Scholar] [CrossRef] [PubMed]
- Yang, D.; Gao, Y.; Chen, J.; Li, X.; Li, Z.; Shen, L.; Yang, C. Optimizing Regional Ecological Security Patterns Based on Interpretable Machine Learning Models: A Case Study of Huzhou, Zhejiang Province. J. Environ. Manag. 2025, 393, 126905. [Google Scholar] [CrossRef] [PubMed]
- Jiang, J.; Cai, J.; Peng, R.; Li, P.; Chen, W.; Xia, Y.; Deng, J.; Zhang, Q.; Yu, Z. Establishment and Optimization of Urban Ecological Network Based on Ecological Regulation Services Aiming at Stability and Connectivity. Ecol. Indic. 2024, 165, 112217. [Google Scholar] [CrossRef]
- Zhao, Y.; Qian, W.; Liu, X.; Wu, C. Assessing and Optimizing the Effectiveness of Protected Areas along China’s Coastal Region: A Social-Ecological Protected Area Network Study. J. Environ. Manag. 2024, 349, 119338. [Google Scholar] [CrossRef]
- Wang, R.; Zhao, J.; Chen, G.; Lin, Y.; Yang, A.; Cheng, J. Coupling PLUS–InVEST Model for Ecosystem Service Research in Yunnan Province, China. Sustainability 2022, 15, 271. [Google Scholar] [CrossRef]
- Sun, L.; Yu, H.; Sun, M.; Wang, Y. Coupled Impacts of Climate and Land Use Changes on Regional Ecosystem Services. J. Environ. Manag. 2023, 326, 116753. [Google Scholar] [CrossRef]
- Liu, L.; Wang, J.; Li, J.; He, S.; Lan, Y.; Liu, F. Evaluation of Ecosystem Service Capacity Using the Integrated Ecosystem Services Index at Optimal Scale in Central Yunnan, China. Ecol. Evol. 2025, 15, e71222. [Google Scholar] [CrossRef]
- Huang, K.; Yuan, Z.; Meng, S.; Pang, Y.; Wang, G.; Liu, S. Adaptive Forest Conservation in Southwest China’s Biodiversity Hotspot: Integrating Spatiotemporal Dynamics. Int. J. Sustain. Dev. World Ecol. 2025, 32, 540–552. [Google Scholar] [CrossRef]
- Wang, Z.; Zhou, R.; Rui, J.; Yu, Y. Revealing the Impact of Urban Spatial Morphology on Land Surface Temperature in Plain and Plateau Cities Using Explainable Machine Learning. Sustain. Cities Soc. 2025, 118, 106046. [Google Scholar] [CrossRef]
- Martínez-Núñez, C.; Martínez-Prentice, R.; García-Navas, V. Land-Use Diversity Predicts Regional Bird Taxonomic and Functional Richness Worldwide. Nat. Commun. 2023, 14, 1320. [Google Scholar] [CrossRef] [PubMed]
- Li, Y.R.; Zhang, X.C.; Cao, Z.; Liu, Z.J.; Lu, Z.; Liu, Y.S. Towards the Progress of Ecological Restoration and Economic Development in China’s Loess Plateau and Strategy for More Sustainable Development. Sci. Total Environ. 2021, 756, 143676. [Google Scholar] [CrossRef] [PubMed]
- Wen, R.; Liu, Z. Exploring Trade-Offs and Synergies between Economy Development and Ecosystem Sustainability of the Eco-Fragile Regions in the Context of Food Security. J. Clean. Prod. 2025, 510, 145604. [Google Scholar] [CrossRef]
- Shen, Q.; Lu, J.; Tutore, I.; Cucari, N.; Guo, Q. How Does Horizontal Ecological Compensation Promote the Coupled Development of Ecological Environment Protection and High-Quality Economy Growth? Evidence from China’s Circular Economy Practices. Socio-Econ. Plan. Sci. 2025, 102, 102320. [Google Scholar] [CrossRef]
- Li, T.; Li, S.; Zhao, Y.; Zheng, H.; Wang, K.; Yi, M. Multi-Objective Decision-Making Considering Future Demands Helps to Delineate Key Areas for Ecological Restoration in Changsha-Zhuzhou-Xiangtan Urban Agglomeration, China. J. Environ. Manag. 2025, 381, 125176. [Google Scholar] [CrossRef]
Disclaimer/Publisher’s Note: The statements, opinions and data contained in all publications are solely those of the individual author(s) and contributor(s) and not of MDPI and/or the editor(s). MDPI and/or the editor(s) disclaim responsibility for any injury to people or property resulting from any ideas, methods, instructions or products referred to in the content. |
© 2025 by the authors. Licensee MDPI, Basel, Switzerland. This article is an open access article distributed under the terms and conditions of the Creative Commons Attribution (CC BY) license (https://creativecommons.org/licenses/by/4.0/).