Abstract
Current Automated Vehicle (AV) technologies still face challenges in operating safely across diverse road environments, as existing infrastructure is not yet fully adapted to AV-specific requirements. While many previous studies have relied on simulations, real-world data is crucial for accurately assessing AV safety and understanding the impact of road characteristics. To address this gap, this study analyzes human-driven vehicle (HDV) crashes and AV failures using machine learning and explainable AI (XAI), providing insights into how road design can be improved to facilitate AV integration into existing infrastructure. Using XGBoost-based frequency modeling, the study achieved accuracy ranging from 0.6389 to 0.9770, depending on the specific model. The findings indicate that road geometry and traffic characteristics play a significant role in road safety, while the impact of road infrastructure varies across different road classifications. In particular, traffic characteristics were identified as key contributors to HDV crashes, whereas road geometry was the most critical factor in AV failures. By leveraging real-world AV failure data, this study overcomes the limitations of simulation-based research, improving the reliability of safety assessments. It provides a comprehensive evaluation of road safety across different road types and traffic flow conditions while simultaneously analyzing HDV crashes and AV failures. The findings offer critical insights into the challenges of mixed-traffic environments, where AVs and HDVs must coexist, highlighting the need for adaptive road design and infrastructure strategies to enhance safety for all road users.
1. Introduction
Recent advancements in artificial intelligence and sensor technology have positioned Automated Vehicles (AVs) as a key technology in future mobility [1]. Human error is a major cause of traffic crashes in conventional human-driven vehicles (HDVs), and autonomous driving technology has been regarded as an innovative solution to mitigate this issue [2].
However, despite these advancements, the current level of AV technology can still lead to driving interruptions or unsafe conditions depending on the design of the road infrastructure. Given that AVs still struggle to safely navigate all types of roads, deploying them without improving existing infrastructure to support safe operation would pose significant challenges [3,4,5]. Therefore, recent studies have focused more on quantitatively analyzing how various road design elements impact safety performance from an AV perspective [3,6,7,8,9,10,11].
Previous studies analyzing the relationship between road design and AV safety have predominantly relied on simulation-based approaches due to safety concerns during experimental procedures [6,7,8]. Only a limited number of studies have utilized real-world data. The findings from these data-driven studies indicate that AV operational data collected from test sites are used to define or refine the Operational Design Domain (ODD) and specify conditions under which AVs can safely operate. Additionally, these studies identify key technical and infrastructural limitations observed during testing and propose corresponding technological improvements to overcome them [9,10,11].
Existing field test-based studies have focused primarily on specific regions or road segments, limiting their ability to comprehensively analyze road hazards and vulnerabilities associated with AV deployment. However, for the successful integration of AVs, it is crucial to examine a wide range of road environments to identify potential vulnerabilities arising from different road design characteristics. In particular, road hierarchy-based analysis is necessary, as road geometry, infrastructure, and facilities vary across national highways, local highways, and special/metropolitan city roads. Identifying AV vulnerabilities based on road hierarchy can provide critical insights into how different road types influence AV performance and safety [3]. Despite this need, current research insufficiently considers policy and operational factors. A more holistic approach incorporating diverse road environments and policy-driven perspectives is essential for a comprehensive understanding of AV deployment challenges. Addressing these gaps will facilitate the development of more robust strategies for AV integration into existing transportation systems.
Enhancing AV safety requires identifying and mitigating potential road hazards. However, given the current adoption rate and development pace of AV technology, implementing road improvements exclusively for AVs poses significant challenges. Therefore, rather than focusing solely on AV-specific risk factors, a more comprehensive approach is required—one that also accounts for hazards affecting HDVs. By analyzing risk factors for both AVs and HDVs, research can contribute to the improvement of overall road safety rather than limiting improvements to AV operations alone. Such an integrated approach would facilitate a more balanced and practical strategy for the enhancement of road infrastructure, ultimately benefiting all road users.
Therefore, this study applies machine learning and explainable AI (XAI) techniques to real-world autonomous driving data to examine the factors influencing the frequency of HDV crashes and AV failures. Through an integrated modeling framework combining XGBoost and SHAP (SHapley Additive exPlanations), this study identifies critical road design and environmental factors that contribute to safety risks in both HDV and AV operations. By systematically categorizing road environments under diverse conditions, this research further investigates the underlying causes of crashes and variations in accident patterns across different road hierarchies. The insights obtained from these analyses form the basis for the methodological framework described in the following section.
The remainder of this paper is organized as follows. Section 2 presents the research methodology, including the XGBoost(eXtreme Gradient Boosting)-based modeling framework and SHAP explainability approach used to evaluate the frequency of HDV crashes and AV failures. Section 3 describes the data sources, variable definitions, and statistical characteristics of both HDV crash and AV failure datasets. Section 4 reports the modeling results and interprets the SHAP outcomes to highlight key safety determinants across different road hierarchies and traffic-flow conditions. Finally, Section 5 concludes the study by summarizing the main findings, implications for adaptive road design, and directions for future research.
2. Methodology
XGBoost (open-source, available at https://xgboost.ai, accessed on 26 October 2025) was utilized to model the frequency of HDV crashes and AV failures based on various road characteristics. Additionally, the SHAP (open source; Available online: https://github.com/shap/shap, accessed on 26 October 2025) method was employed to interpret the contributions of different road factors to these incidents. By integrating these approaches, this study aims to analyze how road elements influence HDV crashes and AV failures differently. Furthermore, a hierarchical road-based analysis was conducted to examine the impact and significance of road elements across different road hierarchies. This approach provides insights into how road design and infrastructure influence AV and HDV safety under varying roadway conditions.
2.1. HDV Crash and AV Failure Frequency Modeling
In this study, the XGBoost algorithm [12] was adopted to model the frequency of HDV crashes and AV failures. XGBoost has been widely recognized for its strong predictive performance and interpretability in structured tabular data across transportation and safety domains [3,13]. The key reasons for its adoption are outlined as follows: (1) it effectively captures nonlinear relationships and complex feature interactions through gradient-boosted decision trees; (2) it is robust to missing or unbalanced data by automatically learning optimal default split directions for missing values; and (3) it provides reliable feature-importance measures, which can be further interpreted using XAI techniques such as SHAP [14]. These strengths are particularly relevant to the present dataset, which contains both ubiquitous variables (e.g., traffic volume, and speed limit) and sparse, location-specific variables such as the existence of bridges, tunnels, or interchanges. For instance, most road links do not contain bridges, resulting in a large number of “absent” entries. Nevertheless, within the subset of bridge-related segments, geometric factors such as curvature, gradient, and lane configuration can exert distinct safety influences. The hierarchical structure of XGBoost allows the model to evaluate such heterogeneous effects without requiring complete data coverage, thereby enabling a more accurate and flexible representation of these contextual road-segment differences. Hence, the method is well-suited to distinguishing how risk factors vary across road hierarchies and vehicle types (HDVs vs. AVs).
To avoid overfitting and to maximize model generalization across different road hierarchies, a random search approach was employed to fine-tune key hyperparameters. Specifically, the search optimized the subsampling rate (), number of estimators (), minimum child weight (), maximum tree depth (), and learning rate (), which respectively represent the percentage of data randomly sampled for each tree, the total number of boosting trees, the minimum sum of instance weights required in a child node, the maximum depth of each tree, and the step-size shrinkage used to prevent overfitting.
The random search process explored the following parameter ranges derived from prior research and empirical testing: , , , , and . Each configuration was evaluated through k-fold cross-validation, and the combination yielding the highest validation accuracy was selected. The chosen parameter ranges were consistent with those used in comparable XGBoost applications for crash-risk modeling [15,16]. The final optimized values for each road hierarchy are summarized in Appendix A (Table A1–Table A3).
To systematically analyze HDV crashes and AV failures across diverse road conditions, this study categorized road environments based on road type and traffic flow. The classification by road type (national highway, local highway, and special and metropolitan city roads) was adopted because each hierarchy exhibits distinct geometric designs, infrastructure characteristics, and operational constraints that influence vehicle safety. Meanwhile, the classification by traffic flow (interrupted flow or uninterrupted Flow) was applied to capture the impact of traffic dynamics on HDV crash occurrence and AV failure rates. By segmenting the analysis in this manner, the study ensures a more precise assessment of how road design and traffic conditions differentially affect HDV crashes and AV failures.
2.2. Model Interpretation
Interpreting the results of machine learning techniques and explaining their underlying logic is a challenging task. XAI is an emerging technology designed to address this issue by providing insights into the reasoning behind AI-driven decisions. In this study, SHAP, an XAI technique, was employed to identify factors influencing modeling results on the frequency of HDV crashes and AV failures. SHAP is a method that utilizes Shapley values from game theory to optimally allocate credit and integrate it with local explanations [13]. It assigns importance scores to each feature in relation to a specific prediction [14].
3. Data Description
This section provides an overview of the datasets and variables used in the analysis. It is structured into two subsections: Section 3.1, which explains the sources and types of data utilized, and Section 3.2, which describes the patterns and characteristics of AV failures observed in real-world driving data to provide contextual understanding of the dataset used for modeling.
3.1. Data Collection
To analyze road geometry, infrastructure, and traffic characteristics, this study utilized multiple national-level data sources to systematically examine their impact on HDV crashes and AV failures. Road geometry and infrastructure data were primarily collected using digital topographic maps and the Digital Road Inventory, which contain detailed information on alignment, curvature, lane configuration, slopes, intersections, bridges, tunnels, and other structural components essential for evaluating roadway characteristics [17]. Traffic characteristic variables, such as average daily traffic, peak-hour volume, and mean travel speed, were obtained from the Korea Transport Database operated by the Korea Transport Institute [18]. These data provide an integrated view of both static and dynamic roadway conditions across multiple road hierarchies.
HDV crash data were obtained from the Traffic Accident Analysis System (TAAS) managed by the Korea Transportation Safety Authority, covering a five-year period from 2017 to 2021 [19]. The TAAS dataset contains only police-verified on-road incidents to ensure reliability and legal accuracy. Each crash record includes geographic coordinates, the accident type (rear-end, side collision, rollover, pedestrian crash, and others), the severity level (property damage, injury, and fatality), vehicle class (passenger car, bus, truck, and motorcycle), weather and lighting conditions, and time of occurrence. These attributes allow the study to capture spatial and temporal variations in crash patterns. The HDV crash data were spatially linked to the Digital Road Inventory using GIS-based node–link matching to ensure that each crash event corresponded to a valid road segment. Duplicate or off-network records were excluded, and the positional accuracy of crash coordinates was verified within ±5 m according to the ISO 19157:2013 standard for Geographic Information—Data Quality [20]. Logical consistency was further validated through confirmation that the recorded crashes occurred on accessible roadway links rather than on off-road or under-construction segments.
Data quality management followed a standardized workflow for completeness, positional accuracy, and logical integrity. Quality indicators such as attribute consistency, coordinate validity, and code accuracy were evaluated following the Ministry of Land, Infrastructure and Transport Digital Road Data Protocol [17]. Missing values were handled differently depending on the data type. Crash data were not interpolated or imputed, as they represent verified discrete events officially reported by law enforcement agencies [19]. However, continuous traffic and environmental variables, including hourly flow and average speed, occasionally contained missing values due to sensor interruptions. For these continuous variables, a temporal mean-trend imputation method based on adjacent time intervals was applied to maintain data continuity without distorting the overall trend distribution [18].
Through this integration process, all datasets were standardized to a unified spatial coordinate system and combined using link-level identifiers. The resulting dataset maintained high completeness, positional accuracy, and logical coherence, enabling robust comparative analysis between HDV crashes and AV failures across diverse road hierarchies and traffic environments.
This study incorporated two independent variables—HDV crashes and AV failures— and selected a total of 19 dependent variables, which were classified into three groups as follows:
Road geometry variables capture the geometric design features of the roadway that influence vehicle maneuverability and safety. Specifically, represents the average longitudinal slope of the road; indicates the minimum curve radius; and denote the maximum and average number of lanes, respectively; and corresponds to the maximum road width. Road infrastructure variables describe the structural and environmental elements of the roadway that contribute to its operational complexity. The , , , , , , , , , , and variables represent the presence of pedestrian roads, bike roads, underpasses, bridges, tunnels, overpasses, interchanges, grade-separated intersections, protection zones, rest areas, and toll gates, respectively. Traffic characteristics variables quantify the dynamic traffic conditions and flow intensity of the roadway environment. denotes the average traffic speed during peak hours, represents the traffic volume during peak hours, and refers to the maximum speed limit.
By structuring the analysis around these variable categories, this study aims to provide a comprehensive understanding of how road design and traffic conditions influence both HDV crashes and AV failures. For further details, please refer to Appendix B, Table A4.
To analyze AV failures under real-world conditions, data were collected using a Tesla Model 3 equipped with the Autopilot (FSD Beta) system (Tesla, Inc., Austin, TX, USA), which relies primarily on camera- and radar-based perception rather than LiDAR. The use of a single vehicle platform ensured consistent data acquisition settings but also introduced limitations related to sensor modality. Because the Tesla system does not employ LiDAR, its detection range and spatial precision are constrained by lighting and weather conditions [21]. Consequently, the results may not be directly generalizable to AVs using LiDAR- or HD map-based navigation [22].
Data collection was conducted across national, local, and metropolitan road hierarchies under clear-weather and daylight conditions to minimize environmental variability. Each route was repeatedly driven at legal speed limits using Autopilot in longitudinal control mode, with human supervision to ensure safety. Driving disengagements were automatically logged whenever the driver intervention indicator was triggered or Autopilot self-deactivated.
Multiple tools were employed to capture kinematic and positional data:
- GPS Tracking: The Ramblr (Ramblr GmbH, Pullach im Isartal, Germany) mobile application recorded vehicle trajectories with an average horizontal accuracy of ±3 m under open-sky conditions.
- Driving Data Recording: The RaceChrono Pro (RaceChrono Oy, Nummela, Finland) application collected real-time data at 1–25 Hz, including vehicle speed, position, and heading.
- Video Observation: A forward-facing dash cam recorded the road scene to verify disengagement events and synchronize visual evidence with telemetry.
AV errors were defined as any instance of system disengagement or abnormal operation during Autopilot use. Errors were detected and logged through two channels: (1) system events, when the vehicle automatically deactivated Autopilot or displayed a driver-takeover warning, and (2) manual interventions, when the safety driver intentionally disengaged Autopilot due to perceived risk. Each event was cross-checked with GPS and video timestamps to ensure temporal consistency. Event types were then classified into five categories based on observed behaviors and previous field studies: (a) lane departure or boundary violation, (b) collision risk warning or avoidance maneuver, (c) sudden stop or low-speed halt, (d) lane-change failure, and (e) miscellaneous sensor or environmental loss cases. Categorization criteria were derived from manual review of dash-cam footage and telemetry correlation, following the approach used by Woo et al. (2024) [3] for real-world AV failure classification.
Although IMU data were not directly integrated, cross-validation between GPS and video timestamps was performed to correct positional drift near tunnels and dense urban canyons. Short signal gaps (<5 s) were linearly interpolated to maintain temporal continuity. The absence of high-precision inertial or LiDAR measurements introduces spatial uncertainty (<5 m) in event localization; however, this resolution is sufficient for the road segment-level analysis adopted in this study. Overall, the Tesla-based experimental framework enabled large-scale collection of real-world AV performance data across diverse road conditions while also highlighting the need for future studies incorporating multi-sensor fusion and LiDAR-equipped platforms to improve measurement precision and result generalizability [3].
The AV data collection covered national highways, local highways, and special/metropolitan city roads across South Korea. The total driving distance recorded in real-world experiments was 36,244 km, distributed as follows: 14,032 km on national highways, 17,018 km on local highways, and 5194 km on special and metropolitan city roads. These data were essential in identifying the impact of different road environments on AV failures and disengagement patterns.
3.2. Statistical Analysis of AV Failures
A statistical analysis of AV failures revealed significant variations in both the frequency and nature of failures across different road hierarchies (Figure 1). AV disengagement represented the largest share of all recorded failures, comprising 57.8% on national highways, 86.5% on local highways, and 77.7% on special and metropolitan city roads. However, the underlying causes and operational contexts differed substantially.
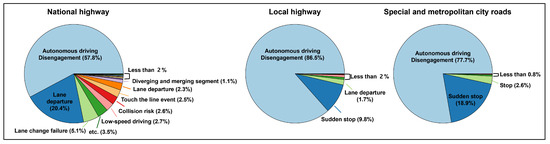
Figure 1.
Causes of autonomous driving failure by road type.
On national highways, failures were diverse and often linked to dynamic interactions at high speed. Lane departure accounted for 20.4%, lane-change failures for 5.1%, collision-risk warnings for 2.6%, and “touch-the-line“ events for 2.5%. These findings indicate that AVs experienced difficulty maintaining lateral stability when encountering abrupt curvature changes, merging zones, or inconsistent lane markings at ≥100 km/h. Because Tesla Autopilot relies on camera- and radar-based sensing rather than LiDAR, the limited perception range and sensitivity to light reflection may have amplified errors in curvature interpretation and edge detection under glare or shadow transitions. These results highlight the importance of sensor fusion and adaptive steering control in enhancing AV robustness in high-speed environments.
On local highways, the dominant failure modes were sudden stops (9.8%) and lane departures (1.7%). These events commonly occurred where traffic density fluctuated or where temporary roadside obstructions caused false detections. The prevalence of sudden stops implies that the Autopilot’s forward object-detection algorithm adopted an overly conservative braking policy when confronted with partial occlusions (e.g., parked vehicles or shadowed roadside objects). This pattern underscores the need for context-aware perception thresholds and better calibration of radar–camera decision fusion for mid-speed traffic.
On special and metropolitan city roads, failures were primarily associated with stop-and-go conditions and pedestrian interactions, with 18.9% classified as sudden stops and 2.6% as unintended stops. These conditions reflect the system’s challenge in urban mixed-traffic environments, where frequent pedestrian crossings, non-standard lane markings, and short inter-signal distances require rapid contextual reasoning. Such observations emphasize that current commercial AV systems are less reliable in congested environments due to limited scene-understanding capabilities and latency in dynamic object tracking.
Overall, these statistical findings reveal that AV failures are not random occurrences but structured responses to varying geometric and operational complexities. Highway scenarios expose limitations in long-range perception and lateral control, while local and urban roads highlight weaknesses in close-range detection, traffic prediction, and behavioral adaptation. The differentiated failure patterns underscore the necessity of hierarchy-specific control algorithms and adaptive sensor configurations to enhance perception reliability and ensure safe automation under diverse road conditions.
4. Results and Analysis
In this study, XGBoost analysis was performed for HDV crash and AV failure frequency modeling. The dataset was split into 80% training data and 20% test data, and three- or five-fold cross-validation was conducted for each model depending on the dataset size. The XGBoost model results showed that the accuracy of each model ranged from 0.6389 to 0.9770, with detailed values presented in Table 1.

Table 1.
Accuracy for XGBoost models.
According to the XGBoost analysis, higher accuracy indicates that the independent variables (road geometry, road infrastructure, and traffic characteristics) have a greater impact on the dependent variables (HDV crashes and AV failures). Conversely, lower accuracy suggests that the independent variables have a relatively smaller impact on the dependent variables.
According to the analysis by road type, the average accuracy for national highways was 0.9157, that for local highways was 0.8493, and that for special and metropolitan city roads was 0.7490. These results indicate that among the different road types, national highways are the most influenced by road characteristics in relation to HDV crashes and AV failures.
The wide variation in model accuracy arises primarily from differences in the stability of explanatory variables across road hierarchies rather than from model overfitting. Five-fold cross-validation confirmed that prediction errors were randomly distributed, suggesting that lower accuracy stems from data heterogeneity. On national highways, geometric and infrastructure factors such as curvature, slope, and lane configuration show consistent relationships with safety performance under relatively uniform high-speed conditions, resulting in higher accuracy. In contrast, special and metropolitan city roads exhibit rapidly changing environments: variable signal timing, pedestrian crossings, short block lengths, and frequent congestion events weaken the predictive contribution of static geometric and flow variables. These unobserved dynamic factors explain the lower accuracy observed in urban contexts.
Furthermore, HDV crash models tend to show greater accuracy variation than AV failure models. Human-driver crashes are more strongly affected by behavioral and situational factors such as reaction time, distraction, and traffic interaction, especially in dense urban conditions, whereas AV failures are mainly driven by road-geometry constraints and sensor perception limitations. These findings highlight that as road environments become less structured and more dynamically variable, the predictive reliability of both HDV and AV models declines, emphasizing the need to incorporate dynamic contextual factors in future work.
To further interpret the XGBoost modeling results, SHAP analysis was performed to quantify the contribution of each variable to HDV crash and AV failure predictions. The results for each road hierarchy are presented in Figure 2, Figure 3 and Figure 4, illustrating how the influence of geometric, infrastructure, and traffic-flow factors varies by environment. Figure 2 shows the SHAP value distributions for national highways under uninterrupted and interrupted flow conditions. For HDV crashes, (traffic speed during peak hours) and (traffic volume during peak hours) were the most influential variables, both exhibiting positive SHAP values. This means that higher speeds and heavier flow substantially increase the crash likelihood in free-flowing, high-speed segments. Road-geometry factors such as (minimum curve radius) and (maximum road width) also contributed positively, indicating that tighter curves and narrower lanes amplify crash risk. For AV failures, the dominant explanatory variables were (minimum curve radius) and (average longitudinal slope). Failures were more frequent on steep or highly curved segments, reflecting the sensitivity of perception and control algorithms to geometric irregularities. These results confirm that on high-speed roads, geometric precision and consistent markings are crucial for both human and automated driving safety.
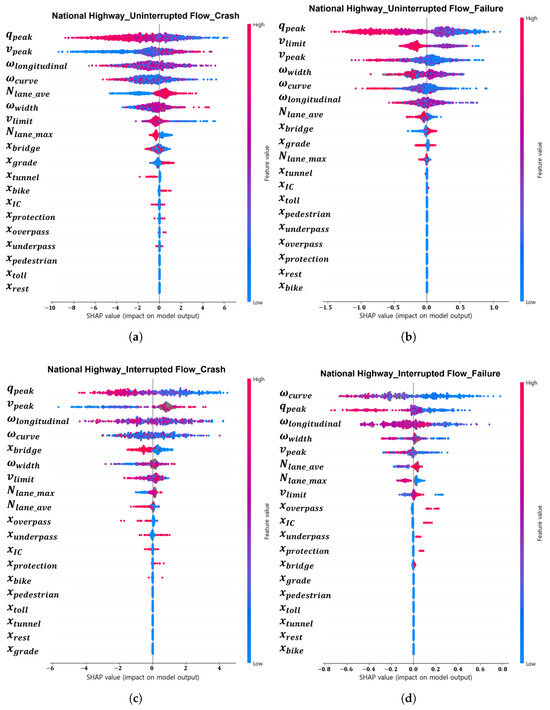
Figure 2.
SHAP value analysis of XGBoost model by flow condition and dependent variable for national highways: (a) uninterrupted flow—HDV crashes; (b) uninterrupted flow—AV failures; (c) interrupted flow—HDV crashes; (d) interrupted flow—AV failures.
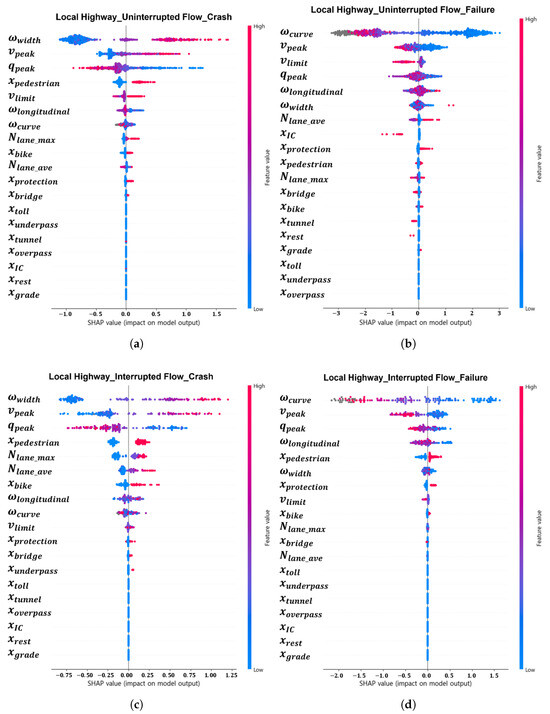
Figure 3.
SHAP value analysis of XGBoost model by flow condition and dependent variable for local highways: (a) uninterrupted flow—HDV crashes; (b) uninterrupted flow—AV failures; (c) interrupted flow—HDV crashes; (d) interrupted flow—AV failures.
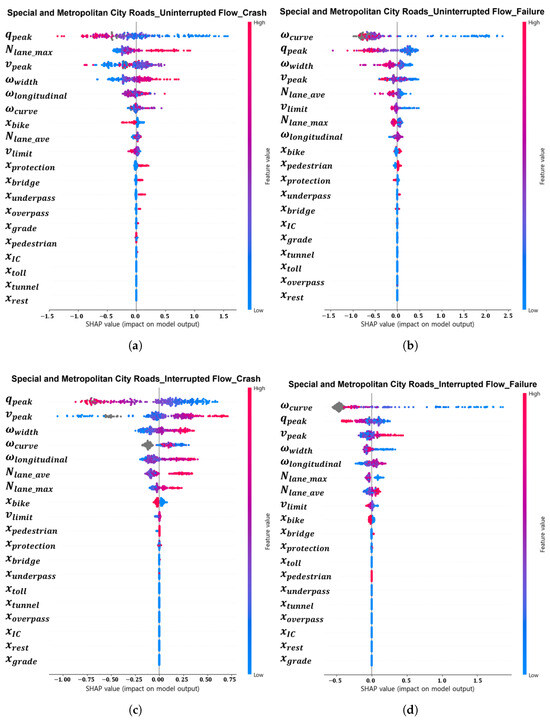
Figure 4.
SHAP value analysis of XGBoost model by flow condition and dependent variable for special and metropolitan city roads: (a) uninterrupted flow—HDV crashes; (b) uninterrupted flow—AV failures; (c) interrupted flow—HDV crashes; (d) interrupted flow—AV failures.
Figure 3 presents SHAP results for local highways. For HDV crashes, traffic-related variables, again, played a leading role, with (average traffic speed during peak hours) showing the highest positive SHAP value. However, geometric variables exhibited weaker and more variable effects, consistent with the mid-speed, interrupted-flow nature of these roads. For AV failures, infrastructure variables such as (presence of pedestrian roads) and (presence of bicycle roads) appeared among the top contributors. Their positive SHAP values suggest that complex shared-use facilities introduce uncertainty for perception systems. The results imply that while HDV drivers can dynamically adapt to changing roadway contexts, AV systems remain challenged by the diversity of roadside elements and mixed-traffic interactions on local corridors.
Figure 4 illustrates the SHAP analysis for urban roads in special and metropolitan cities. For AV failures, traffic-flow dynamics such as sudden stops, speed fluctuations, and frequent signal interruptions were dominant contributors, revealing the limitations of current perception and control modules under dense stop-and-go conditions. In contrast, HDV crashes were more strongly associated with (maximum road width) and (minimum curve radius). Narrow lanes and sharp turns substantially increased crash risk due to reduced maneuvering space in congested urban environments. These findings highlight the opposite tendencies between the two vehicle types: AVs are affected mainly by real-time environmental variability and perception latency, whereas HDV drivers are more constrained by physical road geometry and spatial limitations.
Collectively, Figure 2, Figure 3 and Figure 4 demonstrate that the most influential factors shift systematically across the road hierarchy. On national highways, static geometric attributes dominate; on local highways, mixed infrastructure factors gain importance; and on urban roads, dynamic traffic conditions are paramount. These variations explain the broader range of model accuracies observed in Table 1 and underscore that predictive reliability decreases as the environment becomes more complex and dynamically variable.
5. Conclusions
This study analyzed real-world HDV crash and AV failure data using the XGBoost machine learning technique to model abnormal frequency occurrences. The accuracy of the HDV crash and AV failure models ranged from 0.6389 to 0.9770, depending on the specific model configuration. Based on these predictive models, the SHAP XAI technique was applied to identify the key factors influencing HDV crashes and AV failures, providing a deeper understanding of the role of road characteristics in vehicle safety.
The findings indicate that road geometry and traffic characteristics significantly impact both HDV crashes and AV failures, with certain variables consistently associated with lower road safety. In particular, low (traffic volume during peak hours) and high (traffic speed during peak hours) were linked to a higher risk of HDV crashes and AV failures, emphasizing the importance of managing traffic flow conditions. Additionally, a wider (maximum road width) and a smaller (minimum curve radius) were associated with reduced safety, highlighting the need for careful geometric design considerations.
The influence of road infrastructure varied depending on the road hierarchy. On national highways and special/metropolitan city roads, infrastructure elements did not show a significant impact on road safety. However, on local highways, pedestrian and bike lanes were associated with a decrease in safety, suggesting that mixed-use road environments pose unique challenges for both HDVs and AVs. These findings emphasize the necessity of adaptive infrastructure planning that accounts for road hierarchy and the specific safety concerns of AV integration.
This study contributes to the field by overcoming the limitations of simulation-based research, which often fails to fully capture the complexities of real-world AV operations. By utilizing actual AV failure and HDV crash data, the analysis provides a more accurate reflection of the challenges faced by both human drivers and autonomous systems under real traffic conditions. Additionally, this study offers a comprehensive evaluation across different road types and traffic-flow conditions, allowing for a more nuanced understanding of how AVs and HDVs interact with diverse roadway environments. The insights derived from this analysis can support the development of road design improvements and traffic management policies aimed at ensuring the safe and efficient integration of AVs into existing transportation networks.
Future research should investigate why the effects of road characteristics vary across road hierarchies and identify the underlying mechanisms that drive these variations. In particular, additional studies are needed to explain why road infrastructure significantly impacts local highways but has little effect on national highways or special and metropolitan city roads. Moreover, future research should examine how traffic-flow dynamics interact with road geometry to influence AV failure rates, particularly in high-density urban environments where sudden stops and complex interactions occur frequently.
While this study focused primarily on static road characteristics, future work should incorporate real-time environmental factors, such as weather conditions, pedestrian density, and dynamic traffic variations. By integrating these elements, future research can develop more adaptive and predictive models that enhance AV safety and contribute to more effective road infrastructure planning. Understanding these interactions will be crucial for refining AV deployment strategies and ensuring safer road environments for all users.
Author Contributions
Conceptualization and supervision, S.T.; Methodology and study design, S.T. and H.K.; Data curation, analysis, and visualization, H.K.; Writing—original draft preparation, H.K.; Writing—review and revision, S.T.; Editing, formatting, and English proofreading, S.K. All authors have read and agreed to the published version of the manuscript.
Funding
This research is supported by a Korea Agency for Infrastructure Technology Advancement (KAIA) grant funded by the Ministry of Land, Infrastructure and Transport (Grant No. RS-2022-00143579, Project name: Development of Automated Driving System(Lv.4/4+)-based Car-Sharing Service Technologies).
Institutional Review Board Statement
Not applicable.
Informed Consent Statement
Not applicable.
Data Availability Statement
Data are contained within the article.
Conflicts of Interest
Sari Kim is employed by NZERO Co., Ltd. This company had no role in the design of the study. The remaining authors declare that the research was conducted in the absence of any commercial or financial relationships that could be construed as a potential conflict of interest.
Appendix A. XGBoost Model Hyper-Parameters
Table A1.
XGBoost model hyper-parameters for national highways.
Table A1.
XGBoost model hyper-parameters for national highways.
| Parameter | Interrupted Flow | Uninterrupted Flow | ||
|---|---|---|---|---|
| HDV Crash | AV Failure | HDV Crash | AV Failure | |
| 0.8 | 0.8 | 0.6 | 1.0 | |
| 200 | 300 | 500 | 100 | |
| 1 | 5 | 1 | 5 | |
| 7 | 4 | 6 | 6 | |
| 0.3 | 0.01 | 0.5 | 0.05 | |
Table A2.
XGBoost model hyper-parameters for local highways.
Table A2.
XGBoost model hyper-parameters for local highways.
| Parameter | Interrupted Flow | Uninterrupted Flow | ||
|---|---|---|---|---|
| HDV Crash | AV Failure | HDV Crash | AV Failure | |
| 0.6 | 0.6 | 0.8 | 0.6 | |
| 200 | 300 | 200 | 100 | |
| 1 | 5 | 5 | 1 | |
| 4 | 7 | 6 | 4 | |
| 0.01 | 0.01 | 0.01 | 0.1 | |
Table A3.
XGBoost model hyper-parameters for special and metropolitan city roads.
Table A3.
XGBoost model hyper-parameters for special and metropolitan city roads.
| Parameter | Interrupted Flow | Uninterrupted Flow | ||
|---|---|---|---|---|
| HDV Crash | AV Failure | HDV Crash | AV Failure | |
| 0.6 | 0.6 | 0.8 | 0.8 | |
| 200 | 300 | 200 | 200 | |
| 5 | 5 | 1 | 1 | |
| 4 | 3 | 5 | 5 | |
| 0.01 | 0.01 | 0.01 | 0.01 | |
Appendix B. Variable Description
Table A4.
Variable description.
Table A4.
Variable description.
| Category | Variable | Description | |
|---|---|---|---|
| Dependent Variables | Human-driven vehicle crash; if the road link has a significant level of crash and otherwise | ||
| Automated vehicle failure; if any abnormal driving incident has occurred and otherwise | |||
| Independent Variables | Road Geometry | Average longitudinal slope (%) | |
| Minimum curve radius (m) | |||
| Maximum number of lanes (unit) | |||
| Average number of lanes (unit) | |||
| Maximum road width (m) | |||
| Road Infrastructure | Presence of pedestrian road; if one exists and otherwise | ||
| Presence of bike road; if one exists and otherwise | |||
| Presence of underpass; if one exists and otherwise | |||
| Presence of bridge; if one exists and otherwise | |||
| Presence of tunnel; if one exists and otherwise | |||
| Presence of overpass; if one exists and otherwise | |||
| Presence of interchange; if one exists and otherwise | |||
| Presence of grade-separated intersection; if one exists and otherwise | |||
| Presence of protection zone; if one exists and otherwise | |||
| Presence of rest area; if one exists and otherwise | |||
| Presence of toll gate; if one exists and otherwise | |||
| Traffic Characteristics | Traffic speed during peak (km/h) | ||
| Traffic volume during peak (veh/hour) | |||
| Maximum speed limit (km/h) | |||
References
- Litman, T. Autonomous Vehicle Implementation Predictions: Implications for Transport Planning; Victoria Transport Policy Institute: Victoria, BC, Canada, 2020; Available online: https://www.ccam-tac.org/wp-content/uploads/2020/03/avip.pdf (accessed on 26 October 2025).
- Hamid, A.A.; Ishak, N.S.; Roslan, M.F.; Abdullah, K.H. Tackling human error in road crashes: An evidence-based review of causes and effective mitigation strategies. J. Metrics Stud. Soc. Sci. 2023, 2, 1–9. [Google Scholar]
- Woo, S.; Woo, B.; Chang, Y.; Tak, S. Road Design on Human Driver Accidents vs. Automated Vehicle Failures: Comparison with Real-World Field Data. IEEE Access 2024, 12, 159545–159560. [Google Scholar] [CrossRef]
- Tak, S.; Kim, J.; Lee, D. Study on the extraction method of sub-network for optimal operation of connected and automated vehicle-based mobility service and its implication. Sustainability 2022, 14, 3688. [Google Scholar] [CrossRef]
- Rana, M.M.; Hossain, K. Connected and autonomous vehicles and infrastructures: A literature review. Int. J. Pavement Res. Technol. 2023, 16, 264–284. [Google Scholar] [CrossRef]
- Wang, Y.; Wang, L. Autonomous vehicles’ performance on single lane road: A simulation under VISSIM environment. In Proceedings of the 2017 10th International Congress on Image and Signal Processing, BioMedical Engineering and Informatics (CISP-BMEI), Shanghai, China, 14–16 October 2017; IEEE: Piscataway, NJ, USA, 2017; pp. 1–5. [Google Scholar]
- Fang, X.; Li, H.; Tettamanti, T.; Eichberger, A.; Fellendorf, M. Effects of automated vehicle models at the mixed traffic situation on a motorway scenario. Energies 2022, 15, 2008. [Google Scholar] [CrossRef]
- Vrbanić, F.; Čakija, D.; Kušić, K.; Ivanjko, E. Traffic flow simulators with connected and autonomous vehicles: A short review. In Transformation of Transportation; Springer: Cham, Switzerland, 2021; pp. 15–30. [Google Scholar]
- Tak, S.; Kim, S.; Yu, H.; Lee, D. Analysis of relationship between road geometry and automated driving safety for automated vehicle-based mobility service. Sustainability 2022, 14, 2336. [Google Scholar] [CrossRef]
- Somers, A. Infrastructure Changes to Support Automated Vehicles on Rural and Metropolitan Highways and Freeways: Emerging Asset Information Technology (Module 4); Austroads Ltd.: Sydney, NSW, Australia, 2019. Available online: https://austroads.gov.au/publications/connected-and-automated-vehicles/ap-r605-19 (accessed on 26 October 2025).
- Teoh, E.R.; Kidd, D.G. Rage against the machine? Google’s self-driving cars versus human drivers. J. Saf. Res. 2017, 63, 57–60. [Google Scholar] [CrossRef] [PubMed]
- Chen, T.; Guestrin, C. Xgboost: A scalable tree boosting system. In Proceedings of the 22nd ACM Sigkdd International Conference on Knowledge Discovery and Data Mining, San Francisco, CA, USA, 13–17 August 2016; pp. 785–794. [Google Scholar]
- Wen, X.; Xie, Y.; Wu, L.; Jiang, L. Quantifying and comparing the effects of key risk factors on various types of roadway segment crashes with LightGBM and SHAP. Accid. Anal. Prev. 2021, 159, 106261. [Google Scholar] [CrossRef] [PubMed]
- Lundberg, S.M.; Lee, S.I. A unified approach to interpreting model predictions. In Proceedings of the Advances in Neural Information Processing Systems 30 (NIPS 2017), Long Beach, CA, USA, 4–9 December 2017. [Google Scholar]
- Lee, H. XGBoost Hyperparameter Tuning: Research Paper Edition. Available online: https://leehanchung.github.io/blogs/2021/06/25/xgboost-hyperparameter-tuning/ (accessed on 26 October 2025).
- Verma, V. Exploring Key XGBoost Hyperparameters: A Study on Optimal Search Spaces and Practical Recommendations for Regression and Classification. Int. J. All Res. Educ. Sci. Methods (IJARESM) ISSN 2024, 12, 2455–6211. [Google Scholar] [CrossRef]
- Ministry of Land, Infrastructure and Transport. Digital Road Inventory and National Topographic Map: Data Construction and Quality Management Protocol; Technical Report; Ministry of Land, Infrastructure and Transport: Sejong, Republic of Korea, 2024. (In Korean)
- Korea Transport Institute. Korea Transport Database (KTDB) Technical Guide; Technical Report; Korea Transport Institute: Sejong, Republic of Korea, 2023. (In Korean)
- Korea Transportation Safety Authority. Traffic Accident Analysis System (TAAS): Data Manual 2017–2021; Technical Report; Korea Transportation Safety Authority: Seoul, Republic of Korea, 2022. (In Korean)
- ISO 19157:2013; Geographic Information–Data Quality. Technical Report; International Organization for Standardization: Geneva, Switzerland, 2013.
- Fridman, L.; Brown, D.E.; Glazer, M.; Angell, W.; Dodd, S.; Jenik, B.; Terwilliger, J.; Patsekin, A.; Kindelsberger, J.; Ding, L.; et al. MIT Advanced Vehicle Technology Study: Large-Scale Naturalistic Driving Study of Driver Behavior and Interaction with Automation. IEEE Access 2019, 7, 102021–102038. [Google Scholar] [CrossRef]
- Quito, B.; Esmahi, L. Compare and Contrast LiDAR and Non-LiDAR Technology in an Autonomous Vehicle: Developing a Safety Framework. Open J. Saf. Sci. Technol. 2023, 13, 101–131. [Google Scholar] [CrossRef]


Disclaimer/Publisher’s Note: The statements, opinions and data contained in all publications are solely those of the individual author(s) and contributor(s) and not of MDPI and/or the editor(s). MDPI and/or the editor(s) disclaim responsibility for any injury to people or property resulting from any ideas, methods, instructions or products referred to in the content. |
© 2025 by the authors. Licensee MDPI, Basel, Switzerland. This article is an open access article distributed under the terms and conditions of the Creative Commons Attribution (CC BY) license (https://creativecommons.org/licenses/by/4.0/).