Abstract
PM2.5 poses a serious threat to public health, and stronger intellectual property (IP) protection can help reduce PM2.5 concentrations. This study treats the rollout of National Intellectual Property Model Cities (NIPMC) as a quasi-natural experiment in IP protection, using an unbalanced panel of 2074 counties from 2005 to 2021. We employ a multi-period difference-in-differences (DID) design to examine how NIPMC affects both average PM2.5 levels and their variability. Three main findings emerge. First, NIPMC significantly lowers PM2.5 levels and their dispersion in pilot counties, a result that remains robust across a battery of checks. Second, NIPMC reduces PM2.5 by strengthening local innovation capacity and by accelerating industrial restructuring and upgrading. Third, the reduction in average PM2.5 is especially pronounced in areas with weaker IP protection, general (non-core) cities, and in western regions; meanwhile, the reduction in PM2.5 variability is particularly notable in weak-IP areas, general cities, and central regions. Together, these results provide new evidence on the environmental benefits of IP protection and offer actionable policy guidance for developing countries pursuing cleaner air.
1. Introduction
In recent years, the issue of fine particulate matter (PM2.5) pollution has garnered widespread global attention [1,2,3,4]. PM2.5 refers to particulate matter with a diameter of 2.5 micrometers or less. Due to their minuscule size, these particles can penetrate deep into the human lungs and even enter the bloodstream, thereby causing a range of health problems, such as respiratory and cardiovascular diseases and lung cancer [5,6,7]. High PM2.5 concentrations directly affect both environmental quality and human health, as higher concentrations deteriorate air quality and increase the risk of respiratory and cardiovascular diseases among the population [8,9]. Meanwhile, the standard deviation of PM2.5 reflects the volatility and stability of air quality. A larger standard deviation indicates significant fluctuations in PM2.5 concentrations, resulting in severe air quality instability, thereby exacerbating health risks [10], particularly for vulnerable groups such as the elderly and children. Major sources of PM2.5 include various industrial and human activities [11]. Industrial emissions are the primary contributors, especially from coal-fired power plants, steel mills, and cement factories [12]. Additionally, vehicle emissions are a significant source of PM2.5 in large cities. Dust from construction sites and smoke from burning processes, especially biomass burning and coal heating in winter, also significantly increase PM2.5 concentrations [13]. In China, with rapid industrialization and urbanization, the issue of PM2.5 pollution has become increasingly prominent [14]. Large-scale industry, increased vehicular emissions, rapid development in the construction sector, and coal heating and biomass burning have all significantly contributed to the emission of PM2.5. According to the “China Ecological Environment Status Bulletin 2022,” among 339 cities in China, 86 cities recorded annual average PM2.5 concentrations exceeding national standards. Moreover, data from the World Health Organization show that the annual average PM2.5 concentrations in many Chinese cities are well above the safe levels recommended by the WHO (Source: https://data.worldbank.org/indicator/EN.ATM.PM25.MC.M3?locations=CN:https://www.who.int/data/gho/data/themes/air-pollution/who-air-quality-database/2022 (accessed on 15 September 2025)). Therefore, it is crucial and urgent to explore and implement effective measures to reduce PM2.5 concentrations and their variability to ensure the continuous improvement of air quality and long-term protection of public health.
Numerous factors influencing PM2.5 concentrations have been explored, including urbanization [15,16], meteorological conditions [17], regional economic activities [18], straw burning [19], urban lockdowns [20,21], and natural disasters [22]. These various factors affect PM2.5 concentrations through different pathways, while policy support intervenes through specific mechanisms and is one of the key directions for reducing PM2.5 concentrations. Effective policy measures include but are not limited to optimizing the energy structure, strengthening emission standards, promoting green transportation, and enhancing environmental monitoring. These policies not only directly reduce pollution sources but also improve the diffusion and transformation processes of pollutants under meteorological conditions, thereby comprehensively reducing PM2.5 concentrations and enhancing air quality. Existing literature has explored the impact of various policies on PM2.5, including carbon emission trading [23], air pollution control action plans [24,25], clean air policies [26], low-carbon cities [27], smart cities [28], the introduction of high-speed rail [29], and new standards for environmental air quality in China [30]. Despite this, existing research has not adequately explored the relationship between National Intellectual Property Demonstration Cities and PM2.5. In-depth studies in this area could refine existing policies and formulate more effective intervention measures.
The NIPMC program is designed to showcase and scale up the protection and utilization of intellectual property. Its core mandates are to strengthen IP enforcement, upgrade IP management and public services, and refine policy support frameworks. Through these levers, NIPMC can mitigate PM2.5 emissions arising from industrial and human activities. For example, by advancing city-level IP strategies, the program incentivizes high-pollution industries—such as coal-fired power, steel, and cement—to upgrade technologies and adopt cleaner production processes. At the same time, it catalyzes innovation in transportation by promoting electric and other clean-energy vehicles, which in turn reduces tailpipe emissions. NIPMC also tightens dust control at construction sites, supports advanced abatement technologies, and encourages the substitution of clean energy for winter heating to reduce emissions from biomass and coal. Collectively, these measures lower both the average concentration and the variability (standard deviation) of PM2.5, improving both air quality and its long-term stability.
Existing research has explored the pollution reduction effects of the policy, focusing primarily on carbon emissions and PM2.5. Jiang et al. (2023) first pointed out that the NIPMC policy has achieved significant success in controlling carbon emissions, reducing them by approximately 20.6% compared to non-pilot cities [31]. Building on this discovery, Qian et al. (2023) further elaborated that the NIPMC policy not only directly reduced carbon emissions in pilot cities but also had a positive spatial spillover effect on the surrounding areas, helping to alleviate the carbon emission problems of the entire region [32]. Following this, Lv et al. (2023) added from the perspectives of technological innovation and industrial restructuring that the implementation of NIPMC helps effectively reduce urban air pollution, demonstrating the policy’s multiple values in promoting environmental quality [33]. However, existing research still presents the following gaps: although Lv et al. (2023) discussed the relationship between NIPMC and PM2.5, their study only explored the impact of NIPMC on PM2.5 concentrations using city-level data [33]. Since NIPMC includes pilot projects at the county level, relying solely on city-level data does not encompass all pilot areas within the study, potentially resulting in research findings that do not fully reflect the implementation effects of NIPMC and its comprehensive impact on PM2.5 concentrations.
Drawing on an unbalanced panel of 2074 counties from 2005 to 2021, this study employs a multi-period difference-in-differences (DID) framework to systematically examine NIPMC’s effects on both the mean level and the variability (standard deviation) of PM2.5. Relative to the existing literature, this study makes two primary contributions. First, it evaluates NIPMC’s impact from two complementary perspectives—average concentration and variability—by comparing county-level PM2.5 before and after implementation and assessing changes in its standard deviation. This dual lens provides a more comprehensive picture of policy effectiveness. Second, because the NIPMC pilot encompasses county-level cities, this is the first study to use county-level data to comprehensively assess the policy’s effects, thereby offering a more detailed view of the NIPMC–PM2.5 relationship.
The remainder of the paper is organized as follows: Section 2 introduces the policy background and presents the theoretical framework and hypotheses. Section 3 describes the research design. Section 4 reports the empirical results. Section 5 provides heterogeneity analyses. Section 6 concludes with key findings and policy recommendations.
2. Policy Background and Research Hypotheses
2.1. Policy Background
NIPMC is a key initiative under China’s strategy to strengthen intellectual property (IP) protection and foster innovation-driven development. The background of this policy lies in both global and Chinese developments in IP protection, highlighting China’s gradual progress and strategic positioning in this field.
Since the signing of the Paris Convention in 1883, a systematic framework for IP protection began to take shape globally, encompassing patents, trademarks, and industrial designs and laying the foundations for international IP protection [34]. The Berne Convention subsequently standardized copyright protection, while the Agreement on Trade-Related Aspects of Intellectual Property Rights (TRIPS) strengthened global IP standards and promoted the refinement of national IP systems [35,36]. China started IP protection later than many countries but has advanced rapidly in recent years. In 2008, the State Council issued the National Intellectual Property Strategy Outline, marking the start of China’s strong emphasis on IP protection and elevating it to a national strategic priority to enhance innovation capacity and international competitiveness.
In 2011, China’s National Intellectual Property Administration (CNIPA) issued the Evaluation Methods for National Intellectual Property Pilot and Demonstration Cities (Districts) and subsequently designated the first and second cohorts of NIPMCs in 2012 and 2013. To further strengthen the program, CNIPA revised and issued the Evaluation and Management Measures for National Intellectual Property Pilot and Demonstration Cities (Districts) in 2014 and went on to select six additional cohorts. By 2021, a total of 77 jurisdictions had been named NIPMCs—60 prefecture-level cities, 9 county-level cities, and 8 districts within centrally administered municipalities. As policy pioneers, these cities are charged with testing and refining IP protection mechanisms, with successful practices intended for nationwide replication. Figure 1 presents their geographic distribution.
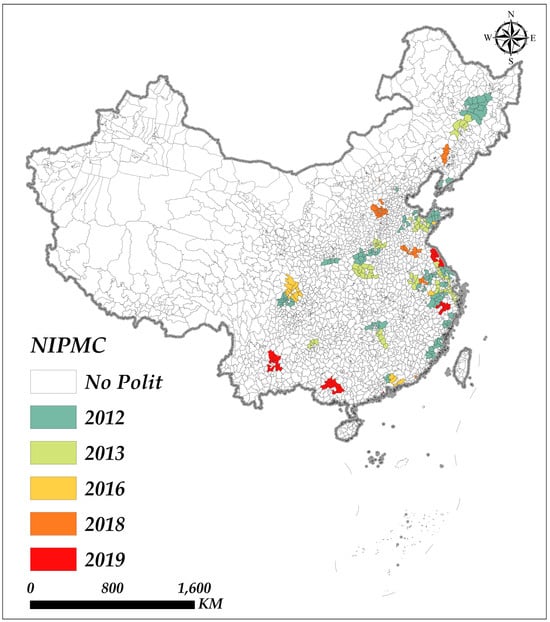
Figure 1.
Spatial distribution of the NIPMC (ArcGIS 10.8 software).
The core mandates of the NIPMC program are to formulate and implement city-level IP strategies, enhance IP management and services, refine policy frameworks, strengthen enforcement, and improve the economic returns to IP. Together, these measures aim to build a more complete and efficient IP protection environment, reduce innovation and entrepreneurship risks, and improve the overall business climate. In practice, stronger IP protection under NIPMC has increased firms’ and individuals’ incentives to invest in R&D, spurred the growth of high-tech industries and knowledge-intensive services, and accelerated industrial upgrading. By facilitating the diffusion of innovation and technology transfer, reducing reliance on high-pollution industries, and expanding cleaner production technologies, the program has contributed to lower PM2.5 concentrations and reduced variability (standard deviation), thereby supporting improvements in environmental quality.
Overall, as a component of the national strategy, NIPMC provides critical support for strengthening urban innovation capacity and optimizing industrial structure through enhanced IP protection and complementary policies, advancing China’s innovation-driven development and environmental protection goals.
Figure 2a illustrates changes in PM2.5 concentrations before and after policy implementation for the treatment and control groups, while Figure 2b shows variations in PM2.5 standard deviations over the same period. The gap between the treatment and control groups gradually narrows after policy implementation, indicating a significant policy effect of NIPMC in reducing both PM2.5 concentrations and their standard deviations. Specifically, the treatment group experienced larger reductions than the control group, further confirming NIPMC’s effectiveness in improving air quality and reducing emission variability.
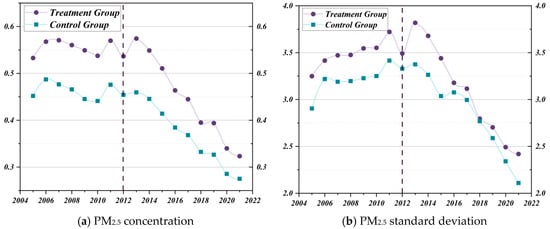
Figure 2.
Changes in PM2.5 in the treatment and control groups before and after the policy (Origin 2024b software).
Figure 3 reports the distribution of PM2.5 concentration and standard deviation. From Figure 3a, it is evident that regions with higher PM2.5 concentrations are primarily concentrated in Xinjiang, Chengdu, Beijing, Hebei, and Henan. Figure 3b shows that the distribution of PM2.5 standard deviation is relatively dispersed, mainly concentrated in provinces such as Xinjiang and Shaanxi.
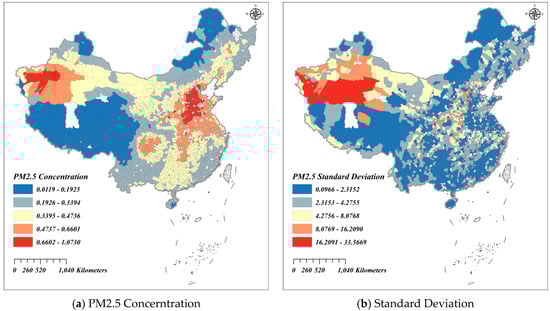
Figure 3.
PM2.5 Concentration and Standard Deviation Spatial Distribution (ArcGIS 10.8 software).
2.2. Research Hypothesis
2.2.1. Concentration and Standard Deviation of NIPMC and PM2.5
NIPMC plays multiple crucial roles in reducing both PM2.5 concentrations and their variability. Its main tasks include formulating and implementing urban IP strategies, strengthening management and services, improving policy frameworks, enhancing enforcement, and fostering the IP service industry. Together, these efforts contribute significantly to improving air quality and reducing environmental pollutants. NIPMC enhances urban innovation capacity by strengthening IP protection. Specifically, its reinforced measures incentivize enterprises and individuals to increase R&D investments in environmental and clean energy technologies, such as efficient filtration systems and low-emission fuels, which directly reduce PM2.5 emissions. Robust IP protection allows innovators to better safeguard their innovations and reduce the risk of technology leakage, thereby promoting the development and diffusion of environmental technologies [37]. Furthermore, NIPMC facilitates industrial optimization and upgrading. With IP policy support, traditional high-pollution industries have been upgraded, while low-pollution, high-value industries have expanded rapidly. Policy guidance, financial support, and tax incentives encourage businesses to adopt cleaner production technologies and equipment, thereby reducing pollutant emissions. High-energy, high-pollution enterprises have lowered PM2.5 emissions through technological upgrades and equipment modernization, while industries such as new energy and environmental protection have grown quickly with policy support, fundamentally reducing PM2.5 emissions.
Additionally, NIPMC enhances the marketability of environmental technologies and products by strengthening the IP service industry. A well-established service system ensures the promotion and application of environmental technologies. Comprehensive patent application and protection mechanisms allow environmental technologies to rapidly enter the market, promoting the widespread application of new technologies [38]. Meanwhile, enhanced technology transfer services facilitate the swift movement of advanced environmental technologies from research institutions to application enterprises, promoting rapid diffusion and application of the technology [39,40], and thereby lowering PM2.5 emission levels.
The magnitude of the PM2.5 standard deviation reflects the volatility and uncertainty of particulate matter concentrations in the air. A larger standard deviation indicates more dramatic changes in air quality, with greater differences in PM2.5 concentrations across different times and locations [41]. The main sources of high PM2.5 standard deviation include fluctuations in industrial emissions, the unevenness of traffic emissions, and changes in seasonal and meteorological conditions [42,43,44]. NIPMC enhances IP protection, promoting innovation and application of environmental technologies, such as advanced air monitoring and control technologies. This improvement increases the precision of pollution source control, reducing the randomness and variability of emissions. Simultaneously, NIPMC drives the optimization of industrial structures, reducing the number and emission intensity of high-pollution enterprises, thereby stabilizing overall emissions and further lowering the PM2.5 standard deviation. Additionally, enhanced policy coordination has increased the consistency of environmental measures across regions, reducing differences in air quality between areas, and effectively decreasing the PM2.5 standard deviation.
In response, this paper proposes:
Hypothesis 1.
NIPMC can effectively reduce the PM2.5 concentration and standard deviation in pilot areas.
2.2.2. National Intellectual Property Model City and Innovation
Innovation refers to the process of introducing new concepts, technologies, products, or processes aimed at enhancing efficiency, creating value, and driving economic and social progress [45,46,47]. Under the framework of NIPMC, innovation primarily manifests in technological research and development, industrial upgrading, and the application of IP rights. By strengthening the protection of IP, NIPMC provides a more secure environment, encouraging enterprises and research institutions to increase R&D investments, reduce the risk of technology leakage, and enhance the anticipated returns from innovation [48]. Specifically, NIPMC, by improving the IP policy system and enhancing IP management and service capabilities, has strengthened the legal protection for urban innovation, allowing innovators to more confidently invest in the development and application of new technologies. Furthermore, NIPMC has facilitated technology transfer and commercialization, accelerating the market application and promotion of innovative outcomes, thereby further stimulating the vitality of technological innovation [49].
Innovation significantly impacts PM2.5 concentration and standard deviation. Firstly, by introducing and applying green technology innovations such as advanced pollution control equipment and clean production processes, it is possible to directly reduce industrial and transportation emissions, thereby lowering the overall concentration of PM2.5 [50]. Secondly, innovation drives the optimization and upgrading of the industrial structure [51], reducing the number and emission intensity of high-pollution enterprises, thus making overall emissions more stable [52]. Additionally, the diffusion and promotion of innovation improve the consistency and standardization of pollution control technologies across different regions, reducing disparities in air quality between regions, and effectively lowering the standard deviation of PM2.5 concentration [53,54]. Therefore, by promoting innovation, NIPMC not only reduces the average concentration of PM2.5 but also its variability, providing robust support for improving air quality and protecting public health. This underscores the importance of IP protection in fostering an environment conducive to technological advancement and environmental sustainability.
In response, this paper proposes:
Hypothesis 2.
NIPMC can promote the reduction of PM2.5 concentration and standard deviation through its innovation effects.
2.2.3. National Intellectual Property Model City and Industrial Structure
Industrial structure refers to the proportion and composition of economic activities among various industrial sectors in a region or country, including the relative distribution of and relationships between the primary industry (agriculture), secondary industry (industry), and tertiary industry (services) [55,56]. A sound industrial structure not only reflects the level and efficiency of economic development but also impacts environmental quality and resource utilization efficiency.
NIPMC, by strengthening IP protection, has facilitated the development of high-tech industries and knowledge-intensive service sectors, thereby promoting the optimization and upgrading of industrial structures. Specifically, a series of policies and measures implemented under NIPMC, such as the development and implementation of IP strategies, enhancement of IP management and service capabilities, and the improvement of the policy system, have motivated enterprises to increase R&D investment and technological innovation, reducing the proportion of industries with low technological content and high pollution. By protecting innovative outcomes, NIPMC has raised the expected returns from innovation, promoted the application of advanced and green technologies, and accelerated the technological transformation and upgrading of traditional industries. This has enabled more efficient allocation of resources and factors to industries with higher added value and lower pollution.
The optimization of industrial structure has a significant impact on PM2.5 concentration and its standard deviation. Firstly, with the reduction of high-pollution industries and the rise of high-tech industries, the overall PM2.5 emissions have significantly decreased, lowering the average concentration of PM2.5 [57,58]. Secondly, the upgrading of the industrial structure has promoted the unification of production technologies and environmental standards across regions, reducing differences in pollution emissions between different areas, thereby lowering the standard deviation of PM2.5 concentrations. Additionally, the expansion of the tertiary sector and the widespread adoption of green technologies have made the adoption and implementation of environmental technologies more consistent across regions, further reducing the variability of PM2.5 concentrations. Therefore, by promoting the upgrading of industrial structures, NIPMC not only effectively reduces the average concentration of PM2.5 but also significantly diminishes its variability, providing important support for improving air quality and promoting sustainable environmental development.
In response, this paper proposes:
Hypothesis 3.
NIPMC can promote the reduction of PM2.5 concentration and standard deviation through industrial structure effects.
Based on the analysis above, a theoretical framework diagram has been developed, as shown in Figure 4.
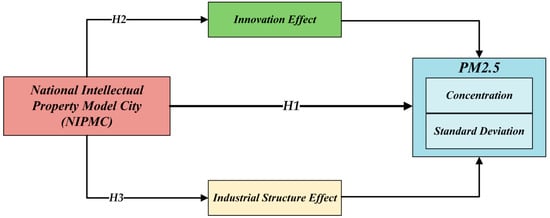
Figure 4.
Theoretical framework (Visio 2021 software).
3. Model Setting and Variable Description
3.1. Model Setting
3.1.1. Difference-in-Differences with Multiple Time Periods
The Difference-in-Differences (DID) method is a widely used statistical technique in econometrics and social sciences to assess the causal impact of policies or interventions. This method estimates the effects of a policy by comparing the changes in outcomes between a treatment group and a control group before and after an intervention, while controlling for confounding factors caused by time trends and differences between groups [59,60,61]. The Multiple Time Period Difference-in-Differences (MDID) model extends the traditional DID framework by allowing the observation of intervention effects at multiple time points. Given the staggered rollout of the NIPMC across different years, this study adopts the MDID approach to evaluate the policy effects of the NIPMC. Following the approach used by Beck et al. (2010) [62], the model is set up as follows:
Yit is the explained variable in the model (1), representing the concentration and standard deviation of PM2.5 for city i in year t. Treatedi is a grouping variable, taking the value of 1 if city i belongs to the treatment group and 0 if it belongs to the control group; Postit is a treatment period dummy variable, taking the value of 1 if city i is in the NIPMC in year t, otherwise 0. Controls is the set of control variables for this paper. , and are the city fixed effects, time fixed effects, and random error term, respectively.
3.1.2. Mediator Effect Model
The traditional three-step mediation effect model, particularly the method proposed by Baron & Kenny (1986), has had a significant impact on the analysis of mediation effects but also carries notable drawbacks [63,64]. The model is typically divided into three steps: First, the total effect of the independent variable on the dependent variable is tested. Second, the effect of the independent variable on the mediator is examined. Finally, the effect of the mediator on the dependent variable is assessed, alongside the direct effect of the independent variable when controlled. However, the estimation method by Baron & Kenny not only tends to produce biased results but also may exaggerate the mediation effect, leading to questions about the accuracy and reliability of the outcomes. Specifically, their approach may underestimate the standard error of the path coefficients when detecting indirect effects, thus overstating the statistical significance of mediation effects.
To overcome the limitations of the traditional three-step mediation model, this paper adopts the two-step mediation effect model proposed by Jiang. This model simplifies the analysis into two main steps: First, it involves a theoretical analysis to clarify the impact of the mediator on the dependent variable. Second, it conducts empirical analysis to assess the influence of the independent variable on the mediator. Compared to the traditional three-step model, this two-step approach simplifies the analysis process, making it more direct and efficient. Following this methodology, the paper constructs Model (2):
In model (2), M is the intermediary variable, mainly including innovation and industrial structure.
3.2. Variable Description
3.2.1. Explanatory Variable
NIPMC designation is given to a city that, upon approval to become an NIPMC, and for the subsequent years, is assigned a value of 1 for this variable; all other years and cities not designated receive a value of 0. Given that county-level cities are also eligible to apply for pilot status, this study collects and analyzes data at the district and county levels to ensure comprehensive coverage of all pilot areas.
3.2.2. Explained Variable
The data on PM2.5 concentrations utilized in this study are sourced from the Atmospheric Composition Analysis Group, which integrates aerosol optical depth data from multiple satellites such as MODIS, VIIRS, MISR, and SeaWiFS using various retrieval methods including Dark Target, Deep Blue, and MAIAC, combined with GEOS-Chem simulation data [65,66]. The relative uncertainties determined by ground-based sun photometer observations (AERONET) are used for geophysical estimations, accounting for most of the variability in ground-level PM2.5 measurements and producing estimated values of global and regional PM2.5 concentrations. Building on this, ArcGIS is used to aggregate the raster surfaces into county-level annual averages of PM2.5 across China. The PM2.5 standard deviation is then computed from the daily observations within each year (365/366 days) using the conventional formula, capturing the intra-annual variability-and hence the uncertainty—of particulate matter concentrations at the county level.
3.2.3. Control Variables
Drawing on existing literature [67,68], this study incorporates several control variables to refine its analysis. These include budget level (budget), defined as the ratio of local governments’ total general budget revenue and expenditure to regional GDP; savings level (sav), defined as the ratio of urban and rural residents’ savings deposits to regional GDP; welfare level (welfare), defined as the number of beds in social welfare institutions per registered resident; education level (student), defined as the number of students enrolled in regular secondary schools per registered resident; healthcare level (hos), defined as the number of hospital beds per registered resident; and population density (pop), defined as the registered population per unit of administrative land area. These variables account for economic, social, and infrastructural factors that may influence the impacts of the NIPMC policy on environmental and public health outcomes.
Table 1 reports the characteristics of the main variables used in this study. The average value for NIPMC is 0.071, indicating that only 7.1% of the 32,898 samples are from pilot areas designated for the initiative. This suggests that the pilot scope of NIPMC is relatively limited, reflecting the policy’s early stage of implementation at the national level and underscoring the need to expand coverage to more regions to fully assess its impact and effectiveness.

Table 1.
Descriptive statistics.
3.3. Sample Selection and Data Source
Given the significant amount of missing data at the county level, the study decided against using interpolation methods to fill these gaps, suspecting that such methods might not accurately reflect the actual conditions. Consequently, all samples with missing data were excluded, resulting in a non-balanced panel dataset comprising 2097 districts and counties from 2005 to 2021, with a total of 32,989 observations. The data on PM2.5 concentrations were sourced from the Atmospheric Composition Analysis Group, which produces estimated values of global and regional PM2.5 concentrations using satellite observations and ground measurement data. This study further utilized ArcGIS software to convert these raster data into annual average PM2.5 concentration values at the county level in China (Data sources: https://sites.wustl.edu/acag/datasets/surface-pm2-5/ (accessed on 15 September 2025); http://www.cnemc.cn/ (accessed on 15 September 2025)). Additionally, the PM2.5 standard deviation data were derived from daily PM2.5 readings, calculated using the standard deviation formula. Data for control variables and mediating variables were obtained from the “China County Statistical Yearbook” (Data sources: https://www.zgtjnj.org/navibooklist-n3025030705-1.html (accessed on 15 September 2025)) and the National IP Administration, while the data for NIPMC came from the official Chinese government website. This comprehensive data collection and transformation effort underscores the rigorous approach taken to ensure the robustness and validity of the research findings, emphasizing the integrity and scientific rigor of the study’s methodology.
4. Empirical Analysis
4.1. Benchmark Regression
This study employs Model (1) to examine the impact of NIPMC on the concentration and standard deviation of PM2.5, with results presented in Table 2. Columns (1) to (8) control for year and district-level fixed effects and use robust standard errors. Columns (1) to (4) report the regression results for PM2.5 concentration, while columns (5) to (8) report results for PM2.5 standard deviation.
Table 2.
Benchmark regression results.
Columns (1) and (5) of Table 2 report the regression results without control variables, showing NIPMC coefficients of −0.03 and −0.198, respectively, both significant at the 1% level. Subsequent columns report results with progressively added control variables, where changes in coefficient magnitude are minor, and the level of significance remains largely unchanged. Figure 5 illustrates this more clearly, indicating that the added control variables have minimal impact on the stability of the model, thus affirming the robustness of the estimated results. The gradual inclusion of control variables in the regression analysis supports the core hypothesis of the study: NIPMC significantly reduces PM2.5 emissions and its variability. Hence, Hypothesis 1 is validated.
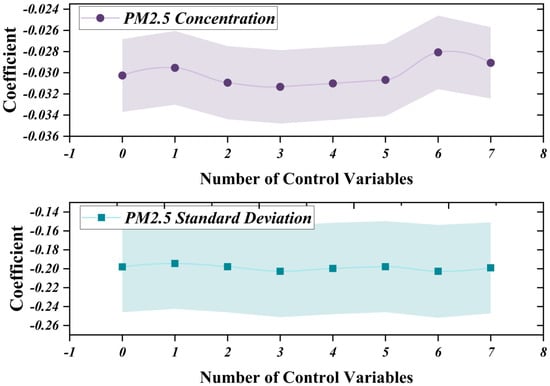
Figure 5.
Changes in regression coefficients and error bars with the incremental addition of control variables (Origin 2024b software).
4.2. Parallel Trend Test
The parallel trends test is a crucial step in the Difference-in-Differences (DID) model, utilized to verify whether the treatment and control groups followed similar trends prior to the intervention [61,69]. This test ensures that, in the absence of any intervention, the outcomes for both groups would have evolved in a similar manner over time, thereby rendering the estimated effects of the intervention more credible [70]. The parallel trends test typically employs the Event Study Method, which involves comparing the trends of the treatment and control groups at various time points before and after the treatment to assess their parallelism. Specifically, the parallel trends test is conducted by observing whether the coefficients at various pre-treatment time points significantly deviate from zero. If these coefficients are not significant, it indicates that the two groups exhibited parallel trends before the treatment, thus satisfying the prerequisite assumption of the DID model. Drawing from existing literature [71,72,73], this study employs the Event Study Method for conducting the parallel trends test and sets up the following model:
In Model (3), this study uses the year prior to the policy implementation as the reference group, meaning the regression equation does not include k = −1, and all other parts of the model are consistent with the baseline model. If the coefficients for k < 0 are not significant, it indicates that the estimated results satisfy the parallel trends assumption.
Figure 6 presents the results of the parallel trends test conducted in this study. Figure 6a displays the results for PM2.5 concentrations. It can be observed that before the implementation of the policy, the coefficients at different time points fluctuate around zero and do not reach a significant level. However, after the policy implementation, the coefficients change significantly, with the coefficients being significantly negative in most years, indicating a significant reduction in PM2.5 concentrations post-policy. Similarly, Figure 6b shows the results for the standard deviation of PM2.5. These results are akin to those for PM2.5 concentrations.
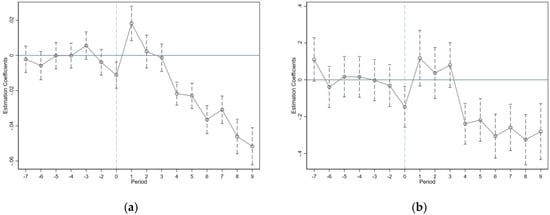
Figure 6.
Results of the parallel trend test for PM2.5 concentration (a) and standard deviation (b) (Stata 18 software).
The above analysis indicates that this study successfully passes the parallel trends test, confirming that prior to the implementation, the treatment and control groups exhibited similar trends in both PM2.5 concentration and its variability, thus validating the use of the Difference-in-Differences approach to estimate the effects of the policy.
4.3. Robustness Test
4.3.1. Replace Variables
To demonstrate the robustness of the main conclusions, this study substituted alternative dependent variables. Specifically, the logarithm of the total PM2.5 value (PM1) was used to replace the concentration of PM2.5, while the maximum (PM2) and minimum values (PM3) of PM2.5 were used to replace the standard deviation of PM2.5. The regression results are presented in columns (1) to (3) of Table 3. The coefficients for NIPMC are −0.029, −0.025, and −0.034, respectively, and all are significant at the 1% level, thereby confirming the robustness of the main conclusions of the study.
Table 3.
Robustness test I.
4.3.2. One Delayed Period
Using lagged variables can reduce the endogeneity bias caused by omitted variables or measurement errors, as lagged variables may be uncorrelated with contemporaneous random shocks [74]. Therefore, this study selected a one-period lag of the policy for regression analysis. The results are presented in columns (4) and (5) of Table 3. The coefficients for NIPMC are −0.029 and −0.213, respectively, and both are significant at the 1% level, confirming the robustness of the main conclusions of the study.
4.3.3. Replace Sample Intervals
Considering the potential interference of the COVID-19 pandemic on the effectiveness of the NIPMC policy, this study excludes data from 2019 to 2021 and conducts a new regression analysis. The results are displayed in columns (6) and (7) of Table 3. The coefficients for NIPMC are −0.016 and −0.143, respectively, and both are significant at the 1% level, confirming the robustness of the main conclusions of the study.
4.3.4. PSM-DID
The propensity score matching method is a statistical technique used to control for sample selection bias in non-randomly grouped samples [75,76]. By calculating the probability of each sample receiving treatment and matching similar samples in treatment and control groups, its primary function is to enhance the accuracy of causal inference and reduce the impact of potential confounding factors. Types of propensity score matching include caliper matching, radius matching, kernel matching, and linear regression matching. This paper primarily employed nearest neighbor matching for propensity score matching, ensuring the similarity of characteristics between treatment and control groups after matching. Figure 7 reports the matching results of the nearest neighbor matching method, where the post-matching % bias is observed to be close to the zero axis, indicating successful matching.
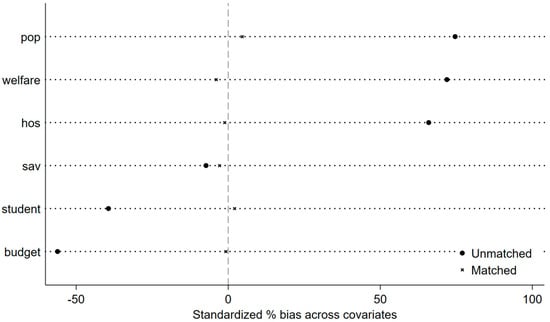
Figure 7.
Balance test (Stata 18 software).
After excluding some unmatched samples, this paper re-ran regression using Model (1), and the regression results are presented in columns (8) and (9) of Table 3. The coefficients of NIPMC are significantly negative, thus affirming that the main conclusions of the paper remain robust after eliminating the influence of potential confounding factors.
4.3.5. Exclusion of Contemporaneous Policies
Considering the potential impacts of the establishment of intellectual property courts (ipc), the National Innovative City pilot (nic), the National Smart City pilot (smart), and the Broadband China demonstration city (bbc) on the effectiveness of the NIPMC policy, this study excludes pilot counties of these four policies from the sample and conducts a new regression analysis, the results of which are shown in Table 4. Columns (1) to (5) present the regression results for PM2.5 concentrations, while columns (6) to (10) display results for the standard deviation of PM2.5. Moreover, acknowledging that excluding a single policy might not eliminate all confounding effects, this study also excludes pilot counties for all four policies and performs a new regression, with results presented in columns (5) and (10) of the table. The results indicate that the coefficients for NIPMC in columns (1) to (10) are all significantly negative. This suggests that, even after excluding the influence of concurrent policies, the main conclusions of the study remain robust.
Table 4.
Robustness test II.
4.4. Placebo Test
The placebo test is a statistical method used to verify the robustness of the Difference-in-Differences (DID) model and rule out spurious causal relationships. It randomly assigns individuals in the sample to treatment and control groups and repeats the procedure multiple times to assess model robustness and result reliability. The primary goal is to determine whether the observed effects stem from random factors or omitted variables, thereby strengthening the credibility of causal inference [77]. The placebo test proceeds in four steps: (1) randomly assign individuals in the sample to treatment and control groups, repeating the assignment a sufficient number of times (e.g., 1000) to obtain robust results; (2) conduct DID regressions for each assignment and record the policy effect coefficient; (3) summarize the placebo coefficients and construct a distribution to compare with the actual policy effect; and (4) analyze whether the actual coefficient significantly differs from the placebo distribution. The placebo test is passed if the actual policy coefficient lies outside the 95% or 99% confidence interval of the placebo distribution.
Figure 8 presents the placebo test results for PM2.5 concentration and standard deviation. The red curve shows the density distribution of the placebo estimates, centered near zero, indicating that randomly generated groups generally exhibit no significant policy effects. The dashed line represents the actual regression coefficient, which lies outside the placebo distribution, confirming that the true policy effect is not driven by random factors. Thus, the placebo test is passed.
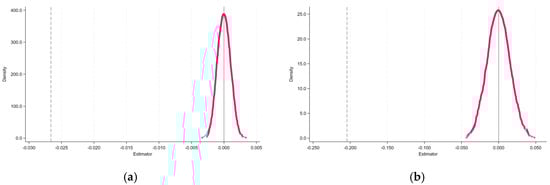
Figure 8.
PM2.5 concentration (a) and standard deviation (b) placebo test (1000 times) (Stata 18 software).
4.5. Endogeneity Test
4.5.1. SYS-GMM
We address potential endogeneity using the system GMM (SYS-GMM) estimator and employ the first lag of the dependent variables (L.pm25 and L.pm25b) as instruments. The results are reported in columns (1) and (2) of Table 5. The AR(1) test is significant while the AR(2) test is not, indicating first-order but not second-order serial correlation in the first-differenced residuals, which is consistent with the GMM assumptions. Moreover, the Sargan test of overidentifying restrictions is insignificant (p > 0.10), suggesting that the instruments are jointly valid and there is no evidence against their exogeneity. Taken together, these diagnostics indicate that our instrument choice is appropriate and that the SYS-GMM estimates are robust, thereby alleviating concerns about endogeneity in the model.
Table 5.
Endogeneity Test Results.
4.5.2. 2SLS
To mitigate potential endogeneity in the “National Intellectual Property Model City (NIPMC)” indicator—arising from policy selection bias and possible reverse causality—two-stage least squares (2SLS) is employed, with the total number of patent applications lagged two periods used as an instrument. The instrument choice rests on two considerations. (i) Relevance. Innovation activity exhibits persistence and path dependence: earlier (two-period lagged) patenting intensity is strongly correlated with the contemporaneous channels that affect our outcomes—namely the supply of cleaner technologies, adoption of clean production, and industrial restructuring—and, in turn, is associated with whether (and how strongly) a locality becomes/implements NIPMC. (ii) Exogeneity (exclusion). After controlling for region and year fixed effects, common shocks, and time trends, patent applications lagged two periods should not directly affect the current mean and standard deviation of PM2.5; their influence operates primarily through NIPMC status/intensity and the induced innovation and structural adjustment pathways, satisfying the exclusion restriction.
The diagnostic results are reported in columns (3)–(5) of Table 5: the Kleibergen–Paap rk LM statistic is significant in all specifications, rejecting underidentification and indicating that the model is identified; meanwhile, the Cragg–Donald Wald F statistic exceeds 16.38 across the board, surpassing commonly used Stock–Yogo critical thresholds and suggesting that weak instruments are not a concern (or at most negligible). Taken together, these diagnostics indicate that the instrument is both relevant and plausibly exogenous, that the 2SLS estimates are well identified with adequate instrument strength, and that endogeneity concerns in identifying the NIPMC → PM2.5 mean/standard deviation effects are effectively alleviated.
4.6. Mechanism Analysis
4.6.1. Innovation Effect
Referencing existing studies [78,79], this paper uses the number of invention patents (innov1) and the number of invention patents per 10,000 people (innov2) as proxy variables for the quality of innovation, and the number of utility model patents (innov3), design patents (innov4), and total patents (innov5) as proxy variables for the quantity of innovation. Separate regressions were conducted, and the results are displayed in columns (1) to (5) of Table 6. The coefficients for NIPMC are all positively significant. This indicates that NIPMC can promote the reduction of both the concentration and standard deviation of PM2.5 through an innovation effect. Thus, this paper confirms Hypothesis 2.
Table 6.
Mechanistic analysis.
4.6.2. Industrial Structure Effect
Referencing the existing literature [80], this study employs the proportion of the tertiary sector (is1), the sophistication of the industrial structure (is2), and the rationalization of the industrial structure (is3) as proxy variables for industrial structure, and conducts regressions accordingly. The regression results are presented in columns (6) to (8) of Table 6. The coefficients for NIPMC are all positively significant, indicating that NIPMC can effectively produce an industrial structure effect, thereby facilitating the reduction of both the concentration and standard deviation of PM2.5. Thus, this study confirms Hypothesis 3.
5. Analysis of Heterogeneity
5.1. Heterogeneity of Intellectual Property Rights Protection Level
According to the “China Intellectual Property Development Status Evaluation Report,” provinces such as Guangdong, Zhejiang, Jiangsu, Shandong, and Fujian have consistently ranked in the first and second tiers of the IP protection index. These provinces exhibit significantly higher figures in several metrics, including the number of IP cases accepted for first instance, case closure rates, the volume of cases approved for arrest and prosecution by prosecutorial authorities, and the number of administrative enforcement cases for patents, compared to other regions. In this study, the aforementioned five provinces are designated as high IP protection zones (High ipl), while the remaining provinces are classified as low IP protection zones. Regression analyses were conducted separately, with results presented in Table 7. Columns (1) and (2) of Table 7 show that the coefficients for NIPMC are −0.004 and −0.036, respectively, and are significant at the 1% level. This indicates that the impact of NIPMC on PM2.5 concentrations follows a “High ipl < Low ipl” pattern. Similarly, the influence of NIPMC on the standard deviation of PM2.5 also follows this pattern. To further substantiate these results, the study constructed a dummy variable “protection level (ipl)”—assigning a value of 1 to cities within the aforementioned five provinces and 0 to others—and interacted it with NIPMC to create the interaction term NIPMC_ipl. This interaction term was included in the regression model, and the regression results are visible in columns (3) and (6) of Table 7. The coefficients for NIPMC_ipl are positively significant, confirming the aforementioned conclusions.
Table 7.
Heterogeneity of IP protection levels.
Compared to areas with high IP protection, NIPMC is more effective in reducing the concentration and standard deviation of PM2.5 in regions with low IP protection. The primary reason for this is that these areas have a weaker foundation in IP protection, and their levels of technological innovation and application of environmental technologies are relatively low, resulting in higher PM2.5 concentrations and greater volatility. With the implementation of NIPMC, there is a significant enhancement in IP protection in these regions, which increases the enthusiasm of enterprises and individuals for research, development, and application of environmental technologies, thereby effectively reducing the overall emission concentrations of PM2.5. Additionally, due to the weaker technological base in areas of low protection, NIPMC introduces and promotes advanced pollution control technologies and clean production processes, significantly improving the overall level of local environmental technologies, reducing randomness and uncertainty in emissions, and thereby lowering the variability (standard deviation) of PM2.5 concentrations. The policy compensation effect is more pronounced in low-protection areas, where NIPMC effectively compensates for deficiencies in technological innovation and application, substantially increasing the adoption and implementation of environmental technologies, resulting in a significant reduction in both PM2.5 concentrations and standard deviations. Moreover, due to the lower baseline in low-protection areas, the policy effects of NIPMC are more evident, characterized by a significant decrease in both PM2.5 concentrations and standard deviations, demonstrating higher policy marginal effects. Therefore, NIPMC, by strengthening IP protection, significantly enhances the capabilities for technological innovation and application of environmental technologies in low IP protection areas, thereby effectively reducing both the average concentration and variability of PM2.5, and showing significant environmental governance outcomes.
5.2. Urban Grade Heterogeneity
Classifying cities by tier is intended to more accurately reflect differences in economic development, technological levels, and policy enforcement among different cities, as these differences can significantly affect the effectiveness of policy implementation and pollution control outcomes. In this study, the sample is divided into high-level cities (including provincial capitals and sub-provincial cities) and general cities, and regression analyses are conducted separately for these two categories. The results, as shown in Table 8, reveal that the coefficients of NIPMC in columns (1) and (2) are −0.001 and −0.036, respectively, with the former being not statistically significant. This indicates that the impact of NIPMC on PM2.5 concentration follows a pattern of “General City > High-level Cities”. Similarly, the influence of NIPMC on PM2.5 standard deviation also follows this pattern, suggesting that NIPMC is more effective in general cities than in high-level cities, possibly due to greater room for improvement or different initial conditions related to pollution and policy execution.
Table 8.
Urban grade heterogeneity.
Compared to higher-tier cities, NIPMC is more effective in reducing both the concentration and the standard deviation of PM2.5 in general cities, primarily due to the lower levels of economic development and technological innovation in these areas. This results in weaker infrastructure and technical support for pollution control, leading to higher and more volatile PM2.5 concentrations. Major sources of PM2.5 include industrial emissions, vehicle exhaust, construction dust, and smoke from combustion processes, which are more pronounced in general cities. NIPMC enhances IP protection, significantly boosting innovation capabilities in these cities and encouraging enterprises and individuals to increase research, development, and application of environmental protection technologies, particularly advanced pollution control equipment and clean production processes. This effectively reduces the overall emission concentrations of PM2.5. Additionally, due to the weaker technological base and policy implementation capabilities in general cities, NIPMC’s introduction and promotion of these advanced technologies significantly improve the precision and consistency of pollution source control, reducing randomness and uncertainty in emissions, thereby markedly decreasing the variability (standard deviation) of PM2.5 concentrations. The policy compensation effect is more pronounced in general cities where NIPMC compensates for deficiencies in technological innovation and application, significantly enhancing the adoption and implementation of environmental technologies. This reduces the diversity and uncertainty of pollution sources, leading to a notable reduction in both PM2.5 concentrations and standard deviations. Since general cities have lower foundations in IP and environmental technologies, the policy effects of NIPMC are more pronounced, evident in the significant decrease in PM2.5 concentrations and standard deviations, demonstrating higher policy marginal effects. Thus, by strengthening IP protection, NIPMC significantly enhances the technological innovation capacity and the application of environmental technologies in general cities, effectively lowering both the average concentration and variability of PM2.5, showing significant environmental governance outcomes.
5.3. Regional Heterogeneity
Following the division standards of the National Bureau of Statistics, this paper categorizes the samples into Eastern, Central, and Western regions (with Northeastern and Central merged as Central) and conducts regression analysis for each. Regression results, as shown in Table 9, indicate that the impact of NIPMC on PM2.5 concentration follows a pattern of “Western > Eastern > Central,” whereas the effect on PM2.5 standard deviation follows “Central > Western > Eastern.”
Table 9.
Regional heterogeneity.
In the Western region, due to lower levels of industrialization, economic development lags, and weaker environmental technology and infrastructure. NIPMC significantly enhances pollution control capabilities by introducing advanced IP protection and environmental technologies, thereby reducing PM2.5 concentrations. In contrast, the Eastern region, being more economically developed, already has a solid foundation in environmental protection but still faces significant industrial and transportation pollution. NIPMC further enhances IP protection in this region, encouraging innovation in environmental technologies within high-tech industries, and continuously reducing PM2.5 concentrations. The Central region, which is intermediate in terms of economic and technological levels, sees less application of environmental technologies pushed by NIPMC, resulting in a lower marginal effect of the policy and less noticeable reductions in PM2.5 concentrations compared to the Western region. Regarding the PM2.5 standard deviation, NIPMC significantly enhances the stability of environmental technologies in the Central region, reducing the randomness and uncertainty of emissions, thereby lowering the PM2.5 standard deviation. In the Western region, although the infrastructure is weaker, the introduction of a large number of advanced technologies through NIPMC has enhanced technological consistency, reduced emission randomness, and lowered the PM2.5 standard deviation. In the Eastern region, which already possesses a higher level of technological sophistication and policy enforcement, pollutant emissions are relatively stable, and NIPMC mainly consolidates and optimizes existing technologies, further reducing minor fluctuations in PM2.5 concentrations. Overall, the varying impacts of NIPMC on PM2.5 across different regions primarily stem from differences in economic development, technological bases, and policy execution capabilities.
6. Conclusions and Policy Recommendations
6.1. Conclusions
Using a non-balanced panel dataset of 2074 counties from 2005 to 2021, this paper employs a multi-time point difference-in-differences model to systematically demonstrate the relationship between NIPMC and PM2.5 concentration and its standard deviation, while also exploring potential innovation effects and industrial structure effects. The study arrives at the following three main conclusions: (1) NIPMC significantly promotes the reduction of PM2.5 concentration and standard deviation, a conclusion that holds true even after several robustness checks, indicating that NIPMC has a strong policy effect in improving air quality; (2) The analysis reveals that NIPMC can reduce PM2.5 concentration and standard deviation by enhancing innovation capabilities and optimizing industrial structure, specifically manifested in the improved research, development, and application of environmental technologies, and in the transition of high-pollution industries to low-pollution and high-value industries, thereby reducing the emissions and variability of pollutant concentrations; (3) The effect of NIPMC on reducing PM2.5 concentration is particularly pronounced in areas with low IP protection, general cities, and western cities, suggesting that in regions with weaker foundations, the innovation incentives and technical support provided by NIPMC are more likely to achieve significant results, while the impact of NIPMC on reducing the variability of PM2.5 concentration is more prominent in low IP protection areas, general cities, and central cities, indicating significant improvements in policy implementation and technological consistency in these regions, reducing the randomness and uncertainty of pollutant emissions. Overall, this research not only confirms the significant role of NIPMC in enhancing air quality but also reveals the profound impacts it generates through innovation and adjustments in industrial structure, providing robust empirical support for policymakers in advancing similar environmental governance policies across different regions.
6.2. Discussion
This paper primarily reveals the significant impact of NIPMC on reducing PM2.5, a conclusion that aligns with existing research [33]. However, compared to that study, this paper delves deeper into the relationship between NIPMC and PM2.5. Firstly, while existing research has only explored the relationship between NIPMC and PM2.5 concentration, this paper further investigates the relationship between NIPMC and both PM2.5 concentration and its standard deviation, which is a significant extension. By analyzing both PM2.5 concentration and standard deviation, this paper not only reveals the effect of NIPMC in reducing average pollutant concentration but also shows its role in reducing the variability of air quality and enhancing air quality stability. This dual analytical approach provides a more comprehensive perspective, aiding in understanding the comprehensive impact of NIPMC on air pollution control and ensuring a thorough assessment of policy effects, thus enhancing the scientific accuracy and specificity of policy-making and environmental governance. Secondly, existing research primarily uses data from prefecture-level cities, whereas this paper employs county-level data. Given that NIPMC pilots include not only prefecture-level cities but also some county-level cities, using county-level data allows for a more accurate assessment of the actual effects of NIPMC policy, providing a more detailed and comprehensive understanding of the policy’s impact. Such an approach more accurately reflects the effects of NIPMC across different administrative levels and smaller geographic units, enhancing the reliability and applicability of the research findings.
This study has several limitations. First, although new NIPMC pilot projects were launched in 2022, county-level data for 2022 and subsequent years are not yet available, preventing assessment of the policy effects of these newer pilots. Second, due to substantial gaps in county-level statistics, not all districts and counties in China are included, which constrains the precision and representativeness of the estimated effects. Third, the analysis does not explicitly account for potential spillover effects of NIPMC on neighboring non-pilot regions; if pilot cities affect adjacent areas’ PM2.5 levels and variability through technology diffusion, industrial linkages, or collaborative governance, our DID estimates may be biased. These limitations highlight the need for more timely and comprehensive data collection and for future work that incorporates spatial weight matrices and spatial DID/econometric models to more accurately identify the net impacts of NIPMC across regions. Forth, the conceptual link between intellectual property and air pollution is not always sufficiently robust, and some arguments appear more normative than empirically grounded. The study is highly specific to the Chinese context, which limits the generalizability of its conclusions to other settings. The discussion of methodological limitations is rather brief, with insufficient attention paid to potential endogeneity in the selection of demonstration cities. While the references are numerous and largely relevant, there is limited engagement with international literature beyond China.
6.3. Policy Recommendations
Based on the above research conclusions, this paper puts forward targeted policy suggestions:
- (1)
- Expand demonstration zones in a region-specific manner, with full attention to heterogeneity. Evidence indicates that the NIPMC significantly suppresses PM2.5 concentrations in the eastern and central regions, while the effect is less pronounced in the west. The underlying reasons include a stronger technological base and higher marketization in the east, ongoing industrial upgrading and rising innovation potential in the central region, and the west’s continued absorption of some high-pollution industry transfers from the east and central regions. Accordingly, expansion of demonstration zones should be differentiated: in the east, establish sites in counties with weaker industrial bases but strong innovation potential, and deepen the integration of IP protection with high-tech industries; in the central region, align with the “Rise of Central China” strategy, select critical nodes along traditional energy-intensive value chains, and build pilots that integrate “technological retrofitting—green supply chains—coordinated governance”; in the west, prioritize cities (or industrial parks) with better resource conditions and urgent upgrading needs, coupled with infrastructure and talent-attraction policies, and avoid negative effects from the simple relocation of high-pollution industries.
- (2)
- Amplify innovation and industrial restructuring effects in a targeted, region-appropriate way. The NIPMC reduces pollution primarily by fostering technological innovation and optimizing industrial structure, but the operative pathways differ across regions: the east should emphasize frontier environmental technologies and patent quality (e.g., carbon capture and energy storage), build IP operation and service platforms, and accelerate commercialization; the central region should focus on “stock retrofitting + incremental upgrading,” implement differentiated emission standards and green-finance support in steel, building materials, chemicals, and related chains, and build green supply chains; the west should prioritize basic energy-efficiency improvements and clean-energy substitution, deploy solar and wind technologies to lower baseline emissions, and strengthen vocational training and university–industry collaboration to build a sustainable pipeline of technical talent.
- (3)
- Strengthen institutions and capabilities in areas with weak IP protection. Studies suggest that where IP protection is weaker, the NIPMC’s PM2.5-reduction effects are more pronounced. Pilot expansion should therefore prioritize these regions and establish a closed-loop system of enforcement, adjudication, and public services: set up fast-track IP protection channels and specialized tribunals, enhance administrative enforcement coordination, and improve public IP service platforms to provide search, portfolio design, and commercialization guidance for firms. Promote green-technology demonstration projects jointly led by universities, research institutes, firms, and local governments, and encourage pilots in data IP and software patents. Complementary fiscal, tax, and insurance instruments should lower firms’ innovation risk premia in weaker IP environments and incentivize local technological upgrading.
- (4)
- Build differentiated implementation and evaluation mechanisms. Regional heterogeneity also manifests in regulatory intensity, education investment, and industrial structure. We therefore recommend a zoned performance and dynamic adjustment framework: the east should focus on high-quality innovation outputs and international collaboration (e.g., counts of high-value green patents, participation in international standards); the central region should emphasize enforcement consistency and cross-jurisdictional joint action (e.g., river-basin and city-cluster air-quality governance, transparency of enforcement); the west should prioritize basic emission-reduction outcomes and clean-technology penetration (e.g., declines in energy use and emissions per unit of output, shares of wind/solar capacity). Local governments should set annual targets, conduct mid-term evaluations, adjust policy parameters based on observed outcomes, and deploy a mix of incentives and sanctions via fiscal and financial tools to ensure continuous improvement and regionally balanced progress.
Author Contributions
Conceptualization, Y.W.; methodology, Y.W.; methodology, S.C.; software, Y.W.; validation, Y.W., S.Z. and Z.Z.; formal analysis, Y.W.; investigation, Y.W.; resources, Y.W.; data curation, Y.W.; writing—original draft preparation, Y.W.; writing—review and editing, Y.W.; visualization, Y.W.; supervision, Y.W.; project administration, Y.W.; funding acquisition, S.Z. All authors have read and agreed to the published version of the manuscript.
Funding
This study is supported by the Heilongjiang Provincial Philosophy and Social Science Research Planning Project: “The Evolution Mechanism and Realization Path of New Quality Productive Forces in Manufacturing Empowered by Digital-Real Integration,” Project Number: 24JLH002.
Institutional Review Board Statement
Not applicable.
Informed Consent Statement
Not applicable.
Data Availability Statement
All data used in this study are available from the corresponding author upon request.
Acknowledgments
During the preparation of this manuscript/study, the author(s) used ChatGPT 4.0 for the purposes of translation and language editing. The authors have reviewed and edited the output and take full responsibility for the content of this publication.
Conflicts of Interest
The authors declare no conflicts of interest.
Abbreviations
The following abbreviations are used in this manuscript:
| IP | Intellectual Property |
| NIPMC | National Intellectual Property Model Cities |
References
- Burke, M.; Childs, M.L.; de la Cuesta, B.; Qiu, M.; Li, J.; Gould, C.F.; Heft-Neal, S.; Wara, M. The Contribution of Wildfire to PM2.5 Trends in the USA. Nature 2023, 622, 761–766. [Google Scholar] [CrossRef]
- Colmer, J.; Hardman, I.; Shimshack, J.; Voorheis, J. Disparities in PM2.5 Air Pollution in the United States. Science 2020, 369, 575–578. [Google Scholar] [CrossRef]
- Currie, J.; Voorheis, J.; Walker, R. What Caused Racial Disparities in Particulate Exposure to Fall? New Evidence from the Clean Air Act and Satellite-Based Measures of Air Quality. Am. Econ. Rev. 2023, 113, 71–97. [Google Scholar] [CrossRef]
- Wu, X.; Braun, D.; Schwartz, J.; Kioumourtzoglou, M.A.; Dominici, F. Evaluating the Impact of Long-Term Exposure to Fine Particulate Matter on Mortality among the Elderly. Sci. Adv. 2020, 6, eaba5692. [Google Scholar] [CrossRef]
- Calderón-Garcidueñas, L.; Ayala, A. Fine Particle Air Pollution and Lung Cancer Risk: Extending the Long List of Health Risks. Cell 2023, 186, 2285–2287. [Google Scholar] [CrossRef]
- Feng, Y.; Castro, E.; Wei, Y.; Jin, T.; Qiu, X.; Dominici, F.; Schwartz, J. Long-Term Exposure to Ambient PM2.5, Particulate Constituents and Hospital Admissions from Non-Respiratory Infection. Nat. Commun. 2024, 15, 1518. [Google Scholar] [CrossRef] [PubMed]
- Hill, W.; Lim, E.L.; Weeden, C.E.; Lee, C.; Augustine, M.; Chen, K.; Kuan, F.-C.; Marongiu, F.; Evans, E.J.; Moore, D.A.; et al. Lung Adenocarcinoma Promotion by Air Pollutants. Nature 2023, 616, 159–167. [Google Scholar] [CrossRef]
- Delavar, M.A.; Jahani, M.a.; Sepidarkish, M.; Alidoost, S.; Mehdinezhad, H.; Farhadi, Z. Relationship between Fine Particulate Matter (PM2.5) Concentration and Risk of Hospitalization Due to Chronic Obstructive Pulmonary Disease: A Systematic Review and Meta-Analysis. BMC Public Health 2023, 23, 2229. [Google Scholar] [CrossRef] [PubMed]
- Li, T.; Zhang, Y.; Wang, J.; Xu, D.; Yin, Z.; Chen, H.; Lv, Y.; Luo, J.; Zeng, Y.; Liu, Y.; et al. All-Cause Mortality Risk Associated with Long-Term Exposure to Ambient PM2.5 in China: A Cohort Study. Lancet Public Health 2018, 3, E470–E477. [Google Scholar] [CrossRef] [PubMed]
- Zhan, Y.; Xie, M.; Zhao, W.; Wang, T.; Gao, D.; Chen, P.; Tian, J.; Zhu, K.; Li, S.; Zhuang, B.; et al. Quantifying the Seasonal Variations in and Regional Transport of PM2.5 in the Yangtze River Delta Region, China: Characteristics, Sources, and Health Risks. Atmos. Chem. Phys. 2023, 23, 9837–9852. [Google Scholar] [CrossRef]
- Nan, N.; Yan, Z.; Zhang, Y.; Chen, R.; Qin, G.; Sang, N. Overview of PM2.5 and Health Outcomes: Focusing on Components, Sources, and Pollutant Mixture Co-Exposure. Chemosphere 2023, 323, 138181. [Google Scholar] [CrossRef]
- Feng, X.; Tian, Y.; Xue, Q.; Song, D.; Huang, F.; Feng, Y. Measurement Report: Spatiotemporal and Policy-Related Variations of PM2.5 Composition and Sources during 2015–2019 at Multiple Sites in a Chinese Megacity. Atmos. Chem. Phys. 2021, 21, 16219–16235. [Google Scholar] [CrossRef]
- Srivastava, D.; Xu, J.; Vu, T.V.; Liu, D.; Li, L.; Fu, P.; Hou, S.; Moreno Palmerola, N.; Shi, Z.; Harrison, R.M. Insight into PM2.5 Sources by Applying Positive Matrix Factorization (PMF) at Urban and Rural Sites of Beijing. Atmos. Chem. Phys. 2021, 21, 14703–14724. [Google Scholar] [CrossRef]
- Song, C.; He, J.; Wu, L.; Jin, T.; Chen, X.; Li, R.; Ren, P.; Zhang, L.; Mao, H. Health Burden Attributable to Ambient PM2.5 in China. Environ. Pollut. 2017, 223, 575–586. [Google Scholar] [CrossRef]
- Ji, X.; Yao, Y.; Long, X. What Causes PM2.5 Pollution? Cross-Economy Empirical Analysis from Socioeconomic Perspective. Energy Policy 2018, 119, 458–472. [Google Scholar] [CrossRef]
- Shen, H.; Tao, S.; Chen, Y.; Ciais, P.; Guneralp, B.; Ru, M.; Zhong, Q.; Yun, X.; Zhu, X.; Huang, T.; et al. Urbanization-Induced Population Migration Has Reduced Ambient PM2.5 Concentrations in China. Sci. Adv. 2017, 3, e1700300. [Google Scholar] [CrossRef] [PubMed]
- Chen, Z.; Chen, D.; Zhao, C.; Kwan, M.; Cai, J.; Zhuang, Y.; Zhao, B.; Wang, X.; Chen, B.; Yang, J.; et al. Influence of Meteorological Conditions on PM2.5 Concentrations across China: A Review of Methodology and Mechanism. Environ. Int. 2020, 139, 105558. [Google Scholar] [CrossRef]
- Ma, Y.-R.; Ji, Q.; Fan, Y. Spatial Linkage Analysis of the Impact of Regional Economic Activities on PM2.5 Pollution in China. J. Clean. Prod. 2016, 139, 1157–1167. [Google Scholar] [CrossRef]
- He, G.; Liu, T.; Zhou, M. Straw Burning, PM2.5, and Death: Evidence from China. J. Dev. Econ. 2020, 145, 102468. [Google Scholar] [CrossRef]
- He, G.; Pan, Y.; Tanaka, T. The Short-Term Impacts of COVID-19 Lockdown on Urban Air Pollution in China. Nat. Sustain. 2020, 3, 1005–1011. [Google Scholar] [CrossRef]
- Lin, W.; He, Q.; Xiao, Y.; Yang, J. Do City Lockdowns Effectively Reduce Air Pollution? Technol. Forecast. Soc. Change 2023, 197, 122885. [Google Scholar] [CrossRef]
- Chen, G.; Guo, Y.; Yue, X.; Tong, S.; Gasparrini, A.; Bell, M.L.; Ben, A.; Schwartz, J.; Jaakkola, J.J.K.; Zanobetti, A.; et al. Mortality Risk Attributable to Wildfire-Related PM2.5 Pollution: A Global Time Series Study in 749 Locations. Lancet Planet. Health 2021, 5, E579–E587. [Google Scholar] [CrossRef] [PubMed]
- Liu, J.-Y.; Woodward, R.T.; Zhang, Y.-J. Has Carbon Emissions Trading Reduced PM2.5 in China? Environ. Sci. Technol. 2021, 55, 6631–6643. [Google Scholar] [CrossRef] [PubMed]
- Cai, S.; Wang, Y.; Zhao, B.; Wang, S.; Chang, X.; Hao, J. The Impact of the “Air Pollution Prevention and Control Action Plan” on PM2.5 Concentrations in Jing-Jin-Ji Region during 2012–2020. Sci. Total Environ. 2017, 580, 197–209. [Google Scholar] [CrossRef]
- Yue, H.; He, C.; Huang, Q.; Yin, D.; Bryan, B.A. Stronger Policy Required to Substantially Reduce Deaths from PM2.5 Pollution in China. Nat. Commun. 2020, 11, 1462. [Google Scholar] [CrossRef]
- Liu, H.; Liu, J.; Li, M.; Gou, P.; Cheng, Y. Assessing the Evolution of PM2.5 and Related Health Impacts Resulting from Air Quality Policies in China. Environ. Impact Assess. Rev. 2022, 93, 106727. [Google Scholar] [CrossRef]
- Chen, J.; Luo, W.; Ren, X.; Liu, T. The Local-Neighborhood Effects of Low-Carbon City Pilots Program on PM2.5 in China: A Spatial Difference-in-Differences Analysis. Sci. Total Environ. 2023, 857, 159511. [Google Scholar] [CrossRef]
- Cui, H.; Cao, Y. Do Smart Cities Have Lower Particulate Matter 2.5 (PM2.5)? Evidence from China. Sustain. Cities Soc. 2022, 86, 104082. [Google Scholar] [CrossRef]
- Zhu, X.; Dai, C.; Wei, Y. Does the Opening of High-Speed Railway Improve Air Quality? Evidence from China. Socioecon. Plann. Sci. 2022, 84, 101381. [Google Scholar] [CrossRef]
- Wang, K.; Yin, H.; Chen, Y. The Effect of Environmental Regulation on Air Quality: A Study of New Ambient Air Quality Standards in China. J. Clean. Prod. 2019, 215, 268–279. [Google Scholar] [CrossRef]
- Jiang, W.; Jiang, N.; Ge, L. How Do Intellectual Property Demonstration Cities Contribute to Low-Carbon Development? Evidence from China. Environ. Sci. Pollut. Res. 2023, 30, 92007–92026. [Google Scholar] [CrossRef]
- Qian, L.; Zhou, Y.; Sun, Y.; Zhou, Q.; Zhang, M. Carbon Emission Reduction Effects of Intellectual Property Institution Construction in China. Environ. Sci. Pollut. Res. 2023, 30, 70569–70591. [Google Scholar] [CrossRef]
- Lv, K.; Pan, M.; Huang, L.; Song, D.; Qian, X. Can Intellectual Property Rights Protection Reduce Air Pollution? A Quasi-Natural Experiment from China. Struct. Change Econ. Dyn. 2023, 65, 210–222. [Google Scholar] [CrossRef]
- Bodenhausen, G.H.C. (Ed.) Guide to the Application of the Paris Convention for the Protection of Industrial Property; World Intellectual Property Organization: Geneva, Switzerland, 1969; ISBN 978-92-805-0368-5. [Google Scholar]
- Campi, M.; Duenas, M. Intellectual Property Rights and International Trade of Agricultural Products. World Dev. 2016, 80, 1–18. [Google Scholar] [CrossRef]
- Li, W.; Yu, X. China’s Intellectual Property Protection Strength and Its Evaluation-Based on the Accession to TRIPS Agreement (Agreement on Trade-Related Aspects of Intellectual Property Rights). R&D Manag. 2015, 45, 397–410. [Google Scholar] [CrossRef]
- Zhuang, W. Intellectual Property Rights and Climate Change: Interpreting the TRIPS Agreement for Environmentally Sound Technologies; Cambridge University Press: Cambridge, UK, 2017; ISBN 978-1-107-15808-5. [Google Scholar]
- OECD. Patents in Environment-Related Technologies: Technology Diffusion and Patent Protection (Edition 2021); Organisation for Economic Co-Operation and Development: Paris, France, 2022. [Google Scholar]
- Hall, B.H.; Helmers, C. The Role of Patent Protection in (Clean/Green) Technology Transfer; National Bureau of Economic Research: Cambridge, MA, USA, 2010. [Google Scholar]
- Palm, A. Innovation Systems for Technology Diffusion: An Analytical Framework and Two Case Studies. Technol. Forecast. Soc. Change 2022, 182, 121821. [Google Scholar] [CrossRef]
- Leung, D.M.; Tai, A.P.K.; Mickley, L.J.; Moch, J.M.; van Donkelaar, A.; Shen, L.; Martin, R.V. Synoptic Meteorological Modes of Variability for Fine Particulate Matter (PM2.5) Air Quality in Major Metropolitan Regions of China. Atmos. Chem. Phys. 2018, 18, 6733–6748. [Google Scholar] [CrossRef]
- Giannossa, L.C.; Cesari, D.; Merico, E.; Dinoi, A.; Mangone, A.; Guascito, M.R.; Contini, D. Inter-Annual Variability of Source Contributions to PM10, PM2.5, and Oxidative Potential in an Urban Background Site in the Central Mediterranean. J. Environ. Manag. 2022, 319, 115752. [Google Scholar] [CrossRef] [PubMed]
- Hao, W.; Gao, B.; Liang, B.; Chen, J.; Dong, L.; Wang, Z.; Tian, M. Distinct Seasonal Variability of Source-Dependent Health Risks from PM2.5-Bound PAHs and Related Derivatives in a Megacity, Southwest China: Implications for the Significance of Secondary Formation. Sci. Total Environ. 2023, 885, 163742. [Google Scholar] [CrossRef]
- Jain, S.; Sharma, S.K.; Vijayan, N.; Mandal, T.K. Investigating the Seasonal Variability in Source Contribution to PM2.5 and PM10 Using Different Receptor Models during 2013–2016 in Delhi, India. Environ. Sci. Pollut. Res. 2021, 28, 4660–4675. [Google Scholar] [CrossRef] [PubMed]
- Andrade-Rojas, M.G.; Saldanha, T.J.V.; Kathuria, A.; Khuntia, J.; Boh, W. How Information Technology Overcomes Deficiencies for Innovation in Small and Medium-Sized Enterprises: Closed Innovation vs. Innovation. Inf. Syst. Res. 2024, 35, 1981–2012. [Google Scholar] [CrossRef]
- Donges, A.; Meier, J.-M.; Silva, R.C. The Impact of Institutions on Innovation. Manag. Sci. 2023, 69, 1951–1974. [Google Scholar] [CrossRef]
- Xiao, F. Non-Competes and Innovation: Evidence from Medical Devices. Res. Policy 2022, 51, 104527. [Google Scholar] [CrossRef]
- Mehlig Sweet, C.; Eterovic Maggio, D.S. Do Stronger Intellectual Property Rights Increase Innovation? World Dev. 2015, 66, 665–677. [Google Scholar] [CrossRef]
- Song, Q.; Zhong, Q.; Zeng, S. Intellectual Property Protection, Financial Innovation and Corporate Innovation: Evidence from a Quasi-Natural Experiment in China. Emerg. Mark. Financ. Trade 2024, 60, 358–370. [Google Scholar] [CrossRef]
- Shen, Y.; Zhang, X. Intelligent Manufacturing, Green Technological Innovation and Environmental Pollution. J. Innov. Knowl. 2023, 8, 100384. [Google Scholar] [CrossRef]
- Zhou, X.; Cai, Z.; Tan, K.H.; Zhang, L.; Du, J.; Song, M. Technological Innovation and Structural Change for Economic Development in China as an Emerging Market. Technol. Forecast. Soc. Change 2021, 167, 120671. [Google Scholar] [CrossRef]
- Su, Y.; Fan, Q. Renewable Energy Technology Innovation, Industrial Structure Upgrading and Green Development from the Perspective of China’s Provinces. Technol. Forecast. Soc. Change 2022, 180, 121727. [Google Scholar] [CrossRef]
- Chen, F.; Wang, M.; Pu, Z. The Impact Impact of Technological Innovation on Air Pollution: Firm-Level Evidence from China. Technol. Forecast. Soc. Change 2022, 177, 121521. [Google Scholar] [CrossRef]
- Popp, D. International Innovation and Diffusion of Air Pollution Control Technologies: The Effects of NOx and SO2 Regulation in the US, Japan, and Germany. J. Environ. Econ. Manag. 2006, 51, 46–71. [Google Scholar] [CrossRef]
- Davis, D.R. The Home Market, Trade, and Industrial Structure. Am. Econ. Rev. 1998, 88, 1264–1276. [Google Scholar]
- Griffin, J.M.; Karolyi, G.A. Another Look at the Role of the Industrial Structure of Markets for International Diversification Strategies. J. Financ. Econ. 1998, 50, 351–373. [Google Scholar] [CrossRef]
- Lan, J.; Wei, Y.; Guo, J.; Li, Q.; Liu, Z. The Effect of Green Finance on Industrial Pollution Emissions: Evidence from China. Resour. Policy 2023, 80, 103156. [Google Scholar] [CrossRef]
- Su, W.; Xie, C. High-Speed Rail, Technological Improvement, and PM2.5: Evidence from China. Econ. Anal. Policy 2023, 80, 1349–1362. [Google Scholar] [CrossRef]
- Baker, A.C.; Larcker, D.F.; Wang, C.C.Y. How Much Should We Trust Staggered Difference-in-Differences Estimates? J. Financ. Econ. 2022, 144, 370–395. [Google Scholar] [CrossRef]
- Card, D.; Krueger, A.B. Minimum Wages and Employment: A Case Study of the Fast Food Industry in New Jersey and Pennsylvania; National Bureau of Economic Research: Cambridge, MA, USA, 1993. [Google Scholar]
- Imbens, G.W.; Wooldridge, J.M. Recent Developments in the Econometrics of Program Evaluation. J. Econ. Lit. 2009, 47, 5–86. [Google Scholar] [CrossRef]
- Beck, T.; Levine, R.; Levkov, A. Big Bad Banks? The Winners and Losers from Bank Deregulation in the United States. J. Financ. 2010, 65, 1637–1667. [Google Scholar] [CrossRef]
- Baron, R.M.; Kenny, D.A. The Moderator–Mediator Variable Distinction in Social Psychological Research: Conceptual, Strategic, and Statistical Considerations. J. Pers. Soc. Psychol. 1986, 51, 1173–1182. [Google Scholar] [CrossRef]
- Jiang, T. Mediating and Moderating Effects in Empirical Studies of Causal Inference. China Ind. Econ. 2022, 5, 100–120. [Google Scholar] [CrossRef]
- Shen, S.; Li, C.; van Donkelaar, A.; Jacobs, N.; Wang, C.; Martin, R.V. Enhancing Global Estimation of Fine Particulate Matter Concentrations by Including Geophysical a Priori Information in Deep Learning. ACS ES&T Air 2024, 1, 332–345. [Google Scholar] [CrossRef]
- van Donkelaar, A.; Hammer, M.S.; Bindle, L.; Brauer, M.; Brook, J.R.; Garay, M.J.; Hsu, N.C.; Kalashnikova, O.V.; Kahn, R.A.; Lee, C.; et al. Monthly Global Estimates of Fine Particulate Matter and Their Uncertainty. Environ. Sci. Technol. 2021, 55, 15287–15300. [Google Scholar] [CrossRef]
- Han, D.; Attipoe, S.G.; Han, D.; Cao, J. Does Transportation Infrastructure Construction Promote Population Agglomeration? Evidence from 1838 Chinese County-Level Administrative Units. Cities 2023, 140, 104409. [Google Scholar] [CrossRef]
- Wang, Y.; Yan, Q.; Zhang, Q. Carbon Mitigation Performance of Top-down Administrative and Fiscal Decentralizations: Evidence from Quasi-Natural Experiments in China’s Pilot Counties. Sci. Total Environ. 2022, 852, 158404. [Google Scholar] [CrossRef] [PubMed]
- Donald, S.G.; Lang, K. Inference with Difference-in-Differences and Other Panel Data. Rev. Econ. Stat. 2007, 89, 221–233. [Google Scholar] [CrossRef]
- Bertrand, M.; Duflo, E.; Mullainathan, S. How Much Should We Trust Differences-In-Differences Estimates? Q. J. Econ. 2004, 119, 249–275. [Google Scholar] [CrossRef]
- Li, P.; Lu, Y.; Wang, J. Does Flattening Government Improve Economic Performance? Evidence from China. J. Dev. Econ. 2016, 123, 18–37. [Google Scholar] [CrossRef]
- Guo, Q.; Zhong, J. The Effect of Urban Innovation Performance of Smart City Construction Policies: Evaluate by Using a Multiple Period Difference-in-Differences Model. Technol. Forecast. Soc. Change 2022, 184, 122003. [Google Scholar] [CrossRef]
- Callaway, B.; Sant’Anna, P.H.C. Difference-in-Differences with Multiple Time Periods. J. Econom. 2021, 225, 200–230. [Google Scholar] [CrossRef]
- Arellano, M.; Bond, S. Some Tests of Specification for Panel Data: Monte Carlo Evidence and an Application to Employment Equations. Rev. Econ. Stud. 1991, 58, 277–297. [Google Scholar] [CrossRef]
- Abadie, A.; Imbens, G.W. Matching on the Estimated Propensity Score. Econometrica 2016, 84, 781–807. [Google Scholar] [CrossRef]
- Caliendo, M.; Kopeinig, S. Some Practical Guidance for the Implementation of Propensity Score Matching. J. Econ. Surv. 2008, 22, 31–72. [Google Scholar] [CrossRef]
- La Ferrara, E.; Chong, A.; Duryea, S. Soap Operas and Fertility: Evidence from Brazil. Am. Econ. J. Appl. Econ. 2012, 4, 1–31. [Google Scholar] [CrossRef]
- Caragliu, A.; Del Bo, C.F. Smart Innovative Cities: The Impact of Smart City Policies on Urban Innovation. Technol. Forecast. Soc. Change 2019, 142, 373–383. [Google Scholar] [CrossRef]
- Cornaggia, J.; Mao, Y.; Tian, X.; Wolfe, B. Does Banking Competition Affect Innovation? J. Financ. Econ. 2015, 115, 189–209. [Google Scholar] [CrossRef]
- Gan, C.; Zheng, R.; Yu, D. An Empirical Study on the Effects of Industrial Structure on Economic Growth and Fluctuations in China. Econ. Res. Chin. 2011, 46, 4–16+31. [Google Scholar]
Disclaimer/Publisher’s Note: The statements, opinions and data contained in all publications are solely those of the individual author(s) and contributor(s) and not of MDPI and/or the editor(s). MDPI and/or the editor(s) disclaim responsibility for any injury to people or property resulting from any ideas, methods, instructions or products referred to in the content. |
© 2025 by the authors. Licensee MDPI, Basel, Switzerland. This article is an open access article distributed under the terms and conditions of the Creative Commons Attribution (CC BY) license (https://creativecommons.org/licenses/by/4.0/).