Abstract
This study investigated how moss species identity and coverage density influence soil organic carbon (OC), total nitrogen (TN), total phosphorus (TP), cation exchange capacity (CEC), and stoichiometric ratios (C/N, C/P, N/P ratios) across soil depths in karst ecosystems of northern Guangxi, China. Spectral responses to moss cover were concurrently analyzed. Soil properties under moss crusts and bare controls were quantified through chemical assays. Coverage effects were compared via bar charts (sparse) and point-line plots (dense) with fitted curves and 95% confidence intervals. Spectral reflectance (250–2500 nm) was measured to characterize surface optical properties. Statistical correlations between variables were established. Research has shown the following: (1) Moss coverage significantly enhanced OC, TN, and CEC versus bare soil (B. dichotomum showed the strongest improvement: dense crust increased OC/TN/TP by 6.37/1.73/0.45 g kg−1 and doubled CEC). (2) All nutrients and CEC decreased with depth, most sharply for G. humillimum OC (22.38% reduction at 3–6 cm) and P. yokohamae CEC (9.97% reduction). (3) Stoichiometric ratios exhibited species-specific responses: B. dichotomum had the smallest inter-layer differences in C/N/P ratios, while G. humillimum increased C/N by 34.33% at 3–6 cm. Sparse coverage elevated N/P ratios up to 59.38% (G. humillimum, 0–3 cm). (4) Spectral analysis revealed the following: Sparse coverage boosted reflectance via edge scattering and soil background contributions. Dense coverage suppressed reflectance due to water absorption (1450/1900 nm) and limited scattering. Bare soil exhibited persistently low reflectance from hematite absorption (500–700 nm). Moss biocrusts—particularly dense B. dichotomum—optimize topsoil fertility and CEC in karst soils, though effects diminish sharply below 3 cm. Spectral signatures provide non-invasive indicators of coverage density and erosion resistance. These insights highlight the crucial role of species-specific moss selection in promoting sustainable restoration practices and long-term ecological recovery in rocky desertification regions.
1. Introduction
Soils in karst rocky desertification areas experience severe erosion, with bedrock persistently exposed to degradation risks that ultimately drive land desertification [1]. The fragile and unique karst ecosystem of Northern Guangxi exacerbates soil deterioration, characterized by nutrient deficiency, high bedrock exposure rates, and sparse vegetation. Given these constraints, approximately 10,000 years are required to form a 2.47 cm soil layer in this region [2]. Within the context of sustainable development in Southwest China, karst rocky desertification represents one of the most critical natural disasters causing soil and water loss [3]. Protecting degraded soils and sparse surface vegetation can effectively mitigate desertification progression. Through targeted restoration measures, vegetation coverage gradually expands, desertification rates decline, and ecosystems can achieve maximal recovery [4]. Soils affected by desertification consistently exhibit carbon loss, phosphorus deficiency, and nitrogen limitation. As desertification intensifies, OC, TN, and TP contents decrease significantly, while stoichiometric ratios (e.g., C/N, C/P) deviate from ecological equilibrium thresholds [5]. Studies confirm that non-desertified soils contain significantly higher C, Nand P levels than moderately/severe desertified soils. In the latter, reduced vegetation cover and diminished microbial activity disrupt nutrient cycling, accelerating soil degradation [6]. Changes in stoichiometric ratios during desertification closely correlate with nutrient limitations: phosphorus limitation dominates potential/mild stages, whereas nitrogen limitation prevails in moderate/severe stages [7]. As a discipline deciphering elemental balance among ecosystem components, ecological stoichiometry provides a theoretical foundation for studying plant–soil nutrient interactions and guides targeted nutrient management in ecological restoration.
Biological soil crusts (BSCs) serve as pioneer plants for ecological restoration, demonstrating remarkable adaptability to harsh environments—particularly in karst terrains experiencing severe soil erosion [8]. These crusts constitute an integrated system formed by soil particles and organisms, which develop into surface crusts that establish dense moss mats tailored to specific ecosystems [9]. The moss crust layer significantly enhances topsoil microenvironments through (1) water interception, (2) increased surface roughness, and (3) secretion of organic acids. Research indicates moss coverage elevates SOC and TN content while promoting nutrient cycling via modulation of microbial community structure [10]. For instance, in karst vegetation restoration, moss transplantation significantly increased ammonium– and nitrate–nitrogen in surface soils, whereas moss removal reduced SOC and TN [11]. Furthermore, moss water-holding capacity and the C/N ratio directly influence soil carbon–nitrogen accumulation efficiency, though systematic investigation of their depth-dependent and coverage density responses remains needed.
CEC serves as a critical indicator of soil adsorption capability and fertility, reflecting its capacity to retain, supply, and buffer cationic nutrients [12]. CEC influences soil pH and organic matter content, with established negative correlations between pH and cation concentrations [13]. Conversely, CEC increases with organic matter content [14]. BSC development effectively enhances soil CEC and enriches biodiversity [15], offering novel insights for ecological restoration in rocky desertification areas. Existing studies have indicated that soil beneath moss crusts exhibits a higher CEC, suggesting that the crust enhances nutrient retention capacity. Over time, this promotes the colonization and growth of more moss plants, forming a virtuous ecological cycle—particularly in sandy environments [16]. Notably, the total leaching loss of base ions from soil covered by moss was found to be 112.0% higher compared to moss-free soil, demonstrating that moss significantly accelerates the weathering process of aeolian sandy soil minerals [17]. These findings highlight the positive role of moss coverage in improving and restoring sandy soils. As a dynamic biological regulator, moss coverage influences the ability of the soil matrix to retain nutrients, namely, through cation exchange capacity. Therefore, the simultaneous investigation of both CEC—an inherent geochemical property—and moss coverage—a dynamic biological layer—offers a more comprehensive understanding of the nutrient conservation capacity and long-term sustainability of ecosystems. Nevertheless, the impacts of moss coverage density on soil C/N/P content and CEC remain poorly understood.
The emergence of hyperspectral remote sensing technology offers a novel approach for assessing ecosystem health. This technique captures the fine spectral characteristics of surface objects within the 350–2500 nm range, enabling non-destructive quantification of the physicochemical properties of both soil and vegetation. For instance, in desert regions, hyperspectral technology has been successfully applied to identify and characterize BSCs, and the fusion of data from different spectral regions has significantly improved the accuracy of land cover classification [18]. Another study conducted in desert areas utilized the spectral sensitivity of water molecules within the soil beneath BSCs to reveal its potential for monitoring rainfall events [19]. Furthermore, research in central Spain assessed the α-diversity of BSCs by measuring hyperspectral images of collected samples [20]. Efforts have also been made in arid environments to establish transfer functions using hyperspectral remote sensing for estimating the net photosynthetic rates of BSCs [21]. Spectral features show strong water absorption in NIR and chlorophyll sensitivity in red edge, and VIS-NIR aids hematite identification. However, no relevant studies have been conducted in the karst region of northern Guangxi (Guibei), where the spectral characteristics of soil beneath the dominant native moss cover remain unclear.
This study investigates the karst rocky desertification ecosystem in Northern Guangxi, examining the distribution patterns of soil OC, TN, TP content, stoichiometric characteristics, and CEC across soil depths under three conditions: bare soil, sparse moss coverage, and dense moss coverage. It addresses a key scientific question: how do moss species and coverage density affect the spatial distribution and stoichiometric relationships of these soil properties? By integrating soil spectral properties, this study explores the underlying factors driving changes in these physicochemical parameters. The findings aim to provide theoretical foundations for targeted soil nutrient restoration in desertification-affected regions and contribute to the sustainable development of ecosystems.
2. Materials and Methods
2.1. Research Area
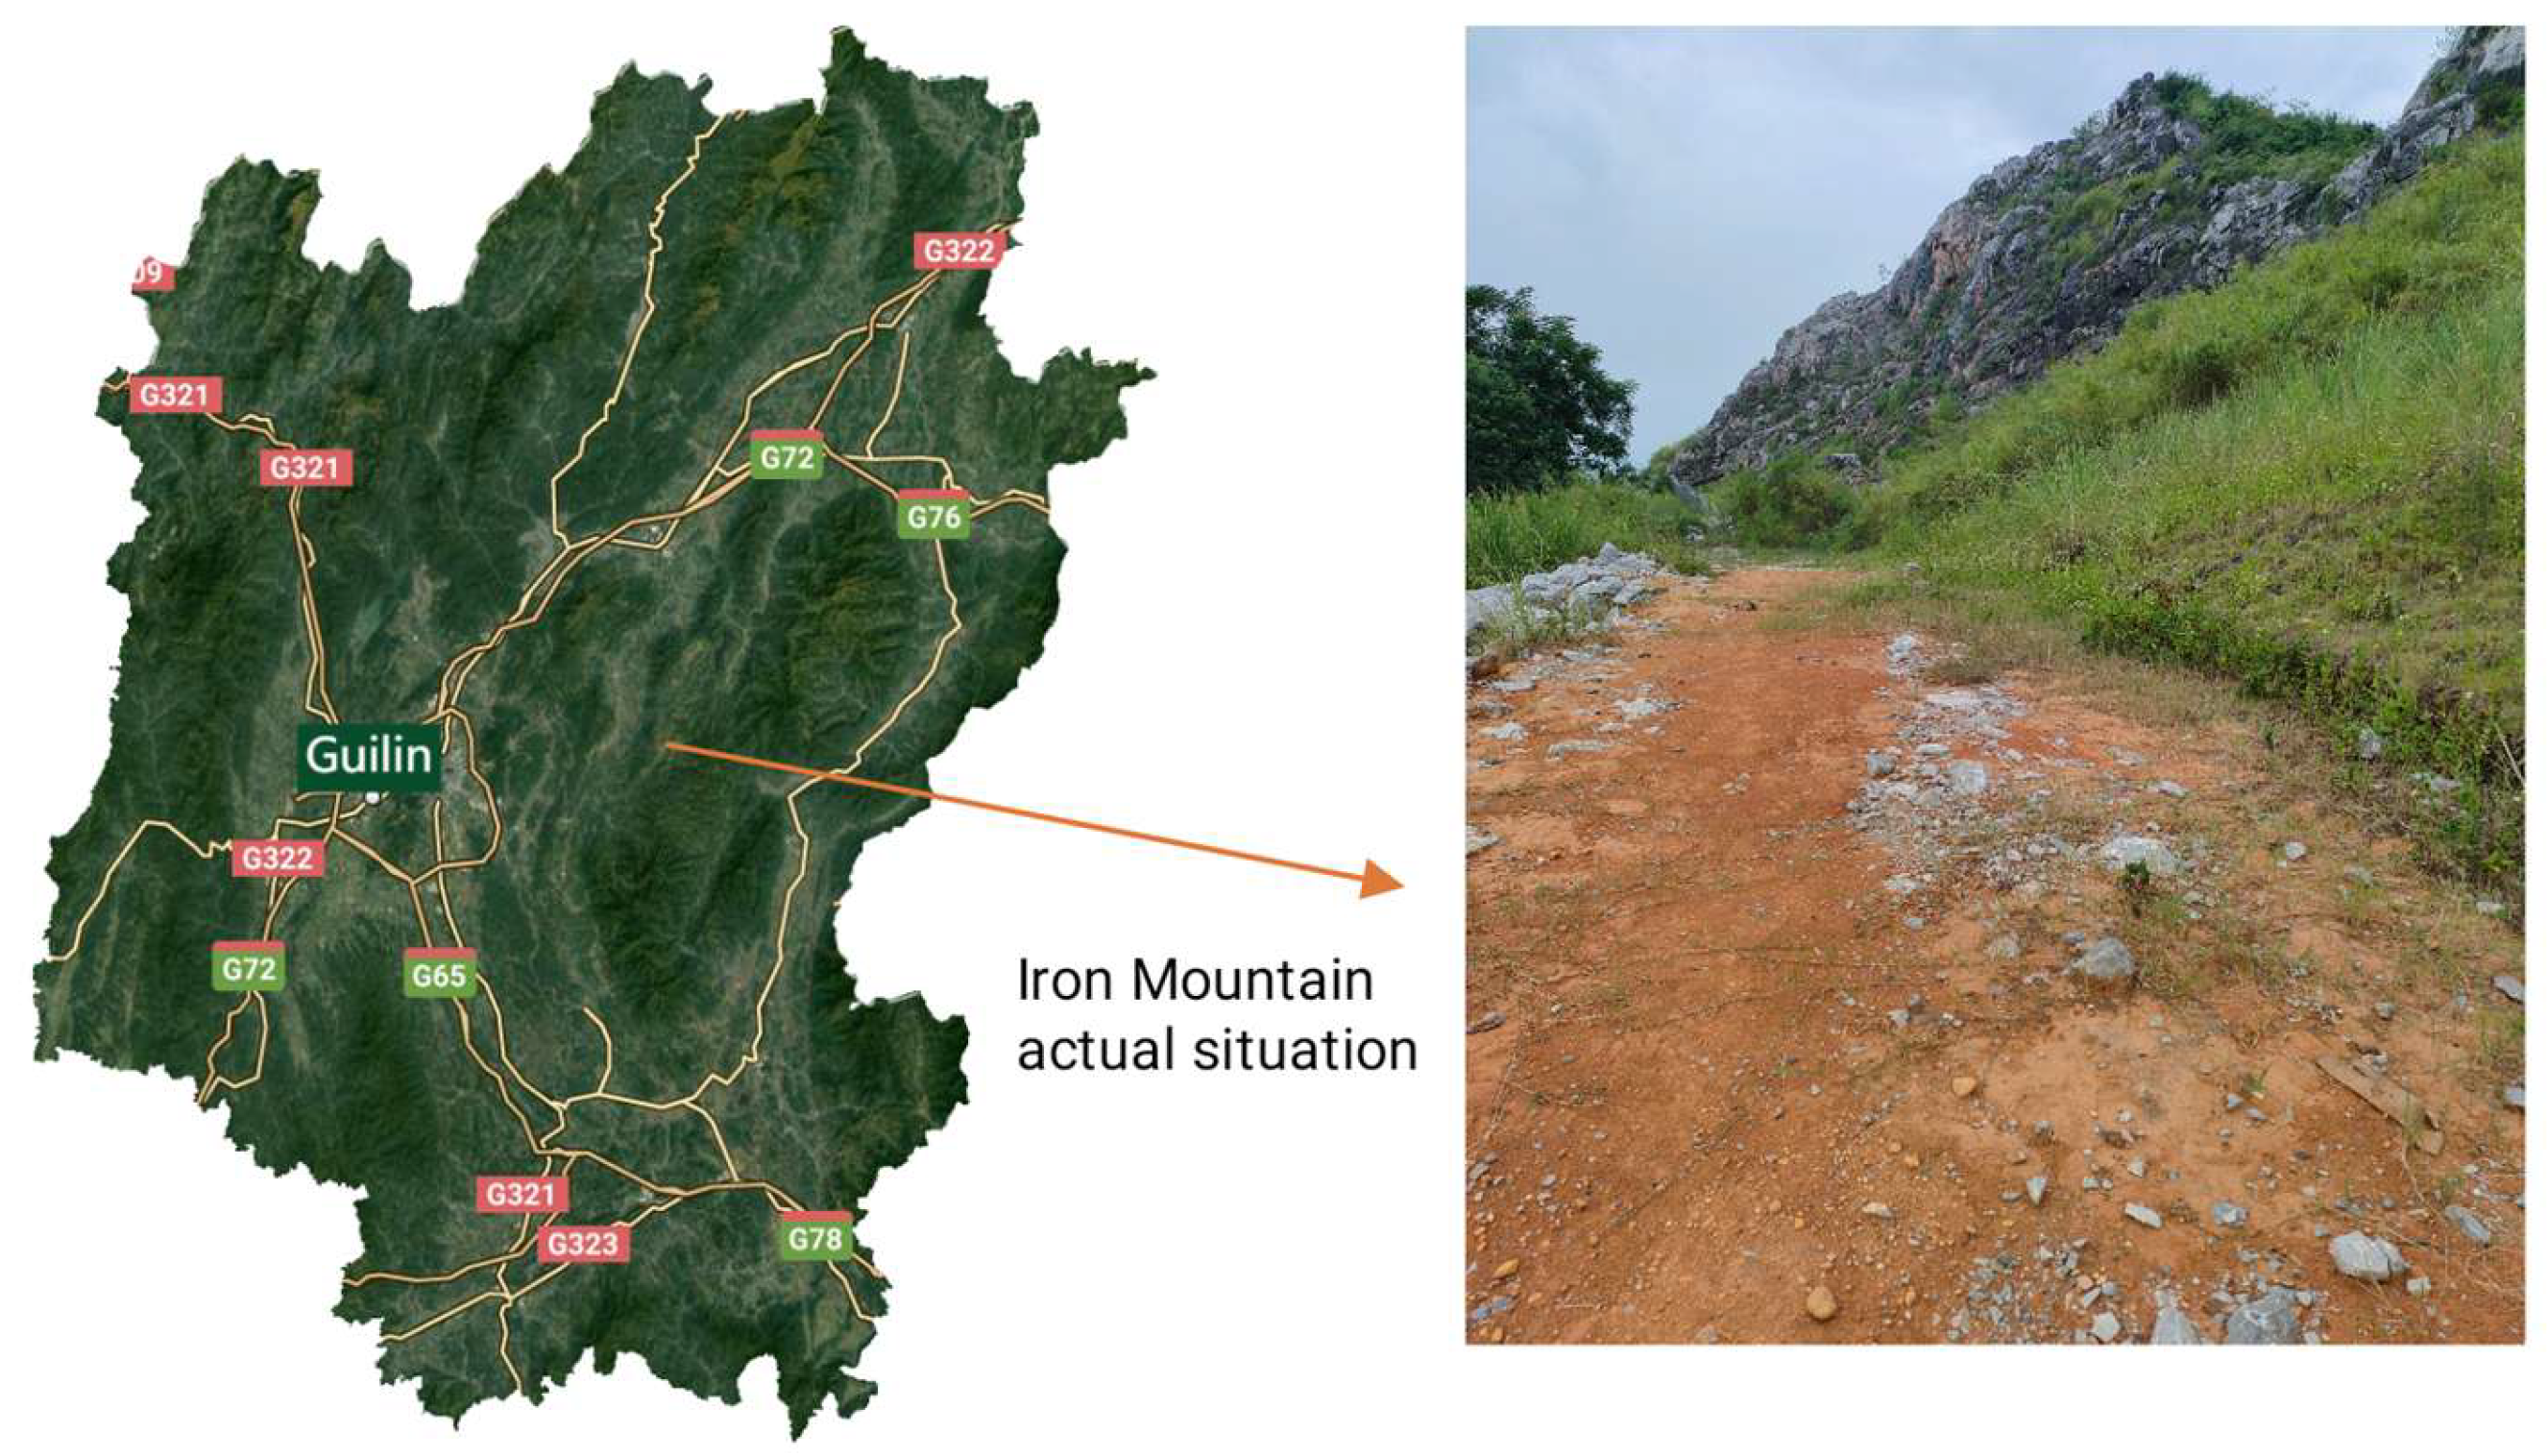
The study site is located at the Tieshan Quarry in Qixing District, Guilin City, Guangxi Zhuang Autonomous Region. Guilin City lies within a subtropical monsoon climate zone, characterized by favorable climatic conditions and four distinct seasons. The multi-year average annual precipitation in Guilin exceeds 2000 mm, with the maximum recorded annual rainfall reaching 2910.9 mm and the minimum being 1342.3 mm. Precipitation exhibits uneven seasonal distribution, with the high-flow season occurring from April to July each year. Rainfall during this period accounts for 61.6% of the total annual precipitation, leading to soil erosion phenomena in the karst region. Moss crusts hold significant ecological dominance in the study area. The predominant moss species include Bryum dichotomum, Pylaisiadelpha yokohamae, and Glyphomitrium humillimum. The three moss species were selected based on a systematic field survey in the karst region, using surface coverage as the key indicator. These species demonstrated high adaptability and dominance across various karst habitats (e.g., rock crevices, soil surfaces, and cliffs). As native dominant species, they represent the overall adaptive strategies of moss communities in karst ecosystems due to their physiological traits (e.g., tolerance to drought, high calcium, and poor soils). Studying these ecologically significant species allows for insights into the responses of moss layers and broader ecosystem functions such as soil conservation, carbon cycling, and biocrust formation. Field photographs of the karst study area are shown in Figure 1.
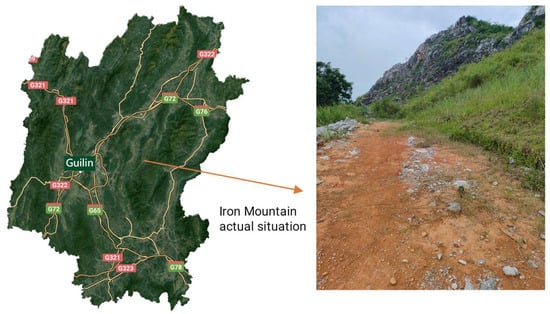
Figure 1.
Field photographs of the karst study area.
2.2. Experimental Design
To investigate soil OC, TN, TP content, and CEC under moss crusts with varying species and coverage levels, three distinct areas exhibiting extensive moss colonization were selected. These areas featured flat terrain devoid of large rock fragments and significant anthropogenic disturbance. Within each of the three moss coverage ranges, two distinct coverage levels were delineated: sparse coverage areas and dense coverage areas. The coverage of each moss species was measured using the grid-point counting method. A 10 cm × 10 cm quadrat frame, internally divided with a 5 × 5 grid of points, was used. The quadrat was randomly placed at the sampling site, and the condition directly beneath each intersection point was sequentially recorded. If moss was present beneath a point, it was recorded as “1”; if it was bare soil, rock, or other plants, it was recorded as “0”. The coverage was calculated using the following formula: (Number of points where moss is present/Total number of points) × 100%. Coverage > 70% can be considered dense, while coverage < 30% is generally considered sparse. For each coverage level, ten sampling points were selected. At each sampling point, three random quadrats were established. Soils from the three quadrats per coverage level were thoroughly mixed to form one composite sample. A mixed sample composed of three quadrats represents the results from the same moss species and under the same coverage level, facilitating subsequent physicochemical property determination and analysis. During sample collection, for bare soil, surface soil (0–3 cm) and subsurface soil (3–6 cm) layers were carefully excavated using a small shovel. For moss-covered soil, the moss crust layer (surface), underlying soil (0–3 cm), and subsoil (3–6 cm) were collected. All samples were then labeled according to their sequence numbers, sealed in plastic bags, and preserved for subsequent physicochemical and spectroscopic analyses. All freshly collected soil samples were preprocessed immediately upon arrival at the laboratory. Visible coarse fragments, including plant roots, litter, stones (>2 mm), and soil fauna, were first removed by hand. The samples were then air-dried in a cool, well-ventilated, and dust-free environment at ambient temperature (25 ± 5 °C) to avoid potential alterations to soil organic matter and nutrient forms caused by high-temperature drying. The air-drying process lasted for seven days until a constant weight was achieved. The air-dried soils were gently ground using an agate mortar to avoid disrupting mineral structures. The ground soils were sequentially passed through a 2 mm nylon sieve and a 0.149 mm (100-mesh) nylon sieve. The fraction ≤ 2 mm was used for CEC measurement, while the fine soil powder (≤0.149 mm) was used for chemical analyses including OC, TN, and TP. All processed samples were sealed in polyethylene zip-lock bags, labeled, and stored for subsequent analysis.
2.3. Determination of Soil Chemical Properties
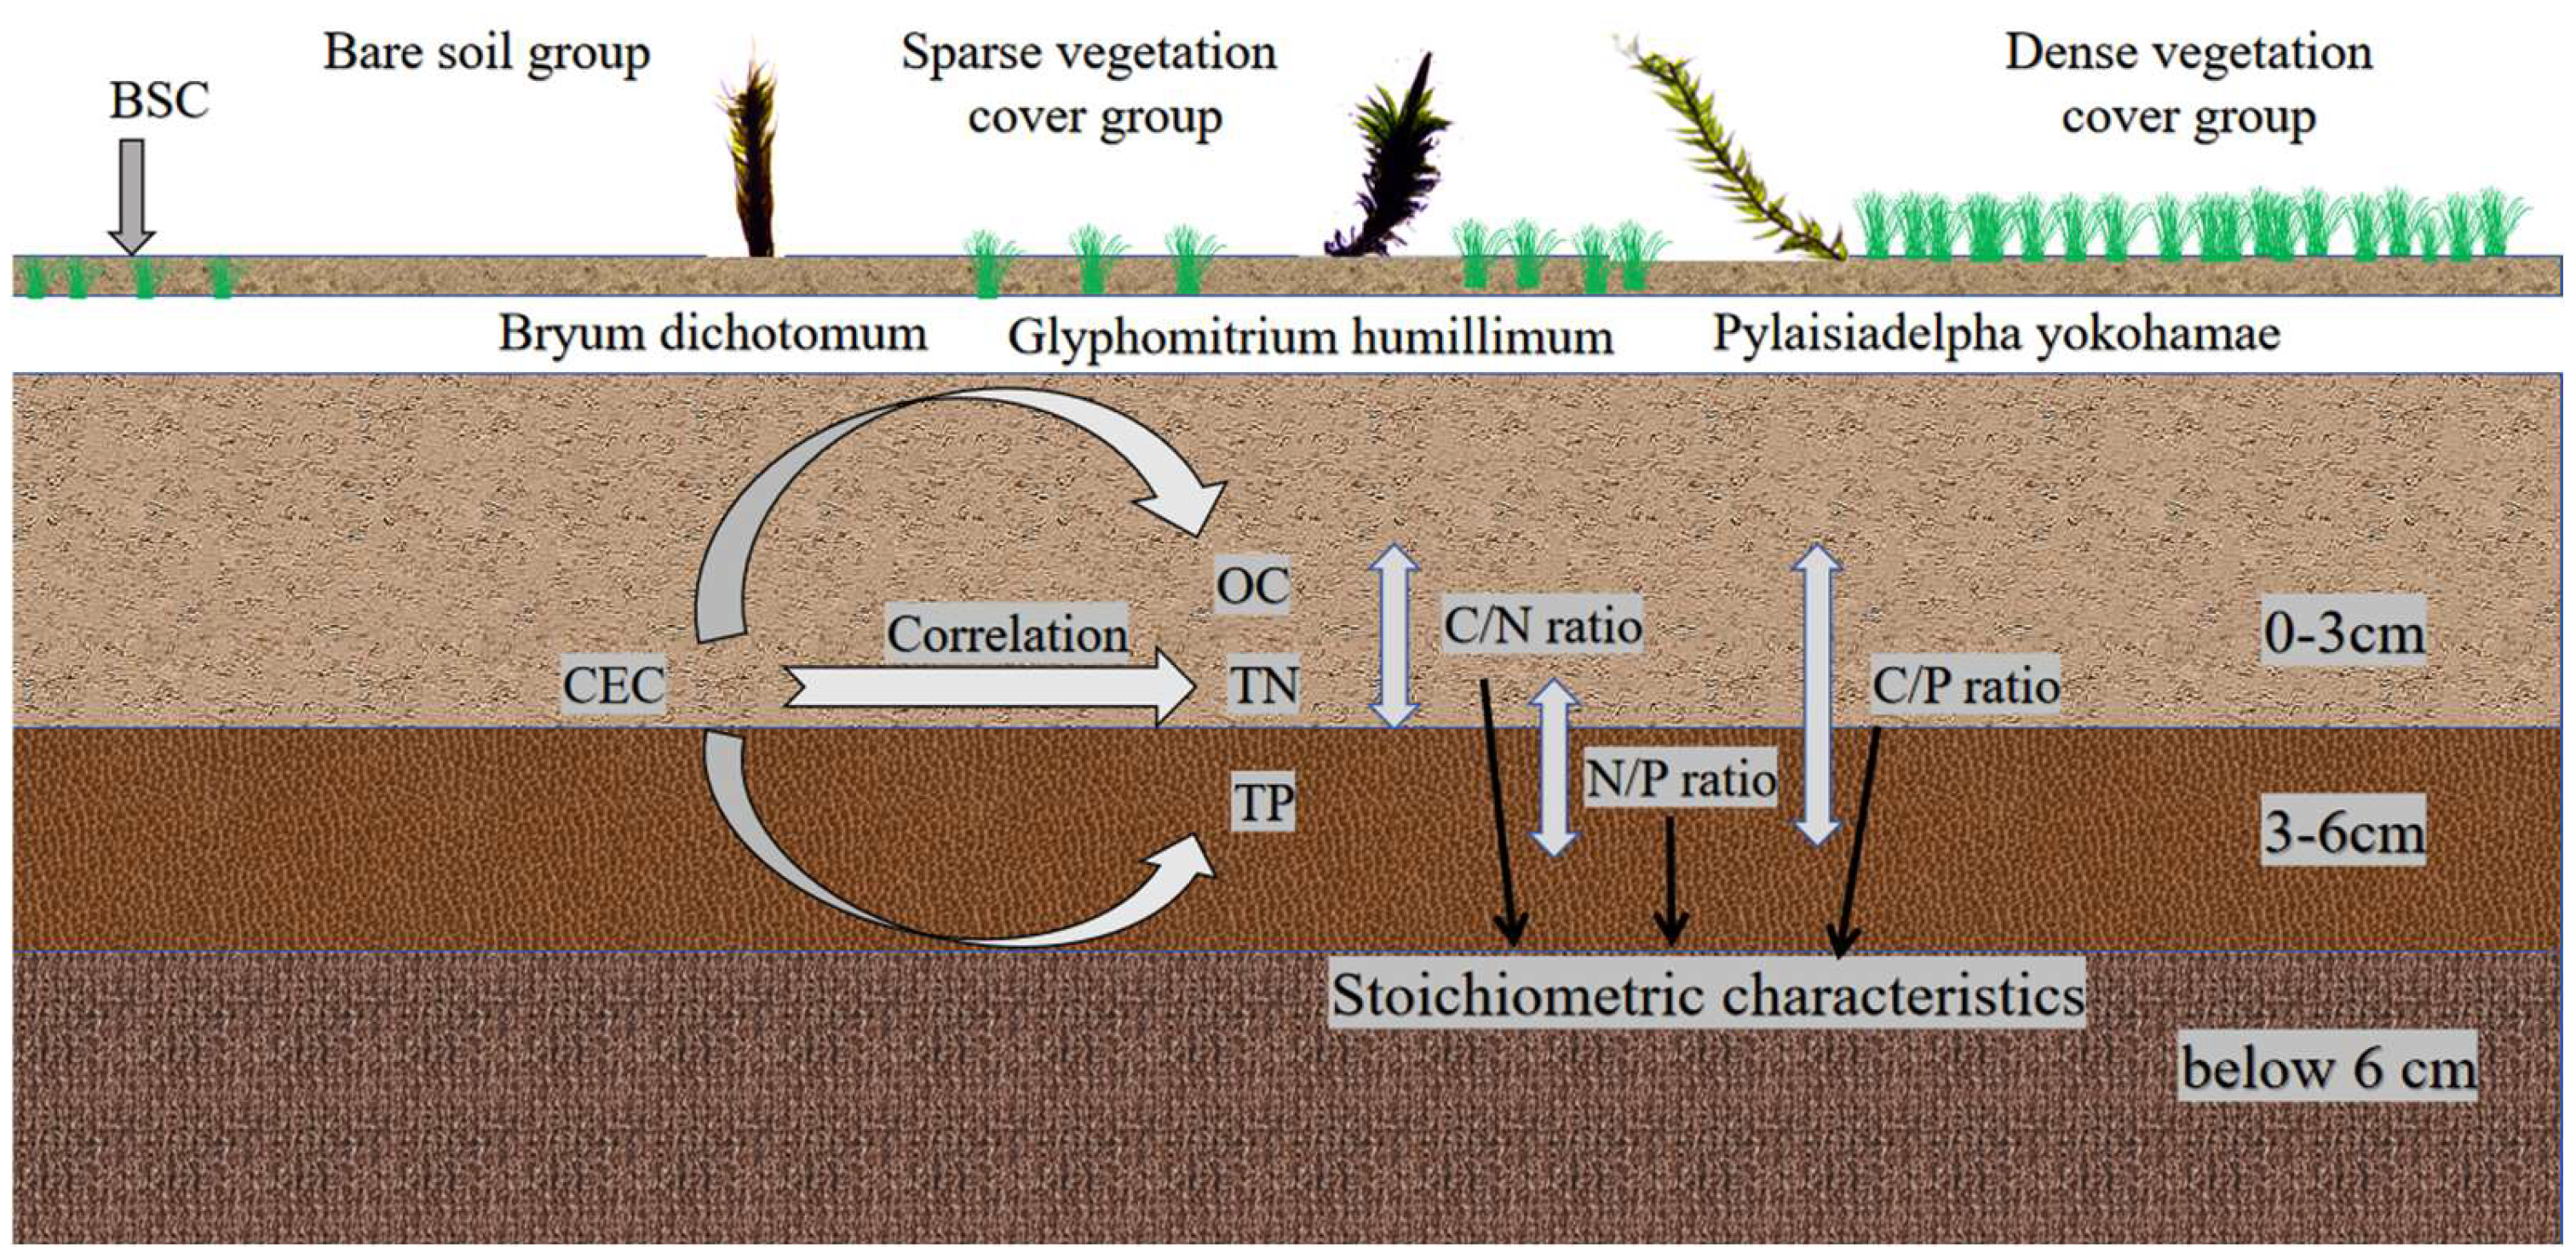
OC was determined by the external heating potassium dichromate oxidation method [22]. Briefly, 0.1 g of soil sample was accurately weighed into a digestion tube. Then, 0.8 mol/L K2Cr2O7 solution and concentrated H2SO4 was added. The mixture was heated at 170–180 °C for 5 min in an oil bath. After cooling, the excess dichromate was titrated with FeSO4 solution using o-phenanthroline as an indicator. The amount of OC was calculated based on the consumption of potassium dichromate. TN content was determined using a German AA3 continuous-flow analyzer following digestion with concentrated sulfuric acid and catalyst [23]. TN was measured using the Kjeldahl digestion method. A 0.5 g soil sample was digested with concentrated H2SO4 and a mixed catalyst (K2SO4:CuSO4:Se = 100:10:1) at 380 °C for 2 h. The digested sample was then distilled and titrated automatically. TN was calculated from the amount of HCl consumed during titration. TP was determined by sodium hydroxide fusion followed by molybdenum–antimony anti-spectrophotometry. Specifically, 0.25 g of soil was placed in a silver crucible and fused with solid NaOH at 720 °C for 15 min. After cooling, the melt was dissolved in dilute HNO3 and brought to volume with deionized water. An aliquot of the solution was mixed with the molybdenum–antimony anti-colorimetric reagent. The absorbance was measured spectrophotometrically at 700 nm to determine phosphorus concentration. Given the weakly acidic nature of red clay in northern Guangxi, CEC was determined using the ammonium acetate exchange method; exactly 2.0 g of air-dried soil was saturated by repeated washing and centrifugation with 1 mol/L CH3COONH4 solution. Excess salts were removed by washing with 95% ethanol. The NH4+-saturated soil was then displaced with a 10% NaCl solution. The amount of ammonium ion (NH4+) in the leachate was determined by distillation. The underlying mechanisms are illustrated in Figure 2.

Figure 2.
Experimental mechanism diagram.
2.4. Soil Spectral Measurement and Pretreatment
A Cary 5000 dual-beam spectrophotometer was employed, with the wavelength range set to 350–2500 nm (instrument standard range: 175–3300 nm). To compare the effects of varying moss coverage levels on soil spectra, reflectance (R) and absorbance (A) curves were plotted. Three spectral measurements were taken per sample and averaged to obtain a representative spectrum. Measurements were conducted under controlled lighting conditions using a contact probe with an integrated light source, which effectively excludes ambient light. The raw spectra were preprocessed using Savitzky–Golay smoothing and continuum removal to minimize noise and enhance specific absorption features. Savitzky–Golay smoothing was applied to the raw reflectance data to minimize high-frequency instrumental noise while preserving the overall shape of the spectrum. It achieves data smoothing by fitting a low-degree polynomial to a contiguous subset of adjacent data points using the linear least squares method. Subsequently, continuum removal was performed to isolate absorption features from the overall background shape. A convex hull, defined by connecting local maxima with straight-line segments, was fitted to each spectrum. Each reflectance value was then divided by the corresponding value on the continuum line to produce continuum-removed reflectance spectra, normalizing the absorption features for analysis. Spectral index extraction reveals that the NDVI (Normalized Difference Vegetation Index) and NDWI (Normalized Difference Water Index) are calculated using the following formulas: NDVI = (ρNIR − ρRed)/(ρNIR + ρRed), and NDWI = (ρNIR − ρSWIR)/(ρNIR + ρSWIR); in this calculation, SWIR is 1650 nm, NIR is 850 nm, Red is 650 nm.
2.5. Experimental Data Analysis
Soil ecological stoichiometric characteristics were expressed as elemental mass ratios. Data processing and visualization were conducted using Excel and Origin 2024. Pearson’s correlation analysis was applied to determine relationships between soil CEC and soil chemical properties. Given the large number of correlation tests performed, we applied the Benjamini–Hochberg procedure to correct the p-values for false discovery rate (FDR).
3. Results
3.1. Influence of Moss Crust Coverage Density and Species Identity on Subjacent Soil C, N, P, and CEC
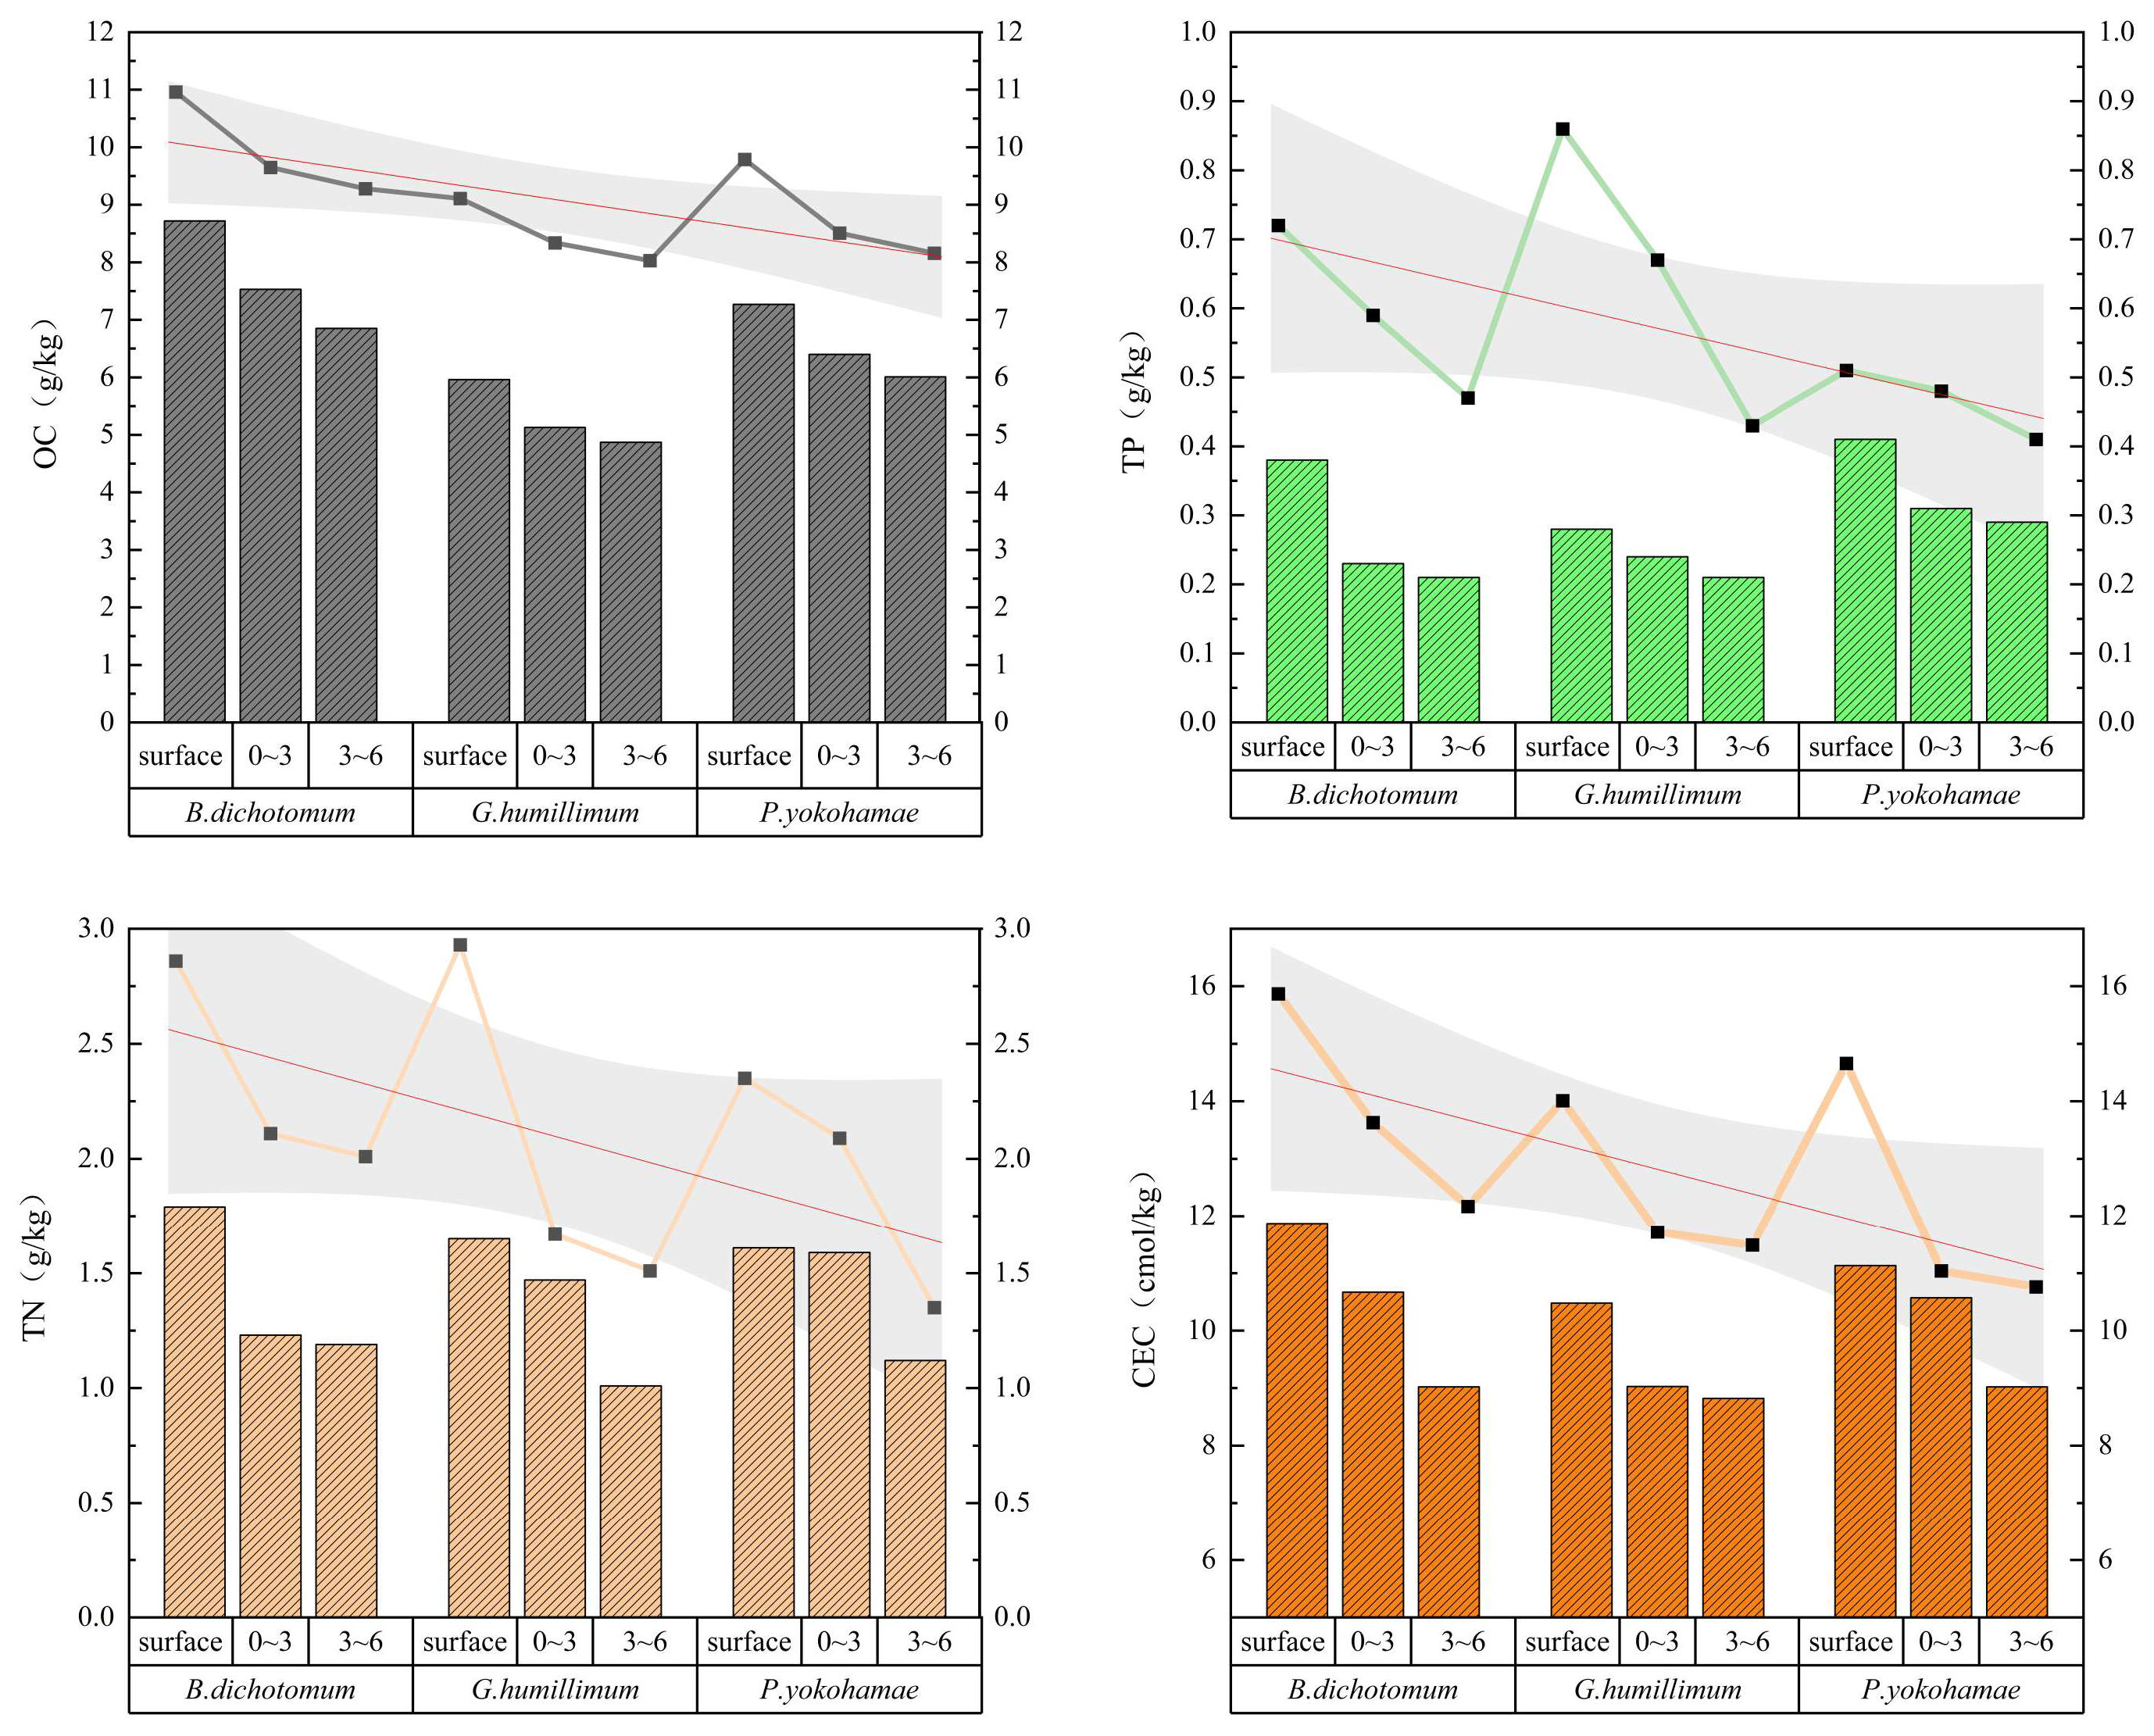
Figure 3 displays the OC, TN, and TP content in soils under three moss species (B. dichotomum, G. humillimum, P. yokohamae) at various depths. The results for sparsely covered moss groups (bar charts) and densely covered groups (point-line plots) are combined in Figure 3 for direct comparison, incorporating fitted curves and confidence intervals to facilitate rapid and intuitive identification of data trends. Table 1 presents the chemical properties of bare soil controls (no moss cover) across layers.
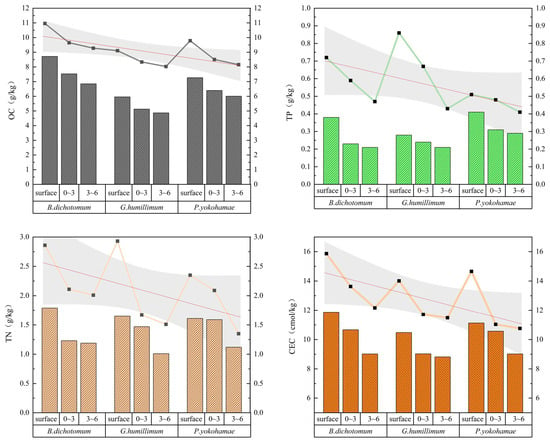
Figure 3.
The chemical properties of the three types of mosses with different coverage and different soil layers. B. dichotomum: Bryum dichotomum, G. humillimum: Glyphomitrium humillimum, P. yokohamae: Pylaisiadelpha yokohamae.

Table 1.
Physicochemical properties of bare soil (blank control).
Comparisons reveal that moss crust coverage generally increased soil OC, TN, and CEC compared to bare soil, with varying effectiveness among species. B. dichotomum exhibited the most stable and significant soil improvement. Under dense coverage, its crust layer OC, TN, and TP increased by 6.37, 1.73 and 0.45 g kg−1, respectively, relative to bare soil. Dense G. humillimum coverage increased crust OC, TN, and TP by 4.52, 1.80 and 0.59 g kg−1. Dense P. yokohamae coverage increased these by 5.19, 1.22 and 0.24 g kg−1. Soil OC, TN, and TP beneath the moss crust (0–3 cm and 3–6 cm depths) were generally lower than in the crust/surface layers, decreasing progressively with depth. For OC reduction rates, G. humillimum decreased the fastest: under sparse coverage, OC at 0–3 cm and 3–6 cm was 13.93% and 22.38% lower than the crust layer; dense coverage showed reductions of 13.21% and 16.4%. TN reduction patterns differed: sparse B. dichotomum decreased fastest at 0–3 cm (8.94% lower than crust), while sparse G. humillimum showed the largest reduction at 3–6 cm (38.79% lower). For TP reduction under sparse coverage, G. humillimum decreased the fastest at 0–3 cm (14.29% lower), whereas B. dichotomum showed the most significant decrease at 3–6 cm (14% lower). Narrower confidence intervals for TP indicate less data dispersion and higher stability compared to other measurements. The CEC results indicated higher values in soil under B. dichotomum at equivalent depths than under the other species. Crucially, dense B. dichotomum crust CEC was double that of bare surface soil. CEC also decreased with soil depth, similar to OC, TN, and TP. P. yokohamae exhibited the fastest CEC reduction: dense coverage CEC at 3–6 cm decreased by 5.75% relative to the crust layer, while sparse coverage decreased by 9.97% (narrow confidence intervals suggest result accuracy). B. dichotomum showed the next-fastest reduction: dense coverage at 3–6 cm decreased by 4.41%, while that of sparse decreased by 7.16%. Although the improvement was less marked, G. humillimum followed the same trend: dense coverage at 3–6 cm decreased by 3.46%, while that of sparse decreased by 6.30%.
3.2. Effects of Moss Crust Coverage and Species on Underlying Soil Stoichiometric Characteristics
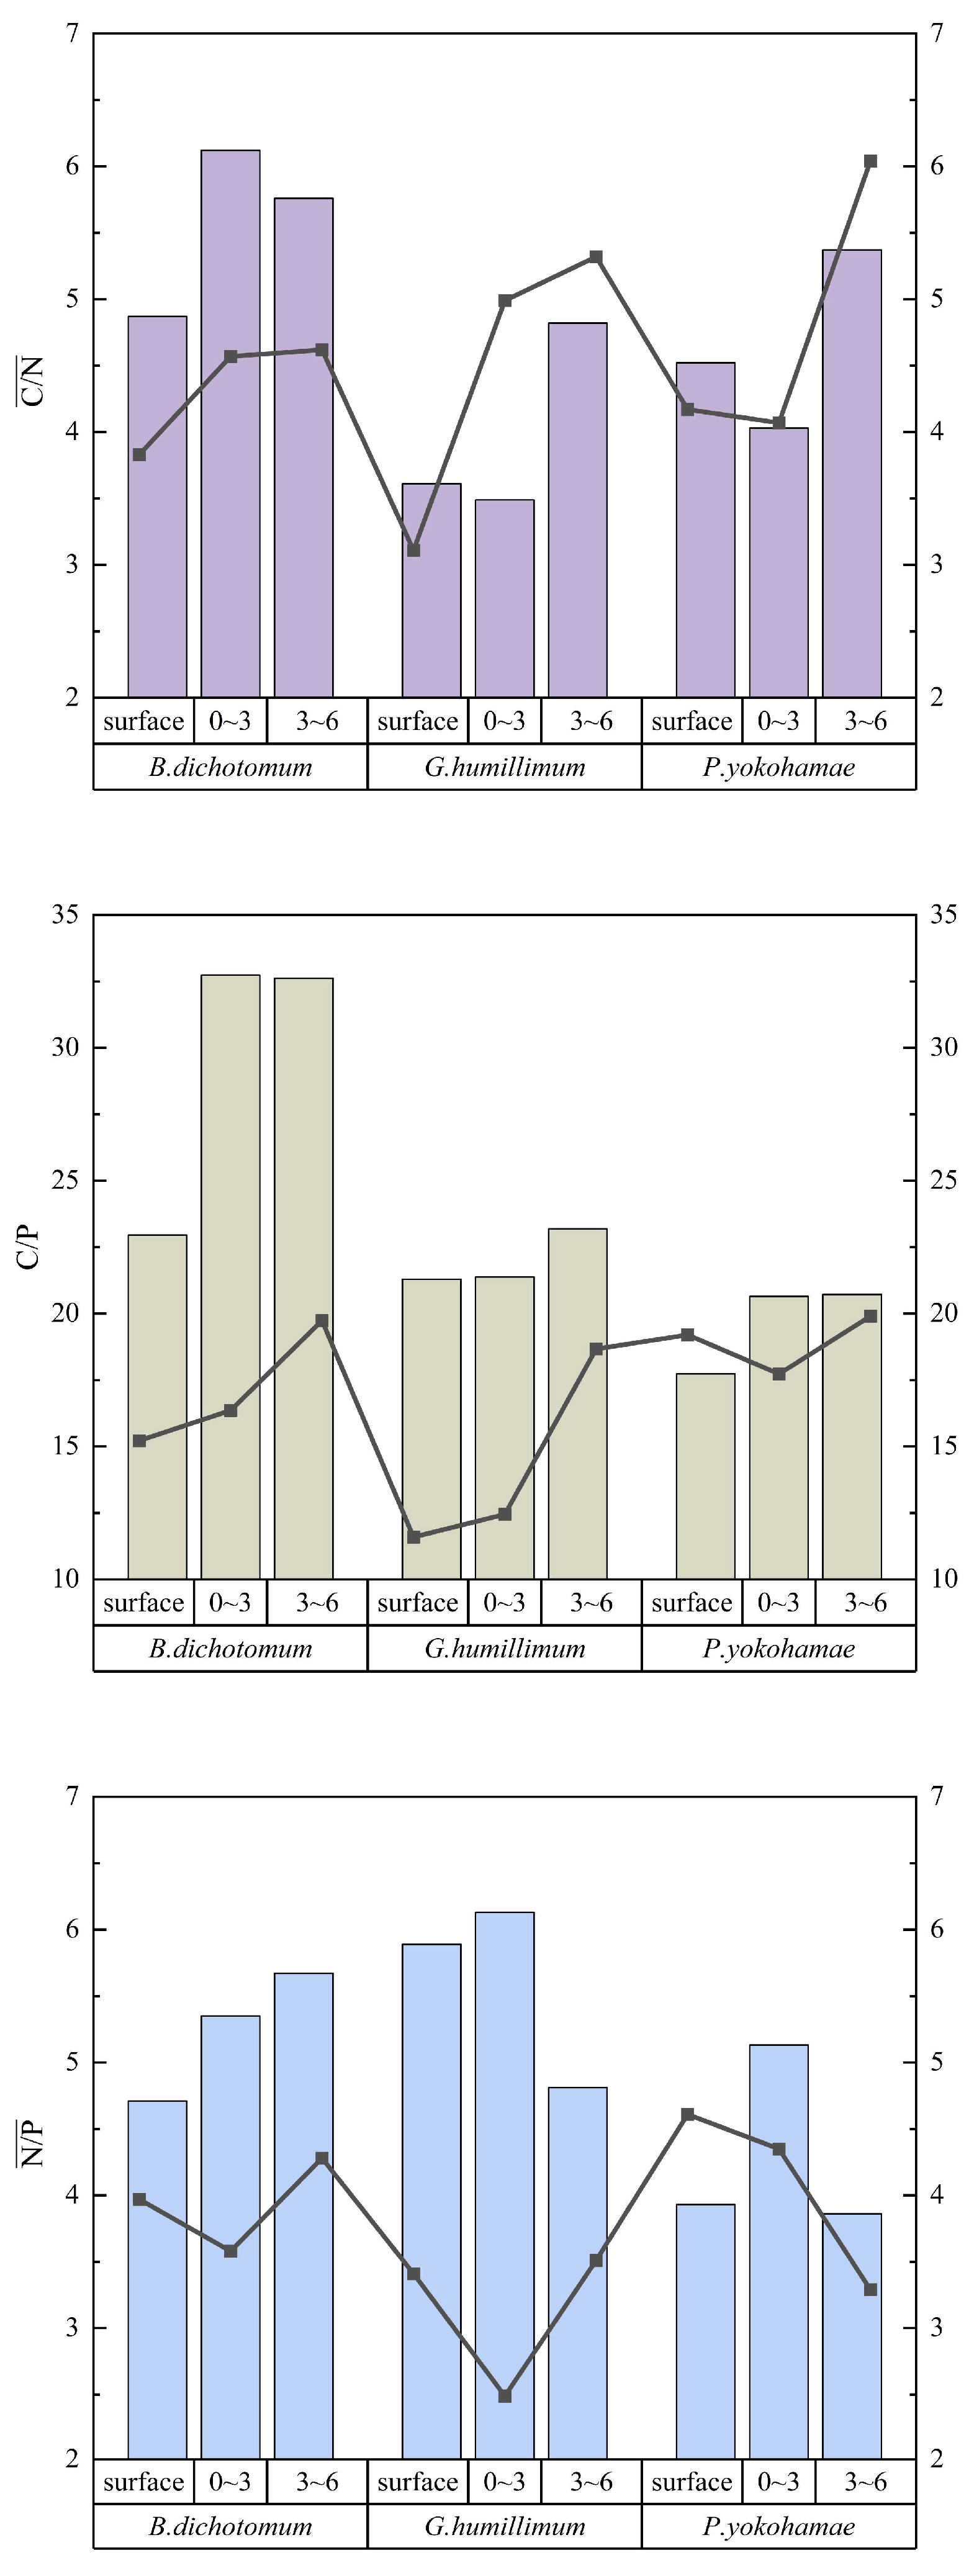
Compared to moss-crust-covered soils, bare soil exhibited reductions in C/N, C/P, and N/P ratios. The soil C/N ratio displayed an increasing trend with greater soil depth. G. humillimum demonstrated a pronounced effect under both sparse and dense coverage, with the C/N ratio in the 3–6 cm soil layer increasing by 18.00% and 34.33%, respectively, relative to the crust layer. Regarding the C/P ratio, B. dichotomum and P. yokohamae showed significant increases, particularly B. dichotomum, where the C/P ratio in the 3–6 cm soil layer increased by 16.7% compared to the crust layer. The influence of different moss coverage densities on soil stoichiometric ratios varied among species. The disparity in the effect on the C/P ratio between dense and sparse coverage was greatest for B. dichotomum. Analysis of N/P ratios revealed that the difference in impact between dense and sparse coverage was most substantial for G. humillimum, especially in the 0–3 cm layer. Here, the N/P ratio under sparse coverage was 59.38% higher than under dense coverage at the same depth. For B. dichotomum, sparse coverage in the 0–3 cm layer resulted in a 33.08% higher N/P ratio compared to dense coverage, while for P. yokohamae, sparse coverage led to a 15.20% increase. Overall, the differences in stoichiometric ratios between the 0–3 cm and 3–6 cm soil layers were less pronounced for B. dichotomum than for the other two moss species. Specific results are presented in Figure 4.

Figure 4.
The stoichiometric characteristics of the three mosses with different coverage and different soil layers. B. dichotomum: Bryum dichotomum, G. humillimum: Glyphomitrium humillimum, P. yokohamae: Pylaisiadelpha yokohamae.
3.3. Correlations Between Soil C, N, P, Stoichiometric Characteristics and CEC
Analysis of the correlation Table 2 revealed that under dense B. dichotomum coverage, CEC exhibited the strongest correlation with OC, reaching 0.910. This correlation coefficient was 0.03 higher than that observed for CEC and OC under dense G. humillimum coverage. Given the high organic carbon content within SOM, the relationship between TN and CEC is typically mediated indirectly through SOM. Elevated TN levels generally coincide with higher SOM content, which consequently enhances CEC indirectly. Consequently, TN also showed the strongest correlation with CEC (r = 0.957) under dense B. dichotomum coverage. The maximum correlation between TP and CEC occurred under dense G. humillimum coverage (r = 0.899). In contrast, P. yokohamae exhibited the weakest correlation (r = 0.702) between TP and CEC. These results indicate that the direct relationship between TP and CEC is weaker than that observed for OC and TN.

Table 2.
Correlations between soil CEC and OC, TN, and TP under different moss coverage conditions.
Regarding OC content, there were highly significant differences among the moss species. Densely growing moss exhibited significantly higher OC content than sparsely growing moss. This indicates that increased biomass directly contributes to OC accumulation. The non-significant interaction effect (p = 0.248) suggests that the pattern of species’ influence on OC remained consistent across different density conditions. The results for TN showed similarities with those for OC, but with a significant interaction effect (p = 0.029). This indicates that the effect of coverage density on TN depends on the specific moss species. For TP, the interaction effect was marginally significant (p = 0.069), slightly exceeding the 0.05 threshold. This suggests a weak interaction where the effect of coverage density on TP may be slightly stronger or weaker in certain species. No significant interaction effect was found for CEC, indicating that the pattern of species’ influence on CEC did not differ significantly across coverage levels. Two-way ANOVA results for three moss species under two coverage levels are presented in Table 3.

Table 3.
Two-way ANOVA results for three moss species under two coverage levels.
A multiple linear regression analysis was performed with CEC as the dependent variable (Y) and OC, TN, and TP as independent variables (X). Multicollinearity was assessed using variance inflation factor (VIF) analysis. The results showed VIF values of 3.726 for OC, 4.132 for TN, and 2.891 for TP, indicating that while some correlation exists among OC, TN, and TP—which is commonly observed in soil nutrient indicators—no significant multicollinearity issues were detected. The results of the regression analysis are presented in Table 4. Mosses influence the CEC by altering soil OC, TN, and TP. This pathway demonstrates that moss species govern the type and proportion of nutrient components, while moss coverage governs the intensity and spatial scale of nutrient accumulation. The combination of both creates positive feedback and synergistic effects.

Table 4.
The results of the regression analysis.
3.4. Soil Spectral Characteristics Under Different Moss Coverages
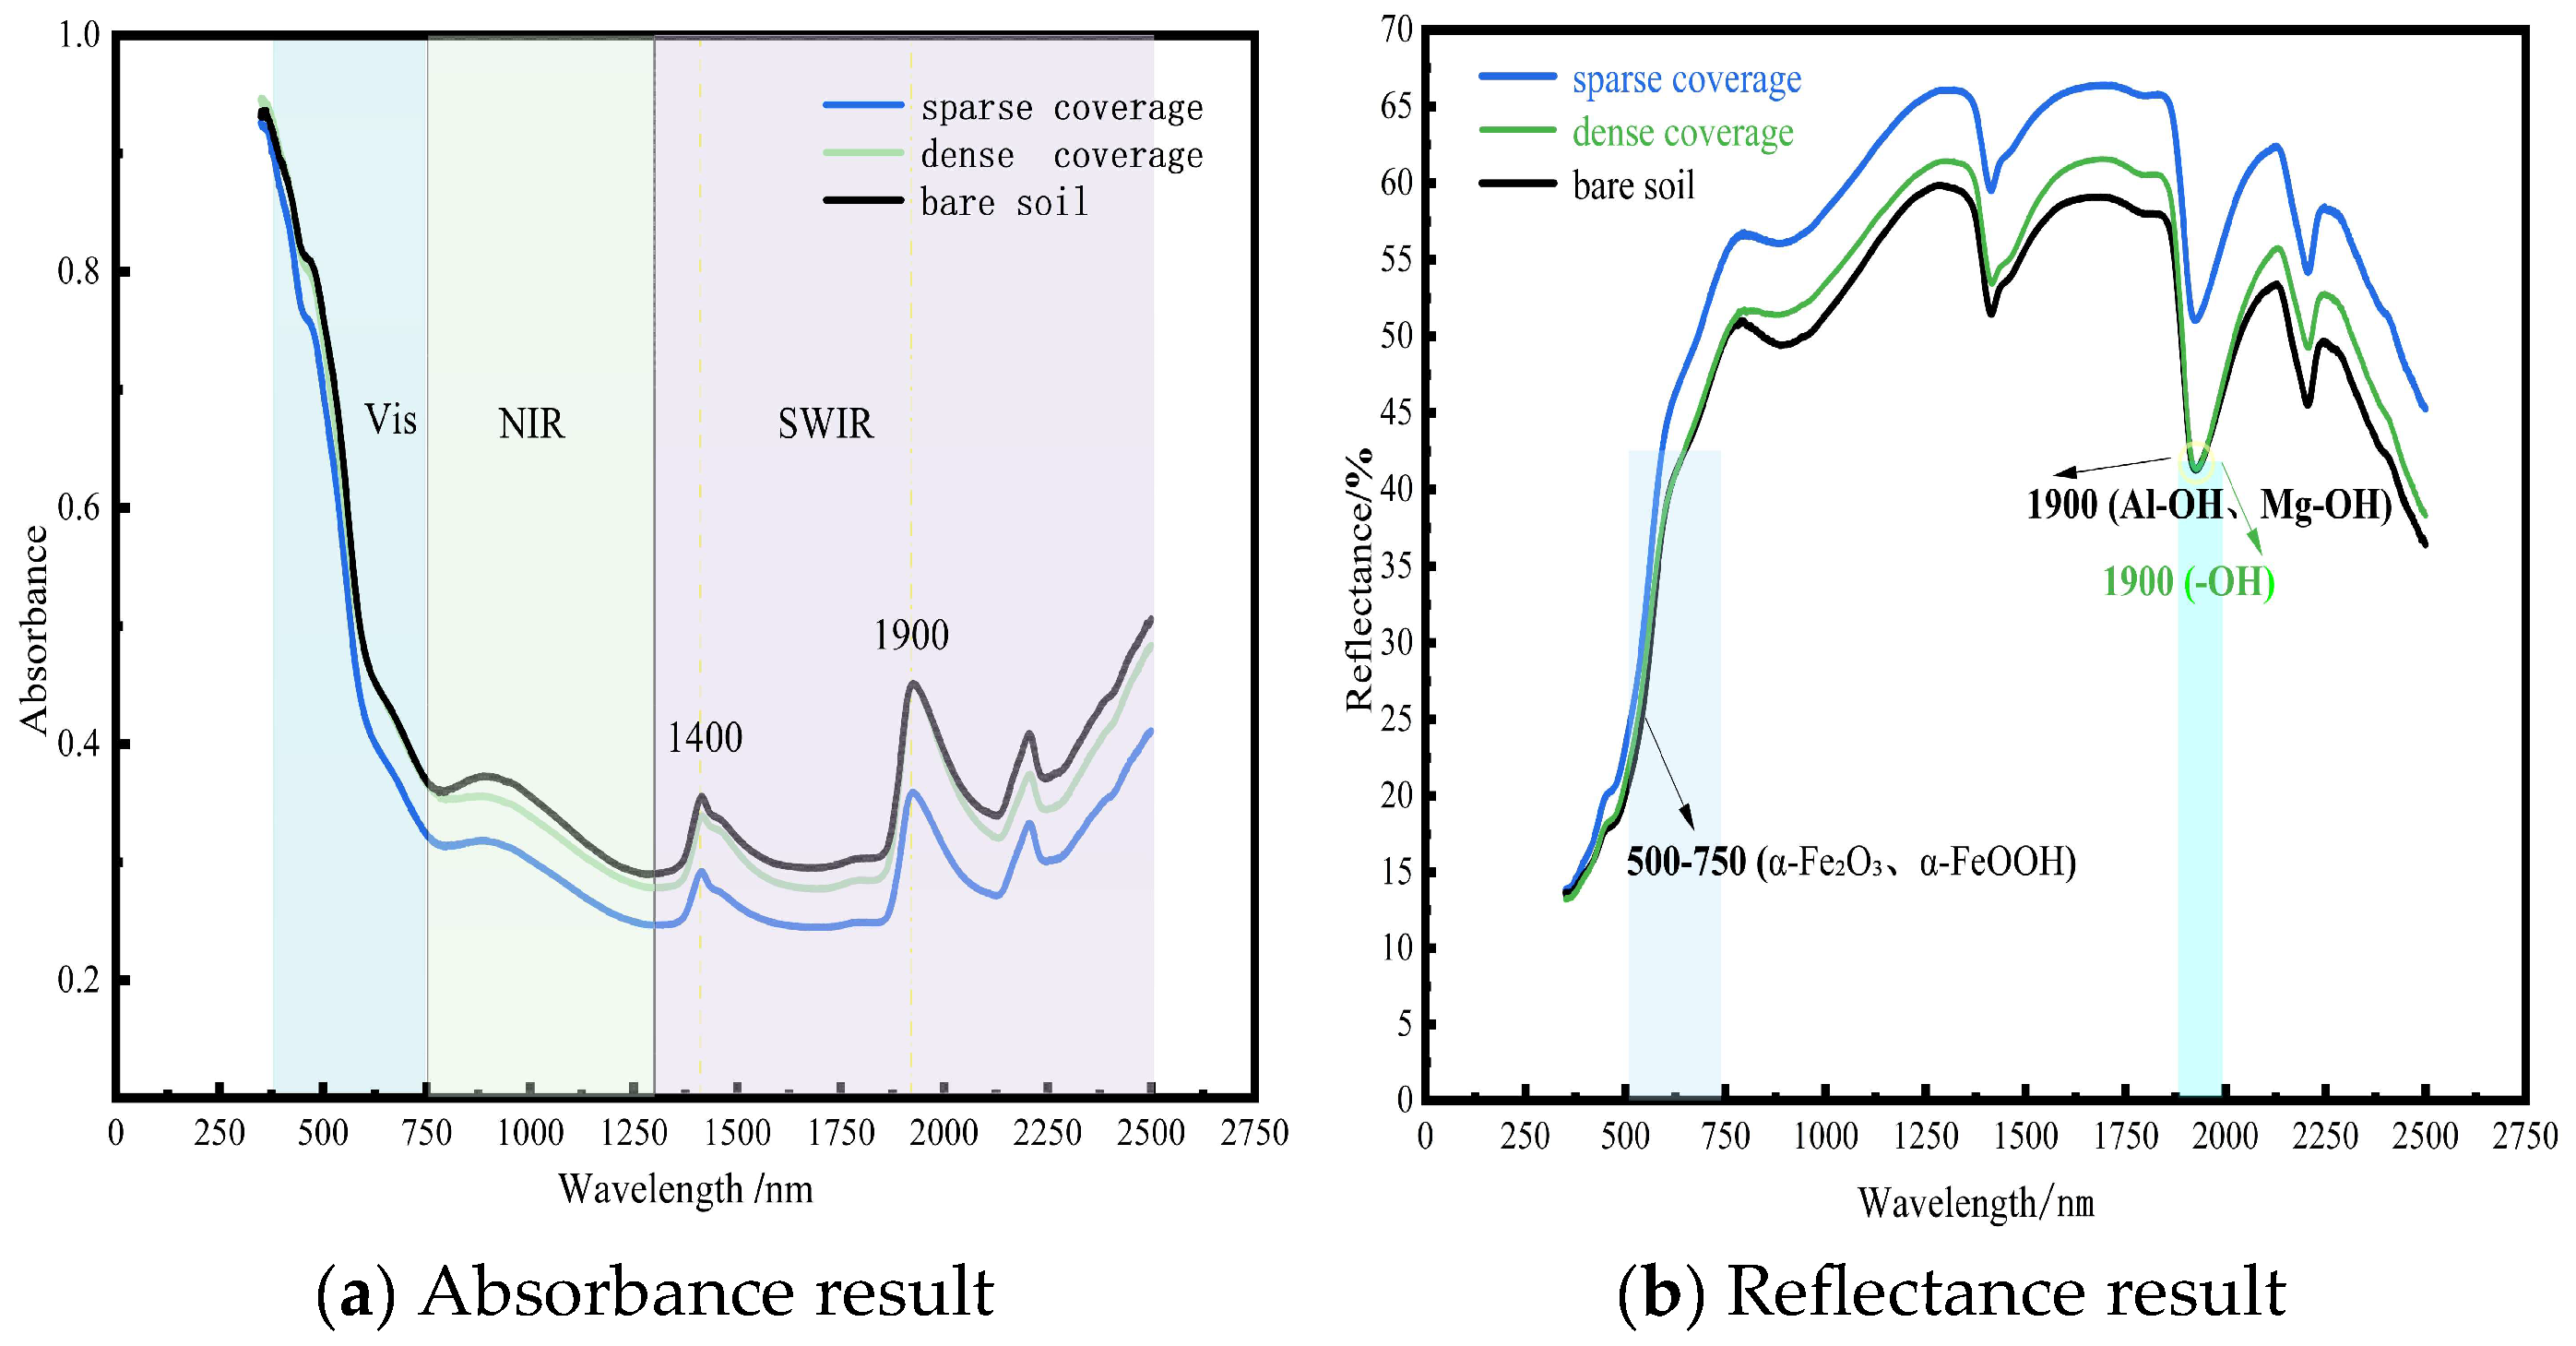
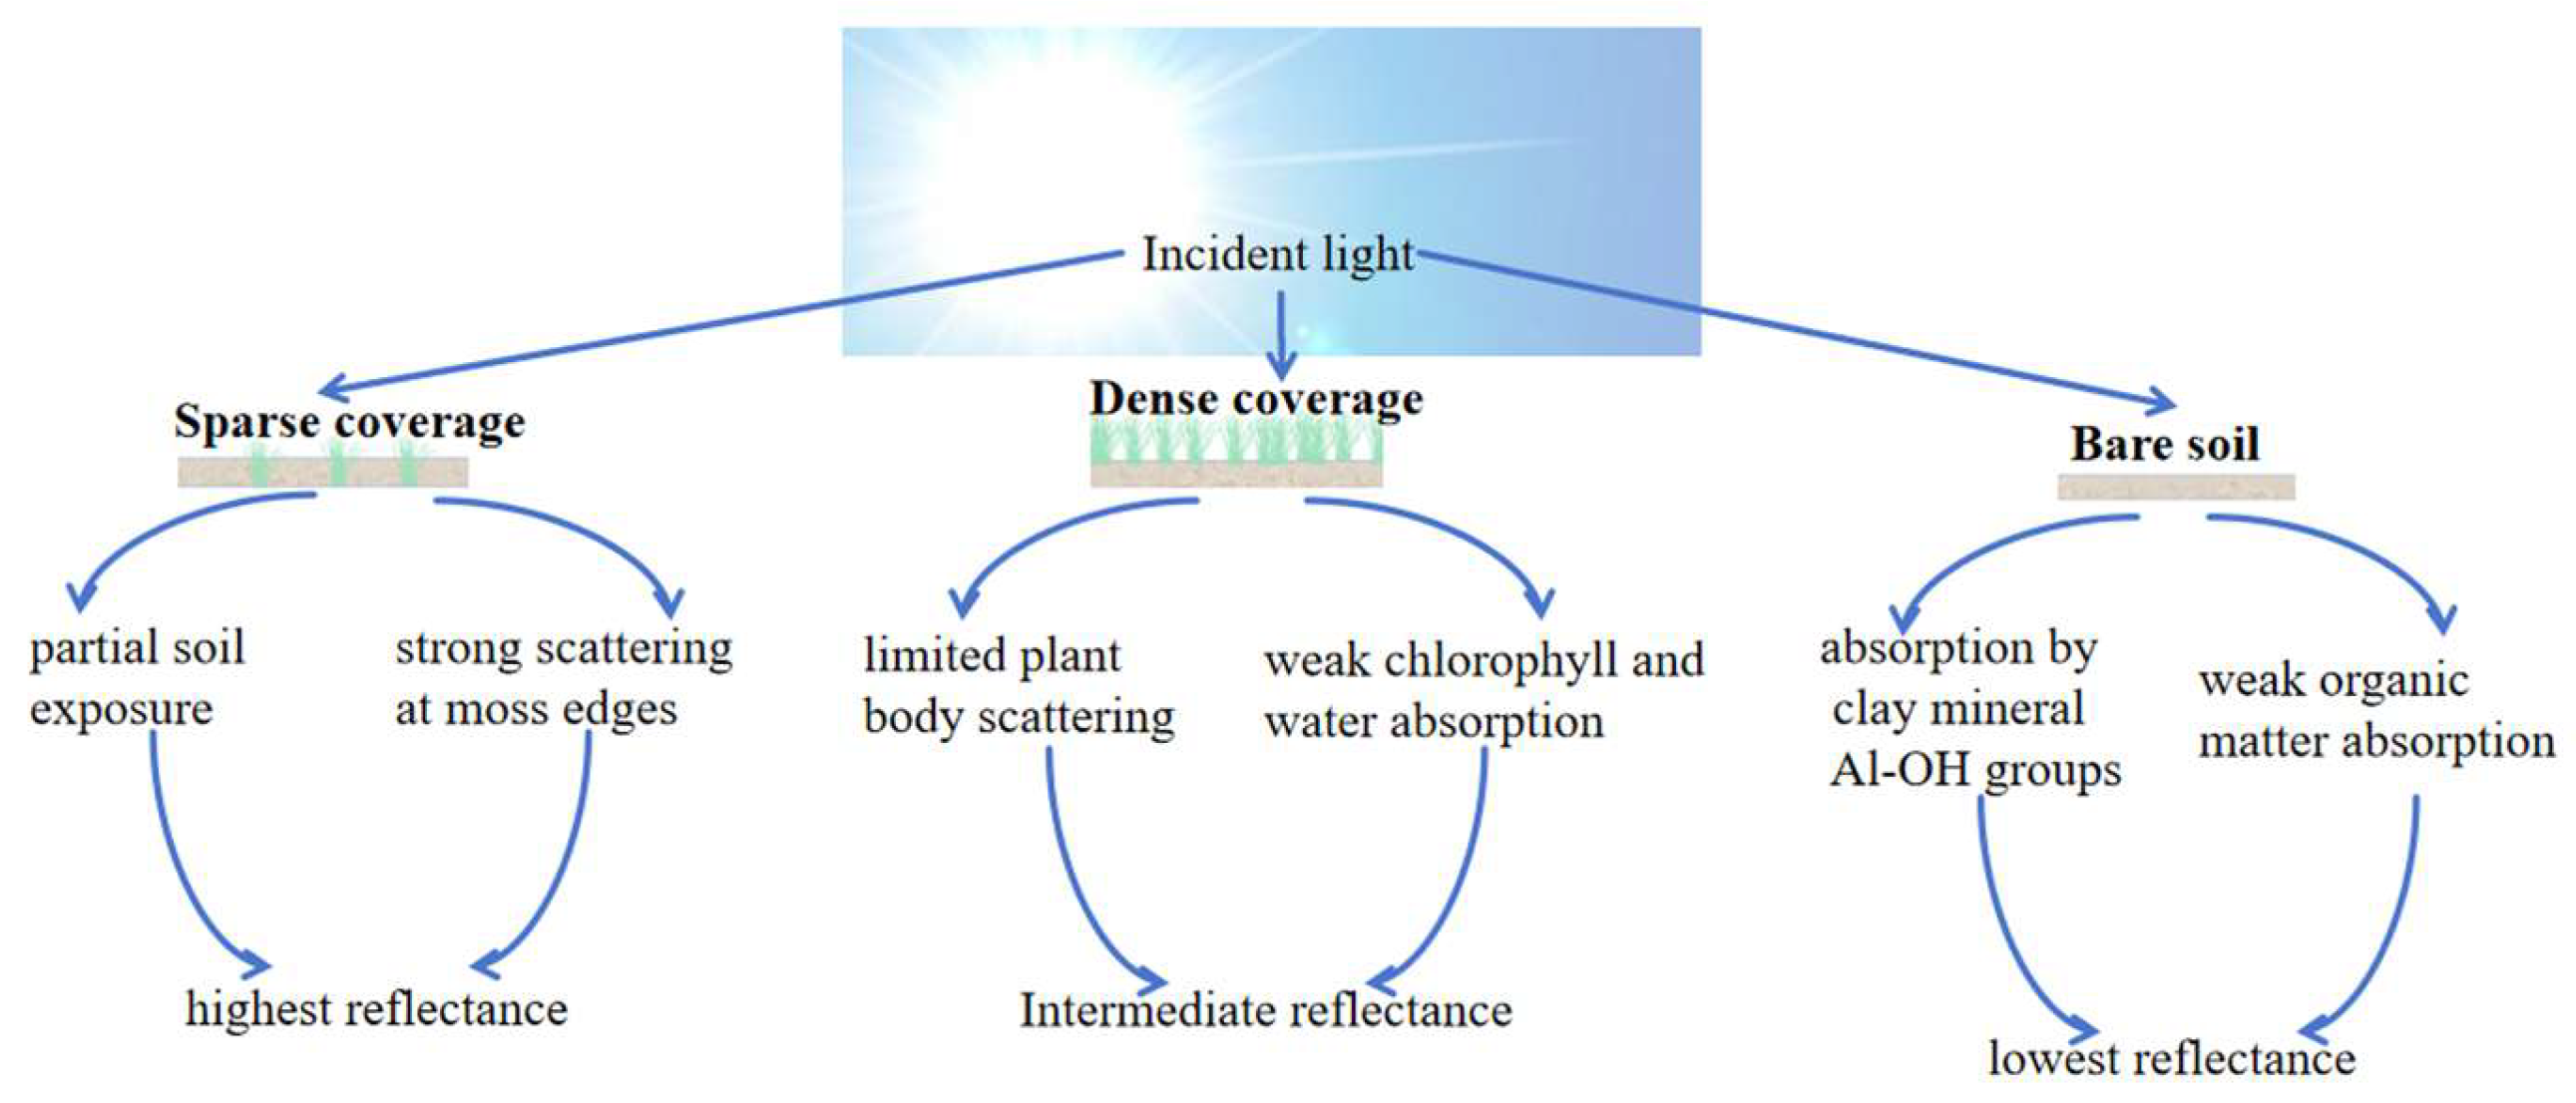
Spectral properties of the soil surface varied with moss species and coverage density. Analysis focused on the 250–2500 nm spectral range. In sparsely covered areas, spectral enhancement occurred due to edge scattering and soil mutual reflectance. Conversely, densely covered moss suppressed soil reflectance, primarily attributable to limited structural scattering and strong water absorption. Notably, in the 500–700 nm visible region, the following was observed: (1) Sparse coverage exhibited reflectance enhancement driven by soil green reflectance and edge scattering, while weak chlorophyll absorption caused partial suppression. (2) Dense coverage: chlorophyll scattering increased reflectance, but this was counteracted by suppression from chlorophyll absorption and water absorption. (3) Bare soil: reflectance was strongly suppressed by hematite absorption.
Within the 1300–2500 nm shortwave infrared (SWIR) region, the following was observed: (1) Sparse coverage: reflectance remained elevated due to contributions from exposed soil reflectance and moderate water absorption. (2) Dense coverage: reflectance was suppressed by the absence of effective gain factors, combined with strong water absorption and cellulose absorption. (3) Bare soil: reflectance suppression resulted from broad clay absorption bands. These spectral patterns convey distinct ecological implications: (1) Persistently high reflectance under sparse moss coverage reflects enhanced soil erosion resistance during early moss colonization stages. (2) Deep SWIR absorption features under dense moss indicate improved ecosystem water-holding capacity. (3) Consistently low reflectance values across the entire spectrum in bare soil demonstrate the susceptibility of degraded red clay to erosion. Spectral curves of soil surface with different coverages are illustrated in Figure 5. Dominant factors in spectral absorption are illustrated in Figure 6.
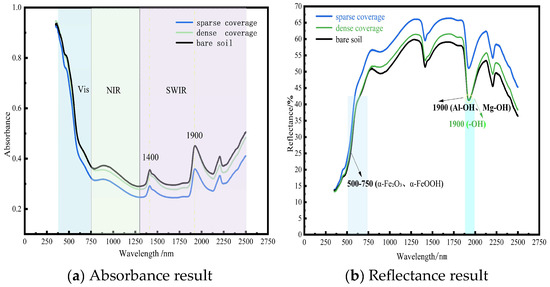
Figure 5.
Spectral curves of soil surface with different coverages.
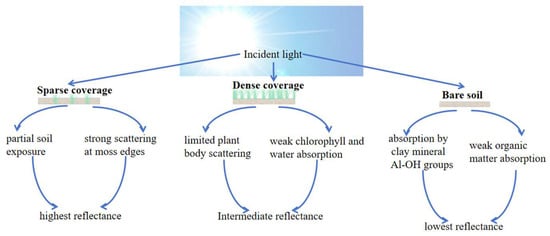
Figure 6.
Dominant factors in spectral absorption.
3.5. Extraction of Soil Spectral Indices
NDVI is used to assess vegetation growth status, biomass, and vegetation coverage. It is highly sensitive to green vegetation. NDWI is generally used to monitor canopy water content and is sensitive to moisture within leaves. From the NDVI calculation results, it can be observed that the soil exhibits weak vegetation coverage characteristics. As the density of moss coverage increases, the NDVI value shows a slight upward trend because moss, as a form of vegetation, increases near-infrared reflectance due to its chlorophyll. From the NDWI calculation results, it can be seen that the reflectance in the shortwave infrared band (1650 nm) is consistently higher than that in the near-infrared band (850 nm), which is consistent with the arid characteristics of rocky desertification soil. Detailed results are shown in Table 5.

Table 5.
NDVI and NDWI of soil under different coverage levels.
4. Discussion
4.1. Vertical Heterogeneity of Soil C-N-P Stoichiometry and CEC Driven by Moss Biocrusts
This study revealed a significant decreasing gradient in SOC, TN, TP, and CEC under three moss species (B. dichotomum, P. yokohamae and G. humillimum): biocrust layer > 0–3 cm soil > 3–6 cm soil (p < 0.05). This pattern indicates that the nutrient enrichment effect of moss biocrusts in the karst rocky desertification area of northern Guangxi is confined to the topsoil (0–3 cm), with subsoil (>3 cm) nutrient concentrations sharply declining. This vertical stratification is consistent with findings in other regions [24,25], confirming universal topsoil improvement mechanisms by biocrusts. Key mechanisms include the following: (1) Physical interception network [26]: rhizoid systems and extracellular polysaccharides form 3D porous structures (porosity > 45%), effectively capturing atmospheric deposits and litter debris, enhancing surface SOC and TN by 40–65% [27]. (2) Biological carbon pump: moss photosynthesis fixes CO2 at 1.2–3.8 μmol m−2 s−1 [28]. (3) Phosphorus activation: secreted organic acids (e.g., oxalate/citrate, 1.2–3.8 mM) dissolve Fe/Al-bound phosphorus, increasing available P in the crust layer by 110–150% compared to sublayers. These processes cause significant divergence in C:N:P stoichiometry between crust and subsoil [29,30]. Future studies should employ 15N/32P isotopic tracing to quantify longitudinal nutrient fluxes, advancing theoretical frameworks for “biocrust-soil” system restoration in karst regions.
4.2. Effects of Moss Coverage and Species on Soil C-N-P Stoichiometry and Cation Exchange Capacity
Soil nutrient pools and their stoichiometric relationships are significantly modulated by the physiological traits, structural characteristics, and phylogenetic background of the overlying vegetation [31]. According to the Growth Rate Hypothesis [32], organisms with higher growth rates typically exhibit elevated P content, driven by the substantial demand for P-rich RNA during rapid growth. Given that moss physiological processes are highly dependent on water availability [33], mosses thriving in moisture-sufficient habitats may possess higher tissue P concentrations. Correspondingly, moss species with well-developed rhizoid systems (e.g., Bryum dichotomum) demonstrate superior capacity for water interception and retention during precipitation events, helping to maintain a favorable moisture environment in the topsoil, which may consequently promote the accumulation of soil TP [34]. Furthermore, the evolutionary trajectory of organisms shapes their structural features, thereby influencing their elemental stoichiometric patterns. The homeostasis mechanism in organisms typically results in a stable correlation between tissue total nitrogen (TN) and TP content, often following a power law relationship (TN ∝ TP^k, where k ≈ 2/3) [35]. In the karst region of northern Guangxi, vascular plant communities like common reed (Phragmites australis) have also been shown to improve soil stoichiometric characteristics, similar to mosses. However, as non-vascular plants, mosses exert their influence through distinct mechanisms. Moss cover enhances soil CEC by increasing organic matter and fine particles, thereby improving adsorption of nutrient ions such as potassium and calcium.
4.3. Interactive Relationships Between Soil C-N-P Stoichiometry and CEC
SOM constitutes a fundamental source of CEC, with its mechanistic role grounded in physicochemical principles. Humic substances (accounting for 60–80% of SOM) carry permanent negative charges through densely distributed functional groups such as carboxyl (-COOH) and phenolic hydroxyl (-OH) [36], which effectively bind nutrient cations (e.g., K+, Ca2+, Mg2+) via electrostatic adsorption to form exchangeable ion pools. Consequently, CEC shows a strong positive correlation with SOM, especially in mineral soils. In northern Guangxi’s red clay ecosystems, despite rapid SOM mineralization (15–22% annually) under warm–humid conditions, moss biocrusts enhance topsoil SOM compared to bare soil, thereby boosting CEC [37], underscoring its dominant role in the nutrient retention of red soils. The association between TN and CEC is primarily mediated through SOM. As >95% of soil nitrogen exists in organic forms (e.g., proteins, amino sugars, and humic-bound N), TN content often co-varies strongly with SOM (p < 0.001). This coupling results in high-TN soils typically exhibiting high CEC. However, in northern Guangxi’s red clay, inorganic nitrogen (NH4+-N, NO3−-N) shows weak direct linkage to CEC [38], further reinforcing the cascading “SOM-TN-CEC” effect. The TP-CEC relationship is complex. High-iron/aluminum oxides in red clay form insoluble Fe/Al-P compounds, weakening direct correlation. However, phosphate adsorb onto clay minerals through ligand exchange, increasing surface negative charge. Fe/Al-P fixation is a chemisorption and precipitation reaction [39]. This mechanism is distinct from the physisorption and electrostatic interactions that primarily govern the CEC. Soil phosphorus retention via Fe/Al fixation is independent of its CEC. Utilizing moss as a pioneer species in restoration projects: In incipient or severely desertified areas, local dominant moss species (e.g., Bryum dichotomum as identified in this study) can be artificially introduced via methods such as spraying moss fragments or transplanting biocrust inoculants. This quickly establishes a moss layer, creating a favorable micro-environment (shading, water retention, nutrient enrichment) for the subsequent colonization of herbaceous and woody plants. The quantitative models linking spectral reflectance to moss coverage and soil erodibility developed in this study enable large-scale, cost-effective monitoring of restoration projects using drone or satellite remote sensing. Managers can promptly identify areas where moss coverage is declining or soil stability is compromised, allowing for dynamic adjustments in management strategies.
4.4. Spectral Characteristics of Moss-Covered Soils
At the 1900 nm wavelength, the reflectance spectra of bare soil and densely moss-covered sites exhibited overlapping features, attributable to dual mechanisms: the dense moss canopy showed strong absorption valleys due to O-H stretching vibrations of liquid water molecules under saturated conditions, while bare soil experienced superimposed absorption from structural hydroxyl groups (-OH) in clay minerals and pore water. Notably, characteristic absorptions of clay minerals (e.g., Al-OH and Mg-OH bonding vibrations) dominated the 1900–2200 nm spectral region, with kaolinite and illite exhibiting prominent absorption peaks at 1900 nm. The presence of adsorbed water films on moist bare soil samples further intensified absorption at this band, leading to convergent reflectance.
However, significant spectral divergence occurred at 2200 nm: bare soil maintained low reflectance due to persistent Al-OH absorption in clay minerals, while moss-covered areas showed reflectance recovery (increase of 8–12%) as water absorption diminished. This differentiation provides an effective spectral signature for distinguishing biological cover from mineral substrates. The red clay in northern Guangxi, rich in hematite (α-Fe2O3) and goethite (α-FeOOH) [40], exhibited inherently low reflectance in the visible range (500–700 nm, mean 18.3% ± 2.1%) due to strong charge-transfer absorption. The spectral enhancement of sparse moss patches stemmed from dual mechanisms: (1) Edge scattering effect: irregular boundaries of moss patches induced Mie scattering, increasing reflectance by 25–40%. (2) Red clay background contribution: exposed substrates generated high-reflectance plateaus (>35%) in the near-infrared (800–1300 nm) through lattice vibrations of clay minerals. Dense moss canopies exhibited lower overall reflectance than sparse patches due to moisture-induced suppression effects [41], forming deep absorption valleys in the shortwave infrared (SWIR: 1450/1900 nm). This anomalous “sparse > dense” reflectance pattern indicates moss fragmentation (dryness index > 0.7 or human disturbance intensity ≥ level 3), aligning with ecosystem degradation in karst rocky desertification areas. It serves as an optical diagnostic signal for impaired biogeochemical cycling at the surface–atmosphere interface. This research established quantitative relationships between moss coverage and soil spectral features (such as absorption depth and spectral indices). For long-term monitoring, hyperspectral data can be collected periodically across the study area. Using the models developed here, dynamic changes in moss coverage can be inverted, thereby enabling the evaluation of the effectiveness of rocky desertification restoration projects (e.g., soil retention and ecological recovery). The karst region features a fragile ecosystem where conventional monitoring methods are often time-consuming and labor-intensive. Spectral technology, with its capability for large-scale and periodic observation, is particularly suitable for long-term ecological monitoring in such areas. Subsequent studies will incorporate time-series data to validate and optimize the long-term applicability of the proposed models. In practical, large-scale ecological restoration or monitoring projects, spectral indices can strengthen the link with soil nutrient improvement through the following systematic technological pathway, enabling data-driven, precise, and efficient ecosystem management: hyperspectral data and soil samples are collected from typical sample areas, and spectral indices (such as NDVI) are fitted with soil nutrient content to construct quantitative predictive models of nutrients. This process generates regionalized “spectral-nutrient” inversion models, which are used to directly convert spectral information into proxy indicators of soil nutrients.
5. Conclusions
This study demonstrates that moss biocrusts, particularly B. dichotomum, significantly improve topsoil fertility in karst rocky desertification ecosystems, with species type and coverage density playing critical roles. Key findings include the following:
- (1)
- B. dichotomum optimizes surface soil (0–3 cm) OC, TN, and CEC, enhancing nutrient retention with minimal stoichiometric heterogeneity;
- (2)
- Nutrient improvements are largely confined to the top 3 cm, highlighting the need for surface-focused management in restoration;
- (3)
- Spectral reflectance features effectively indicate ecological functions such as erosion resistance and water retention.
Overall, the sparse coverage of B. dichotomum has beneficial effects on ecosystem restoration. These results underscore the potential of targeted moss species deployment in supporting sustainable ecosystem restoration, combating land degradation, and facilitating long-term recovery in vulnerable karst regions. Moss-based biocrust technology represents not only an effective approach to combating rocky desertification but also a significant contribution to global sustainable development. Promoting the application of suitable moss species in degraded karst regions can enhance carbon sequestration, improve soil quality, strengthen water retention capacity and protect biodiversity. The restoration of rocky desertification ecosystems directly supports multiple the United Nations Sustainable Development Goals (SDGs), including terrestrial ecosystem conservation, while delivering both ecological benefits and strategic importance.
Author Contributions
Conceptualization, Y.L. and Z.L.; methodology, Y.L.; software, Y.L.; validation, Y.L.; formal analysis, Y.L.; investigation, Y.L.; resources, Z.L.; data curation, Z.L.; writing—original draft preparation, Y.L.; writing—review and editing, Z.L.; visualization, Y.L.; supervision, Z.L.; project administration, Z.L.; funding acquisition, Z.L. All authors have read and agreed to the published version of the manuscript.
Funding
This research was supported by the National Natural Science Foundation of China (No. 41867039) and the Guangxi Key Laboratory of Geomechanics and Geotechnical Engineering (20-Y-XT-03).
Institutional Review Board Statement
Not applicable.
Informed Consent Statement
Not applicable.
Data Availability Statement
The original contributions presented in this study are included in this article. Further inquiries can be directed to the corresponding author.
Acknowledgments
The authors express their sincere appreciation to the anonymous reviewers for their insightful suggestions during the peer-review phase, and acknowledge the editorial team’s professional coordination in advancing the manuscript’s evaluation workflow.
Conflicts of Interest
The authors declare no conflicts of interest.
Abbreviations
The following abbreviations are used in this manuscript:
| OC | Organic Carbon |
| TN | Total Nitrogen |
| TP | Total Phosphorus |
| CEC | Cation Exchange Capacity |
| BSCs | Biological Soil Crusts |
| Bryum dichotomum | B. dichotomum |
| Glyphomitrium humillimum | G. humillimum |
| Pylaisiadelpha yokohamae | P. yokohamae |
References
- Yang, M.; He, Z.; Pi, G.; You, M. Spatiotemporal Variations in MODIS EVI and MODIS LAI and the Responses to Meteorological Drought across Different Slope Conditions in Karst Mountain Regions. Sustainability 2024, 16, 7870. [Google Scholar] [CrossRef]
- Zhang, X.; Bai, X.; He, X. Soil creeping in the weathering crust of carbonate rocks and underground soil losses in the karst mountain areas of southwest China. Carbonates Evaporites 2011, 26, 149–153. [Google Scholar] [CrossRef]
- Gao, Z.; He, W.; Yao, Y.; Huang, J. Revealing the Exacerbated Drought Stress Impacts on Regional Vegetation Ecosystems in Karst Areas with Vegetation Indices: A Case Study of Guilin, China. Sustainability 2025, 17, 1308. [Google Scholar] [CrossRef]
- Vieira, R.M.S.P.; Tomasella, J.; Alvalá, R.C.S.; Sestini, M.F.; Affonso, A.G.; Rodriguez, D.A.; Barbosa, A.A.; Cunha, A.P.M.A.; Valles, G.F.; Crepani, E.; et al. Identifying areas susceptible to desertification in the Brazilian northeast. Solid Earth 2015, 6, 347–360. [Google Scholar] [CrossRef]
- Bi, M.; Zhang, S.; Xu, Q.; Hou, S.; Han, M.; Yu, X. Coupling and synergistic relationships between soil aggregate stability and nutrient stoichiometric characteristics under different microtopographies on karst rocky desertification slopes. Catena 2024, 243, 108142. [Google Scholar] [CrossRef]
- Yang, T.; Wang, G.; Long, J.; Mi, J.; Yu, A.; Liu, X.; Zhang, H.; Dong, L.; Li, Z.; Zheng, C.; et al. Greater variation of soil organic carbon in limestone- than shale-based soil along soil depth in a subtropical coniferous forest within a karst faulted basin of China. Catena 2024, 246, 108389. [Google Scholar] [CrossRef]
- Wang, L.; Wang, P.; Sheng, M.; Tian, J. Ecological stoichiometry and environmental influencing factors of soil nutrients in the karst rocky desertification ecosystem, southwest China. Glob. Ecol. Conserv. 2018, 16, e00449. [Google Scholar] [CrossRef]
- Belnap, J.; Gillette, D. Disturbance of biological soil crusts: Impacts on potential wind erodibility of sandy desert soils in southeastern Utah. Land Degrad. Dev. 1997, 8, 355–362. [Google Scholar] [CrossRef]
- Lindo, Z.; Gonzalez, A. The Bryosphere: An integral and influential component of the Earth’s biosphere. Ecosystems 2010, 13, 612–627. [Google Scholar] [CrossRef]
- Zhao, Y.; Zhu, Q.; Li, P.; Zhao, L.; Wang, L.; Zheng, X.; Ma, H. Effects of artificially cultivated biological soil crusts on soil nutrients and biological activities in the Loess Plateau. J. Arid Land 2014, 6, 742–752. [Google Scholar] [CrossRef]
- Klarenberg, I.; Keuschnig, C.; Salazar, A.; Benning, L.; Vilhelmsson, O. Moss and underlying soil bacterial community structures are linked to moss functional traits. Ecol. Soc. Am. 2023, 14, e4447. [Google Scholar] [CrossRef]
- Paluszek, J. Estimation of cation exchange capacity and cation saturation of Luvisols developed from loess. J. Elem. 2014, 19, 1085–1098. [Google Scholar] [CrossRef]
- Albuquerque, C.; Gavelaki, F.; Mater, H.; Motta, A.; Prior, S.; Ercole, T.; Araújo, E. Relationship between pH and base saturation associated with soil cation exchange capacity in soils of Mato Grosso do Sul, Brazil. Soil Plant Nutr. 2024, 83, e20230291. [Google Scholar] [CrossRef]
- Thabit, F.; El-Shater, A.; Soliman, W. Role of silt and clay fractions in organic carbon and nitrogen stabilization in soils of some old fruit orchards in the Nile floodplain, Sohag Governorate, Egypt. J. Soil Sci. Plant Nutr. 2023, 23, 2525–2544. [Google Scholar] [CrossRef]
- Oliveira, M.; Souza, L.; Figueredo, C.; Maciel-Silva, A. Diversity and life strategies of cyanobacteria and bryophytes within biocrusts in the context of mining tailings disasters in Brazil. Plant Biol. 2025. Early View. [Google Scholar] [CrossRef]
- Rippy, J.F.; Nelson, P.V. Cation Exchange Capacity and Base Saturation Variation among Alberta, Canada, Moss Peats. HortScience 2007, 42, 349–352. [Google Scholar] [CrossRef]
- Sébastien, G.; Shreeve, T.; Pearce, D. Geochemistry of three contrasting British peatlands: Complex patterns of cation availability and implications for microbial metabolism. Geoderma 2010, 158, 207–215. [Google Scholar] [CrossRef]
- Rozenstein, O.; Karnieli, A. Identification and characterization of Biological Soil Crusts in a sand dune desert environment across Israel–Egypt border using LWIR emittance spectroscopy. J. Arid Environ. 2015, 112, 75–86. [Google Scholar] [CrossRef]
- Chen, R.; Tan, X.; Zhang, Y.; Chen, H.; Yin, B.; Zhu, X.; Chen, J. Monitoring rainfall events in desert areas using the spectral response of biological soil crusts to hydration: Evidence from the Gurbantunggut Desert, China. Remote Sens. Environ. 2023, 286, 113448. [Google Scholar] [CrossRef]
- Blanco-Sacristán, J.; Panigada, C.; Tagliabue, G.; Gentili, R.; Colombo, R.; Ladrón de Guevara, M.; Maestre, F.; Rossini, M. Spectral Diversity Successfully Estimates the α-Diversity of Biocrust-Forming Lichens. Remote Sens. 2019, 11, 2942. [Google Scholar] [CrossRef]
- Lehnert, L.; Jung, P.; Obermeier, W.; Büdel, B.; Bendix, J. Estimating Net Photosynthesis of Biological Soil Crusts in the Atacama Using Hyperspectral Remote Sensing. Remote Sens. 2018, 10, 891. [Google Scholar] [CrossRef]
- Walkley, A.; Black, I. An Examination of the Degtjareff Method for Determining Soil Organic Matter, and a Proposed Modification of the Chromoc Acid titration method. Soil Sci. 1934, 37, 29–38. [Google Scholar] [CrossRef]
- Bremner, J.; Tabatabai, M. Use of an ammonia electrode for determination of ammonia in Kjedahl. Analysis 1972, 3, 159–165. [Google Scholar]
- Wu, Y.; Wu, Z.; Jiang, S.; Lu, S.; Zhou, N. Elemental Stoichiometry (C, N, P) of Soil in the Wetland Critical Zone of Dongting Lake, China: Understanding Soil C, N and P Status at Greater Depth. Sustainability 2022, 14, 8337. [Google Scholar] [CrossRef]
- Song, F.; Xu, M.; Duan, Y.; Cai, Z.; Wen, S.; Chen, X.; Shi, W. Spatial variability of soil properties in red soil and its implications for site-specific fertilizer management. J. Integr. Agric. 2020, 19, 2313–2325. [Google Scholar] [CrossRef]
- Yu, X.; Xiao, B.; Cao, Y.; Kidron, G. Microbial-induced extracellular polymers are fundamentally responsible for the mechanical stability of biocrusts in drylands. Catena 2024, 245, 108349. [Google Scholar] [CrossRef]
- Xiao, L.; Zhang, W.; Hu, P.; Vesterdal, L.; Zhao, J.; Tang, L.; Xiao, D.; Wang, W. Mosses stimulate soil carbon and nitrogen accumulation during vegetation restoration in a humid subtropical area. Soil Biol. Biochem. 2023, 184, 109127. [Google Scholar] [CrossRef]
- Pang, J.; Bu, C.; Guo, Q.; Ju, M.; Jiang, M.; Mo, Q.; Wang, H. Spatial distribution and the influencing factors of organic carbon of biological crusts on regional scale in Mu Us sandy land, China. Chin. J. Appl. Ecol. 2022, 33, 1755–1763. (In Chinese) [Google Scholar] [CrossRef]
- Dou, W.; Xiao, B.; Daniel, R.; Manuel, D. Biocrusts enhance soil organic carbon stability and regulate the fate of new-input carbon in semiarid desert ecosystems. Sci. Total Environ. 2024, 918, 170794. [Google Scholar] [CrossRef]
- Liu, J.; Liu, W.; Long, X.; Chen, Y.; Huang, T.; Huo, J.; Duan, L.; Wang, X. Effects of nitrogen addition on C:N:P stoichiometry in moss crust-soil continuum in the N-limited Gurbantünggüt Desert, Northwest China. Eur. J. Soil Biol. 2020, 98, 103174. [Google Scholar] [CrossRef]
- Moore, T.R.; Bubier, J.L. Plant and Soil Nitrogen in an Ombrotrophic Peatland, Southern Canada. Ecosystems 2020, 23, 98–110. [Google Scholar] [CrossRef]
- Sun, H.; Li, Q.; Lei, Z. Ecological stoichiometry of nitrogen and phosphorus in Moso bamboo (Phyllostachys edulis) during the explosive growth period of new emergent shoots. J. Plant Res. 2019, 132, 107–115. [Google Scholar] [CrossRef] [PubMed]
- Du, E.; Liu, X.; Fang, J. Effects of nitrogen additions on biomass, stoichiometry and nutrient pools of moss Rhytidium rugosum in a boreal forest. Environ. Pollut. 2014, 188, 166–171. [Google Scholar] [CrossRef] [PubMed]
- Yu, C.; Zhang, H.; Zhao, X. Effects of moss crusts on soil enzyme activities and contents of soil carbon, nitrogen and phosphorus in a karst rocky desertification area. Chin. J. Soil Sci. 2023, 54, 1137–1147. [Google Scholar] [CrossRef]
- Zhang, Y.; Song, Y.; Wang, K. Carbon-nitrogen-phosphorus stoichiometry in tree organs of mid-subalpine forests. J. Ecol. 2019, 40, 339–348. (In Chinese) [Google Scholar]
- Melo, B.; Motta, F.; Santana, M. Humic acids: Structural properties and multiple functionalities for novel technological developments. Mater. Sci. Eng. C 2016, 62, 967–974. [Google Scholar] [CrossRef]
- Shi, R.; Li, J.; Ni, N. Effects of biomass ash, bone meal, and alkaline slag applied alone and combined on soil acidity and wheat growth. J. Soils Sediments 2017, 17, 2116–2126. [Google Scholar] [CrossRef]
- Xu, J.; Fang, L. Copper binding to soil fulvic and humic acids: NICA-Donnan modeling and conditional affinity spectra. J. Colloid Interface Sci. 2016, 473, 141–151. [Google Scholar] [CrossRef]
- Li, Z.; Wang, P.; Liu, L.; Zheng, Y.; Xie, D. High negative surface charge increases the acidification risk of purple soil in China. Catena 2021, 196, 104819. [Google Scholar] [CrossRef]
- Bouhjar, F.; Bessaïs, B.; Marí, B. Ultrathin-layer α-Fe2O3 deposited under hematite for solar water splitting. J. Solid State Electrochem. 2018, 22, 2347–2356. [Google Scholar] [CrossRef]
- Khadse, G.K. Spectral Reflectance Characteristics of the Soils on Basaltic Terrain of Central Indian Plateau. J. Indian Soc. Remote Sens. 2012, 40, 717–724. [Google Scholar] [CrossRef]
Disclaimer/Publisher’s Note: The statements, opinions and data contained in all publications are solely those of the individual author(s) and contributor(s) and not of MDPI and/or the editor(s). MDPI and/or the editor(s) disclaim responsibility for any injury to people or property resulting from any ideas, methods, instructions or products referred to in the content. |
© 2025 by the authors. Licensee MDPI, Basel, Switzerland. This article is an open access article distributed under the terms and conditions of the Creative Commons Attribution (CC BY) license (https://creativecommons.org/licenses/by/4.0/).

