Article

Life Cycle Assessment of Biocomposite Production in Development Stage from Coconut Fiber Utilization

by
Viviana Cecilia Soto-Barrera
*,
Fernando Begambre-González
*,
Karol Edith Vellojín-Muñoz
,
Daniel Fernando Fernandez-Hoyos
and
Franklin Manuel Torres-Bejarano
*
Environmental Engineering Department, Universidad de Córdoba, Carrera 6 # 77–305, Montería 230002, Colombia
*
Authors to whom correspondence should be addressed.
Sustainability 2025, 17(18), 8338; https://doi.org/10.3390/su17188338
Submission received: 13 August 2025 / Revised: 11 September 2025 / Accepted: 15 September 2025 / Published: 17 September 2025

Abstract

Agricultural biowaste poses a major environmental challenge when improperly disposed of. An alternative to this is their utilization for producing natural fibers (NFs) to manufacture biocomposites, promoting a circular economy. However, the fact that a product is classified as renewable does not necessarily imply that its environmental performance is superior when compared to its conventional market counterpart. For this reason, this study conducted a Life Cycle Assessment (LCA) of biocomposites reinforced with coconut fiber and a polyester resin matrix, using a “cradle-to-gate” approach. Six scenarios were evaluated, grouped into S1 (2–5% fiber) and S2 (20–30% fiber), with and without chemical treatment, plus a reference scenario without fiber utilization. The IPCC 2021 GWP 100 and ReCiPe Midpoint (H) 2016 methods were applied. The results show that the scenarios without chemical treatment (RF-CCT) were environmentally more optimal, reducing CO2 emissions by up to 7.4% (RF-CCT/H) and 1.70 kg CO2-eq (RF-CCT/L) compared to conventional practices. The main reasons for these reductions are the avoidance of emissions associated with disposal, decreased reliance on conventional materials, and the omission of chemical treatment, which in turn mitigates critical impacts such as ozone depletion potential (ODP) linked to N2O emissions from fertilizers (93% contribution) and terrestrial/marine toxicity.

1. Introduction

In recent years, rapid population growth and increasing global demand for food have led to the production of considerable amounts of agricultural waste [1,2]. Globally, approximately 140 billion tons of agricultural waste are generated each year, of which Colombia generates about 72 million tons [3]. This is an important activity within the country’s economy [4,5,6,7,8].
Biowaste poses a significant environmental challenge due to its impact on ecosystems and its contribution to global warming through the generation of greenhouse gases (GHGs) [9,10,11]. The incineration of diverse types of biowaste can release greenhouse gases such as carbon dioxide, methane, and nitrous oxide, thereby intensifying climate change [12,13].
This has led to growing global awareness of sustainability, which has motivated a great deal of innovation in research and the implementation of environmental solutions in everyday activities [14]. For this reason, many researchers are working to reintegrate biowaste into the economy by developing new environmentally friendly materials [15]. One approach involves processing natural fibers, strands not engineered or manufactured by humans, that can be sourced from plants such as flax, jute, cotton, hemp, coconut mesocarp, and banana pseudostem and from animals, including wool and silk. These fibers are valuable for producing composite materials, which are combined with a wide range of polymer matrices such as polypropylene (PP), polyethylene (PE), polystyrene (PS), epoxy resin (EP), recycled polypropylene (r-PP), and natural rubber [3,16,17].
In particular, the mesocarp of the coconut is one of the main residues from the production of this fruit, representing around 33% of it. Its improper disposal causes environmental problems as it is often incinerated to obtain ash [18,19]. The recycling of coconut waste, especially from the husk, is a valuable source of natural compounds, which can be transformed into natural fiber composites (NFCs). This not only provides environmental benefits but also contributes to strengthening the circular economy [20]. In this context, natural fiber composites (NFCs) emerge as a promising group of materials capable of replacing or significantly reducing the amount of polymer used while also enhancing the physical properties of the final product [21,22]. The uses of NFCs cover a wide range of applications in people’s daily lives, from construction and manufacturing to furniture, electrical appliances, sporting goods, and the automotive industry, among others [21,23].
One way to assess the environmental sustainability of these biomaterials is by analyzing their manufacturing processes and the associated environmental impacts. Although a product may be labeled as renewable, this does not necessarily imply that it performs better environmentally than its conventional counterpart on the market [24,25]. The aim is to determine whether these impacts are lower than those generated by the manufacture of conventional polymeric materials. Based on the above, and taking into account that the transport, manufacturing, and construction industries have been the main contributors to GHG emissions, it is necessary to assess emissions throughout a product’s life cycle and its impact on the environment.
In this context, the Life Cycle Assessment (LCA) method is a measurement tool that enables a comprehensive evaluation of the environmental impacts associated with a product or process [26,27]. The application of an LCA can be useful for designers, engineers, and decision-makers, as it provides an analytical evaluation from an environmental perspective [28]. Various tools and methodologies can be used to carry out an LCA. Among them is SimaPro (9.06.01) software, which is based on the methodology of the international technical standard ISO 14044 [29], which establishes the principles and framework for conducting an LCA in a rigorous and standardized manner [30]. SimaPro is a computer program widely used in scientific research due to its ability to comprehensively model and evaluate the life cycle of a product or service [31]. This study aims to evaluate the environmental impacts of the life cycle—from cradle to manufacturing—of a polymer matrix biocomposite reinforced with coconut fiber.

2. Materials and Methods

This study was based on the Life Cycle Assessment (LCA) approach in accordance with the guidelines established by ISO 14044, which includes the following stages: (1) the definition of objectives and scope, (2) life cycle inventory (LCI), (3) life cycle impact assessment (LCIA), and (4) interpretation of results, followed by recommendations aimed at improvement.

2.1. System Boundaries

For this study, the most recent year of production of immature green coconut was considered, taking into account on-site utilization, followed by fiber extraction and biomaterial production on a laboratory scale, using 1 kg of this as a functional unit (Figure 1). The approach used was from cradle to manufacturing with a cut-off that allowed the production phase to be established as the starting point, given that plantations in the area are decades old (which complicates possible data collection) and their establishment was not motivated by demand for fiber. As noted in the “Cut-off” Section of the research conducted by [32], they state that the cut-off point is used when the limitation does not substantially alter the conclusions and also if there is a lack of data. In addition, coconut is a perennial crop that lasts for many years. Similarly, it is assumed that coconut cultivation and harvesting for meso-carp is not currently being carried out, but rather that the residues are being used as a form of recycling [33].

2.2. LCA Methods

The impact assessment method selected was ReCiPe Midpoint Hierarchist (H) 2016 and IPCC 2021. In this way, the environmental burden associated with GHG emissions (IPCC 2021) and 18 impact categories established in ReCipe were analyzed.
Below is additional information on each midpoint category in the context of the ReCiPe/midpoint: 1. Ozone depletion potential (ODP): integrated decrease in stratospheric ozone over time. 2. Ionizing radiation (IRP): increase in absorbed dose. 3. Fine particle formation (PMFP): increase in PM2.5 intake by the human population. 4. Formation of photochemical oxidants (terrestrial ecosystems) (EOFP): increase in tropospheric ozone. 5. Formation of photochemical oxidants (human health) (HOFP): intake of tropospheric ozone by the population. 6. Terrestrial acidification (TAP): increase in protons in natural soils. 7. Freshwater eutrophication (FEP): increase in phosphorus in freshwater. 8. Marine eutrophication (MEP). 9. Human carcinogenic toxicity (HTPc): increased risk of cancer incidence. 10. Human non-carcinogenic toxicity (HTPnc): increased risk of incidence of non-cancerous diseases. 11. Terrestrial ecotoxicity (TETP): risk-weighted increase in natural soils. 12. Freshwater ecotoxicity (FETP): risk-weighted increase in freshwater. 13. Marine ecotoxicity (METP): risk-weighted increase in marine water. 14. Land use (LOP): land occupation and transformation over time. 15. Water use (WCP): increase in water consumption. 16. Mineral resource scarcity (SOP): increase in mined minerals. 17. Fossil resource scarcity (FFP): higher calorific value. 18. Climate change: global warming potential. Given that the categories use different units of measurement, a standardization process was generated using software to provide a comparable framework for interpreting the EICV results and facilitating the identification of the most important impact categories.
For this study, category 18. climate change was excluded because it is addressed using the IPCC 2021 methodology. To avoid redundancy in the analysis with this impact assessment methodology, it was not included in the analysis.
As for the IPCC 2021 method, the impact of GHGs was analyzed based on the content of CO2, N2O, CH4 fossil, CH4 non-fossil, HFC-32, HFC-134a, CFC-11, and PFC-14 converted to CO2-eq using emissions metrics for global warming potential (GWP) described by [34,35] in Table 7.15 of Chapter 7 and Table 7.SM.7, respectively [33]. This method quantifies the increase in the integrated infrared radiative impact of a greenhouse gas expressed in CO2-eq.

2.3. Data Collection for Building Farm Inventories

The data presented in this research are primary and secondary in nature. The primary data were obtained through visits to communities, analysis of technology packages for the cultivation phase, and laboratory process results. The inputs and outputs of the unit processes defined within the system, such as energy use, materials, emissions, and waste, were recorded for the cultivation, fiber production, and composite material production phases. Secondary data were collected through a review of the literature in reference books, scientific journals, and other documentary sources (Table 1).
Information on coconut production was collected at the “La Bendición” farm, located in the municipality of Puerto Escondido, on the coast of the department of Córdoba, which has been producing coconuts for more than 25 years. The farm in question is representative of practices in the municipality of Puerto Escondido, as it belongs to the coconut growers’ association ASOCOLCO [36], which standardizes technology packages and the use of inputs for its members. Data on coconut fiber extraction was collected in laboratories at the University of Córdoba, replicating standardized processes. Secondary data related to electricity generation, chemical products, and diesel (background processes) was obtained from the ecoinvent version 3.0 database [37]. According to the 2021 Energy Outlook for Latin America and the Caribbean, Colombia’s electricity mix consists of oil (38%), natural gas (25%), coal (13%), and hydroelectric power (12%) [38].

2.4. Coconut Crop

At the “La Bendición” farm, coconut cultivation is divided into phases, similar to how it is described [39,40]. The first stage consists of preparing the land, which involves clearing the area, establishing planting lines, and creating holes for planting, followed by a growth phase that lasts four years and then the production phase. However, as mentioned above, it was decided to exclude the phases of land preparation, seedling establishment, and growth from the analysis, since it is considered that the use of mesocarp (recycling) should not incorporate the impacts associated with primary coconut production. In other words, coconut trees are cultivated for fruit production, not specifically for mesocarp. However, the production phase was included in the analysis because, at this stage, with the system already in place, the use of this material is considered part of the overall process.
During the production phase, data were collected for one year. Each tree produces around 100 coconuts, with a total weight of 162 kg per coconut. During this time, 6 m3 of water, 2 kg of chicken manure per year, and 3 kg of potassium chloride (1 kg applied three times) are used. In addition, CO2 capture by biomass (coconut fiber) was estimated, which is relevant because it allows the absorbed CO2 to remain retained for an additional period while giving it a second useful life, reaching a value of 0.9407 kg of CO2 for every 0.6419 kg of dry fiber produced, as well as carbon capture by the tree. For the transport of supplies, it was estimated that vehicles travel an average distance of 18.15 km per year. This was calculated taking into account the 3.3 km journey from the farm to the loading port, the number of supplies that must be purchased, and the fact that each of these lasts for one year.

2.5. Calculation of Coconut Crop Emissions

As for emissions into water, nitrate leaching was estimated using the SQCB method proposed by [41], phosphorus emissions from erosion in surface waters were calculated according to [42]. Among air emissions, ammonia (NH4) release was calculated using the Agrammon model proposed by [42] and carbon dioxide (CO2) emitted by the transport of inputs from the nearest urban center to the farm was calculated using an emission factor. Likewise, nitrous oxide (N2O) emissions were estimated following the guidelines of [43] and nitrogen oxide (NOx) emissions were estimated according to [44].
The farm in question is located approximately 10 m from the beach, where small streams were observed flowing directly into the sea. In addition to this, a literature review revealed that the farm is located in an aquifer zone, specifically the Arenas Monas aquifer system, which covers an area of approximately 1162 km2, and therefore, these emissions were taken into account [45]. Therefore, emissions of heavy metals into soil, surface water, and groundwater were also estimated using the method proposed by [42]. Agricultural pesticide emissions were determined by the amount of active ingredients entering the system and released into the soil, as described by [41]. Data on the ecophysiology and morphology of coconut palms were obtained from the database compiled by [46] for coconut populations in Colombia, which allowed us to estimate the CO2 captured by the tree. Similarly, we estimated the CO2 captured by the fruit’s biomass, specifically by the husk, using the characterization of the mesocarp composition reported by [47].

2.6. Fiber Extraction

Once the waste was obtained, the following processes were carried out to extract the fiber: (1) Maceration, which consists of submerging the mesocarp for 48 h in order to soften the cuticle and prepare it for the next phase, (2) Extraction, where the fibers are extracted manually, (3) Washing, in which the fibers are washed to separate unwanted plant material, (4) Mercerization, in which the fibers are immersed in solutions of sodium hydroxide (NaOH) and 70% acetic acid (CH3COOH) to improve their physical properties, and finally, (5) Drying, in which the fibers are dried in an oven. After this last step, the fiber is ready for biocomposite production. Measurements were taken using scales with different levels of precision, test tubes, and mass balances.

2.7. Physicochemical Characterization of Wastewater

To assess one of the impacts generated during the fiber extraction phase, an evaluation of the physical–chemical parameters of the wastewater was carried out. For the first sampling campaign, a 100 mL sample was taken in a beaker and the levels of temperature, inorganic phosphorus (PO4), ammonia (NH3), pH, nitrates (NO3) and nitrites (NO2) were measured. To confirm the accuracy of the results, the analysis was repeated a second time, this time measuring values such as dissolved oxygen, the percentage of dissolved oxygen, electrical conductivity, total dissolved solids, salinity, and turbidity. Important organic load parameters were estimated using average BOD5 and COD values from the Ecoinvent database, assigned according to the volume of effluent generated.

2.8. VARTM

This is a variant of the Resin Transfer Molding (RTM) process, in which the resin is injected by applying vacuum pressure inside the mold, allowing the resin to flow from the storage container into the mold, thus impregnating the fibers [19]. As a final step, the data were adjusted to represent the quantities needed to manufacture 1 kg of biomaterial, considering three previously defined scenarios.

2.9. Data Quality Analysis

Assessing data quality is an important step in ensuring comprehensive life cycle analysis [48]. To perform this analysis, a Pedigree matrix analysis was carried out, which uses a semi-quantitative approach to determine data quality [49]. This genealogical matrix categorizes data according to its level of reliability, considering aspects such as the origin, age, and completeness of the information, specifically Technological Representativeness ( T e R ), Geographic Representativeness ( G R ), Temporal Representativeness ( T i R ), Completeness ( C ), Parameter Uncertainty ( P ), and Methodological Adequacy and Consistency ( M ) [50,51,52].
Each category was assigned a value between 1 and 5, where 1 is the highest quality level and 5 is the lowest (Table 2). In addition, parameter uncertainty ( P ) is included, which rates the accuracy of inventory data related to direct measurements. Equation (1) is used for Data Quality Rating ( D Q R ), which calculates the average of the indicators at the overall level of the inventory data.
D Q R = T e R + G R + T i R + C + P + M + X w * 4 i + 4
where X w represents the lowest quality level obtained, indicated by the highest numerical value among the data quality indicators. The expression i indicates the number of applicable data indicators. Once the DQR results were obtained, Table 2 was used, which shows the ratings relative to the level of data quality, in which 1 to 1.6 indicate very high data quality, while values between 1.7 and 2.4 indicate high data quality. If the DQR result is >2.5, the data quality is satisfactory, while for values above 3.3, the quality is low [53].

2.10. Scenario Analysis

The objective of constructing scenarios is to analyze whether the results vary when different production processes are adopted in the manufacturing of coconut fiber-based biomaterials [54] and, in this way, establish a reference scenario to compare whether the utilization of the material is environmentally beneficial. The scenarios established for this research are presented below (Table 3).
The first scenario, labeled CCP/L, represents conventional agricultural practices. In this context, it is assumed that there is no utilization of coconut mesocarp residues, which are simply discarded. For the final disposal of coconut shell waste, the selected waste treatment methods from SimaPro were open burning and open dumping, similar to those used for wood waste. The results obtained are based on the amount of waste input, while the outputs correspond to average values for Colombia calculated by [55]. Additionally, in this scenario, the polymer matrix materials are produced using conventional methods, without incorporating residues or making any combinations. The scenarios labeled CF-CCT/L and RF-CCT/L refer to fiber extraction with and without chemical treatment, respectively. Similarly, three scenarios were established in which the amount of fiber used increases by 20 to 30% for recovery, and they differ based on the application of chemical treatment (CF-CCT/H and RF-CCT/H). Finally, to ensure a fair comparison between fiber utilization and non-utilization, the analysis was conducted based on the amount of fiber used. As a result, two main groups were defined to encompass the previously described scenarios. That is, if a biomaterial is produced with a replacement of between 2 and 5% fiber, with and without treatment, it was compared with the scenario in which the fiber is not used, considering the amount of coconut produced (S1), in the same way for the case where the replacement is increased (S2).

3. Results and Discussion

Regarding data quality analysis, the results showed that 50% of the data were of satisfactory quality, followed by 40% of high quality and 3% of very high quality, the latter result due to the fact that the data could be replicated up to three times in its collection. (Figure 2). The technology and methodology used to collect the data are standardized. Furthermore, the data were collected very recently and were taken directly from the study area (the characterization of wastewater generated in the maceration process). In contrast to this result, only 7% of the data were obtained with low quality, with results of 3.51 (not far from the lower limit of 3.2 and not very close to the upper limit of 4). As explained in the previous section, reference is made to “steam water” in the drying of fibers and losses due to evaporation in the defibering process, where mass balances were used, assuming that what was emitted was steam water. Table 4 presents the results of data quality analysis for each of the processes that were part of the research.
For artisanal coconut producers in the municipality of Puerto Escondido, the most relevant environmental aspect is the use of fertilizers, while water use is considered sustainable, as local producers claim that coconut trees do not require complex irrigation systems during the production stage. The amount of water from rainfall is sufficient for its operation, given that the coconut tree has considerable resistance to prolonged periods of drought [56,57,58].
Likewise, the inputs and outputs for the fiber extraction process are presented, where the materials used, such as coconut mats, drinking water, chemicals (NaOH and CH3COOH), and electricity, as well as by-products such as wastewater and organic waste, were recorded. The process culminates in the production of a 1 kg composite biomaterial, which is the functional unit, using dry fiber, resin, and release wax, thus reflecting the resources consumed and the outputs generated (See Table 5). The inventory presented only includes scenarios with the acronym “CF,” since those corresponding to “RF” generate the same results, with the only difference being the omission of the mercerization process.
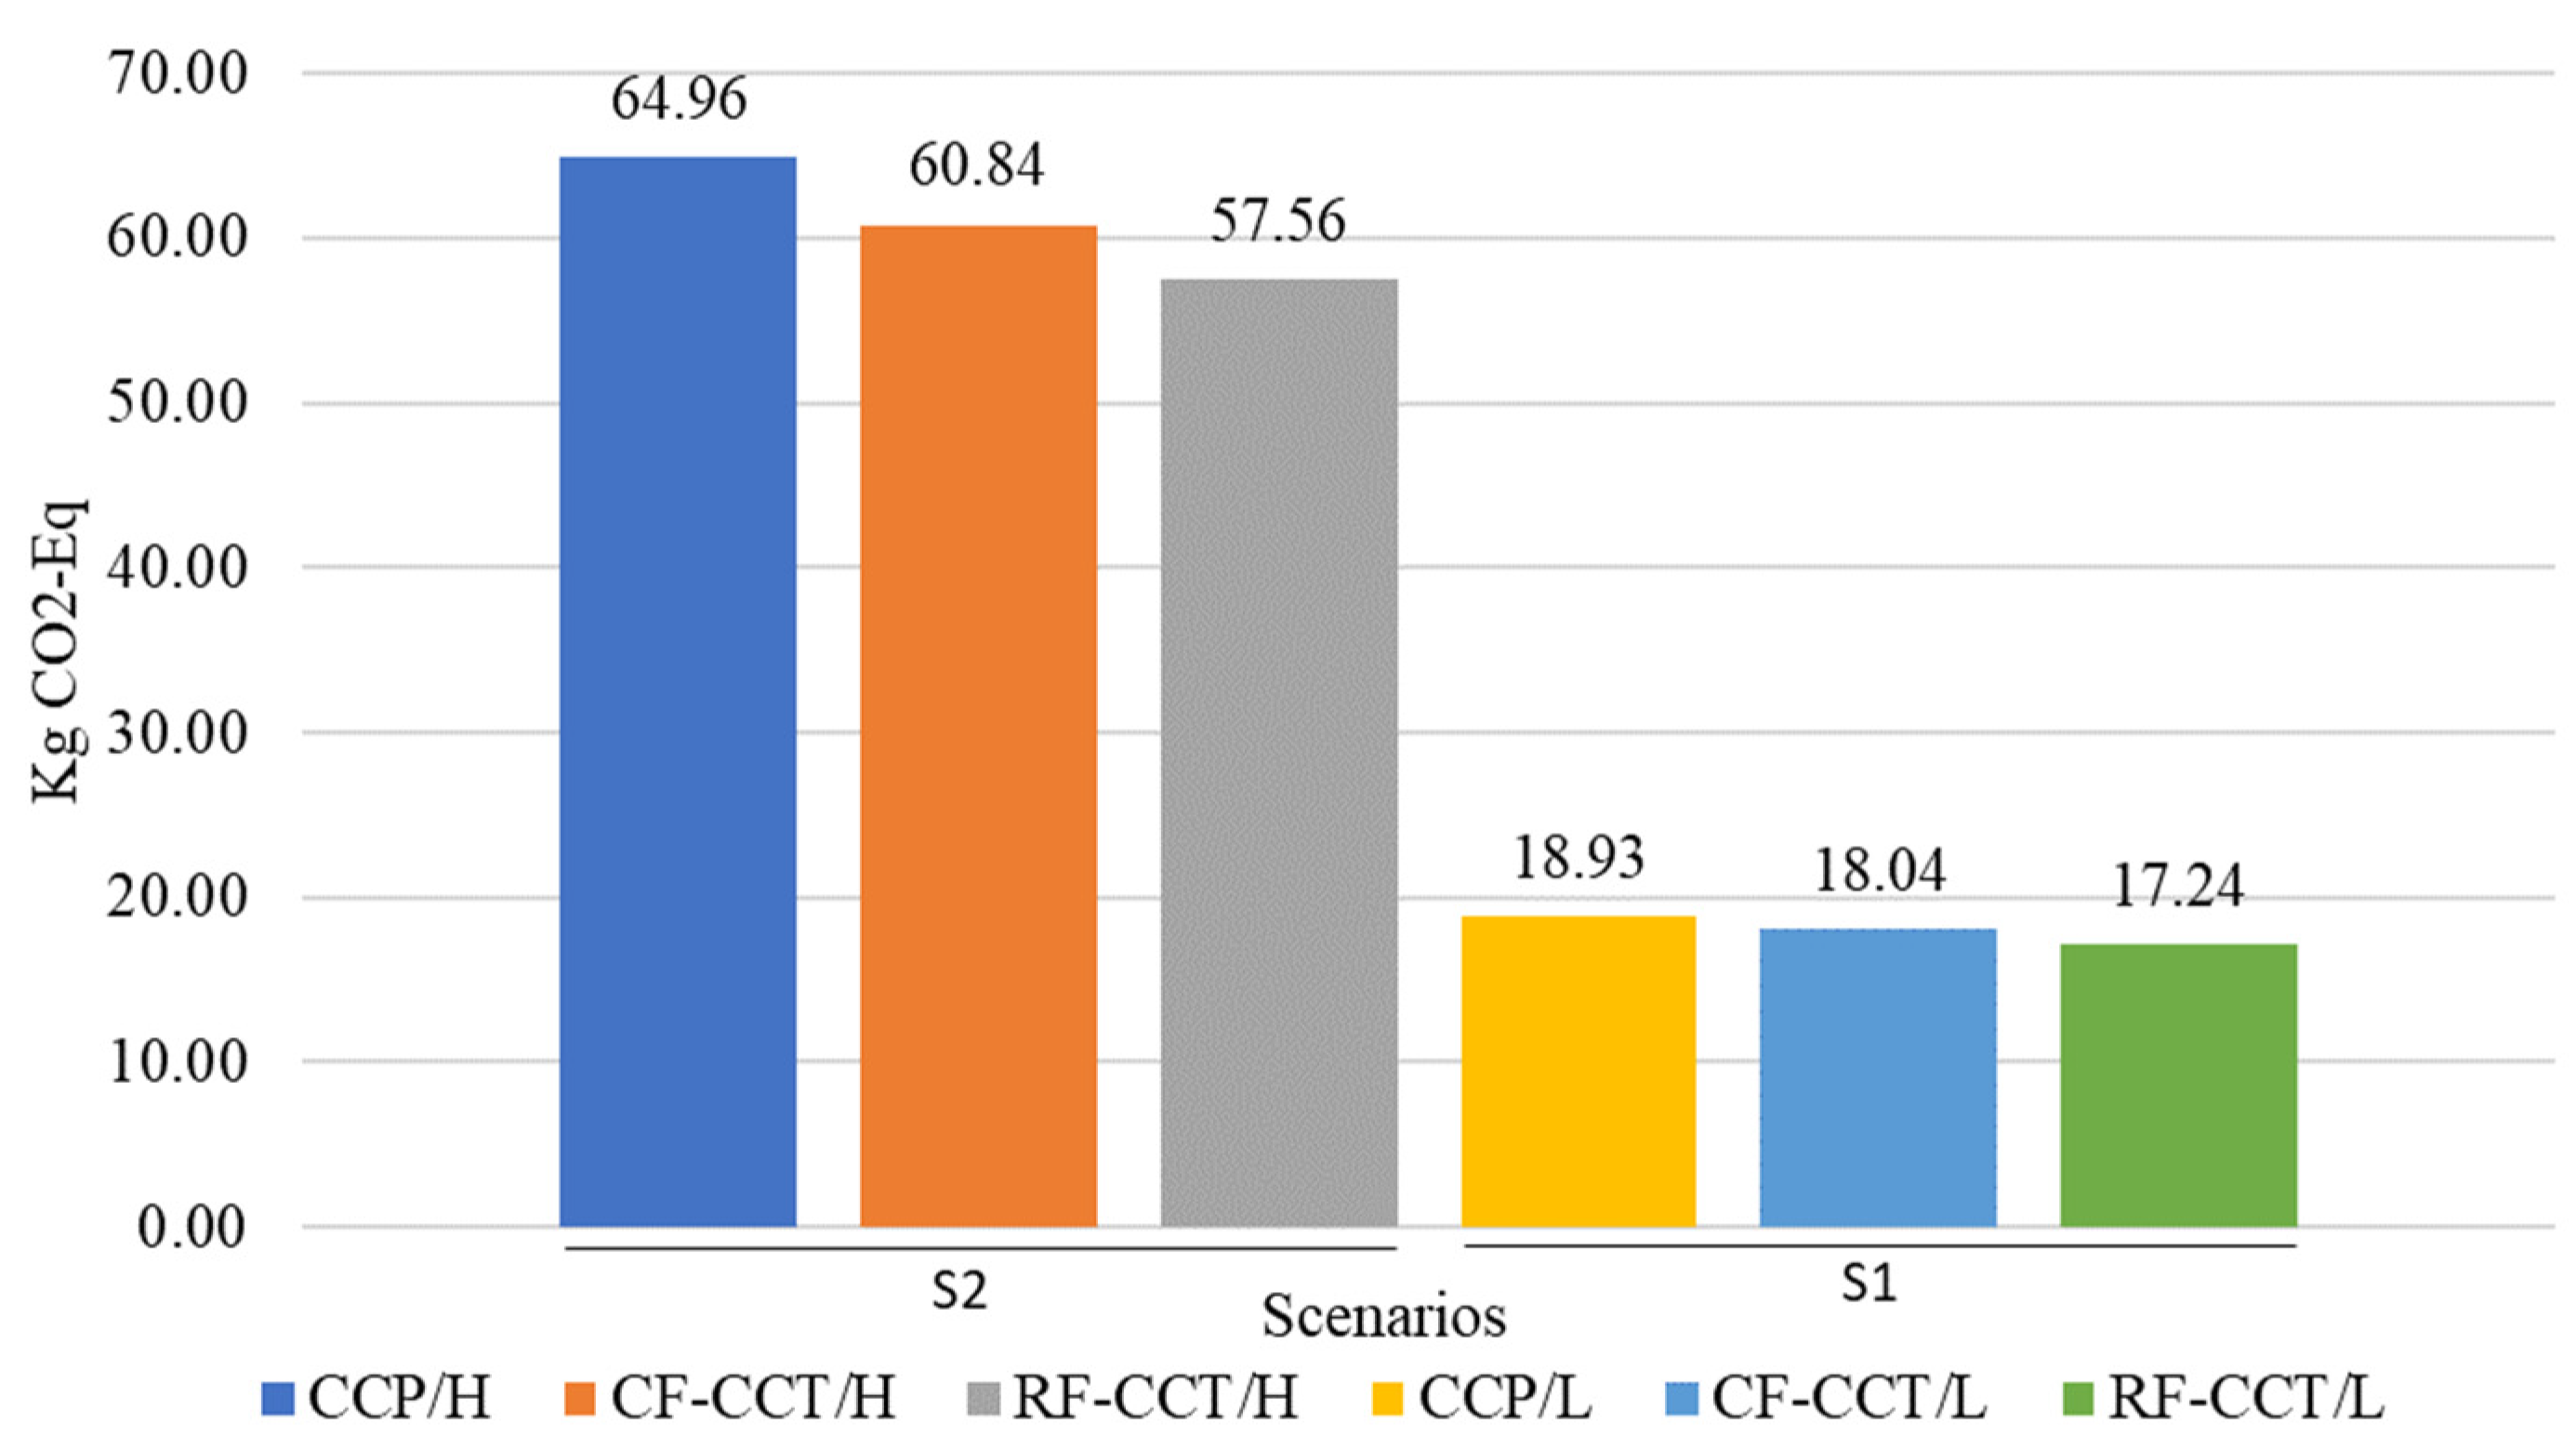
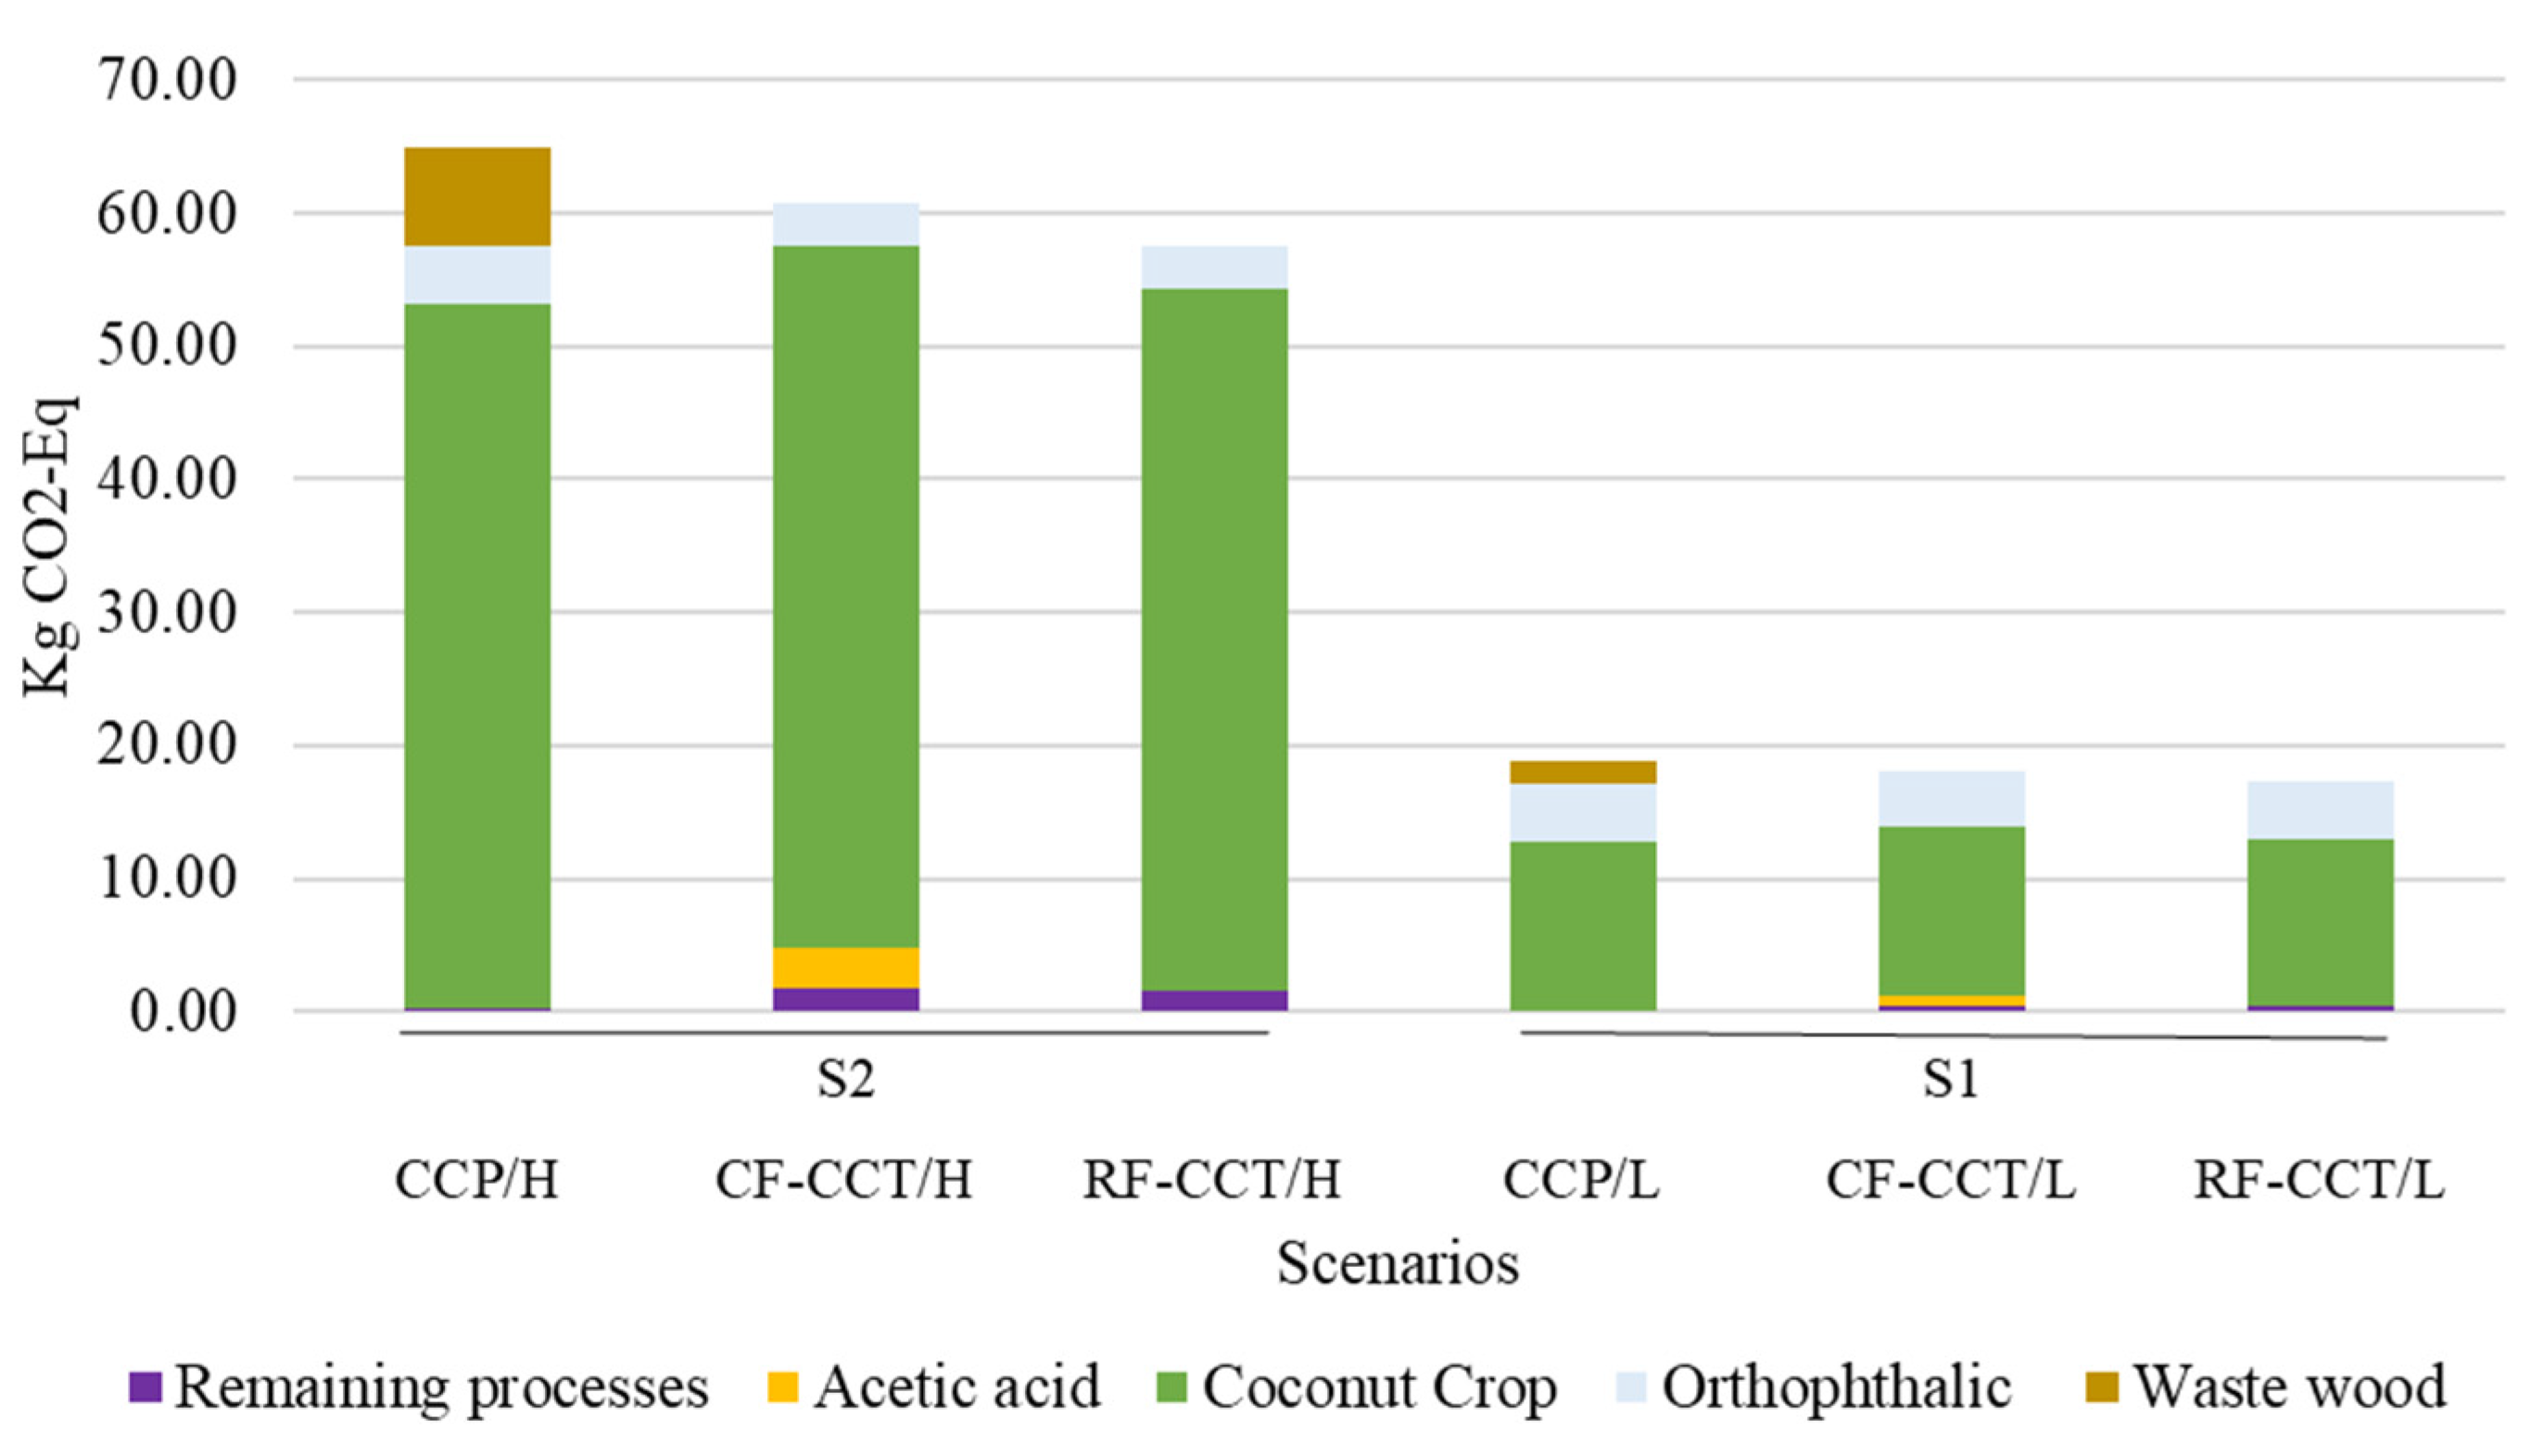
The results indicate that scenarios incorporating coconut fiber lead to a reduction in carbon footprint compared to those involving conventional practices. For instance, in S2, the CCP/H scenario resulted in emissions of 64.96 kg CO2-eq, while the CF-CCT/H and RF-CCT/H scenarios showed lower values of 60.84 kg CO2-eq and 57.56 kg CO2-eq, respectively. A similar trend is observed in the S1 group, where CCP/L recorded 18.93 kg CO2-eq, compared to 18.04 kg CO2-eq for CF-CCT/L and 17.24 kg CO2-eq for RF-CCT/L (Figure 3). The main reason for this reduction in carbon footprint lies in the elimination of the open-air burning of coconut waste, a common practice in conventional scenarios, and the reintroduction of this waste into the circular economy, as can be seen in Figure 4, which shows the sources of emissions by process, where open burning for S1 and S2 accounted for 11.36% and 9.3% (CPP/H and CPP/L).
By using coconut fiber, emissions associated with burning were not only avoided, but dependence on conventional polymeric materials was also reduced, contributing to a lower environmental impact. Furthermore, both chemically treated and untreated fiber proved to be viable alternatives for reducing environmental impact, with the untreated fiber scenario achieving the lowest carbon footprint.
For example, [59] conducted a study evaluating the physical and environmental performance of using coconut fibers as reinforcement in concrete manufacturing. Although the study did not consider the fiber cultivation phase, the results showed that replacing 1% of the fiber with coconut fiber reduced CO2 emissions by approximately 5%. Specifically, for the production of 1 m3 of “bioconcrete,” an estimated reduction of 4.55 kg of CO2 was achieved. In the present study, a replacement in scenario S1 with chemical treatment allowed for a 6.17% reduction in CO2 emissions, and without chemical treatment, a 10.77% reduction in CO2 emissions, compared to the scenario without utilization. In group S2, savings of 4.72% in CO2 emissions were achieved with chemical treatment and 8.95% in CO2 emissions without chemical treatment, compared to the scenario without utilization.
On the other hand, in [54], the authors conducted a Life Cycle Assessment (LCA) of three new fiberboards made from coconut shells in Brazil, identifying that, during the cultivation phase, the most significant impacts were due to the use of fertilizers, generating emissions of nitrogen compounds. It was estimated that, for the production of 1 kg of coconut over 17 years, 0.16 kg of NO2 was emitted into the air. In contrast, our research found emissions of 0.057 kg of NO2 for the production of 1.38 kg of coconut in the CPP/L scenario of group S1 and 0.05742 kg of NO2 for 5.78 kg of coconut in group S2’s CPP/H scenario. These differences can be attributed to factors such as the duration of the study, the quantities of coconut produced, the types of fertilizers used, and the climatic and environmental characteristics of the study areas, so caution should be exercised when comparing these results.
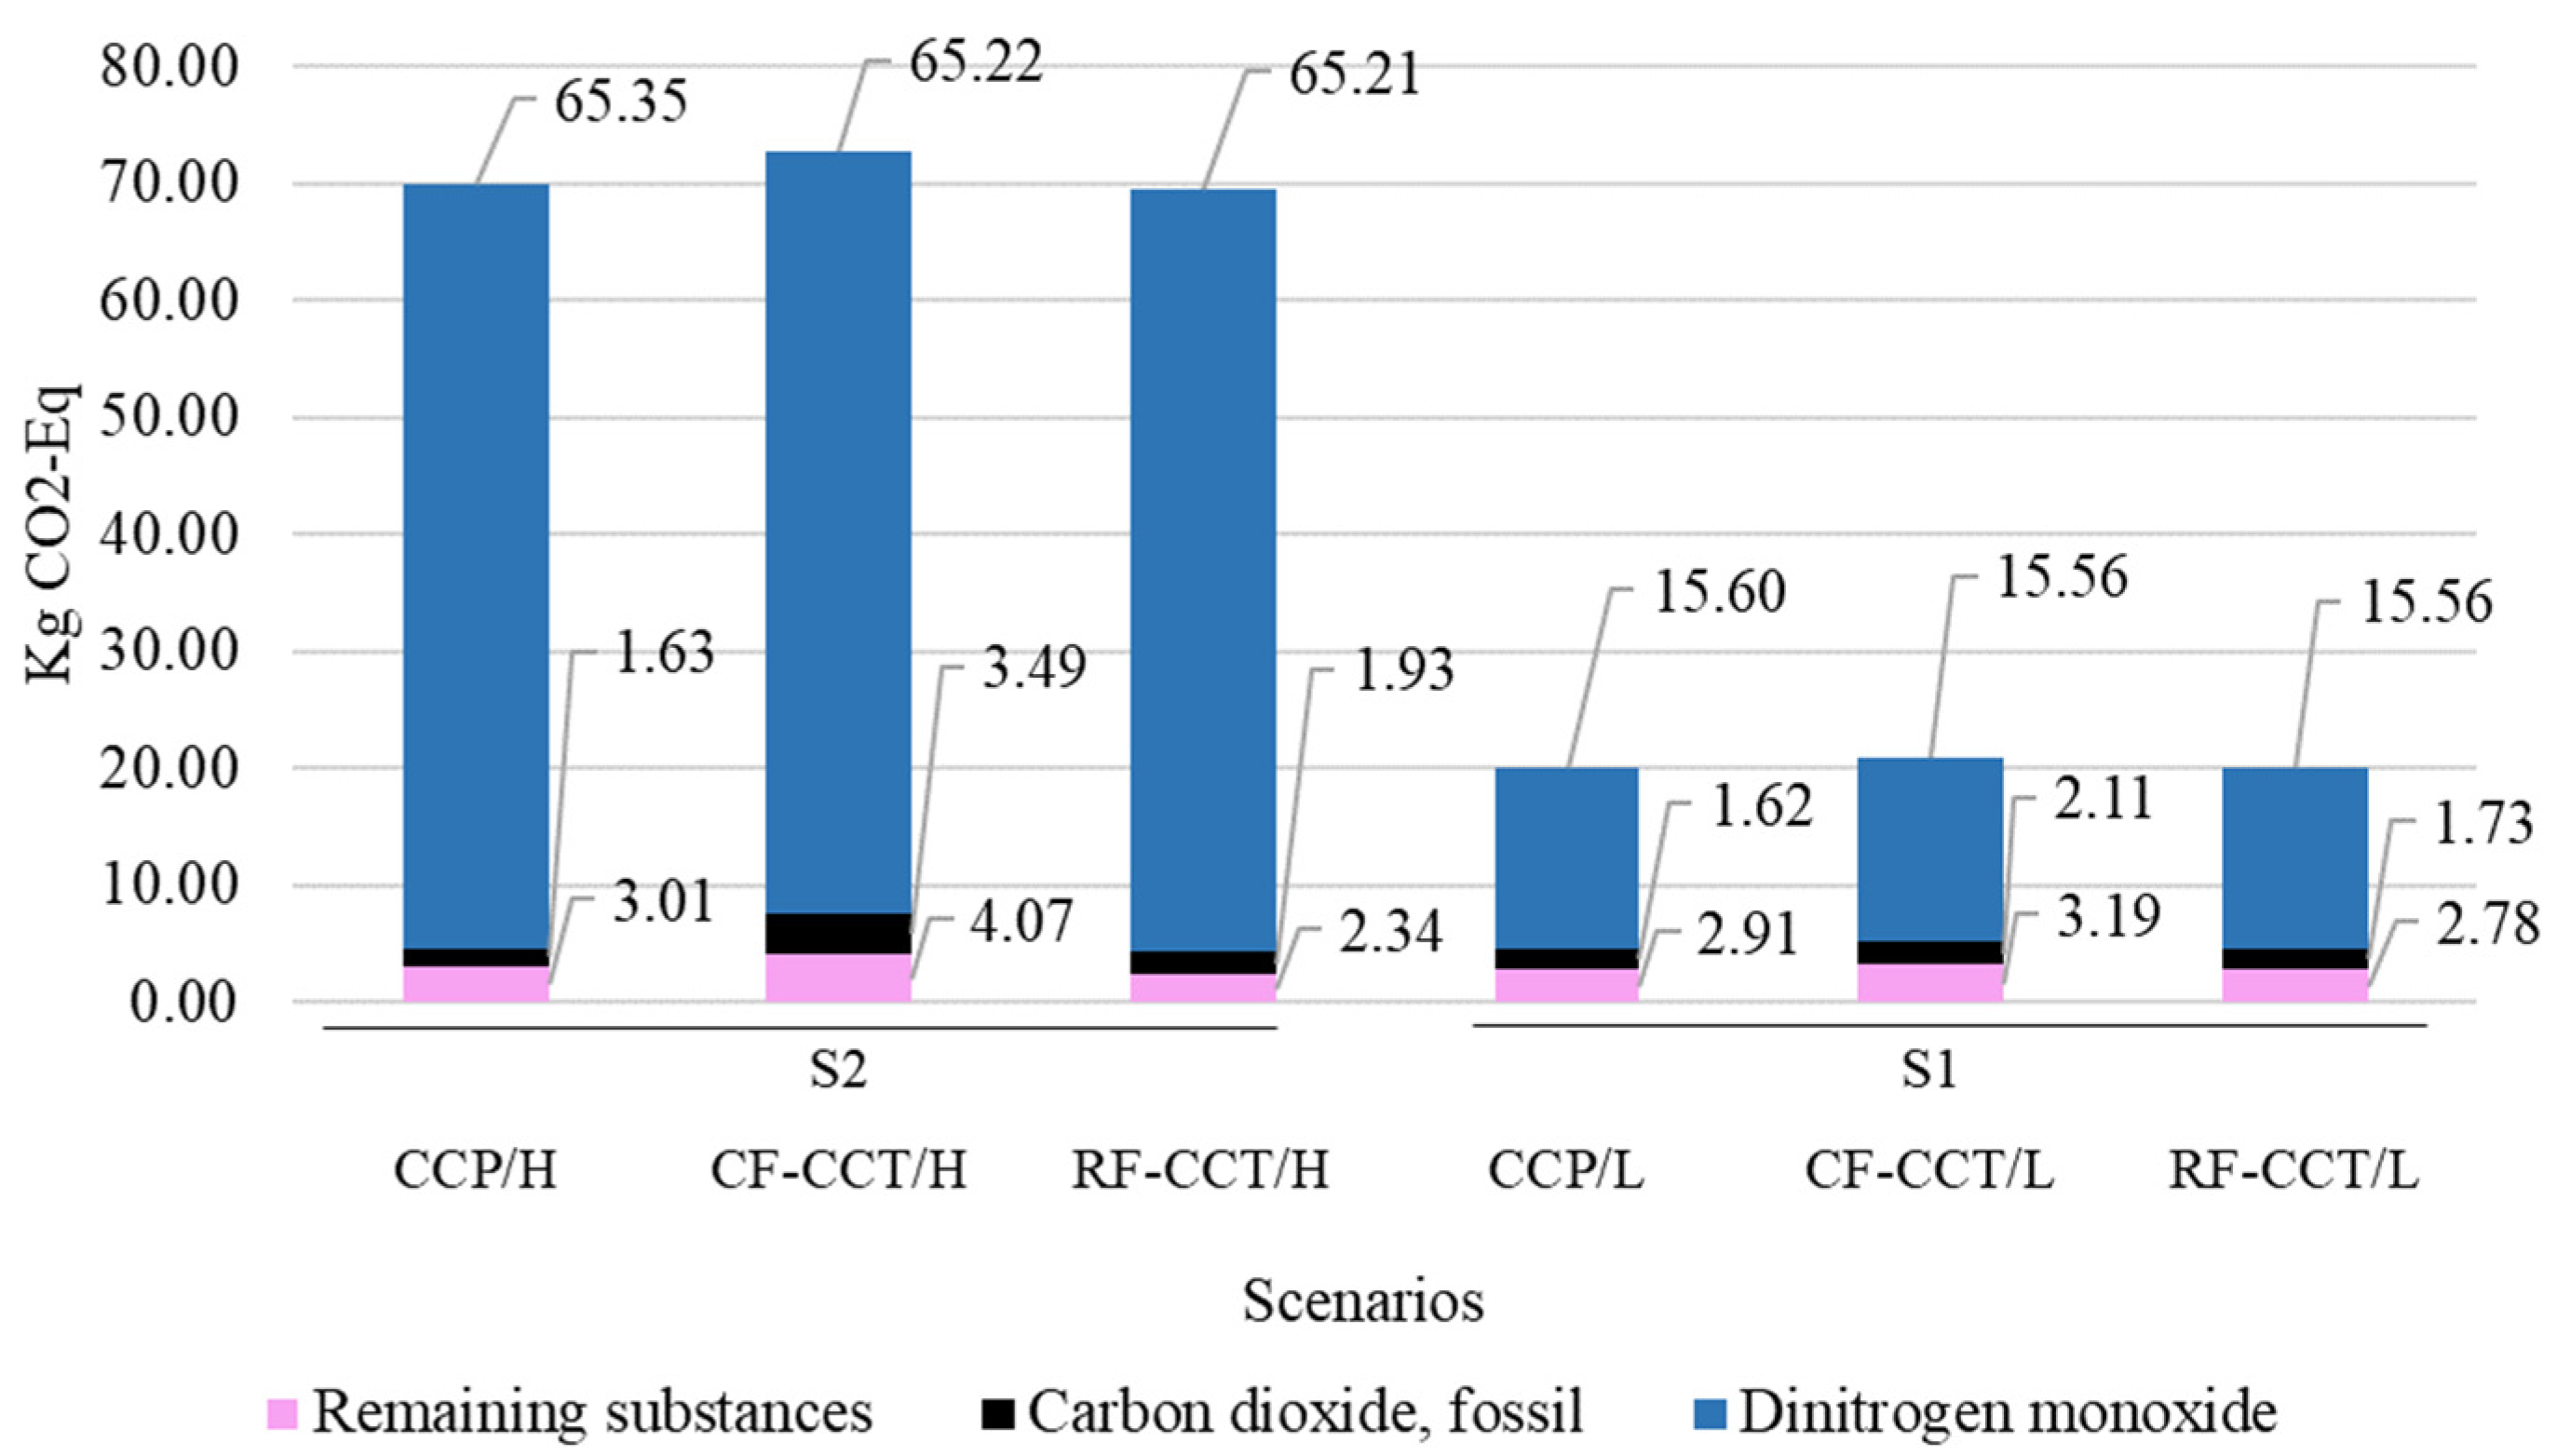
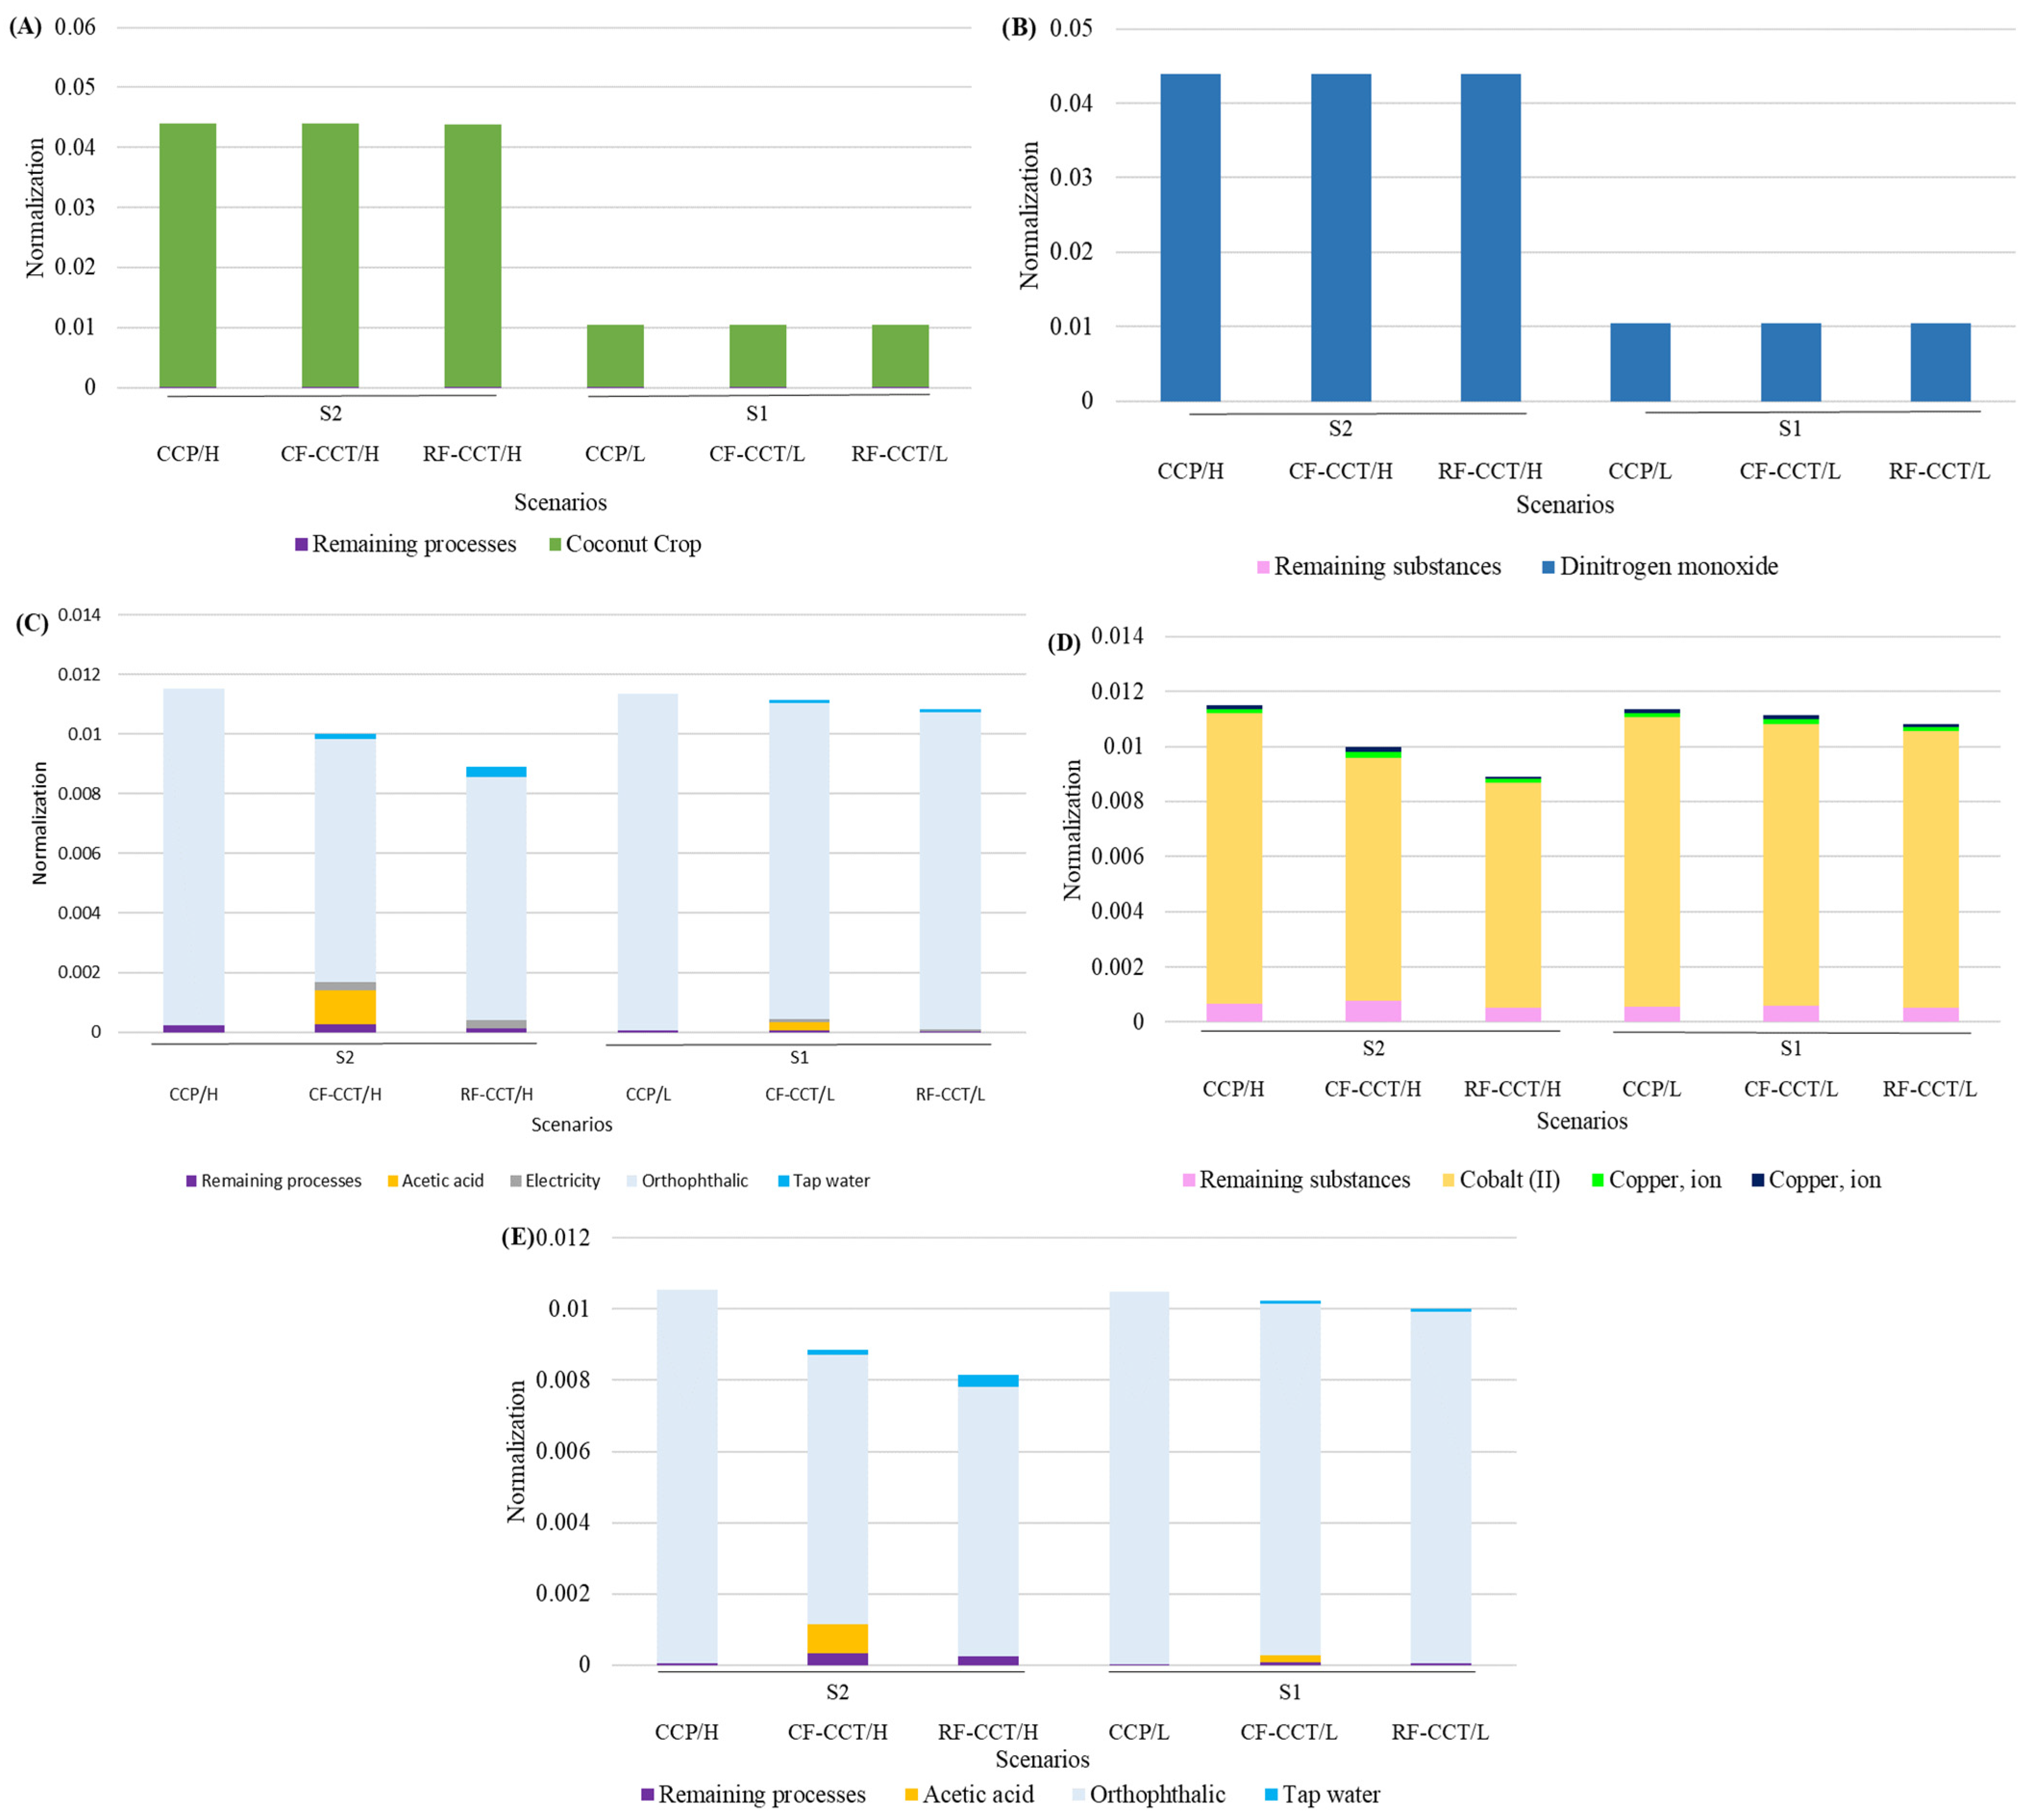
Consequently, as can be seen in Figure 4 and Figure 5 (the latter showing the sources of emissions by substance), this impact category increased in all the scenarios analyzed, due to N2O emissions generated during the cultivation phase. These emissions accounted for 93.4% in the CCP/H scenario, 89.6% in CF-CCT/H, 93.9% in RF-CCT/H, 77.5% in CCP/L, 74.6% in CF-CCT/L, and 77.6% in RF-CCT/L, respectively. The application of fertilizers generates emissions of nitrogen compounds into the air as a result of volatilization due to nitrogen that is not fully assimilated by plants [54,60]. This powerful greenhouse gas has a significantly higher global warming potential than carbon dioxide (CO2). Its warming potential is estimated to be approximately 270 to 310 times greater than CO2 over a century, making it a critical focus in discussions about climate change [61,62]. In a life cycle analysis specifically of coconut cultivation conducted by [40] in India, fertilization was responsible for approximately 70% of CO2 emissions corresponding to the IPCC 2021 GWP100 category.
With regard to the comparison between treated and untreated fiber scenarios, those involving chemical treatment showed the highest CO2 emissions. In group S1, treated fibers emitted 3.28 kg CO2-eq more than the non-utilization scenario, while in group S2, the difference was 0.80 kg CO2-eq. These results suggest that the most environmentally favorable scenario is RF CCT/H, which achieves a high replacement level while reducing emissions by 7.40 kg CO2-eq compared to the non-utilization scenario in S1. Similarly, in RF CCT/L, emissions were 1.70 kg CO2-eq lower than in the non-utilization scenario of S2. These differences are mainly attributed to the fiber extraction stage. By avoiding chemical treatment, inputs such as acetic acid and sodium hydroxide, whose production contributes significantly to emissions, are no longer required. As [63] noted in a study using banana fibers, scenarios with untreated fibers showed a lower environmental impact due to the absence of energy-intensive chemical processes. Likewise, ref. [64] assessed the environmental impact of alkaline treatment on abaca fibers and found that conventional chemical treatment significantly increased emissions. Specifically, the carbon footprint of alkaline treatment was 1.48 kg CO2-eq per kilogram of fiber, which was three times higher than that of untreated natural fibers, at 0.47 kg CO2-eq/kg.
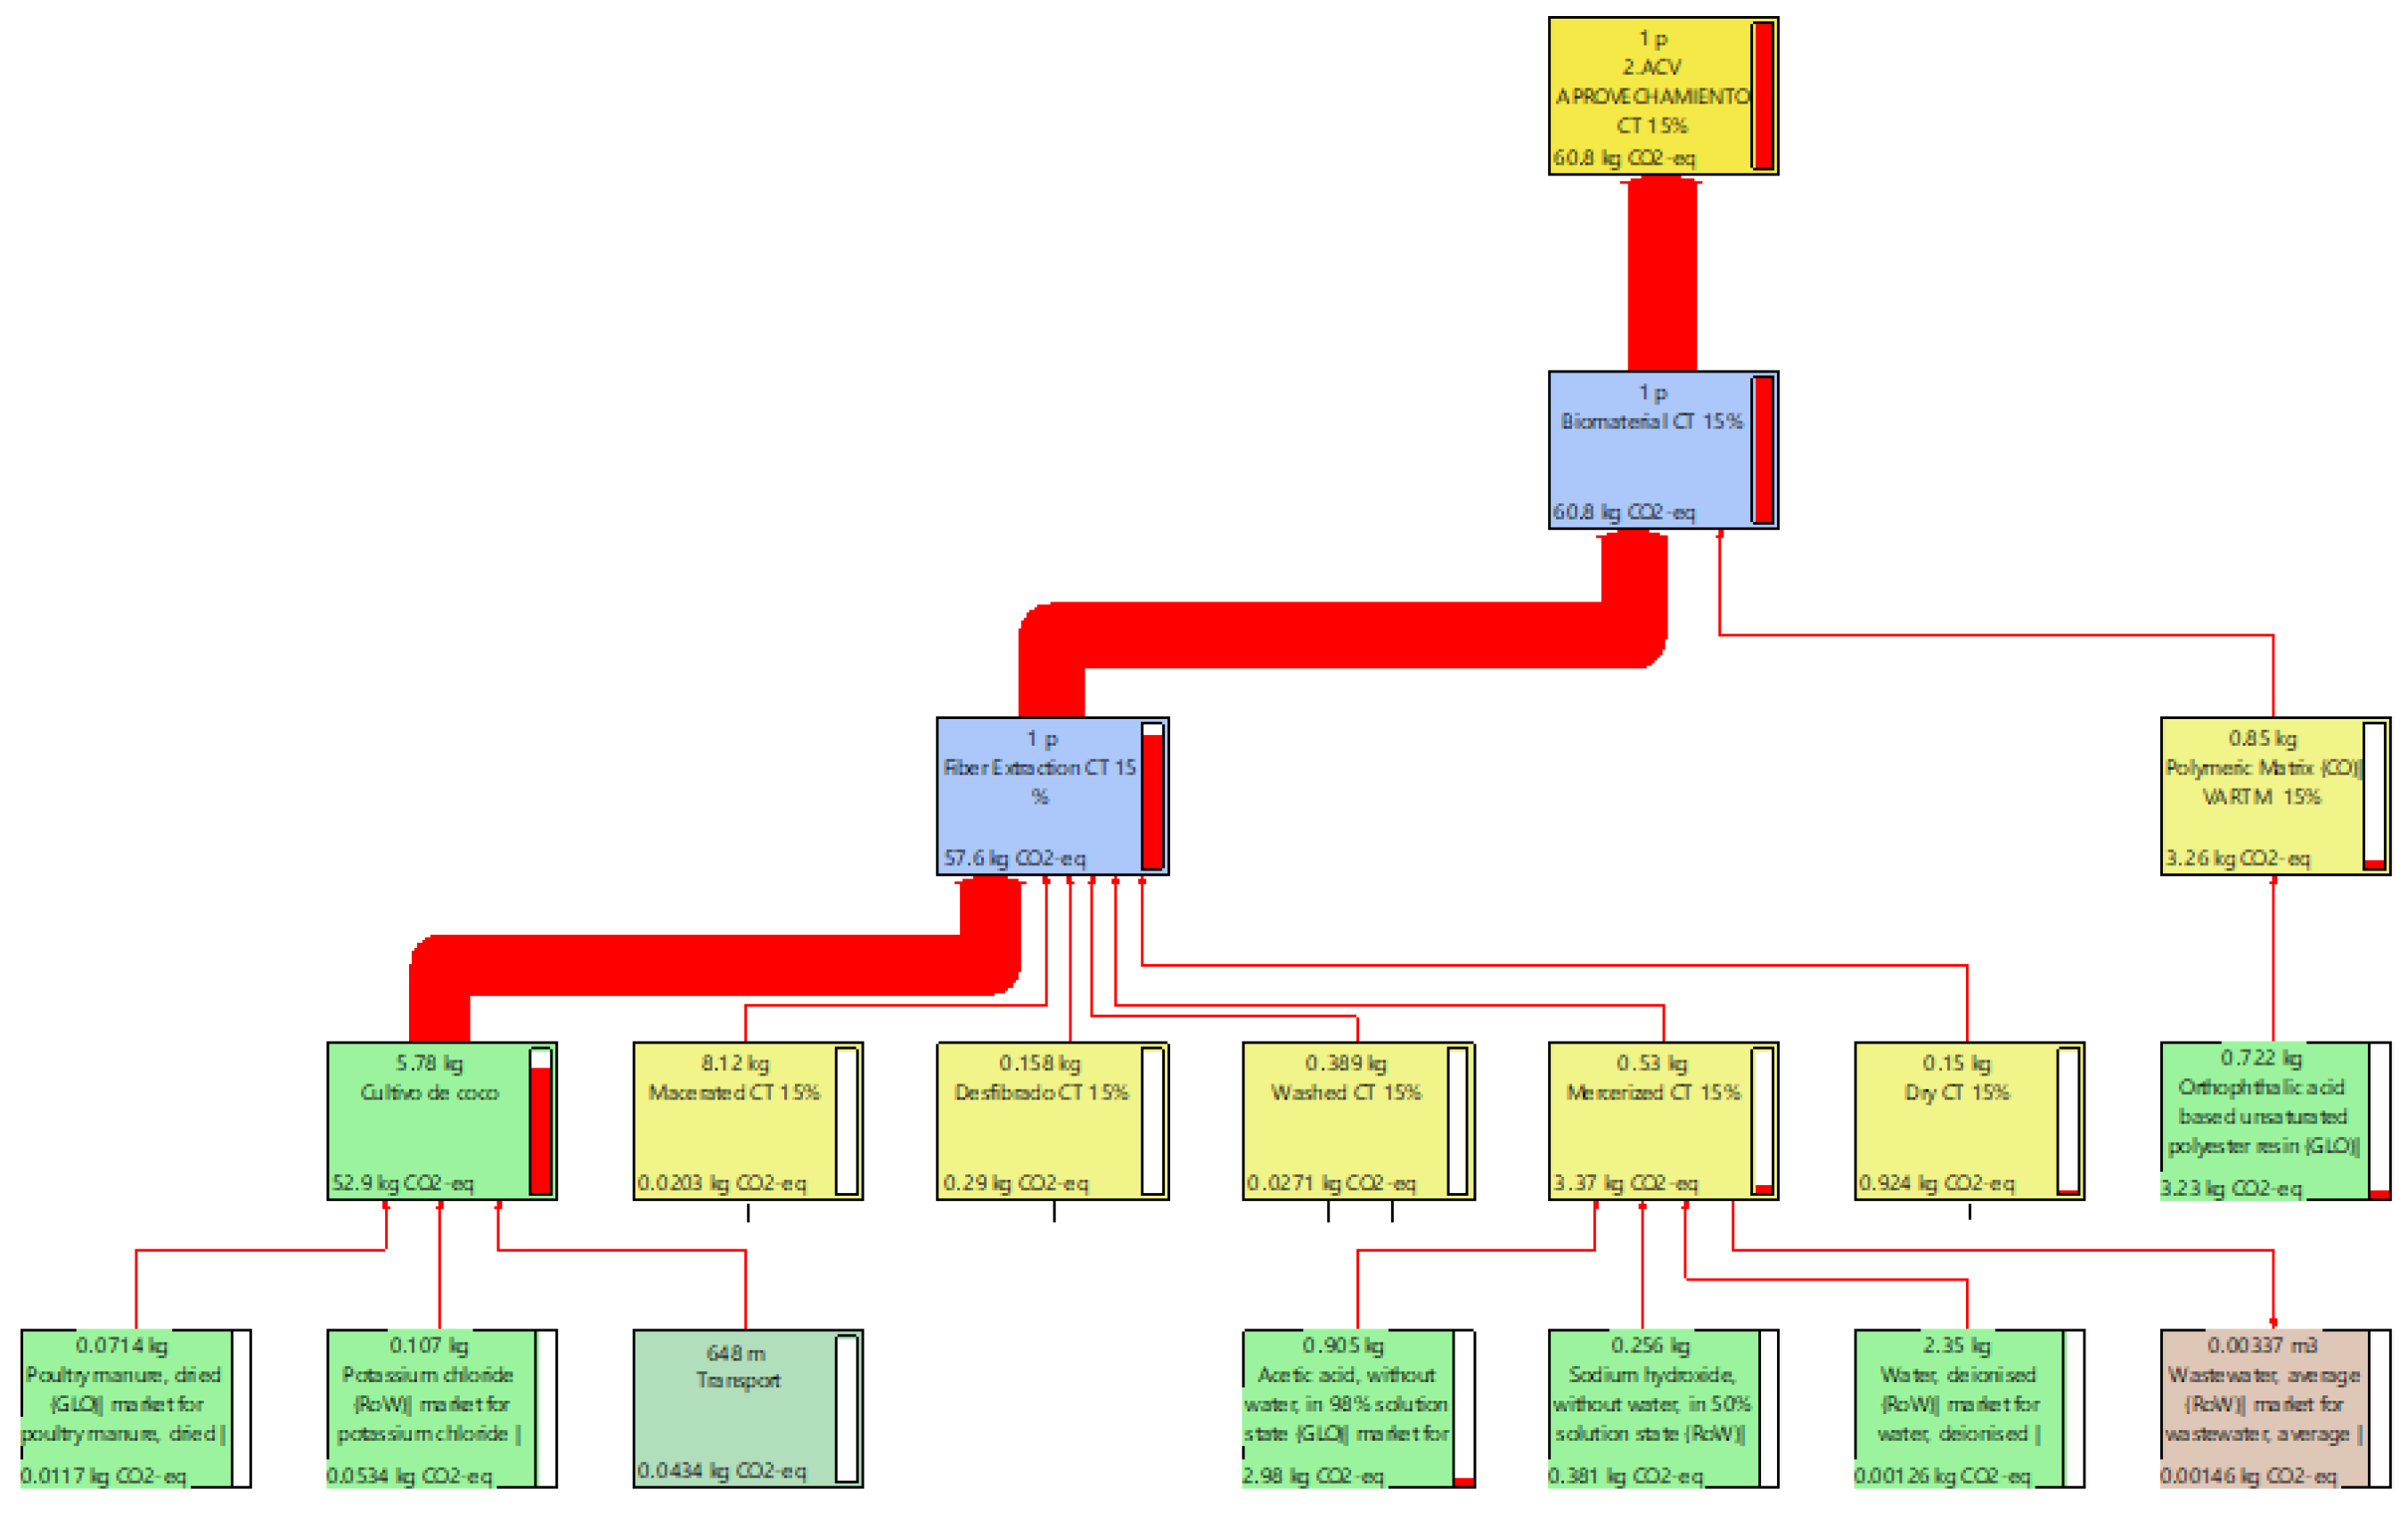
Furthermore, ref. [3] estimated and compared the carbon footprint of coconut fiber-reinforced biocomposites and polymer matrices made from recycled polypropylene and pure polypropylene, using manual calculations based on emission factors. The results showed that the emissions associated with the production of the polymer matrix were around 2.66 kg CO2 eq/kg of material, while the emissions generated by extrusion and grinding for the biocomposite were 4.54 kg CO2 eq/kg of biomaterial. In other words, in this LCA, the scenarios without reuse (conventional polymer matrix) generated fewer emissions compared to biomaterials. This can be explained by the fact that this study did not consider the cultivation phase, which includes emissions caused by the disposal of agricultural waste, an important problem that biomaterial production and the strengthening of the circular economy seek to address. For this reason, in our research, the environmentally optimal results were found in the utilization scenarios, as can be seen in the schematics of scenario CPP/H, which reflects conventional practices, compared to scenario CF-CCT/H, where there is no post-harvest waste treatment (See Figure 6 and Figure 7).
Using the ReCiPe 2016 methodology, the results revealed that the categories with the greatest impact were Stratospheric Ozone Depletion (ODP), Terrestrial Ecotoxicity (TETP), Marine Ecotoxicity (METP), Human Carcinogenic Toxicity (HTPc), Fossil Fuel Depletion (FFP), and Fresh Water Eutrophication (FEP). Among these, Stratospheric Ozone Depletion was the most significant. This is illustrated in Figure 8, where the results were very similar across all scenarios, consistent with the findings shown in Figure 5 from the previous methodology. This pattern can be attributed to the fact that in this category, the impact is mainly driven by nitrogen oxide (N2O), which contributes 99.9% of the total impact in ODP. These emissions originate primarily from the cultivation phase, as illustrated in Figure 9A, which relates each impact category to its source process, and in Figure 9B, which links the substances responsible for the impact. Both figures show a high degree of similarity.
Various studies affirm that the relationship between N2O emissions and ozone depletion, as described in the ODP category, is significant. This is because N2O, in addition to being a potent greenhouse gas, also contributes to the depletion of the ozone layer, which is essential for life on Earth. In fact, N2O is considered one of the most important gases responsible for stratospheric ozone depletion globally. Agriculture is one of the main anthropogenic sources of N2O emissions, contributing approximately 6.2% to total emissions driving global warming [65,66,67,68,69]. Similarly, ref. [67] observed a positive correlation (rs = 0.807) between N2O levels and ozone, confirming that an increase in N2O concentrations leads to the depletion of this protective layer.
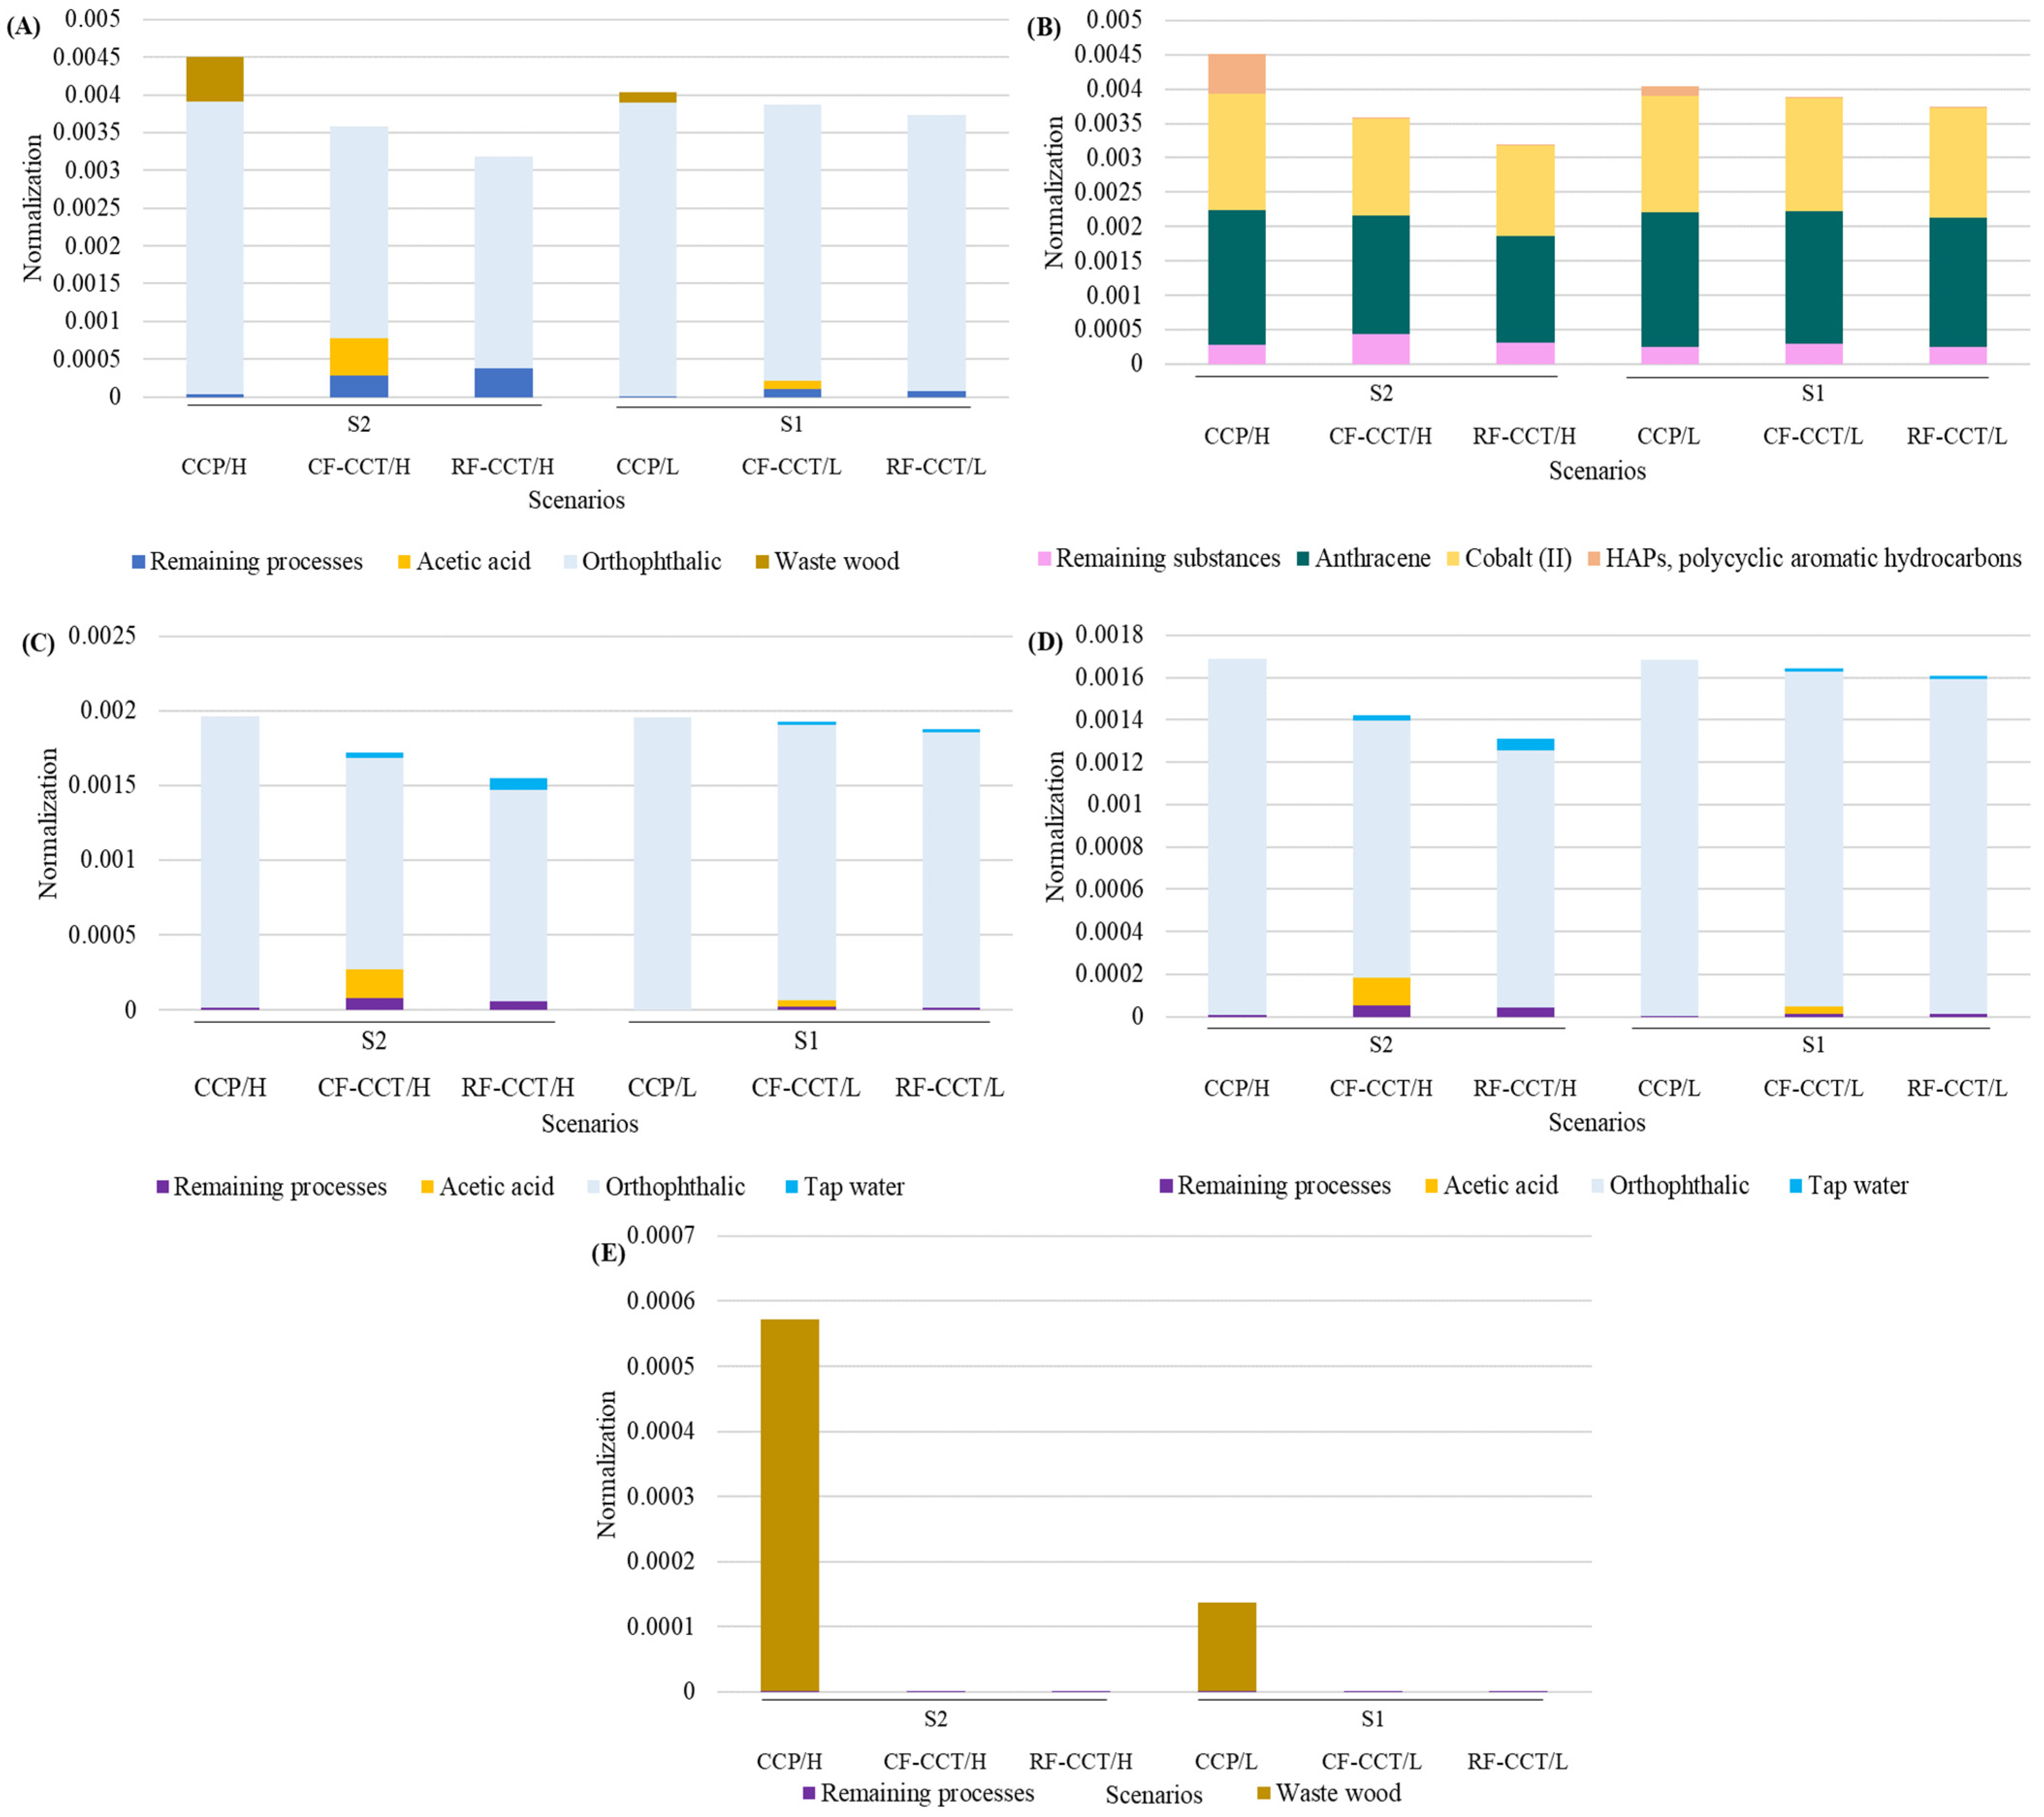
In the case of the Terrestrial Ecotoxicity category (TETP), the scenarios without fiber utilization (CCP/H and CCP/L) showed the highest impact, followed by the scenarios with fiber utilization, first with treatment, then without, for both groups analyzed, S1 and S2. The analysis for this category indicated that the use of Orthophthalic Basic was the main contributor to the impact (Figure 9C). This higher impact in the non-utilization scenarios can be explained by the fact that more polymer matrix is produced in these cases, around 1 kg, whereas in the utilization scenarios, the amount of polymer matrix is reduced. Consequently, the impact values in this category decreased by 27% for S1 and 5.91% for S2, clearly demonstrating that fiber utilization scenarios have a positive effect in reducing environmental impact in this category.
Likewise, the substance that causes the increase in this category is Cobalt (II) (Figure 9D), which, in more than 80% of all scenarios, comes from background processes resulting from the manufacture of the polymer matrix, as it is part of the product’s life cycle according to the inventory provided by Ecoinvent. Similarly, it can be observed that in the RF-CCT/H scenario, the impact is significantly lower due to the elimination of chemical treatment, specifically the omission of acetic acid, which accounts for 9% of the impact in this scenario. A similar pattern is observed in the CF–CCT/L untreated scenario for group S1, where the absence of chemical treatment also contributes to a notable reduction in environmental impacts. Cobalt II emissions (Figure 9E) pose significant risks of terrestrial toxicity, affecting microorganisms, invertebrates, and mammals [70,71]. When deposited in the soil, cobalt (II) exhibits toxic properties that can disrupt the microorganisms present, affecting enzymatic activity and overall soil health, which in turn negatively impacts plant growth [72]. Similarly, cobalt nanoparticles have a high capacity for bioaccumulation in vital organs, causing redox imbalance and organ dysfunction in rats [73].
The same trend was observed in the marine ecotoxicity category (METP), where scenarios without exploitation caused the greatest impacts. Similarly, background processes associated with the manufacture of the polymer matrix were primarily responsible for the increase in this category for all scenarios, as can be seen in Figure 10A. However, on this occasion, Cobalt II emissions were not solely responsible. Substances such as anthracene and polycyclic aromatic hydrocarbons (PAHs) also made a significant contribution in this category (Figure 10B). For example, in the case of CCP/H, Cobalt II contributed 43.5%, while anthracene and HAPs contributed 37% and 12%, respectively.
The reason why the impact decreases in the CF-CCT and RF-CCT scenarios for both S1 and S2 is that, as shown in Figure 10E, HAPs originate entirely from the treatment of post-harvest waste. By eliminating this process through reuse, the emission of these substances is prevented. A similar pattern is observed with the reduction in Cobalt (II) and anthracene, which, as previously explained, primarily originate from the production of the polymer matrix (Figure 10C,D). Their decrease is attributed to the reduced production of this matrix as reuse practices are implemented, which in turn leads to lower emissions of both compounds in the CF-CCT and RF-CCT scenarios for S1 and S2. The damage caused by these substances to the marine ecosystem is significant. For instance, in the case of Cobalt (II), it has been shown to be toxic to marine organisms, with sensitivity varying across species. Invertebrates and aquatic plants tend to be more sensitive than fish [74].
Although at low concentrations they may initially promote phytoplankton growth, prolonged exposure can lead to reduced pigment concentration and increased oxidative stress [75]. On the other hand, ref. [76] pointed out that polycyclic aromatic hydrocarbons (HAPs), including anthracene, are frequently detected in coastal waters, highlighting a direct connection between atmospheric and marine pollution. Specifically, anthracene, which is primarily emitted during the production of acetic acid and polymer matrix, can be released into the atmosphere through industrial processes or vehicle emissions and subsequently reach marine ecosystems through atmospheric deposition and precipitation [77,78]. Moreover, its potential for photoinduced toxicity suggests that current assessments may be underestimating the risks associated with this substance and other similar pollutants in marine ecosystems [79,80]. Finally, HAPs can cause both acute and chronic toxicity in aquatic organisms, affecting reproductive and immune functions [81].
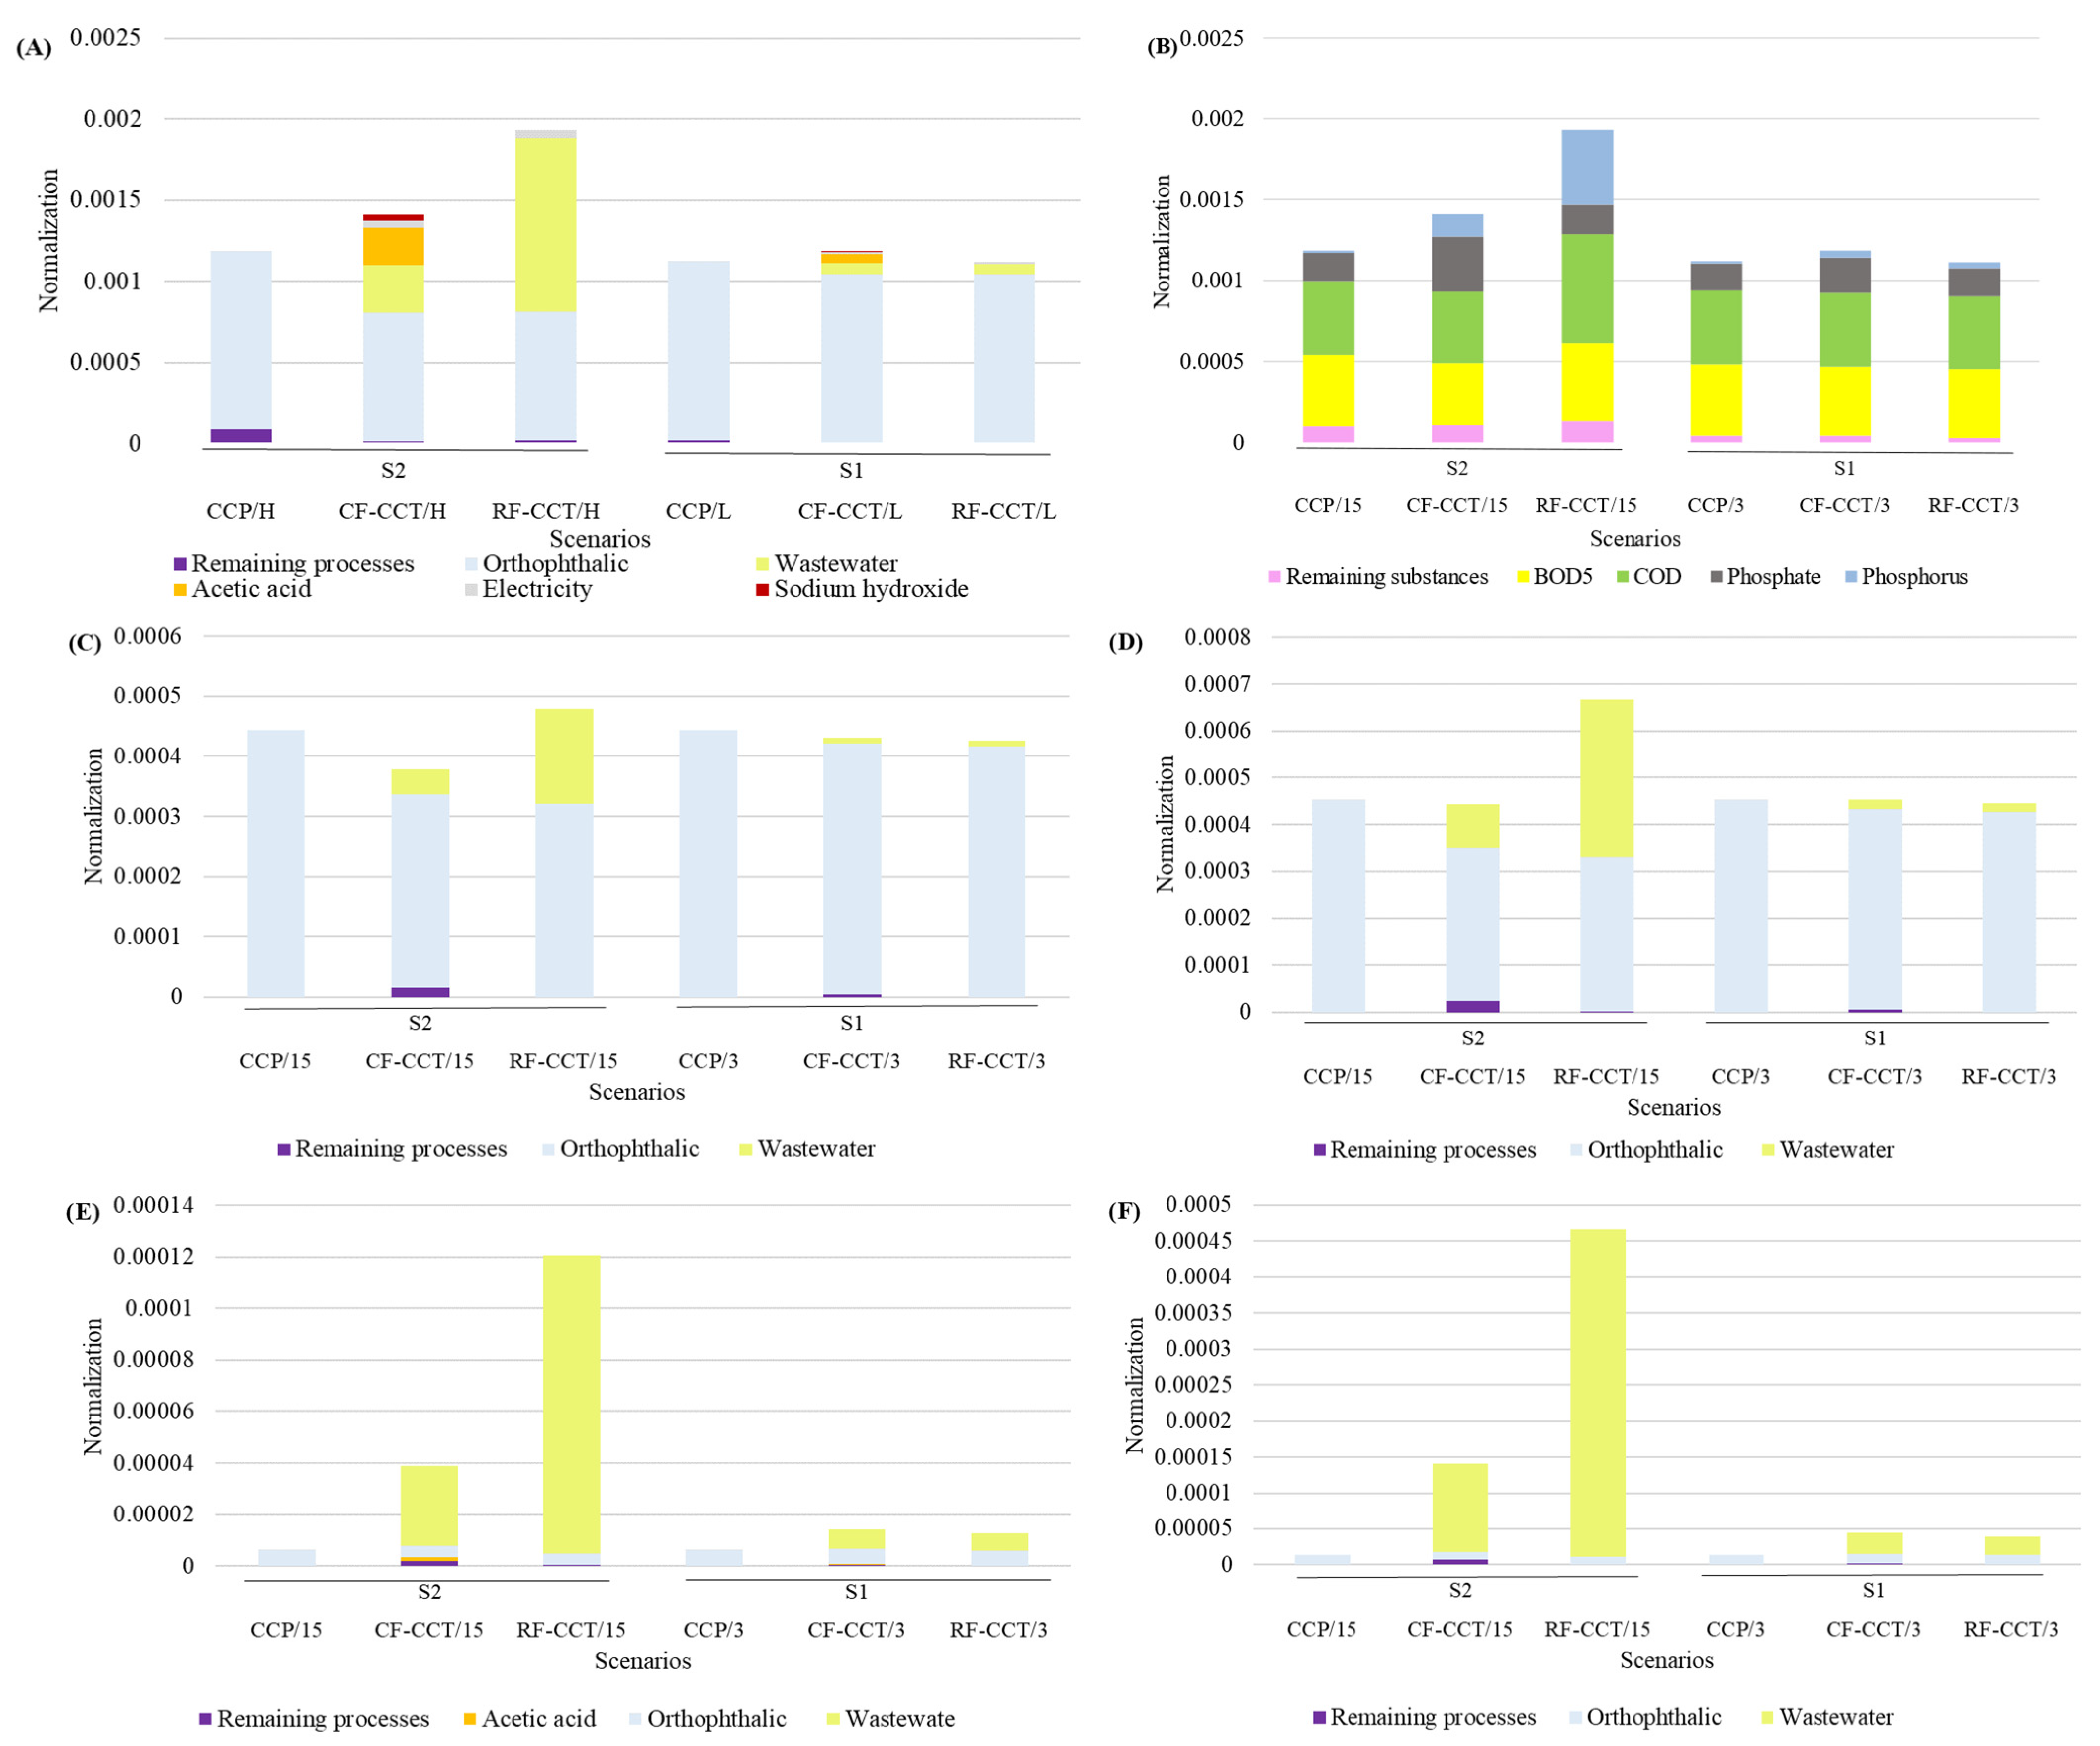
For the Freshwater Eutrophication Potential (FEP) category, the RF-CCT/H scenario showed the highest impact (Figure 11A). The primary contributors were the manufacture of the polymer matrix (41%) and the effluent generated during the maceration process (55%). As expected, the results for emissions by substance (Figure 11B) showed BOD5, COD, phosphate, and phosphorous as the main contributors to the increase in this category. These emissions were predominantly linked to the aforementioned processes (Figure 11C–F). Despite the limited characterization of the effluent, the data proved critical in identifying a significant eutrophication risk, as its discharge into the environment could promote algal proliferation [82,83], oxygen depletion [84] and toxin production [82], thus explaining the trends observed in this impact category.
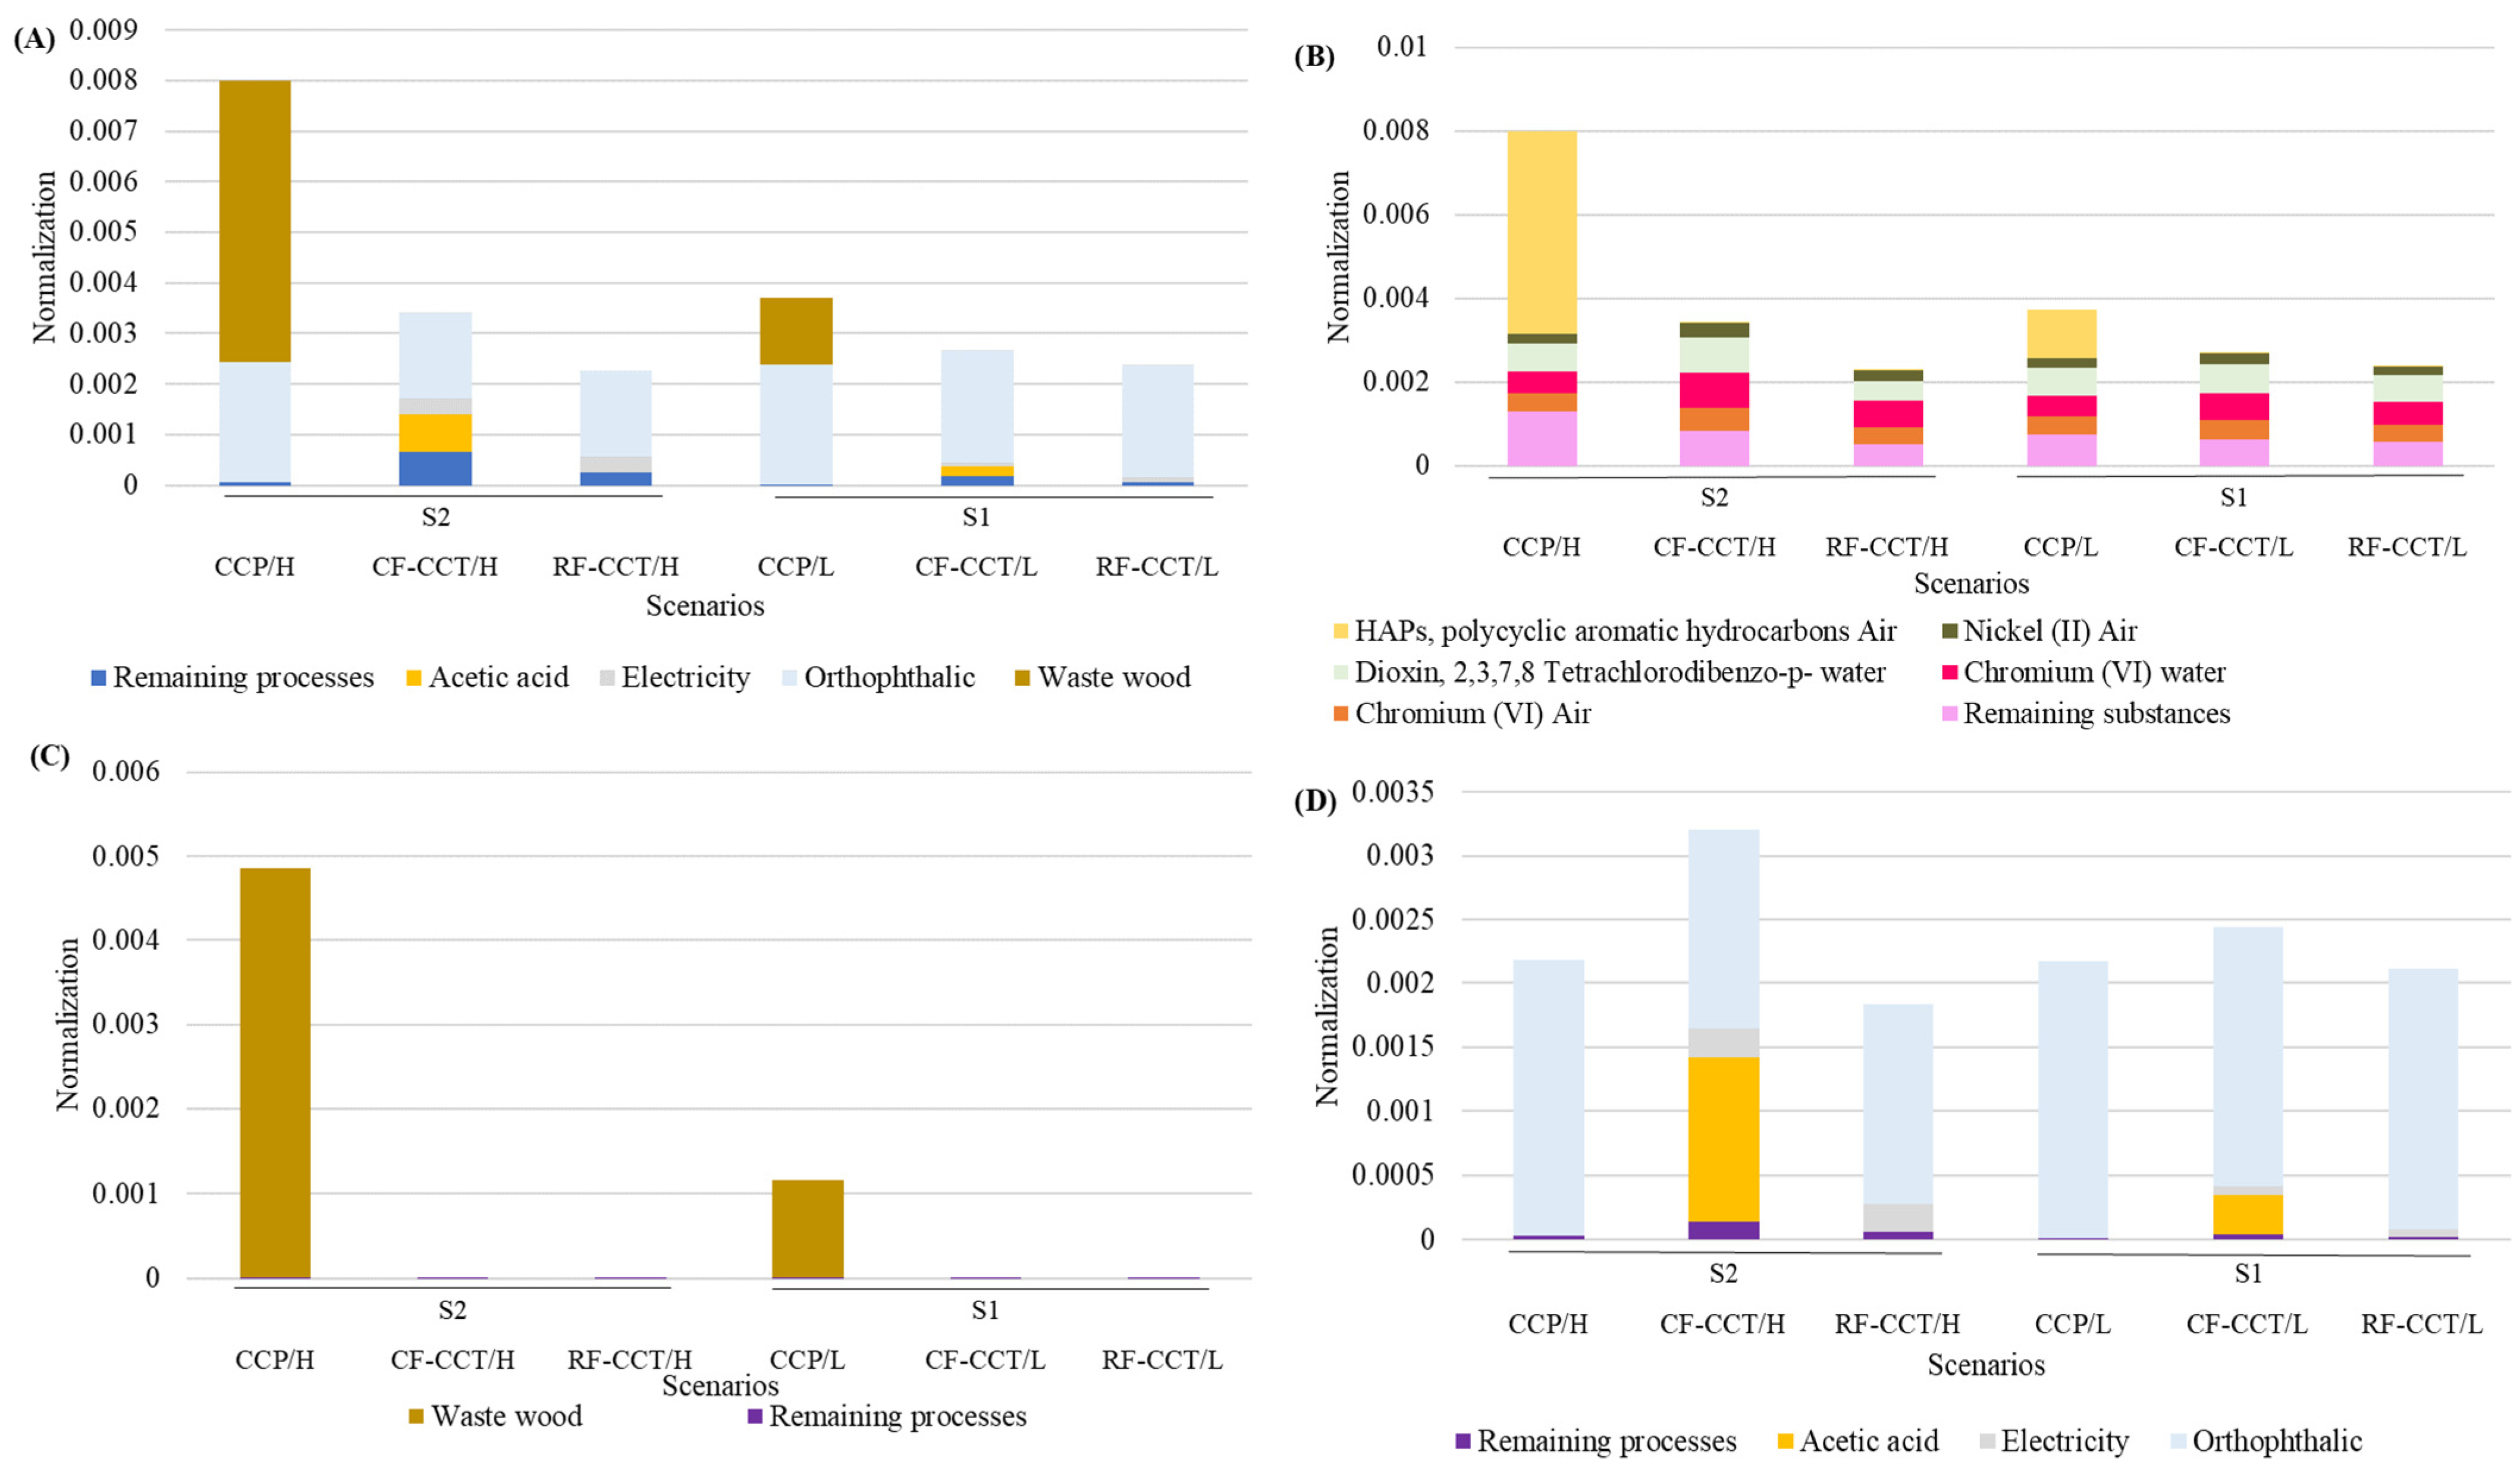
For the Human Carcinogenic Toxicity category, the CPP/H and CPP/L scenarios showed the highest impacts. This increase is primarily due to the post-harvest waste treatment process and, secondly, to the use of the polymer matrix, as shown in Figure 12A. The trend previously described is maintained here: as waste is recovered and the amount of polymer matrix is reduced, the impacts in this category decrease. Open burning accounts for 80% of the treatment of these residues and is responsible for 70% of the impact in the Human Carcinogenic Toxicity (HTPc) category for the CPP/H scenario and 35.7% for the CPP/L scenario. As shown in Figure 12B, this process emits toxic air pollutants such as polycyclic aromatic hydrocarbons (HAPs) and volatile organic compounds (VOCs), many of which are carcinogenic [85]. In this context, the treatment of wood waste from conventional practices is the sole contributor to this impact (Figure 12C). Furthermore, untreated wood may contain substances such as lignin and other organic compounds which, when burned, release additional toxic pollutants [86].
Finally, the Fossil Resource Scarcity (FFP) indicator was the only one that did not follow the aforementioned trend. The CF-CCT/H and CF-CCT/L scenarios exhibited higher values compared to the untreated scenarios. This outcome is attributed to the use of liquefied petroleum gas (LPG) and coal as energy inputs in processes involving chemical treatment, particularly in acetic acid production. According to data from the Ecoinvent database, LPG accounts for 83.3% of the impact in this category. Being a non-renewable resource, LPG significantly contributes to fossil fuel scarcity, as its extraction and use accelerate the depletion of limited reserves [87]. It is worth noting that Ecoinvent provides reliable, consistent, and transparent data to support sustainable decision-making [88,89].
On the other hand, the use of the polymer matrix, as shown in Figure 12D, was the main contributor in all scenarios, since its production relies on hydrocarbon reserves, which are non-renewable resources. Consequently, substituting it with polymers from renewable sources or reinforcing materials could reduce dependence on fossil resources, helping to address environmental concerns such as oil scarcity and excessive waste generation [90,91]. These results underscore the importance of adopting sustainable practices that encourage the use of agricultural waste, such as coconut fiber, helping to mitigate climate change while fostering a more circular economy.
Although previous Life Cycle Assessment (LCA) studies have focused on chemically treated variants [64,92], the methodological approach for evaluating untreated fibers remains largely unexplored. A key methodological difference in this study was the exclusion of the unitary chemical treatment process, which consequently avoids the environmental burdens associated with the use of these compounds, seeking to evaluate a scenario where utilization is carried out while maintaining mechanical properties and optimizing resources. Our results confirm that this approach is beneficial. Finally, this study has limitations that should be considered. Firstly, the results must be interpreted considering the laboratory scale of this research. Although the manufacturing methodology is standardized, the potential applications of the biocomposite remain undefined and require further study. These applications would need adaptation to regional contexts and possible large-scale production, which may entail modifications in inputs or processes. Such changes could lead to significantly different environmental performance, even if the technical manufacturing parameters remain similar. Additionally, we recommend that future studies incorporate climate change scenarios, as these could alter cultivation conditions and material/energy flows during the agricultural stage.

4. Conclusions

The objective of this study focused on evaluating the life cycle between scenarios with and without the use of the process of extracting natural fibers from coconut mesocarp for the production of biomaterials in order to determine whether this use is more environmentally viable than conventional practices, in which agricultural waste is burned in open pits. The results showed that in all scenarios where use was implemented, the carbon footprint was reduced, with the scenarios involving the use of agricultural waste without chemical treatment (RF-CCT) proving to be the most environmentally optimal, reducing CO2 emissions by up to 7.4% (RF-CCT/H) and 1.70 kg CO2-eq (RF-CCT/L) compared to current practices, thanks to the elimination of open burning, the reduction in conventional polymer matrix, and the omission of chemicals such as acetic acid and sodium hydroxide. These scenarios minimized critical impacts such as ozone depletion (ODP), linked to N2O from fertilizers (93% contribution), and terrestrial/marine toxicity, associated with Cobalt II, HAPs, and anthracene from industrial processes. It is recommended to prioritize the production of biomaterials over the production of conventional polymer matrices and continue testing to improve their mechanical properties in order to increase fiber replacement. It is also suggested to replace products that may have a significant environmental impact associated with their production, for example, by choosing products that use clean energy in their manufacturing processes. Train farming communities to optimize the use of nitrogen fertilizers and encourage the reuse of natural fibers without chemical treatments. These strategies promote a low-carbon circular economy and reduce dependence on fossil resources and their associated impacts on ecosystems.

Author Contributions

V.C.S.-B.: supervision, conceptualization, methodology, writing, review, and editing. F.B.-G.: research, literature review, result analysis, discussion of results, drafting of the original manuscript, and processing. K.E.V.-M.: literature review, research, final translation, review and editing. D.F.F.-H.: literature review, data processing and analysis. F.M.T.-B.: thorough critical review of the research, evaluation of the methodology, results, and conclusions. All authors have read and agreed to the published version of the manuscript.

Funding

This research was funded by the Fondo Nacional de Regalias of Colombia through the project “Strengthening the Circular Economy by Generating Added Value from Agricultural Waste in the Departments of Córdoba and Sucre,” with BPIN code: 2021000100052—SGR. And Research and Extension Department of University of Córdoba, Colombia.

Data Availability Statement

The original contributions presented in the study are included in the article, and further inquiries can be directed to the corresponding authors.

Acknowledgments

We give special thanks to José Tafur for allowing the use of the facilities at “La Bendición” farm and for sharing his knowledge related to plantain cultivation.

Conflicts of Interest

The authors declare no conflicts of interest.

References

  1. Pardo Bermúdez, A.F. Implementación de un Prototipo de Vermicultura Para la Gestión Sostenible de Residuos Orgánicos en el Casco Antiguo de Floridablanca. Available online: http://hdl.handle.net/11634/53292 (accessed on 5 November 2024).
  2. Zalazar-Garcia, D.; Fernandez, A.; Rodriguez-Ortiz, L.; Torres, E.; Reyes-Urrutia, A.; Echegaray, M.; Rodriguez, R.; Mazza, G. Exergo-ecological analysis and life cycle assessment of agro-wastes using a combined simulation approach based on Cape-Open to Cape-Open (COCO) and SimaPro free-software. Renew. Energy 2022, 201, 60–71. [Google Scholar] [CrossRef]
  3. Ángel Hidalgo-Salazar, M.; Pablo Correa-Aguirre, J.; Manuel Montalvo-Navarrete, J.; Fernando Lopez-Rodriguez, D.; Felipe Rojas-González, A. Recycled Polypropylene-Coffee Husk and Coir Coconut Biocomposites: Morphological, Mechanical, Thermal and Environmental Studies. In Thermosoftening Plastics; IntechOpen: Cambridge, MA, USA, 2020. [Google Scholar] [CrossRef]
  4. Coronado Gutierrez, R.; Valencia Lópe, R.A. Gestión Integral de Residuos Agrícolas para la Generación de Materias Primas en el Municipio de Cota Cundinamarca. Available online: http://hdl.handle.net/11349/3001 (accessed on 5 November 2024).
  5. MinAgricultura. El agro se Consolida como el Segundo Motor de la Economía Nacional, Según un Nuevo Reporte del Índice de Seguimiento a la Economía 2024. Available online: https://www.minagricultura.gov.co/noticias/Paginas/El-agro-se-consolida-como-el-segundo-motor-de-la-econom%C3%ADa-nacional,-seg%C3%BAn-un-nuevo-reporte-del-%C3%8Dndice-de-Seguimiento-a-la-E.aspx (accessed on 3 July 2025).
  6. MinAgricultura. El Sector Agricultura, Protagonista en 2024 de la Reactivación Económica del país 2025. Available online: https://www.minagricultura.gov.co/noticias/Paginas/El-sector-Agricultura,-protagonista-en-2024-de-la-reactivaci%C3%B3n-econ%C3%B3mica-del-pa%C3%ADs.aspx (accessed on 3 July 2025).
  7. Tróchez, D.X.S.; Ordoñez, L.B.P.; Paja, M.D.M.R. Estrategias para lograr entornos colaborativos e innovadores encaminados hacia el fomento de mercados agroindustriales. Acad. Derecho 2023, 15, 1–34. [Google Scholar] [CrossRef]
  8. Inés, J.; Pinzón, C.; Eudoro, L.; Zamudio, V. Agricultura y desarrollo rural en Colombia 2011–2013: Una aproximación. Apunt. Del CENES 2016, 35, 87–123. [Google Scholar]
  9. Oliveira, M.; Cocozza, A.; Zucaro, A.; Santagata, R.; Ulgiati, S. Circular economy in the agro-industry: Integrated environmental assessment of dairy products. Renew. Sustain. Energy Rev. 2021, 148, 111314. [Google Scholar] [CrossRef]
  10. Sarıyer, T.; Kaya, Ç. Agricultural wastes in climate change mitigation. J. Glob. Clim. Change 2022, 1, 15–20. [Google Scholar] [CrossRef]
  11. Zalazar-García, D.; Feresin, G.E.; Rodriguez, R. Optimal operational variables of phenolic compound extractions from pistachio industry waste (Pistacia vera var. Kerman) using the response surface method. Biomass Convers. Biorefinery 2022, 12, 3761–3770. [Google Scholar] [CrossRef]
  12. Agapkin, A.M.; Makhotina, I.A.; Ibragimova, N.A.; Goryunova, O.B.; Izembayeva, A.K.; Kalachev, S.L. The problem of agricultural waste and ways to solve it. IOP Conf. Ser. Earth Environ. Sci. 2022, 981, 022009. [Google Scholar] [CrossRef]
  13. Santiago De la Rosa, N. Factores de Emisión de Contaminantes Atmosféricos y Climáticos, y Evaluación del Potencial Oxidativo y Cancerígeno de las Partículas Finas por la Quema de Residuos Agrícolas. Available online: https://hdl.handle.net/11191/5742 (accessed on 5 November 2024).
  14. Karimah, A.; Ridho, M.R.; Munawar, S.S.; Adi, D.S.; Damayanti, R.; Subiyanto, B.; Fatriasari, W.; Fudholi, A. A review on natural fibers for development of eco-friendly bio-composite: Characteristics, and utilizations. J. Mater. Res. Technol. 2021, 13, 2442–2458. [Google Scholar] [CrossRef]
  15. Kurien, R.A.; Maria Anil, M.; Sharan Mohan, S.L.; Anna Thomas, J. Natural Fiber Composites As Sustainable Resources for Emerging Applications—A Review. Available online: https://linkinghub.elsevier.com/retrieve/pii/S2214785323022642 (accessed on 3 May 2023).
  16. Birniwa, A.H.; Abdullahi, S.S.A.; Ali, M.; Mohammad, R.E.A.; Jagaba, A.H.; Amran, M.; Avudaiappan, S.; Maureira-Carsalade, N.; Flores, E.I.S. Recent Trends in Treatment and Fabrication of Plant-Based Fiber-Reinforced Epoxy Composite: A Review. J. Compos. Sci. 2023, 7, 120. [Google Scholar] [CrossRef]
  17. Elfaleh, I.; Abbassi, F.; Habibi, M.; Ahmad, F.; Guedri, M.; Nasri, M.; Garnier, C. A comprehensive review of natural fibers and their composites: An eco-friendly alternative to conventional materials. Results Eng. 2023, 19, 101271. [Google Scholar] [CrossRef]
  18. Napitupulu, R.; S, S.T.; M.T.; Dharta, Y.; Putri, D.A.; Parlindungan, D.; Pratama, A.; Angelina, C.L. Perancangan Mesin Pencacah Limbah Kelapa Muda Secara Vertikal Menggunakan Metode Sintesis Pandangan. J. Teknol. 2023, 23, 28. [Google Scholar] [CrossRef]
  19. Pico González, D.R. Validación de una Máquina para Fabricación de Materiales Compuestos Mediante la Técnica de Moldeo por Transferencia de Resina con Vacío Asistido. Available online: https://repositorio.unicordoba.edu.co/handle/ucordoba/7258 (accessed on 15 April 2024).
  20. Wahab, M.; Rushdan Zaim, I.N.; Ismail, H.F.; Othman, N.; Hara, H.; Md Akhir, F.N. Evaluation of flavonoid compound in coconut waste and its antioxidant activity. IOP Conf. Ser. Earth Environ. Sci. 2023, 1144, 012006. [Google Scholar] [CrossRef]
  21. Malviya, R.K.; Singh, R.K.; Purohit, R.; Sinha, R. Natural fibre reinforced composite materials: Environmentally better life cycle assessment—A case study. Mater. Today Proc. 2020, 26, 3157–3160. [Google Scholar] [CrossRef]
  22. Shalwan, A.; Yousif, B.F. In State of Art: Mechanical and tribological behaviour of polymeric composites based on natural fibres. Mater. Des. 2013, 48, 14–24. [Google Scholar] [CrossRef]
  23. Mansor, M.R.; Salit, M.S.; Zainudin, E.S.; Aziz, N.A.; Ariff, H. Life Cycle Assessment of Natural Fiber Polymer Composites. Agricultural Biomass Based Potential Materials; Springer International Publishing: Cham, Switzerland, 2015; pp. 121–141. [Google Scholar] [CrossRef]
  24. Reinders, M.J.; Onwezen, M.C.; Meeusen, M.J.G. Can bio-based attributes upgrade a brand? How partial and full use of bio-based materials affects the purchase intention of brands. J. Clean. Prod. 2017, 162, 1169–1179. [Google Scholar] [CrossRef]
  25. Asthana, N.; Pal, K.; Khan, A.A.; Malik, A. Novel biopolymeric materials potential utilization for environmental practices. J. Mol. Struct. 2024, 1311, 138390. [Google Scholar] [CrossRef]
  26. Ramachandran, K.; Gnanasagaran, C.L.; Vekariya, A. Life cycle assessment of carbon fiber and bio-fiber composites prepared via vacuum bagging technique. J. Manuf. Process. 2023, 89, 124–131. [Google Scholar] [CrossRef]
  27. Choe, C.; Moon, J.A.; Gu, J.; Lee, A.; Lim, H. Life cycle sustainability assessment for sustainable energy future: A short review on opportunity and challenge. Curr. Opin. Green Sustain. Chem. 2024, 50, 100974. [Google Scholar] [CrossRef]
  28. Katebi, A.; Soleymani Tushmanlo, H.; Asadollahfardi, G. Environmental life cycle assessment and economic comparison of different roof systems. J. Build. Eng. 2023, 76, 107316. [Google Scholar] [CrossRef]
  29. ISO 14044, Environmental Management—Life Cycle Assessment—Requirements and Guidelines. Available online: https://www.iso.org/standard/38498.html (accessed on 15 April 2024).
  30. Franco Rodríguez, J.M. Vista de Análisis de Ciclo de Vida para la Producción de Biodiesel Derivado de Palma de Aceite Caso Colombiano 2019. Available online: https://hemeroteca.unad.edu.co/index.php/publicaciones-e-investigacion/article/view/3262/3401 (accessed on 26 May 2024).
  31. Pérez, L.A.F.; Lorza, R.L.; Bobadilla, M.C. Uso del programa simapro para evaluar coagulantes naturales en el tratamiento de aguas. Biotecnia 2019, 21, 108–113. [Google Scholar] [CrossRef]
  32. Gradin, K.T.; Björklund, A. The common understanding of simplification approaches in published LCA studies—A review and mapping. Int. J. Life Cycle Assess. 2021, 26, 50–63. [Google Scholar] [CrossRef]
  33. SimaPro. SimaPro Database Manual Methods Library; 2022. Available online: https://simapro.com/wp-content/uploads/2021/12/DatabaseManualMethods930.pdf (accessed on 24 July 2024).
  34. Intergovernmental Panel on Climate Change (IPCC). The Earth’s Energy Budget, Climate Feedbacks and Climate Sensitivity. In Climate Change 2021—The Physical Science Basis; Cambridge University Press: Cambridge, MA, USA, 2023; pp. 923–1054. [Google Scholar] [CrossRef]
  35. Smith, C.; Gasser, T.; Nicholls, Z.; Armour, K.; Collins, W.; Forster, P.; Meinshausen, M.; Watanabe, M.; Pirani, A.; Connors, S.; et al. The Earth’s Energy Budget, Climate Feedbacks and Climate Sensitivity Supplementary. Available online: https://www.ipcc.ch/report/ar6/wg1/downloads/report/IPCC_AR6_WGI_Chapter07_SM.pdf (accessed on 24 July 2024).
  36. ASOCOLCO Asociación de Cocoteros del Municipio de Puerto Escondido 2025. Available online: https://asocolco.com/ (accessed on 6 September 2025).
  37. Weidema, B.P.; Bauer, C.; Hischier, R.; Mutel, C.; Nemecek, T.; Reinhard, J.; Vadenbo, C.O.; Wernet, G. Overview and Methodology: Data Quality Guideline for the Ecoinvent Database version 3. Swiss Centre for Life Cycle Inventories. Available online: https://vbn.aau.dk/ws/portalfiles/portal/176769045/Overview_and_methodology.pdf (accessed on 6 November 2024).
  38. Castillo, T.; García, F.; Mosquera, L.; Rivadereira, T.; Segura Khaterine, Y.M. PANORAMA ENERGÉTICO DE AMÉRICA LATINA Y EL CARIBE. Available online: https://biblioteca.olade.org/opac-tmpl/Documentos/old0442a.pdf (accessed on 6 November 2024).
  39. Coelho Sampaio, A.P. Pegada De Carbono E Hidríca Do Cultivo De Coco Em Sistemas De Produção Convencional No Nordeste Brasileiro Fortaleza. Master’s Thesis, Universidade Federal do Ceará, Fortaleza, Brazil, 2019. [Google Scholar]
  40. Puspaningrum, T.; Indrasti, N.S.; Indrawanto, C.; Yani, M. Life cycle assessment of coconut plantation, copra, and charcoal production. Glob. J. Environ. Sci. Manag. 2023, 9, 653–672. [Google Scholar] [CrossRef]
  41. Emmenegger, M.; Reinhard, J.; Zah, R. Sustainability Quick Check for Biofuels-Intermediate Background Report. In T. Ziep RWProfDrVWB and ARRFKDrGGAR-Tänikon. Available online: https://www.researchgate.net/publication/230725635_SQCB_-_Sustainability_Quick_Check_for_Biofuels_Second_draft_18th_February_2009_-_Intermediate_Background_Report_With_contributions_from_T_Ziep_R_Weichbrodt_Prof_Dr_V_Wohlgemuth_FHTW_Berlin_and_A_Roche (accessed on 28 September 2024).
  42. Nemecek, T.; Schnetzer, J. Methods of Assessment of Direct Field Emissions for LCIs of Agricultural Production Systems. 2011. Available online: https://www.researchgate.net/profile/Freddy_Navarro-Pineda/post/How_to_easily_predict_the_leaching_of_heavy_metals_from_soils/attachment/59d61f9d79197b807797e0dc/AS:285638185242630@1445112858480/download/ART+2012+-+Methods+of+assessment+of+direct+field+emissions+for+agricultural+systems.pdf (accessed on 28 September 2024).
  43. IPCC. Climate Change 2007: The Physical Science Basis. Contribution of Working Group I to the Fourth Assessment Report of the Intergovernmental Panel on Climate Change; Cambridge University Press: Cambridge, MA, USA, 2007. [Google Scholar]
  44. Nemecek, T.; Kagil, T. Life Cycle Inventories of Agricultural Production Systems. Final. Rep. Ecoinvent 2007, 15, 1–360. [Google Scholar]
  45. IDEAM. Anexo 7 Aguas Subterraneas. Estudio Nacional del Agua. 2022. Available online: https://www.ideam.gov.co/sites/default/files/prensa/boletines/2024-08-23/anexo_7_aguas_subterraneas_0.pdf (accessed on 17 December 2024).
  46. Arias, T. Coconut Morphology Dataset. Available online: https://figshare.com/articles/dataset/Coconut_morphology_dataser/12783470 (accessed on 17 December 2024).
  47. Rincón Reyna, J.F.; Rincón Reyna, P.G.; Torres Maravila, E.; Mondragón Rojas, A.G.; SanchezPardo, M.E.; Arana Cuenca, A.; Ortiz Moreno, A.; Jiménez Garcia, E. CARACTERIZACIÓN FISICOQUIMICA Y FUNCIONAL DE LA FIBRA DE MESOCARPIO DE COCO (Cocos nucifera L.). Available online: http://www.fcb.uanl.mx/IDCyTA/files/volume1/2/3/49.pdf (accessed on 17 December 2024).
  48. Desole, M.P.; Gisario, A.; Barletta, M. Comparative life cycle assessment and multi-criteria decision analysis of coffee capsules made with conventional and innovative materials. Sustain. Prod. Consum. 2024, 48, 99–122. [Google Scholar] [CrossRef]
  49. Márquez Roca, L.R. Potenciales Impactos Ambientales Negativos Generados en el Análisis del Ciclo de Vida del Biocombustible 2,5 Dimetilfurano, Obtenido a Partir de Residuos de Cabuya (Agave americana L.). Available online: https://repositorio.cientifica.edu.pe/handle/20.500.12805/2142 (accessed on 17 December 2024).
  50. Füchsl, S.; Rheude, F.; Röder, H. Life cycle assessment (LCA) of thermal insulation materials: A critical review. Clean. Mater. 2022, 5, 100119. [Google Scholar] [CrossRef]
  51. Evaluation of ILCD Data Network Entry-Level and PEF Data Quality Requirements in LCA Databases 2014. Available online: https://publications.jrc.ec.europa.eu/repository/handle/JRC86490 (accessed on 3 May 2024).
  52. Muller, S.; Lesage, P.; Ciroth, A.; Mutel, C.; Weidema, B.P.; Samson, R. The application of the pedigree approach to the distributions foreseen in ecoinvent v3. Int. J. Life Cycle Assess. 2016, 21, 1327–1337. [Google Scholar] [CrossRef]
  53. Godoy León, M.F.; Dewulf, J. Data quality assessment framework for critical raw materials. The case of cobalt. Resour. Conserv. Recycl. 2020, 157, 104564. [Google Scholar] [CrossRef]
  54. Freire, A.L.F.; de Araújo Júnior, C.P.; de Freitas Rosa, M.; de Almeida Neto, J.A.; de Figueirêdo, M.C.B. Environmental assessment of bioproducts in development stage: The case of fiberboards made from coconut residues. J. Clean. Prod. 2017, 153, 230–241. [Google Scholar] [CrossRef]
  55. Ecoinvent. Market for Waste Wood, Untreated-Colombia-Waste Wood, Untreated|EcoQuery 2023. Available online: https://ecoquery.ecoinvent.org/3.10/cutoff/dataset/17501/documentation (accessed on 27 January 2025).
  56. da Silva, A.R.A.; Bezerra, F.M.L.; de Lacerda, C.F.; de Sousa, C.H.C.; Bezerra, M.A. Physiological responses of dwarf coconut plants under water deficit in salt-affected soils. Rev. Caatinga 2017, 30, 447–457. [Google Scholar] [CrossRef]
  57. Gomes, F.P.; Prado, C.H.B.A. Ecophysiology of coconut palm under water stress. Braz. J. Plant Physiol. 2007, 19, 377–391. [Google Scholar] [CrossRef]
  58. Nainanayake, A.; Morison, J. A Case Study on Physiology-Based Drought Screening of Coconut with Selected Accessions. COCOS 2009, 18. [Google Scholar] [CrossRef]
  59. Vélez, E.; Rodríguez, R.; Yanchapanta Gómez, N.B.; Mora, E.D.; Hernández, L.; Albuja-Sánchez, J.; Calvo, M.I. Coconut-Fiber Composite Concrete: Assessment of Mechanical Performance and Environmental Benefits. Fibers 2022, 10, 96. [Google Scholar] [CrossRef]
  60. Arif, H.; Muhammad, A.M.; Wu, F.; Yin, G.-F.; Shen, S.-Z.; Wang, F.; Li, Y.; Zhang, K.-Q. Application of Optimum N Through Different Fertilizers Alleviate NH4+-N, NO3N and Total Nitrogen Losses in the Surface Runoff and Leached Water and Improve Nitrogen Use Efficiency of Rice Crop in Erhai Lake Basin, China. Commun. Soil. Sci. Plant Anal. 2019, 50, 716–738. [Google Scholar] [CrossRef]
  61. Kiemle, C.; Fruck, C.; Fix, A. Nitrous Oxide, N2O: Spectroscopic Investigations for Future Lidar Applications. EGU23 2023. Available online: https://meetingorganizer.copernicus.org/EGU23/EGU23-7065.html (accessed on 17 December 2024).
  62. Sindija, L.; Luize, L.; Dace, B.; Jovita, P.-U.; Inga, G. Biblioteca Electrónica EPS: Efecto del Contenido de Humedad y Materia Orgánica en las Emisiones de N2O. 2023. Available online: https://epslibrary.at/sgem_jresearch_publication_view.php?page=view&editid1=9449 (accessed on 9 March 2025).
  63. Bordón, P.; Elduque, D.; Paz, R.; Javierre, C.; Kusić, D.; Monzón, M. Analysis of processing and environmental impact of polymer compounds reinforced with banana fiber in an injection molding process. J. Clean. Prod. 2022, 379, 134476. [Google Scholar] [CrossRef]
  64. Alcivar-Bastidas, S.; Petroche, D.M.; Ramirez, A.D.; Martinez-Echevarria, M.J. Characterization and life cycle assessment of alkali treated abaca fibers: The effect of reusing sodium hydroxide. Constr. Build. Mater. 2024, 449, 138522. [Google Scholar] [CrossRef]
  65. Tian, H.; Pan, N.; Thompson, R.L.; Canadell, J.G.; Suntharalingam, P.; Regnier, P.; Davidson, E.A.; Prather, M.; Ciais, P.; Muntean, M.; et al. Global nitrous oxide budget (1980–2020). Earth Syst. Sci. Data 2024, 16, 2543–2604. [Google Scholar] [CrossRef]
  66. Krysztofiak, G.; Catoire, V.; Dudok de Wit, T.; Kinnison, D.E.; Ravishankara, A.R.; Brocchi, V.; Atlas, E.; Bozem, H.; Commane, R.; D’Amato, F.; et al. N2O Temporal Variability from the Middle Troposphere to the Middle Stratosphere Based on Airborne and Balloon-Borne Observations during the Period 1987–2018. Atmosphere 2023, 14, 585. [Google Scholar] [CrossRef]
  67. Ibrahim, R.M.; Abbood, Z.M.; Al-Taai, O.T.; Ahmed, M.M. The Influence of Ozone Depletion Potential Weighted Anthropogenic Emissions of Nitrous Oxide. Asian J. Water Environ. Pollut. 2024, 21, 65–73. [Google Scholar] [CrossRef]
  68. Romo-Gómez, C.; Camacho-López, C.; Marmolejo-Santillán, Y.; Otazo-Sánchez, E.M. Actividades antrópicas: Deterioro de la capa de ozono estratosférico. Pädi Boletín Científico De Cienc. Básicas E Ing. Del ICBI 2019, 7, 1–5. [Google Scholar] [CrossRef]
  69. Fagodiya, R.K.; Pathak, H.; Kumar, A.; Bhatia, A.; Jain, N. Global temperature change potential of nitrogen use in agriculture: A 50-year assessment. Sci. Rep. 2017, 7, 44928. [Google Scholar] [CrossRef]
  70. Lock, K.; Becaus, S.; Criel, P.; Van Eeckhout, H.; Janssen, C.R. Ecotoxicity of cobalt to the springtail Folsomia candida. Comp. Biochem. Physiol. Part C Toxicol. Pharmacol. 2004, 139, 195–199. [Google Scholar] [CrossRef]
  71. Malard, V.; Bresson, C.; Uboldi, C.; Delangle, P.; Van der Meeren, A.; Lemaire, D.; Darolles, C.; Orsière, T.; Ortega, R.; Berthomieu, C. Toxicity mechanisms of cobalt oxide particles (Co3O4P) on human lung cells: Impact of solubilization. BIO Web. Conf. 2019, 14, 05010. [Google Scholar] [CrossRef]
  72. Kosiorek, M.; Wyszkowski, M. Kosiorekm Effect Of Cobalt On The Environment And Living Organisms—A Review. Appl. Ecol. Environ. Res. 2019, 17. [Google Scholar] [CrossRef]
  73. Zemlyanova, M.A.; Stepankov, M.S.; Pustovalova, O.V.; Nedoshitova, A.V. Assessment of bioaccumulation and toxic effects of Cobalt (II) aluminate nanoparticles for hygienic safety purposes. Health Risk Anal. 2024, 3, 113–122. [Google Scholar] [CrossRef]
  74. Sharan, A.; Nara, S. Exposure-based ecotoxicity assessment of Co3O4 nanoparticles in marine microalgae. Environ. Sci. Pollut. Res. 2021, 28, 54802–54810. [Google Scholar] [CrossRef] [PubMed]
  75. Ou, R.; Huang, H.; He, X.; Lin, S.; Ou, D.; Li, W.; Qiu, J.; Wang, L. Ecotoxicology of Polymetallic Nodule Seabed Mining: The Effects of Cobalt and Nickel on Phytoplankton Growth and Pigment Concentration. Toxics 2023, 11, 1005. [Google Scholar] [CrossRef] [PubMed]
  76. Karthikeyan, P.; Marigoudar, S.R.; Raja, P.; Nagarjuna, A.; Kumar, S.B.; Savurirajan, M.; Sharma, K.V. Toxicity of Anthracene on Marine Organisms and Development of Seawater Quality Criteria. Available online: https://www.researchsquare.com/article/rs-4222753/v1 (accessed on 5 November 2024).
  77. Pathak, A.K.; Sharma, M.; Nagar, P.K. A framework for PM2.5 constituents-based (including PAHs) emission inventory and source toxicity for priority controls: A case study of Delhi, India. Chemosphere 2020, 255, 126971. [Google Scholar] [CrossRef]
  78. Ravindra, K.; Sokhi, R.; Van Grieken, R. Atmospheric polycyclic aromatic hydrocarbons: Source attribution, emission factors and regulation. Atmos. Environ. 2008, 42, 2895–2921. [Google Scholar] [CrossRef]
  79. Gomes, V.; Passos, M.J.A.C.R.; Leme, N.M.P.; Santos, T.C.A.; Campos, D.Y.F.; Hasue, F.M.; Phan, V.N. Photo-induced toxicity of anthracene in the Antarctic shallow water amphipod, Gondogeneia antarctica. Polar Biol. 2009, 32, 1009–1021. [Google Scholar] [CrossRef]
  80. Oris, J.T.; Giesy, J.P.; Allred, P.M.; Grant, D.F.; Landrum, P.F. Photoinduced Toxicity of Anthracene in Aquatic Organisms: An Environmental Perspective. In Studies in Environmental Science; Elsevier: Amsterdam, The Netherlands, 1984; pp. 639–658. [Google Scholar] [CrossRef]
  81. Nabebe, G.; Ogamba, E.N.; Izah, S.C. Aspects of Polycyclic Aromatic Hydrocarbons in Aquatic Ecosystems: A One Health Perspective. Greener J. Environ. Manag. Public Saf. 2024, 12, 22–43. [Google Scholar] [CrossRef]
  82. Manssour, K.; Al-Mufti, B. Influence of industrial, agricultural and sewage water discharges on eutrophication of Quttina lake. Jordan J. Civ. Eng. 2010, 4, 351–366. [Google Scholar]
  83. Devlin, M.; Brodie, J. Nutrients and Eutrophication. Available online: https://link.springer.com/chapter/10.1007/978-3-031-10127-4_4 (accessed on 5 November 2024).
  84. Wijaya, I.M.W.; Partama, I.G.Y.; Sumantra, I.K. Study on Nutrients Concentration Trends in Tukad Badung River Toward Nutrient Recovery Potential. IOP Conf. Ser. Earth Environ. Sci. 2023, 1268, 012002. [Google Scholar] [CrossRef]
  85. Tsai, W.T.; Wu, P.H. Environmental Concerns About Carcinogenic Air Toxics Produced from Waste Woods as Alternative Energy Sources. Energy Sources Part A: Recovery Util. Environ. Eff. 2013, 35, 725–732. [Google Scholar] [CrossRef]
  86. Lindenbeck, L.M.; Barra, V.C.; Dahlhaus, S.; Wende, L.; Beele, B.B.; Schebb, N.H.; Rodrigues, B.V.M.; Slabon, A. Organic Chemicals from Wood: Selective Depolymerization and Dearomatization of Lignin via Aqueous Electrocatalysis. ChemSusChem 2024, 17, e202301617. [Google Scholar] [CrossRef] [PubMed]
  87. Clasen, T.F.; Pillarisetti, A.; Gill-Wiehl, A.M.; Kwong, L.; Daouda, M.; Kammen, D.M. Revisiting the role of LPG in Expanding Energy Access. Available online: https://osf.io/preprints/osf/qu5bd_v1 (accessed on 5 November 2024).
  88. Moreno-Ruiz, E.; Valsasina, L.; Vadenbo, C.; Symeonidis, A. ecoinvent—An Introduction to the LCI Database and the Organization Behind it. J. Life Cycle Assess. Jpn. 2023, 19, 215–226. [Google Scholar] [CrossRef]
  89. Wernet, G.; Bauer, C.; Steubing, B.; Reinhard, J.; Moreno-Ruiz, E.; Weidema, B. The ecoinvent database version 3 (part I): Overview and methodology. Int. J. Life Cycle Assess. 2016, 21, 1218–1230. [Google Scholar] [CrossRef]
  90. Morcillo, M.; Gomez-Caturla, J.; Sánchez-Nacher, L.; Garcia-Garcia, D.; Garcia-Sanoguera, D. Optimization of thermoplastic matrix composite materials of renewable origin with pine fiber reinforcement. Rev. Mater. Compuestos 2022, 7, 1–6. [Google Scholar] [CrossRef]
  91. Sarasini, F. Thermoplastic biopolymer matrices for biocomposites. In Biocomposites for High-Performance Applications; Elsevier: Amsterdam, The Netherlands, 2017; pp. 81–123. [Google Scholar] [CrossRef]
  92. Anastasiou, D.E. Life cycle assessment of Luffa-reinforced epoxy composites: Untreated versus chemically treated fibers. J. Appl. Polym. Sci. 2024, 141, e55952. [Google Scholar] [CrossRef]
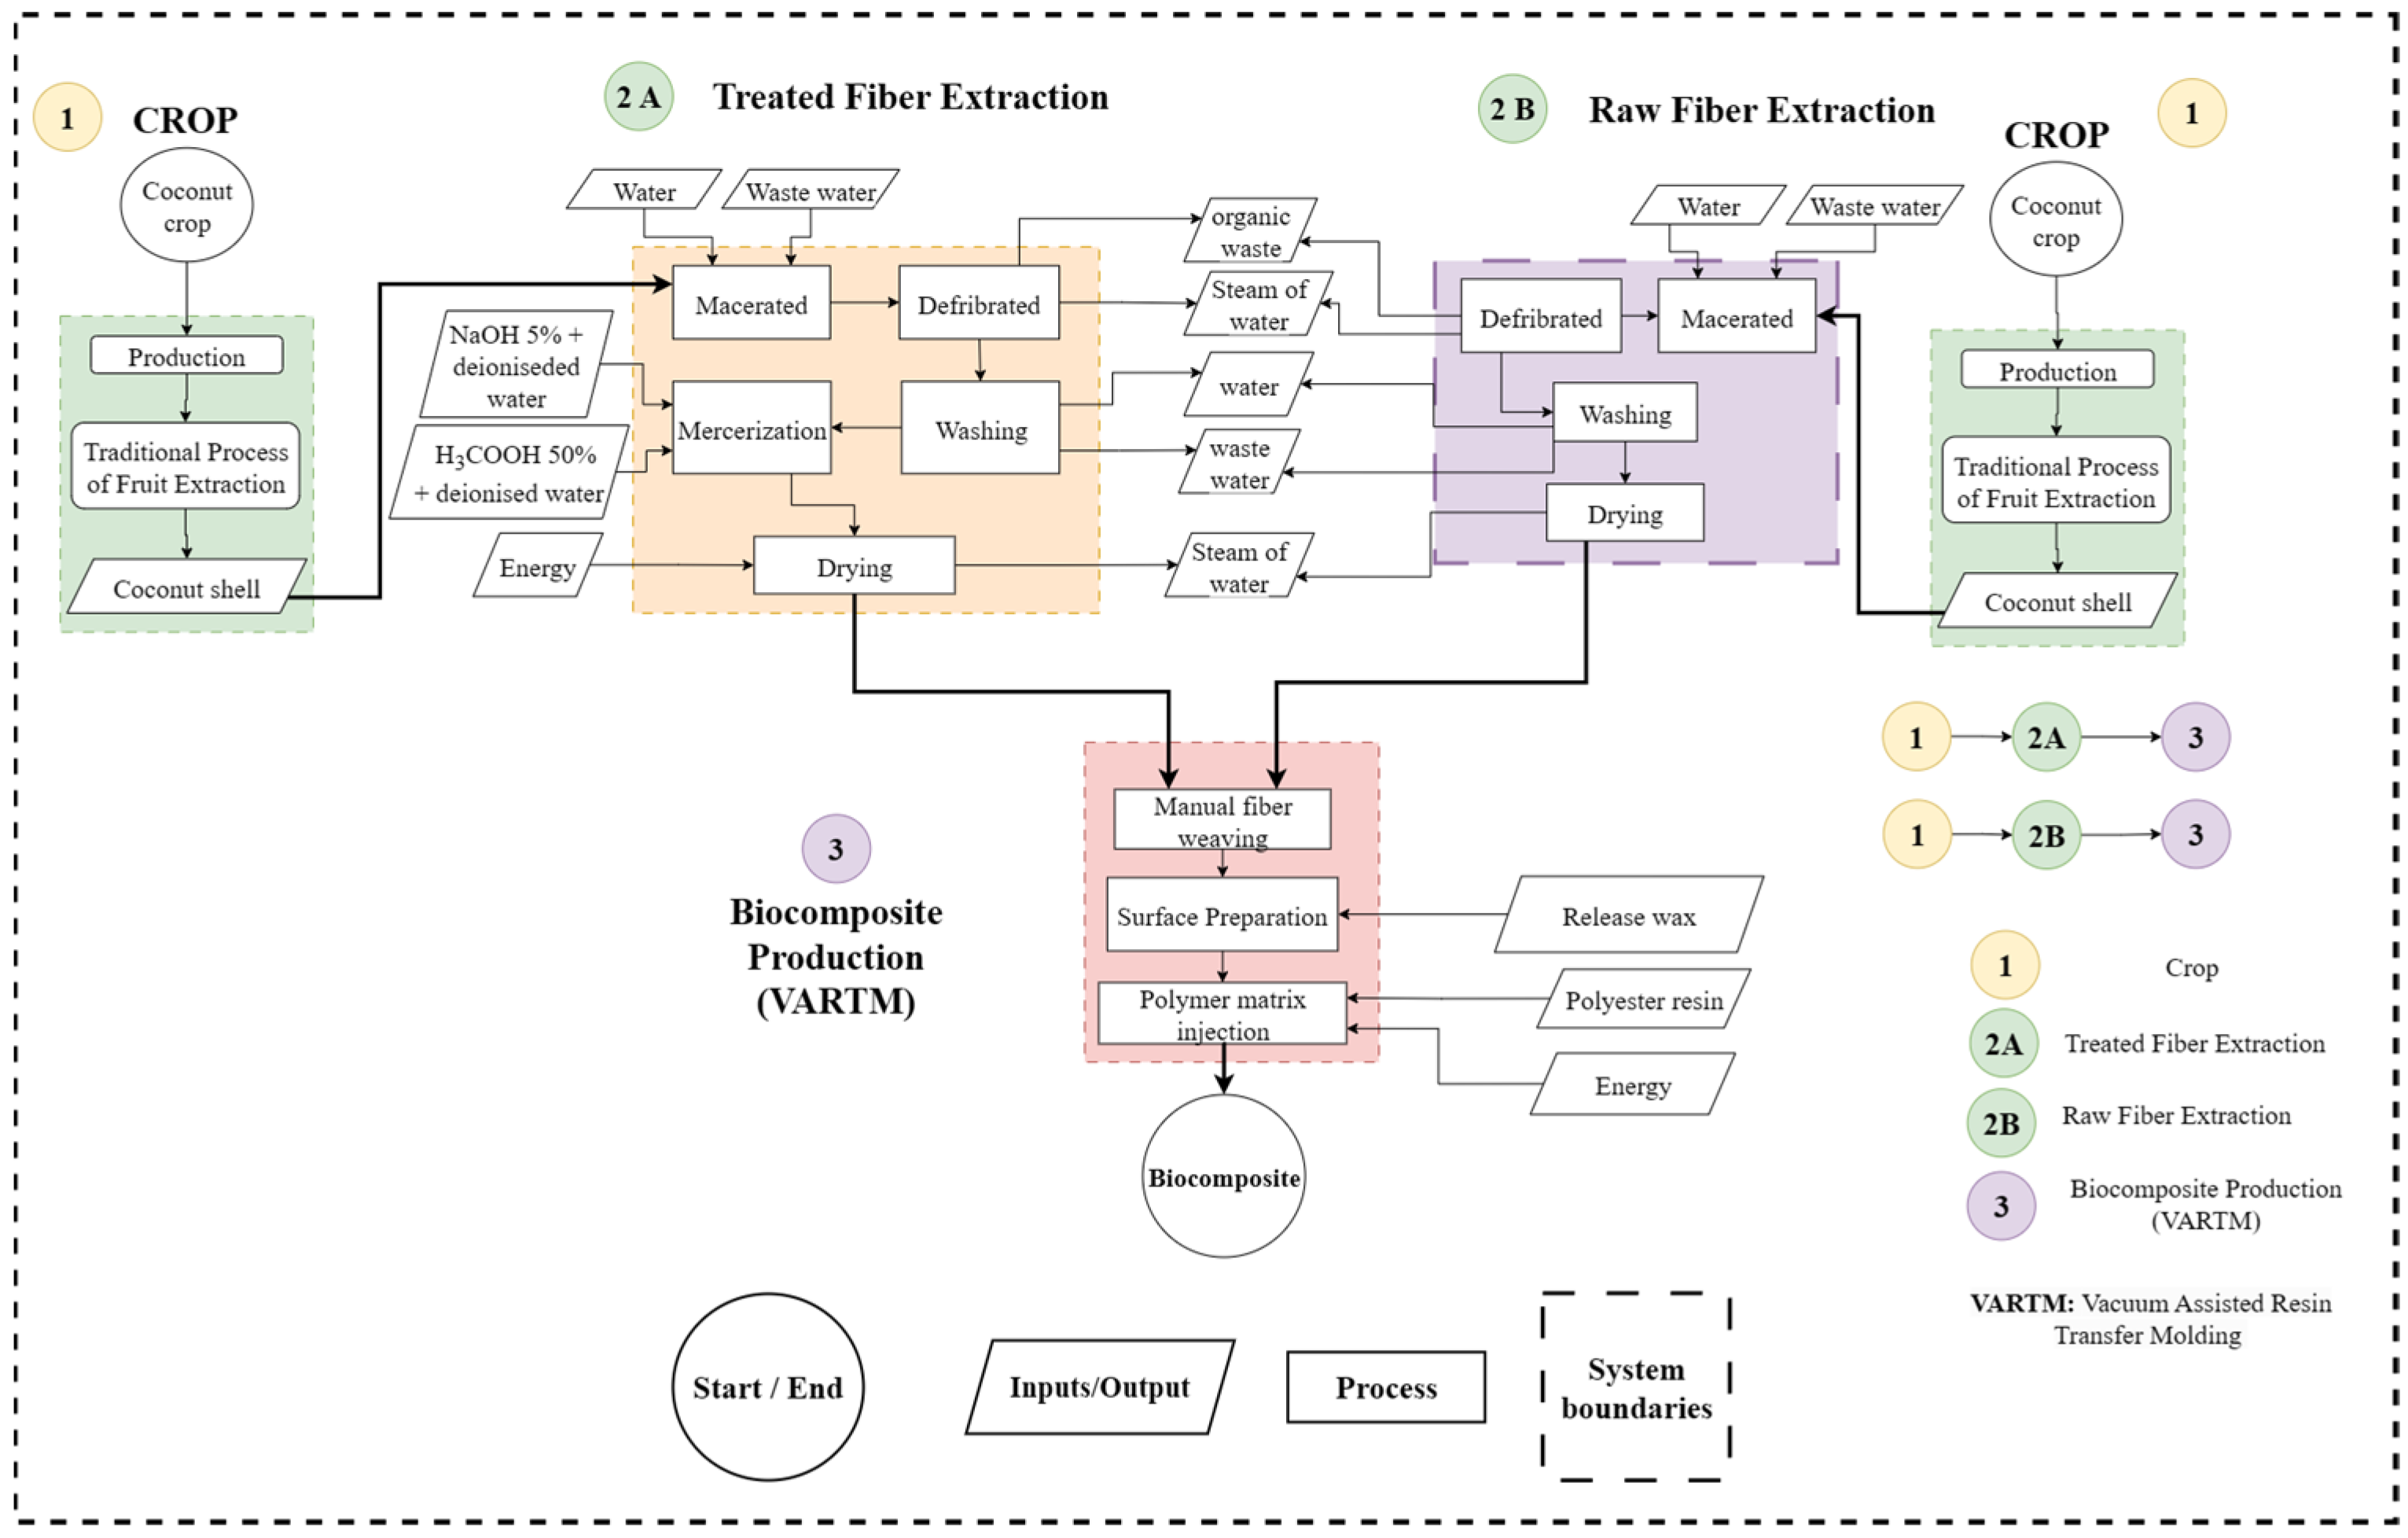
Figure 1. A boundary diagram for the three stages.
Sustainability 17 08338 g001
Figure 2. Data quality percentage for the life cycle inventory.
Sustainability 17 08338 g002
Figure 3. CO2 emission results for each scenario using the IPCC2021 GWP100 impact assessment method.
Sustainability 17 08338 g003
Figure 4. Process contribution to GWP100.
Sustainability 17 08338 g004
Figure 5. Substance contribution to GWP100.
Sustainability 17 08338 g005
Figure 6. An outline of the environmental modeling of the Life Cycle Assessment (LCA) for the CPP/H scenario.
Sustainability 17 08338 g006
Figure 7. A schematic diagram of the environmental modeling of the Life Cycle Assessment (LCA) for the CF-CCT/H scenario.
Sustainability 17 08338 g007
Figure 8. Impact assessment for scenarios CPP/H, CF-CCT/H, RF-CCT/H, CPP/L, CF-CCT/L, RF-CCT/L using the ReCiPe Midpoint (H) method.
Sustainability 17 08338 g008
Figure 9. (A) Process emissions for the ODP category. (B) Emissions from processes emitting the substance N2O for the ODP category. (C) Emissions by process for the TETP category. (D) Emissions by substance for the TETP category. (E) Emissions from processes that emit the substance Cobalt II for the TETP category.
Sustainability 17 08338 g009
Figure 10. (A) Process emissions for the METP category. (B) Emissions by substance for the METP category. (C) Emissions from processes emitting the substance anthracene for the METP category. (D) Emissions from processes emitting the substance Cobalt II for the METP category. (E) Emissions from processes emitting the substance HAP for the METP category.
Sustainability 17 08338 g010
Figure 11. (A) Emissions by process for the FAP category. (B) Emissions by substance for the FAP category. (C) Emissions from processes that emit BOD5 substances for the FAP category. (D) Emissions from processes that emit COD substances for the FAP category. (E) Emissions from processes that emit phosphate substances for the FAP category. (F) Emissions from processes that emit phosphorus substances for the FAP category.
Sustainability 17 08338 g011
Figure 12. (A) Emissions by process for the HTPC category. (B) Emissions by process for the HTPC category. (C) Emissions from processes that emit HAP substances for the HTPc category. (D) Process emissions for the FFP category.
Sustainability 17 08338 g012
Table 1. Input and output data types in LCA.
DataType of Data
InputMaterials, mass balance, energy consumption, transportation, water use.
OutputMass balance of final product, by-products, solid waste, liquid waste, emissions.
Table 2. Data indicator and quality level.
Data Quality IndicatorLevel of Data Quality
1.0–1.6Very high quality
1.7–2.4High quality
2.5–3.2Satisfactory quality
3.3–4.0Low quality
Table 3. Scenario description and labeling.
GroupsScenariosReinforcement%Matrix (%)TreatmentLabel
S110%100%---CCP/L 1
22–5%90–95%YESCF-CCT/L 2
32–5%90–95%NOTRF-CCT/L 3
S240%100%---CCP/H 4
520–30%80–85%YESCF-CCT/H 5
620–30%80–85%NOTRF-CCT/H 6
1 Conventional Cultivation Practice, low fiber replacement (L). 2 Chemistry Fiber from Coconut Crop, low fiber replacement (L). 3 Raw Fiber from Coconut Crop, low fiber replacement (L). 4 Conventional Cultivation Practice, high fiber replacement (H). 5 Chemistry Fiber from Coconut Crop, high fiber replacement (H). 6 Raw Fiber from Coconut Crop, high fiber replacement (H).
Table 4. Quantitative results of the data quality analysis for the life cycle inventory.
Product of the ProcessQuality ParametersData Quality Rating (DQR)Data Quality Level
MCTirGRTeRP
Coconut crop43111 2.89Satisfactory
Coconut weight1111142.50Satisfactory
Application of supplies and fertilizers (water, KCl, chicken manure)3211142.80Satisfactory
CO2 capture by biomass31114 2.90Satisfactory
Distance traveled by vehicles to transport supplies2411142.90Satisfactory
CO2 emissions into the air23133 2.67Satisfactory
Dinitrogen oxide into the air23133 2.67Satisfactory
Ammonia into the air23133 2.67Satisfactory
Nitrogen oxide into the air23133 2.67Satisfactory
Nitrate into groundwater23133 2.67Satisfactory
Phosphates into surface water23133 2.67Satisfactory
Heavy metals into surface water and groundwater23133 2.67Satisfactory
Heavy metals into soil23133 2.67Satisfactory
Coconut mesocarp—maceration1211322.20High quality
Tap water—maceration1213322.40High quality
Wastewater—maceration1211111.50Very High quality
Wet coconut husks—defibering1211322.20High quality
Extracted fiber—defibering1211322.20High quality
Organic waste—defibering1213433.00Satisfactory
Steam water—defibering1511433.51Low quality
Tap water—washing1213322.40High quality
Wet fiber—washing1211322.20High quality
Wastewater—washing3213433.20Satisfactory
Water, deionised {RoW}|market for water, deionised|Cut-off, S—mercerization1212422.80Satisfactory
Sodium hydroxide, without water, in 50% solution state {RoW}|market for sodium hydroxide, without water, in 50% solution state|cut-off, S—mercerization1212322.30High quality
Acetic acid, without water, in 98% solution state {GLO}|market for acetic acid, without water, in 98% solution state|cut-off, S—mercerization1212322.30High quality
Mercerized fiber1211322.20High quality
Wastewater—mercerization3213433.20Satisfactory
Electricity, low voltage {CO}|market for electricity, low voltage|cut-off, S—dry1112322.20High quality
Dry fiber—dry1211322.20High quality
Steam water—dry1511433.51Low quality
Electricity, low voltage {CO}|market for electricity, low voltage|cut-off, S—VARTM1212432.90Satisfactory
Biocomposite1211332.30High quality
The score of 1 denotes the “best” quality and shown in dark green while 5 stands for the “worst” and coloured in dark red.
Table 5. Life cycle inventory of foreground processes for biomaterial production.
Coconut Crop
Materials and EnergyUnitsScenarios
CF-CCT/LCF-CCT/H
Inputs
Coconut cropkg1.385.78
Water (m3)m30.0510.214
Chicken manurekg0.0170.107
Potassium chloridekg0.0267.560
Transportkm0.1550.648
Outputs
Carbon dioxide uptake (air) kg−2.961−12.407
Carbon dioxide (air)kg0.0100.043
Dinitrogen oxide (air)kg0.0570.057
Ammonia (air)kg0.00020.00097
Nitrogen oxide (air)kg0.00007650.0003205
Nitrate (groundwater)kg21.369321.3699
Phosphates (water superficial)mg5.115.11
Cadmium (groundwater)mg0.0670.281
Cupper (groundwater)mg4.88020.429
Zinc (groundwater)mg5.8300024.419
Lead (groundwater)mg0.028900.121
Chrome (groundwater)mg2.4100010.105
Cadmium (ocean)mg0.190000.798
Cupper (ocean)mg16206759.75
Zinc (ocean)mg5192175.11
Lead (ocean)mg204855.14
Chrome (ocean)mg162680.75
Cadmium (soil)mg0.00260.247
Cupper (soil)mg0.28905747
Zinc (soil)mg4.330017.804
Lead (soil)mg0.243056.698
Chrome (soil)mg0.108061.595
Extraction of Raw Materials
Inputs
Coconut huskkg0.692.89
Tap water {CO}|market for tap water|cut-off, SL14.9662.6635
Water, deionised {RoW}|market for water, deionised|cut-off, SL2.209.2199
Sodium hydroxide, without water, in 50% solution state {RoW}|market for sodium hydroxide, without water, in 50% solution state|xut-off, Skg0.02020.0846
Acetic acid, without water, in 98% solution state {GLO}|market for acetic acid, without water, in 98% solution state|cut-off, Skg0.20190.8459
Electricity, low voltage {CO}|market for electricity, low voltage|cut-off, SkWh0.743.1015
Outputs
Treated fiberkg0.030.15
Waste wood, untreated {CO}|market for waste wood, untreated|cut-off, Skg 0.662.774
Steam water/COm31.335.568
Raw sewageL7.2530.368
Wastewater, average {RoW}|treatment of wastewater, average, wastewater treatment|cut-off, SL8.7936.846
Biomaterial Production
Petroleum slack wax {CO}|petroleum slack wax production, petroleum refinery operation|cut-off, Skg0.0020.002
Orthophthalic acid based unsaturated polyester resin {GLO}|market for orthophthalic acid based unsaturated polyester resin|cut-off, Skg0.960.85
Electricity, low voltage {CO}|market for electricity, low voltage|cut-off, Skg0.130.13
biocompositekg11
Disclaimer/Publisher’s Note: The statements, opinions and data contained in all publications are solely those of the individual author(s) and contributor(s) and not of MDPI and/or the editor(s). MDPI and/or the editor(s) disclaim responsibility for any injury to people or property resulting from any ideas, methods, instructions or products referred to in the content.