Article

An Empirical Study on the Interaction and Synergy Effects of Park Features on Park Vitality for Sustainable Urban Development

School of Tropical Agriculture and Forestry, Hainan University, Haikou 570208, China
*
Author to whom correspondence should be addressed.
Sustainability 2025, 17(18), 8335; https://doi.org/10.3390/su17188335
Submission received: 7 August 2025 / Revised: 12 September 2025 / Accepted: 15 September 2025 / Published: 17 September 2025

Abstract

Parks, as essential elements of urban green public spaces, play a crucial role in sustainable urban development. Their features have features confirmed to significantly affect park vitality. Prior research has indirectly indicated that park features might impact park vitality via interaction and synergy; however, such effects have been neglected in park vitality studies. The study area is South China, with data collected from 20 urban comprehensive parks in 8 representative cities. This study constructs linear mixed models of principal component main effects, interaction effects, and synergy effects to empirically examine the interaction of internal element features and the synergy of external environmental features affecting park vitality. The findings indicate: (1) Structural interaction effects exist among internal element features that impact park vitality. The structures of “medium plaza + small plaza” and “primary park road + open grassland” significantly enhance vitality. Conversely, the structure of “aquatic plant coverage area + lake + dense woodland” has a negative influence. Single structure features are ineffective in significantly influencing park vitality. (2) The inclusion of interaction terms between internal feature structures enhances the significance of their effects on vitality. The interaction of “medium plaza + small plaza” × “primary park road + open grassland” shows the strongest effect. (3) There is a synergy between internal and external features: with external features like accessibility and disposable income, certain internal interaction structures positively contribute to vitality. Additionally, the “service capacity” external environmental feature exhibits a negative synergy with internal element features. These findings provide theoretical and practical insights for sustainable urban park design, planning, and refined management in cities with similar socioeconomic and spatial contexts.

1. Introduction

1.1. Research Background

Parks, as essential elements of urban green public spaces, have had their vitality increasingly recognized as an important metric for assessing both urban sustainability and the effectiveness of green space use [1,2]. Prior research has shown that park features, including internal element features and external environmental features, play a crucial role in shaping park vitality [3,4,5,6], from a broad perspective, park features can generally be categorized into two dimensions: internal element features [7,8,9] and external environmental features. Among these, internal element features are the tangible expression of the park’s individual landscape spatial entities, external environmental features pertain to the socioeconomic context of the city and district where the park is situated. However, the mechanisms through which park features affect park vitality have received insufficient scholarly attention. Specifically, this study focuses on two key research questions: First, how do the interactions among internal element features influence park vitality? Second, how do the synergistic effects between external environmental features and internal element features enhance or diminish park vitality? While some theoretical work has indirectly suggested through qualitative analysis that, park features may exert their impact on park vitality through mechanisms of interaction and synergy [10,11,12,13,14,15,16]. However, such interaction and synergy effects have rarely been quantitatively tested in the context of urban parks. Furthermore, most studies have limited their analysis to the independent effects of internal or external features on park vitality. As a consequence, interaction and synergy effects of park features on vitality have long been overlooked in global studies of urban parks. The interactive and synergistic effects through which park features influence park vitality have remained a gap in the relevant field of urban park vitality research.

1.2. Literature Review

Prior research indicates that interaction and synergy effects in vitality formation are not novel concepts. As early as the 1960 s, Jacobs’ diversity-based theory of spatial vitality introduced this notion, positing that spatial vitality emerges from the diversity and integration of functions and spatial characteristics. Subsequently, Montgomery and Carmona argued that the synergy among diverse features is essential for generating vitality [15,16]. However, this theoretical understanding of how interaction and synergy shape spatial vitality has largely remained confined to empirical research focusing primarily on the scale of urban blocks or streets [17,18,19,20]. Although similar effects may also apply to parks, many researchers [5,21,22,23] have primarily investigated the independent influence of single or multiple internal element features on park vitality [6,24], or have limited their analysis to the independent influence of external environmental features on park vitality [25,26,27,28,29,30,31]. The interactive and synergistic effects between internal and external park features remain largely unexplored through quantitative integration.
From the above literature, it is evident that most park vitality research has emphasized the isolated effects of single-dimension park features, with few empirical efforts to quantify the interaction effects among different features. Similarly, little attention has been paid to examining the synergistic effects of multi-dimensional features on vitality. Consequently, the quantitative investigation of how interactive and synergistic mechanisms among park features affect vitality remains an unaddressed issue in urban park research.
Methodologically, current research on park vitality has largely relied on users’ perceptions and behavioral preferences, using qualitative or semi-quantitative approaches such as interviews, surveys, and field observations [32,33,34], which can be useful in understanding how individuals perceive park features, they fall short in dynamically and objectively capturing the real-time performance of park features. With the growing availability of multi-source data in recent years, some studies have adopted technologies such as mobile phone signaling and social media check-ins to analyze patterns of human mobility and crowd clustering [1,35,36], offering a more dynamic lens to interpret park vitality. However, these studies primarily emphasize human behavioral patterns, with limited exploration of the spatial drivers behind population clustering, particularly neglecting the interaction mechanisms between park features and human activities. In the context of southern Chinese cities, even parks with abundant features and multifunctionality often exhibit relatively low vitality levels in practice [24,37,38,39], suggesting that existing research has not fully explained why well-featured parks may still struggle to attract users and generate vitality.

1.3. Research Purpose

Therefore, systematically investigating the interaction and synergy effects of park features on vitality will help urban designers and administrators reinterpret the underlying logic of how park vitality is generated, providing both theoretical support and practical guidance for park design and management.

1.4. Contribution

This study offers two main contributions: First, we developed a series of linear mixed models—including a principal component main-effect model, an interaction-effect model, and a synergy-effect model—to precisely quantify the extent to which internal element interaction and external environmental synergy contribute to the enhancement or attenuation of park vitality. Secondly, our research empirically validates the applicability of Jacobs’ “diversity” vitality theory in the context of urban parks [14]. While Jacobs’ theory of diversity-driven vitality has been extensively validated in street-level contexts, it has rarely been empirically examined in park environments. Our analysis of interaction and synergy effects reveals that both the diversity-driven interactions within internal element features and their synergistic relationships with external environmental features have a substantial positive impact on park vitality.

2. Methods

2.1. Study Area and Sample Parks

This study first selected South China (i.e., Guangdong, Guangxi, and Hainan provinces) as the study area (Figure 1). The region is characterized by high population density, rapid urbanization, and a strong demand for public space [40], making it highly representative and practical for studying urban development in China [41,42,43]: (1) Diverse regional economies. The region encompasses the Guangdong-Hong Kong-Macao Greater Bay Area (a globally significant bay area), the emerging Hainan Free Trade Port, and the critical China–ASEAN economic corridor. (2) High levels of vitality. Parks in South China are more frequently used, with diverse user behaviors, allowing for dynamic indicators (e.g., heat values) to effectively reflect variations in park vitality. (3) Strong demonstrative value. As a pilot region for China’s new urbanization and ecological city initiatives [44], its experience is highly transferable. Investigating the relationship between park element configuration and vitality will help provide scientific planning and design references for other cities with similar issues.
Secondly, eight representative cities within the region were selected as samples: Haikou, Sanya, Guangzhou, Shenzhen, Dongguan, Foshan, Nanning, and Guilin. Hong Kong and Macao were not included primarily due to significant differences in their urban governance systems compared to mainland China, along with difficulties in obtaining relevant urban data, making comparative analysis within a unified framework challenging. Considering research feasibility and data consistency, we included only Guangzhou, Shenzhen, Foshan, and Dongguan from the Greater Bay Area as representative cities, combining them with typical cities from Hainan and Guangxi to form the sample, ensuring a balance between regional representativeness and data comparability. These cities were chosen to reflect diverse regional economic types and various stages of urban development. From these cities, twenty urban comprehensive parks were selected as sample parks and numbered accordingly (Table 1). These selected parks typically exhibit the following characteristics: clearly defined park boundaries and a diverse spatial layout; a well-structured functional zoning system; large service coverage, with each park covering at least 10 hectares; diverse user populations and high public accessibility. The selection of this type of park is based on its large scale, comprehensive functions, and complex spatial structure, which can fully demonstrate the diversity and interactive effects between internal element features and external environmental features. Although large comprehensive parks exhibit high spatial heterogeneity that may exceed the coverage of a single sample; by selecting representative park samples and considering the functional zoning and spatial structure within each park, we can still effectively capture the patterns of internal element interactions and external environmental synergies. While community parks or pocket parks may be representative to some extent, their relatively simple spatial structure makes it difficult to manifest complex interaction effects. Therefore, the selected eight cities and twenty park samples not only account for spatial heterogeneity but also maintain strong representativeness, providing a reliable foundation for quantitatively analyzing interaction and synergy effects in park vitality.

2.2. Research Framework

To avoid conceptual ambiguity, this study clarifies the operational definitions of three closely related terms. “Interaction” refers to the statistical or structural relationships among internal element features, where the combined effect of two or more features on park vitality is not a simple sum of their individual contributions but emerges from their joint influence. “Synergy” describes the positive or negative reinforcement effects that occur when internal element features and external environmental features are combined, indicating whether such combinations enhance or weaken park vitality beyond their separate effects. “Coupling” is employed as a broader conceptual framing to describe the mutual dependence and coordinated functioning between different categories of features and is used only when emphasizing the systemic nature of these relationships. In subsequent analyses, “interaction” and “synergy” are employed as the primary operational terms for model construction and result interpretation, while “coupling” is reserved for theoretical discussion to highlight the integrated perspective.
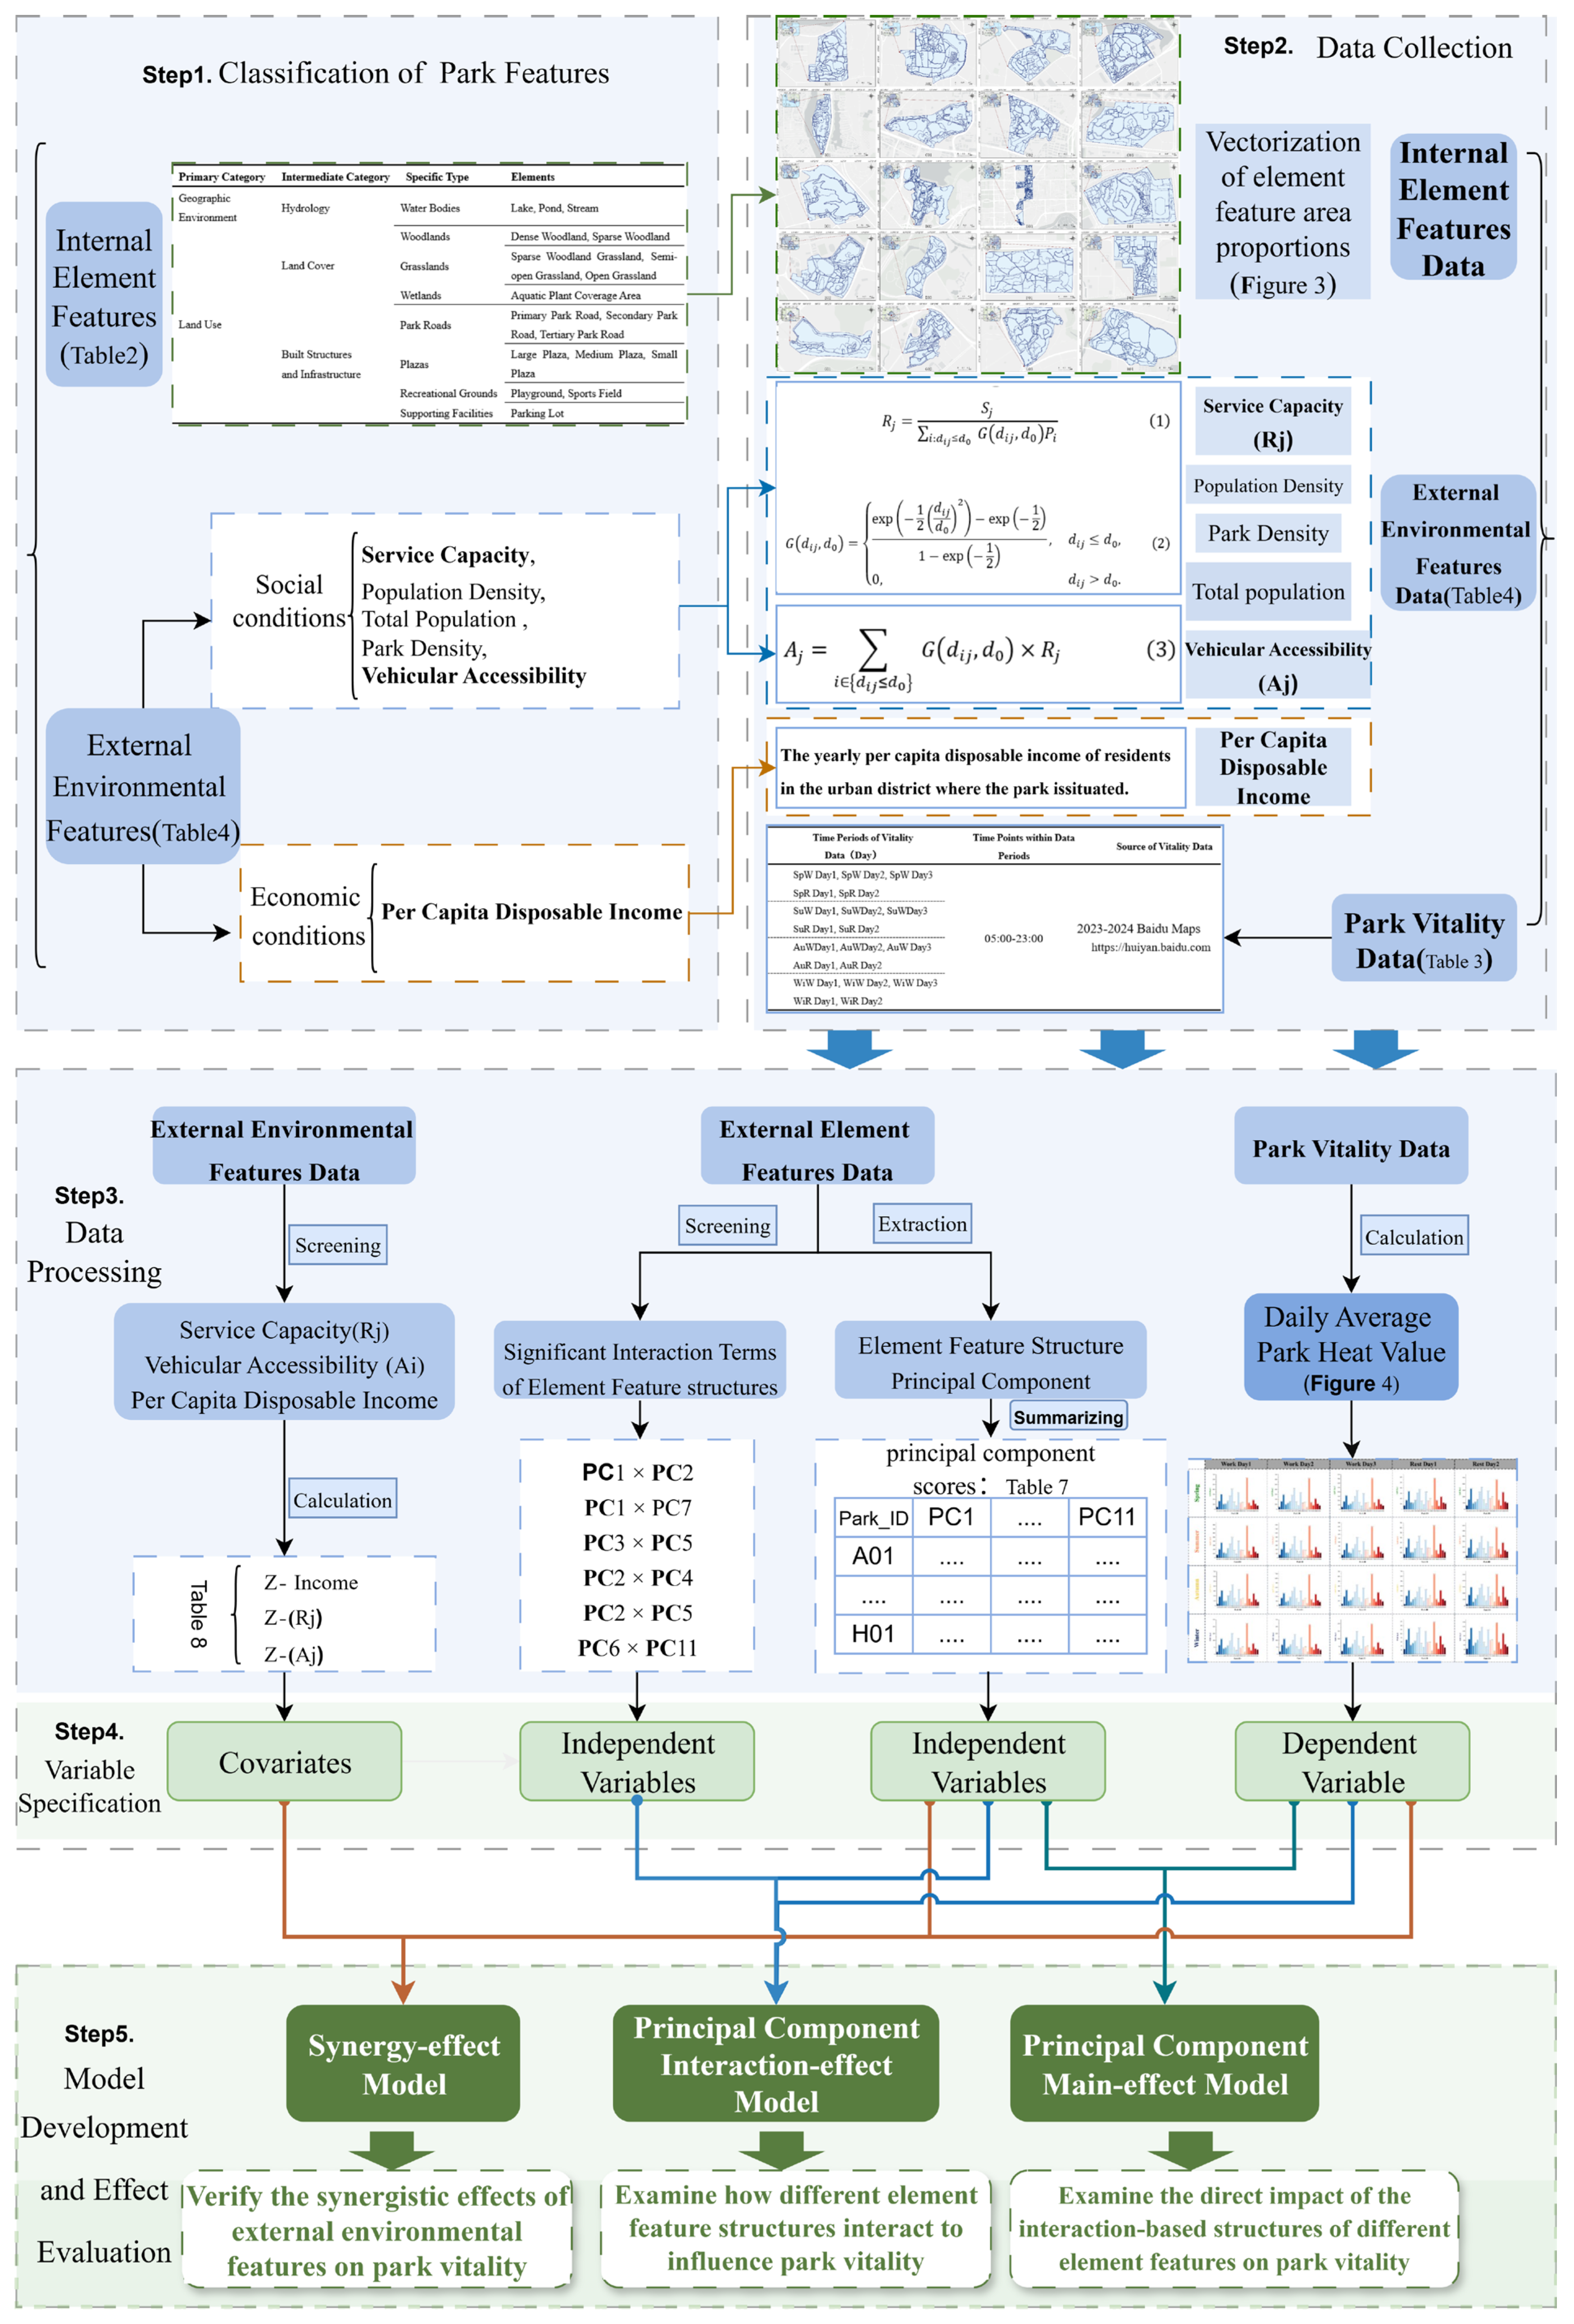
To clarify the research framework, we created a flowchart (Figure 2), outlining five key steps:

2.2.1. Classification of Park Features

(1) Internal Element Features
Element features refer to the tangible expressions of spatial landscape carriers within a park, whose formation is shaped by the interplay of geographic conditions, land use, and socio-cultural factors [45,46]. Therefore, drawing upon the theoretical framework of element feature formation, we categorized park landscape features accordingly (Table 2).
(2) External Environmental Features
The social and economic conditions of the urban district in which a park is situated are classified as external environmental features. These external environmental features include a range of relevant indicators: Social conditions: service capacity, population density, total population, park density, and vehicular accessibility; Economic conditions: per capita disposable income.

2.2.2. Data Collection

In this study, sample data were collected and categorized into three groups: park vitality data, internal element feature data, and external environmental feature data.
(1) Park Vitality Data
The park vitality data were collected over a one-year cycle, covering Summer, Autumn, and Winter of 2023 and Spring of 2024. For each season, data were sampled for one week, comprising three Work Days and two Rest Days per week. Each sample day included 19 time points between 05:00 and 23:00 (Table 3). The vitality data were obtained from Baidu Huiyan for 2023–2024, guaranteeing data accuracy and capturing the spatiotemporal dynamics.
(2) Internal Element Feature Data
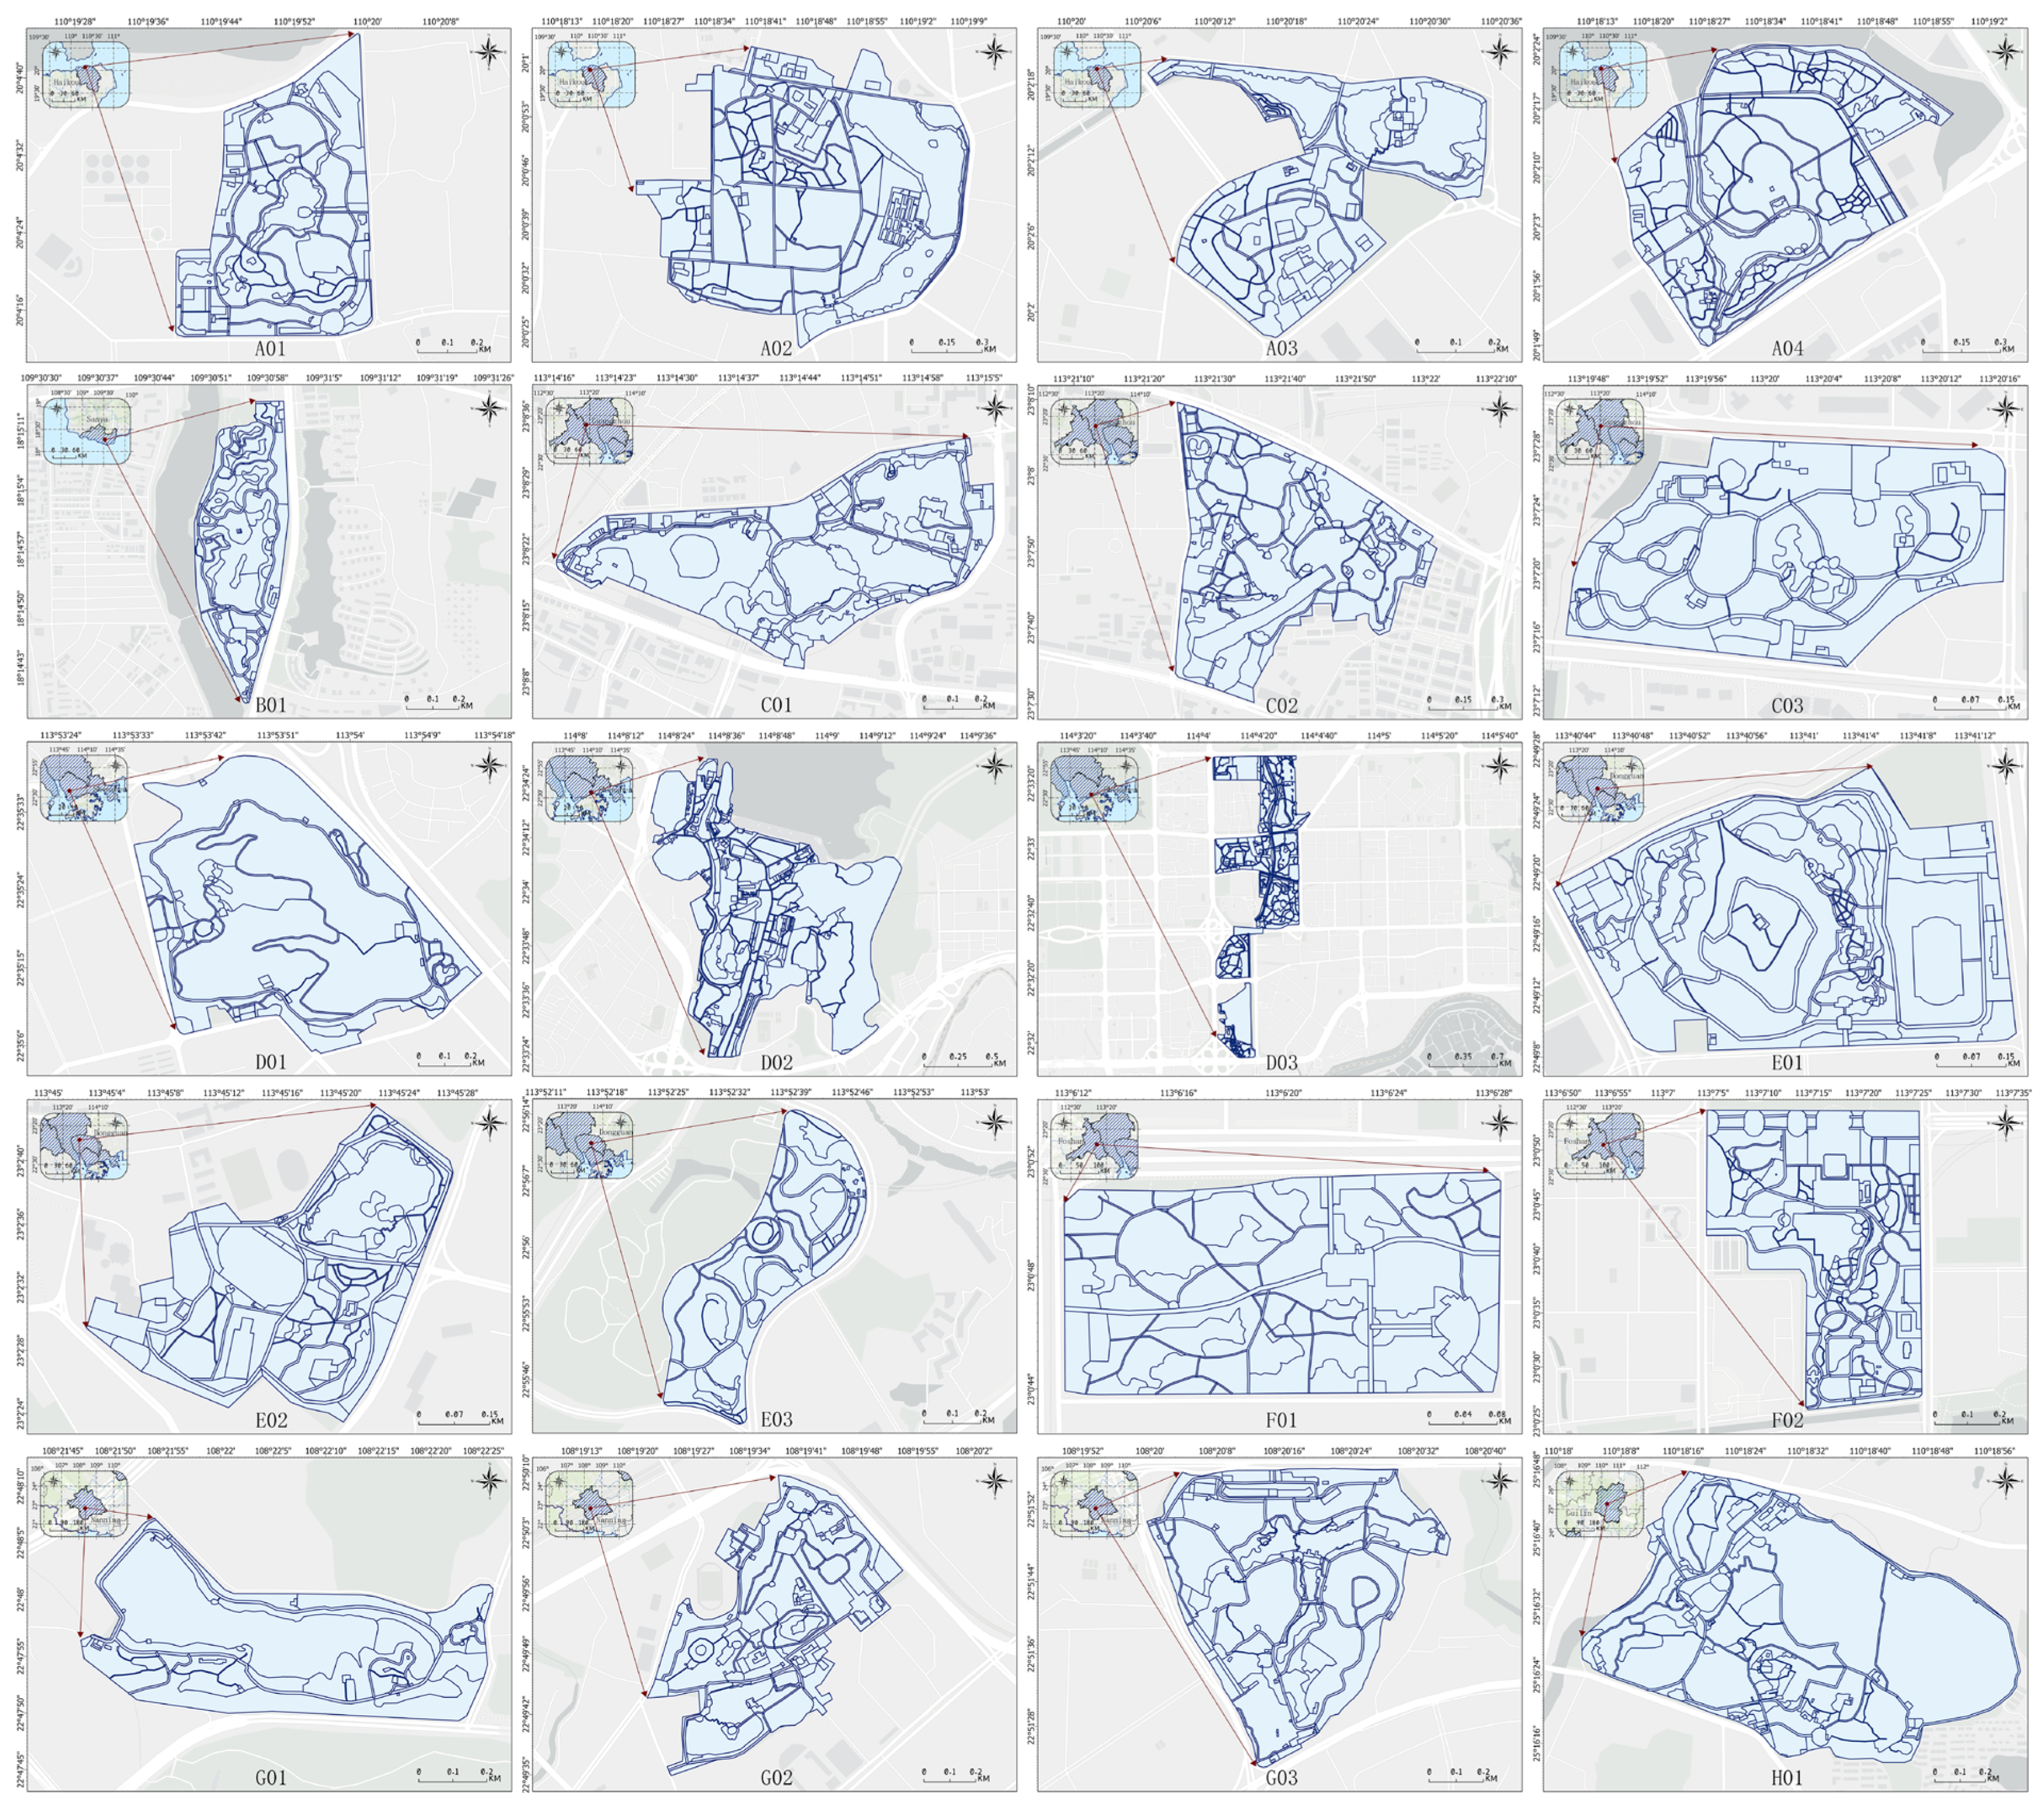
Based on the classification of internal element features (Table 2), high-resolution remote sensing imagery of the sample parks was used alongside ArcMap’s area measurement tool to vectorize the proportional areas of each element feature for each sample park (Figure 3).
(3) External Environmental Feature Data
Data on the social, economic, and other external environmental features of the urban districts where the parks are situated were collected (Table 4).
Table 4. External Environmental Features.
External FeatureDescriptionCalculation Formula
Service Capacity ( R j )Supply-demand ratio be-tween total park area and population within the threshold range (=30 min) [47,48,49].
R j = S j i : d i j d 0   G d i j , d 0 P i
G d i j , d 0 = exp 1 2 d i j d 0 2 exp 1 2 1 exp 1 2 , d i j d 0 , 0 , d i j > d 0 .
S j : denotes the supply capacity of park j, measured by its actual area; P i : indicates the population at location i reflecting potential demand; d i j : is the driving time from population point i to park j; G ( d i j , d 0 ) : refers to the Gaussian decay function that gradually attenuates the influence of population points with increasing distance within the radius ( d 0 )
Vehicular Accessibility ( A j )Transportation accessibility contribution of park j to the population within the threshold range.
A j = i d i j d 0   G d i j , d 0 × R j
A j : represents the park green space accessibility index for residential point i, and a higher calculated A j value indicates better accessibility at location j.
Total PopulationGross population number of the urban district where the park is located.-
Population DensityThe population density of the urban district in which the park is situated.-
Park DensityThe proportion of the total area of the urban district occupied by park area.-
Per Capita Disposable
Income
The yearly per capita disposable income of residents in the urban district where the park is situated.-
Note: Data Sources: Service capacity ( R j ): Amap Open Platform, 2025; Vehicular Accessibility ( A j ): Baidu Maps, 2023–2024; Total Population within Service Radius, Population Density, Park Density, Per Capita Disposable Income were collected from the 2023 Statistical Yearbooks of the respective district governments hosting the parks.

2.2.3. Data Processing

(1) Calculation of Daily Average Park Vitality Values
Although the collected vitality data (Table 3), sourced from Baidu Huiyan, can reflect relative population density, its relatively coarse precision prevents it from directly serving as an effective representation of park vitality. Therefore, we performed detailed cleaning and transformation of these data using ArcGIS Pro 10.8 software. After processing, we obtained heat values for each sample park at different time points, which reflect the actual activity level of people in the park at those specific times. Furthermore, we calculated the average daily heat values for each park on both weekdays and weekends across seasons, enabling a comprehensive characterization of the overall vitality levels of different sample parks during various time periods (Figure 4 and Figures S1–S4).
(2) Internal Element Feature Data Processing
1. Extraction of Principal Components Representing Element Feature Structures
When analyzing the area proportion data of different element features, collinearity diagnosis by SPSS 27 detected multicollinearity among several element features. Such high collinearity not only disrupts subsequent modeling but also conceals potential structural relationships among the element features. To reduce the high collinearity among element features and to identify potential structural interactions, we applied principal component analysis (PCA) for dimensionality reduction, enabling further interpretation of the composite structures underlying multiple element features.
With SPSS 27 software, the Varimax rotation method was applied to improve the interpretability of the principal components. Although the Kaiser–Meyer–Olkin (KMO) test value was relatively low (KMO = 0.234), Bartlett’s test of sphericity was significant (χ2 = 6545.145, p < 0.00), and the extracted communalities of all variables were very high, indicating that the principal components can sufficiently explain the original variables, thus PCA remains statistically justified [50,51,52]. To fully retain original variable information and support subsequent interaction analysis, we chose to extract 11 principal components (PCs) of feature elements, which cumulatively explained 95.95% of the total variance (Table 5). Each principal component represents a combination of highly loaded element features with structural interactions, reflecting various types of element feature structures in park spaces. This approach not only reduced dimensionality while retaining fundamental element feature information but also offered a theoretical and methodological basis for further investigation into how these structures influence park vitality.
2. Screening Interaction Terms of Element Feature Structures
Eleven extracted principal components (Table 5) theoretically produce 55 pairwise interaction term combinations. To ensure the statistical robustness of interaction term selection, we implemented the following screening procedure: 1. Initially construct all second-order interaction terms; 2. Conduct regressions of all interaction terms individually with park daily average heat values (each incorporated as a single predictor in the baseline linear model) to assess statistical significance; 3. Exclude interaction terms that are insignificant or have unstable significance; 4. Finally, a subset of interaction terms with stable significant effects (Table 6) was selected and incorporated into the principal component interaction effect model for further analysis. This screening procedure guarantees scientific rigor in variable selection for model analysis and aids in clearly identifying the presence of functional synergy or coupling among different types of element feature structures. Although the PC6 × PC11 interaction term did not present a significant impact on park vitality in the principal component interaction effect model, it had significant synergistic effects on other interaction terms and contributed strong model stability; thus, we retained this interaction term.
3. Summarizing Principal Component Scores and Interaction Terms
Following dimensionality reduction in element features using principal component analysis (PCA), we derived data related to 11 principal components representing element feature structures, among which the principal component scores and the screened interaction terms serve as independent variables (Table 7) for subsequent modeling analysis.
(3) External Environmental Feature Data Processing
1. Selection of External Features
However, various features associated with a park’s external environment do not necessarily influence park vitality. We conducted significance testing for each relevant external feature against park vitality. Ultimately, we retained features that significantly influenced park vitality: service capacity ( R j ), accessibility ( A j ), and per capita disposable income.
2. Calculation of External Environmental Features
The values for the three external environmental features—service capacity, accessibility, and per capita disposable income—were derived through social statistical data and an improved Two-step floating catchment area method [53,54]. Since the units of the data varied, Z-score standardization was performed using SPSS 27 (Table 8), and the normalized indicators were used as covariates in the follow-up model analysis.

2.2.4. Variable Specification

(1) Dependent Variable
The daily average heat value serves as an indicator of how intensively and frequently parks are used throughout the day. Accordingly, we define the daily average heat value of parks as the dependent variable in this study (Figure 4 and Figures S1–S4).
(2) Independent Variables
The principal component analysis (PCA) extracted not only the structural principal components of park element features but also generated principal component scores and filtered interaction terms, which serve as independent variables in the model (Table 7).
(3) Covariates
The external condition features obtained after selection and calculation—Z- per capita disposable income, Z-service capacity ( R j ), and Z-accessibility ( A j )—served as covariates in the analysis (Table 8).

2.2.5. Model Development and Effect Evaluation

This study uses Linear Mixed-effects Models (LMM) as the main modeling approach to uncover the interaction and synergy effects of park features on park vitality. The method accommodates nested data with repeated observations, effectively managing both fixed and random effects, which aids in discerning the independent, interaction, and synergistic effects of hierarchical variables on the outcome variable. Given the hierarchical nature and repeated observations of the data, all models designate Park ID as the subject and Day as the repeated measure. The random intercept for Park ID controls for unobserved park heterogeneity. The covariance structure is set to compound symmetry, and parameter estimation is conducted via maximum likelihood (ML). Although the “city” level may exert certain influences on park vitality, we believe these effects have been adequately captured through external condition features (such as vehicular accessibility, per capita disposable income, park service capacity, and other covariates). Therefore, we did not separately incorporate “city” as a fixed or random effect in the model. This design approach simplifies model complexity while ensuring the capture of inter-park differences and effectively controlling for potential influences of urban context on park vitality.
(1) Build the principal component main effect model to examine the direct influence of the interactive structures among different element features on park vitality. The model setup is as follows:
Y i j = β 0 + k = 1 11   β k P C k , i j + u j + ε i j
where Y i j : denotes the daily average heat value for park j on day i, which is the dependent variable; P C k , i j : refers to the k-th principal component of the element feature structure, i.e., the independent variable; β k are the fixed effect coefficients for each principal component; u j is the random intercept (Park ID); ε i j : represents the error term.
(2) Build the principal component interaction effects model to examine how interactions among element feature structures affect park vitality.
Building on the main effect model, we incorporate selected principal component interaction terms to investigate interaction effects between various element feature structures on park vitality. Model specification:
Y i j = β 0 + k = 1 11   β k P C k , i j + a < b   θ a b P C a , i j × P C b , i j + u j + ε i j
where P C a , i j × P C b , i j : denotes the interaction between the a-th and b-th principal components, which are included as predictors in the model; θ a b is the fixed effect coefficient for the interaction term. All other parameter settings remain the same as in the main effects model.
(3) Building a synergistic effects model to examine how external environmental features collaboratively influence park vitality. On top of the main effects model, the calculated external environmental features are incorporated as follows:
Y i j = β 0 + k = 1 11   β k P C k , i j + m = 1 3   γ m Z m , i j + u j + ε i j
where Z m , i j is the m-th external environmental feature serving as a covariate; γ m is the fixed effect coefficient associated with this external environmental feature. The remaining parameters are the same as in the main effects model.

3. Results

3.1. Influence of Interactive Structures of Element Feature on Park Vitality

Using Park ID as the subject and Day as the repeated measure, with compound symmetry covariance structure, and taking the park’s daily average heat values as the dependent variable, the principal component scores of element feature structures as independent variables, this study constructed a principal component main effect model with maximum likelihood (ML) estimation to analyze the influence of interactive element feature structures on park vitality. The results are as follows:
(1) There is structural interaction in how element features affect park vitality.
As shown in Table 9, the 18 internal element features are not spatially isolated but clustered into several “interactive structures” of principal components due to multicollinearity. This pattern is evident in PC1, PC2, PC3, PC4, PC5, PC7, and PC9. Such interactive structures can be regarded as latent spatial landscape units formed by mutually dependent internal element features working in tandem, revealing their structural interaction.
(2) Certain interactive structures of element features exhibit a significant positive effect on park vitality.
PC2 and PC4 (Table 9) demonstrate significantly positive influences on park vitality. With a β coefficient of 58.12 (p < 0.00), PC2 reflects that the interactive structure composed of medium plazas—known for their high aggregation capacity—and small plazas—offering greater privacy and independence—plays a significant role in attracting crowds and fostering activity, likely serving as the spatial core of frequently used areas in parks. Likewise, PC4 (β = 47.66, p < 0.00) suggests that the interactive structure formed by highly aggregative open grassland and primary park roads, which serve a traffic-routing function, also contributes positively to park vitality.
(3) Certain interactive structures of element features exert a negative impact on park vitality.
PC3 demonstrates a marginally significant negative association (Table 9), indicating that the interactive structure formed by aquatic plant coverage areas, lake, and dense woodlands—characterized by ecological enclosure—may limit public use due to poor accessibility or narrow user scope, thus diminishing park vitality. This suggests that when ecologically focused element features are not synergized with transit- or interaction-oriented features, they may not only fall short of activating user engagement but also hinder overall park vitality.
(4) Single-structured element features tend to have insignificant effects on park vitality.
Although the playground (PC11), representing a single-structured element feature, shows some influence on user activity at specific times, its correlation with park vitality remains weak (Table 9). In general, element features with a single structural form (e.g., PC6, PC8, PC10) showed no statistically significant impact on park vitality in the model outputs. This suggests that isolated, single-structure element features may have limited vitality impact and likely require integration into broader interactive structures to exert a consistent effect on park vitality.

3.2. Influence of Element Feature Structures and Their Interactions on Park Vitality

Building on the main effects model of principal components, we incorporated the selected interaction terms to develop an interaction effects model, which further analyzes how element feature structures interact to influence park vitality. The findings are as follows:
(1) Adding interaction terms significantly changes the influence of element feature structures on park vitality.
First, with the inclusion of interaction terms between element feature structure components, more types of interactive structures showed significant effects on park vitality. As shown in the model results (Table 10), beyond PC2 and PC4, PC5 and PC7 also demonstrated statistically significant impacts on park vitality. As shown in the model results (Table 10), beyond PC2 and PC4, PC5 and PC7 also demonstrated statistically significant impacts on park vitality. Furthermore, the β values suggest that these four interaction structures exert a stronger impact on park vitality than in the main effects model. For instance, PC5 was non-significant in the main effects model (p = 0.47, Table 9), yet showed a strong positive correlation in the interaction effects model (β = 165.31, p < 0.00, Table 10).
These results suggest that both interactive and single structures exhibit enhanced effects on park vitality to different extents once interaction terms are introduced, with some reaching statistical significance. This indicates that element feature structures interact dynamically rather than remaining static and independent, jointly contributing to park vitality. As the interactions among element feature structures intensify (via interaction terms), these effects can spill over, markedly boosting the impact of both interactive and single structures on park vitality. This could be a key mechanism in fostering high-vitality parks.
(2) Interaction terms have a more pronounced influence on park vitality
On the one hand, most interaction terms demonstrated significant impacts on park vitality. According to the results, all six interaction terms added—except for “PC6 × PC11”—showed significant associations with park vitality (Table 10). On the other hand, the overall effect of the interaction terms (β ranging from 44.59 to 151.27) surpassed that of both single structures and interactive structures. This indicates that deeper interaction leads to stronger interaction effects and greater diversity and integration of park landscape features. Enhancing the park’s-built environment appeal to visitors, with mixed and diverse landscape elements better catering to visitors’ recreational and leisure needs, thereby encouraging more public activity and enhancing park vitality. This provides empirical support, within the setting of urban parks rather than streets, for Jacobs’ statement that vitality originates from adequate diversity and mix.

3.3. Synergistic Effects of External Environmental Features on Park Vitality

Based on the principal component main effect model, the computed external environmental features were added as covariates to build a synergistic model, in order to explore their synergistic influence on park vitality. The results are as follows:
(1) There is a synergistic effect between external environmental features and internal element features on the influence of park vitality.
On the one hand, after including external environmental features as covariates, PC1, PC2, and PC6—three internal element feature structures—exhibited significant effects on park vitality (Table 11). Furthermore, PC9 demonstrated marginal significance. On the other hand, aside from service capacity, which was weakly significant, the two major external environmental features—accessibility and per capita disposable income—had p-values below 0.00 and β values of 180.02 and 58.66, respectively, indicating strong and significant positive effects on park vitality. The above results suggest that external environmental features and internal element features are not mutually independent but interact synergistically to influence park crowd activity, reflecting a form of coordination mechanism. The influence of external environmental varies across different tiers of cities: in first-tier cities with developed transportation systems, accessibility plays a more prominent role in crowd aggregation effects, while in low-income areas, the moderating effect of per capita disposable income is relatively limited.
(2) External environmental features and internal element features work synergistically to significantly boost park vitality.
In the results of the principal component main effects model, internal element feature structures were the only variables, and only a limited number showed significant influence on park vitality (Table 9). However, after introducing external environmental features for coordination, more internal element feature structures showed effects on vitality, and their significance levels were enhanced. For instance, in the principal component main effects model, PC1 had β = 11.31 and p = 0.45 (Table 9), while in the synergistic model with external environmental features, PC1 increased to β = 42.94 and p < 0.00 (Table 11); PC6 displayed a similar pattern. Moreover, the β coefficient of PC2 rose from 58.12 (Table 9) to 100.42 (Table 11), and PC9 moved from non-significance to marginal significance. This indicates that the synergy between internal element features and external socio-economic conditions amplifies both the appeal and frequency of park use, leading to an increase in park vitality. External environment can, to some extent, stimulate or amplify the potential effects of internal elements, thereby enabling different types of parks to exhibit higher vitality levels in similar urban environments.
(3) There is a negative synergy effect between external environmental features and internal element features.
It is noteworthy that the external environmental feature of service capacity is negatively associated with park vitality (Table 11). Additionally, the synergistic effect with external environmental features intensifies the negative influence of PC9 (Table 11). This phenomenon can be interpreted as a form of “reverse synergistic effect.”
Put differently, when park supply in a region approaches saturation, additional service capacity may lead to resource dispersion and intensified competition, thereby weakening the vitality of individual parks within the local scope.

4. Discussion

4.1. Research Innovations

(1) This study employs an empirical approach that innovatively measures how the complexity of element feature structures affects park vitality.
Prior research on park vitality primarily focused on univariate or linear additive effects, neglecting the spatial structural combinational logic among element features [5,21,22,23]. To address this, our study employed factor analysis to aggregate highly correlated element features into principal components, creating “interactive structures” with latent coupling traits at the spatial structure level, initially testing their impact on park vitality. Building on this, principal component interaction terms were introduced to further intensify the interactions among element features, determining whether the resulting interaction effects amplify or diminish their impact on park vitality. This empirical approach, featuring both structural and dynamic characteristics, breaks through the limitations of conventional explicit interaction analysis, innovatively quantifying the complex systemic effects of element feature structures on human activities and uncovering the intricate coupling mechanisms underlying these features.
(2) Empirically validating Jacobs’ “diversity” theory of vitality within urban parks
Jacobs (1961)’s theory of “diversity” as a source of vitality has been widely confirmed in urban street contexts [17,18,19,20]; however, it has not been empirically tested within urban parks. Through building linear mixed models incorporating interaction terms of element feature structures, this study found that diversity and mixing of element features significantly boost park vitality. Notably, the amplification effects exhibited by multiple interaction terms demonstrate that complex landscape configurations in park spaces more effectively stimulate human activities, empirically corroborating Jacobs’ assertion that “adequate diversity and mixture foster spatial vitality” in urban park settings. This extends the applicability of Jacobs’ vitality theory across diverse urban spatial types and addresses contemporary research needs linking green space diversity design to human behavioral patterns.

4.2. Research Contributions

(1) Applicability of the research results
The data for this study were drawn from cities of differing development levels in South China, encompassing first-tier core cities as well as other medium-development cities, making the findings highly transferable to urban park design and management in cities similar issues in population composition, urbanization, and shortage of public spaces. Furthermore, given the universality of urbanization pressures and the increasing demand for accessible green spaces, the proposed methodology holds potential for application in other Chinese cities and even adaptation to international contexts, where similar challenges of population density and spatial planning are encountered.
(2) Advancing the application of classical urban vitality theories in urban green open spaces
Classical urban vitality theories, such as those by Jacobs, have primarily concentrated on urban street environments, with insufficient investigation into their relevance for green open spaces. Focusing on urban comprehensive parks, this research empirically validates that the diversity and mixture of element feature structures amplify human vitality, reinforcing Jacobs’ central hypothesis that diversity fuels vitality. This offers empirical evidence supporting the application of classical urban vitality theory in green spaces, challenges the traditional notion that vitality exists solely in urban street contexts, and promotes extending these theories to a broader variety of spatial environments.
(3) Launching quantitative studies on urban park vitality
This study establishes an analytical framework encompassing structural interaction identification and synergistic mechanism modeling, providing quantifiable, replicable, and scalable data support and modeling pathways for empirically investigating the mechanisms influencing park vitality. This approach addresses the need for digital and refined spatial management in cities, offering valuable insights for park research and practice in other cities with similar contexts.

4.3. Research Results and Suggestions

(1) Interaction effects indicate that design should pay attention not just to the completeness of configurations but also to the rationality of their combination logic.
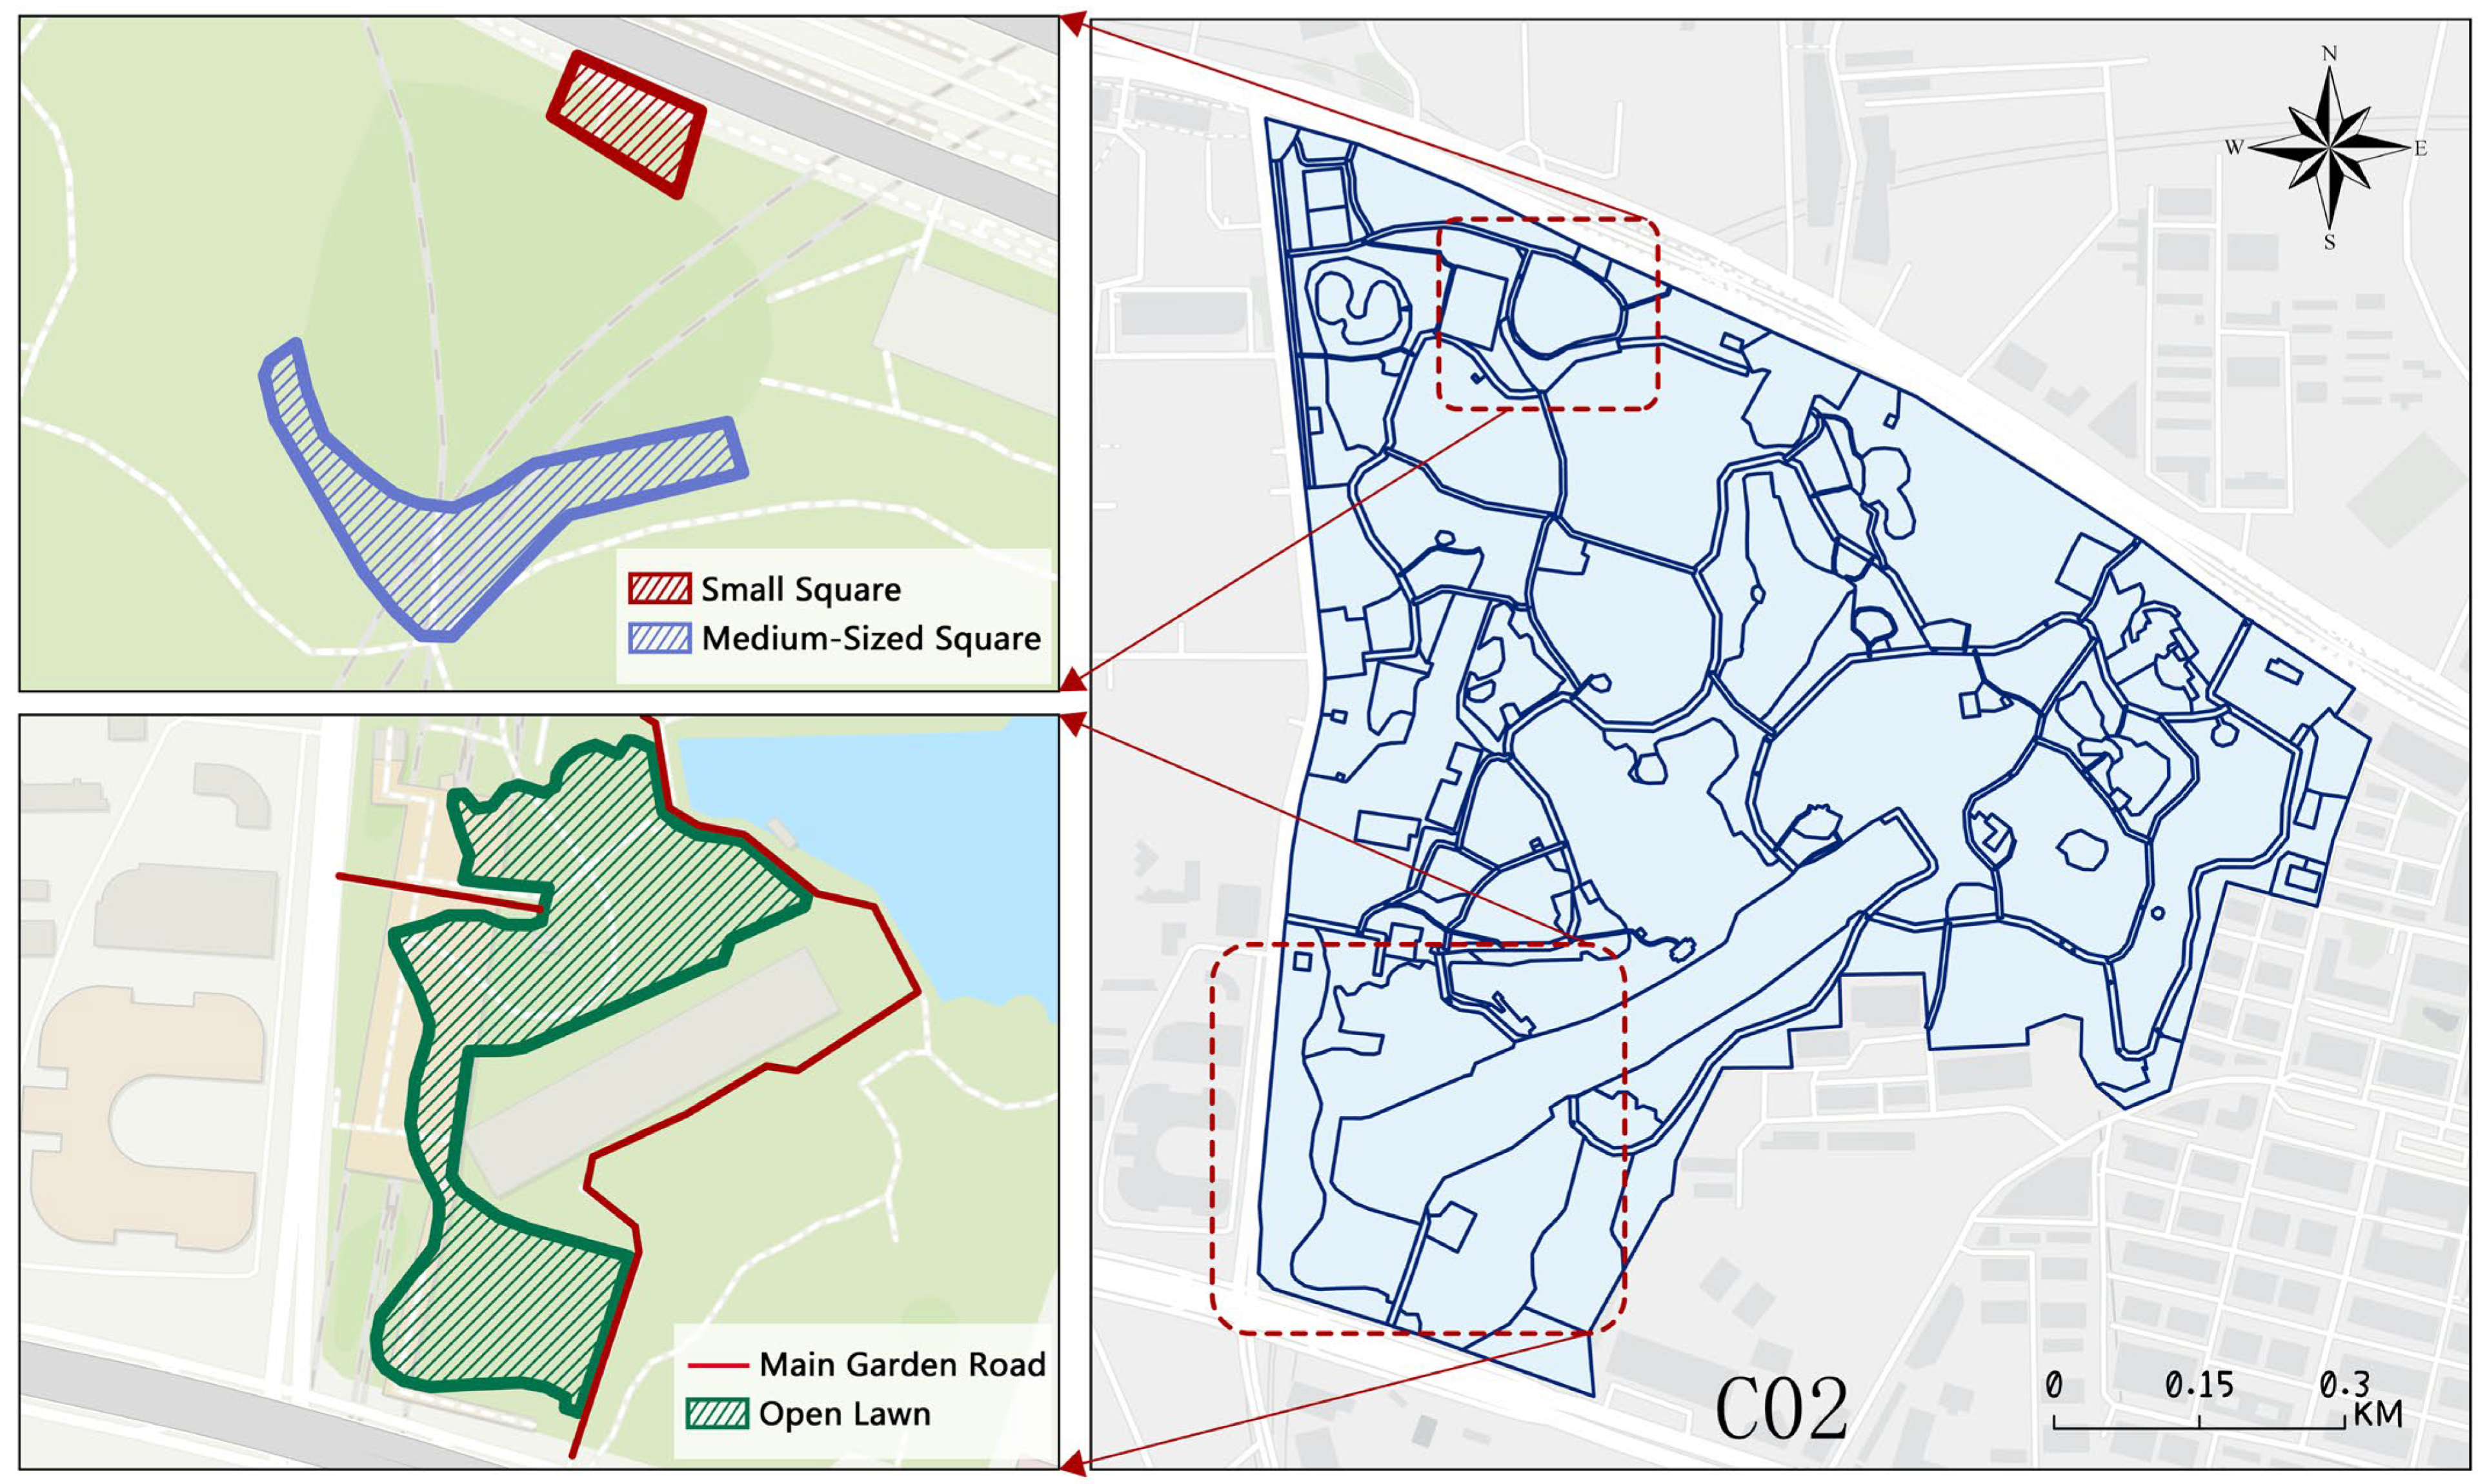
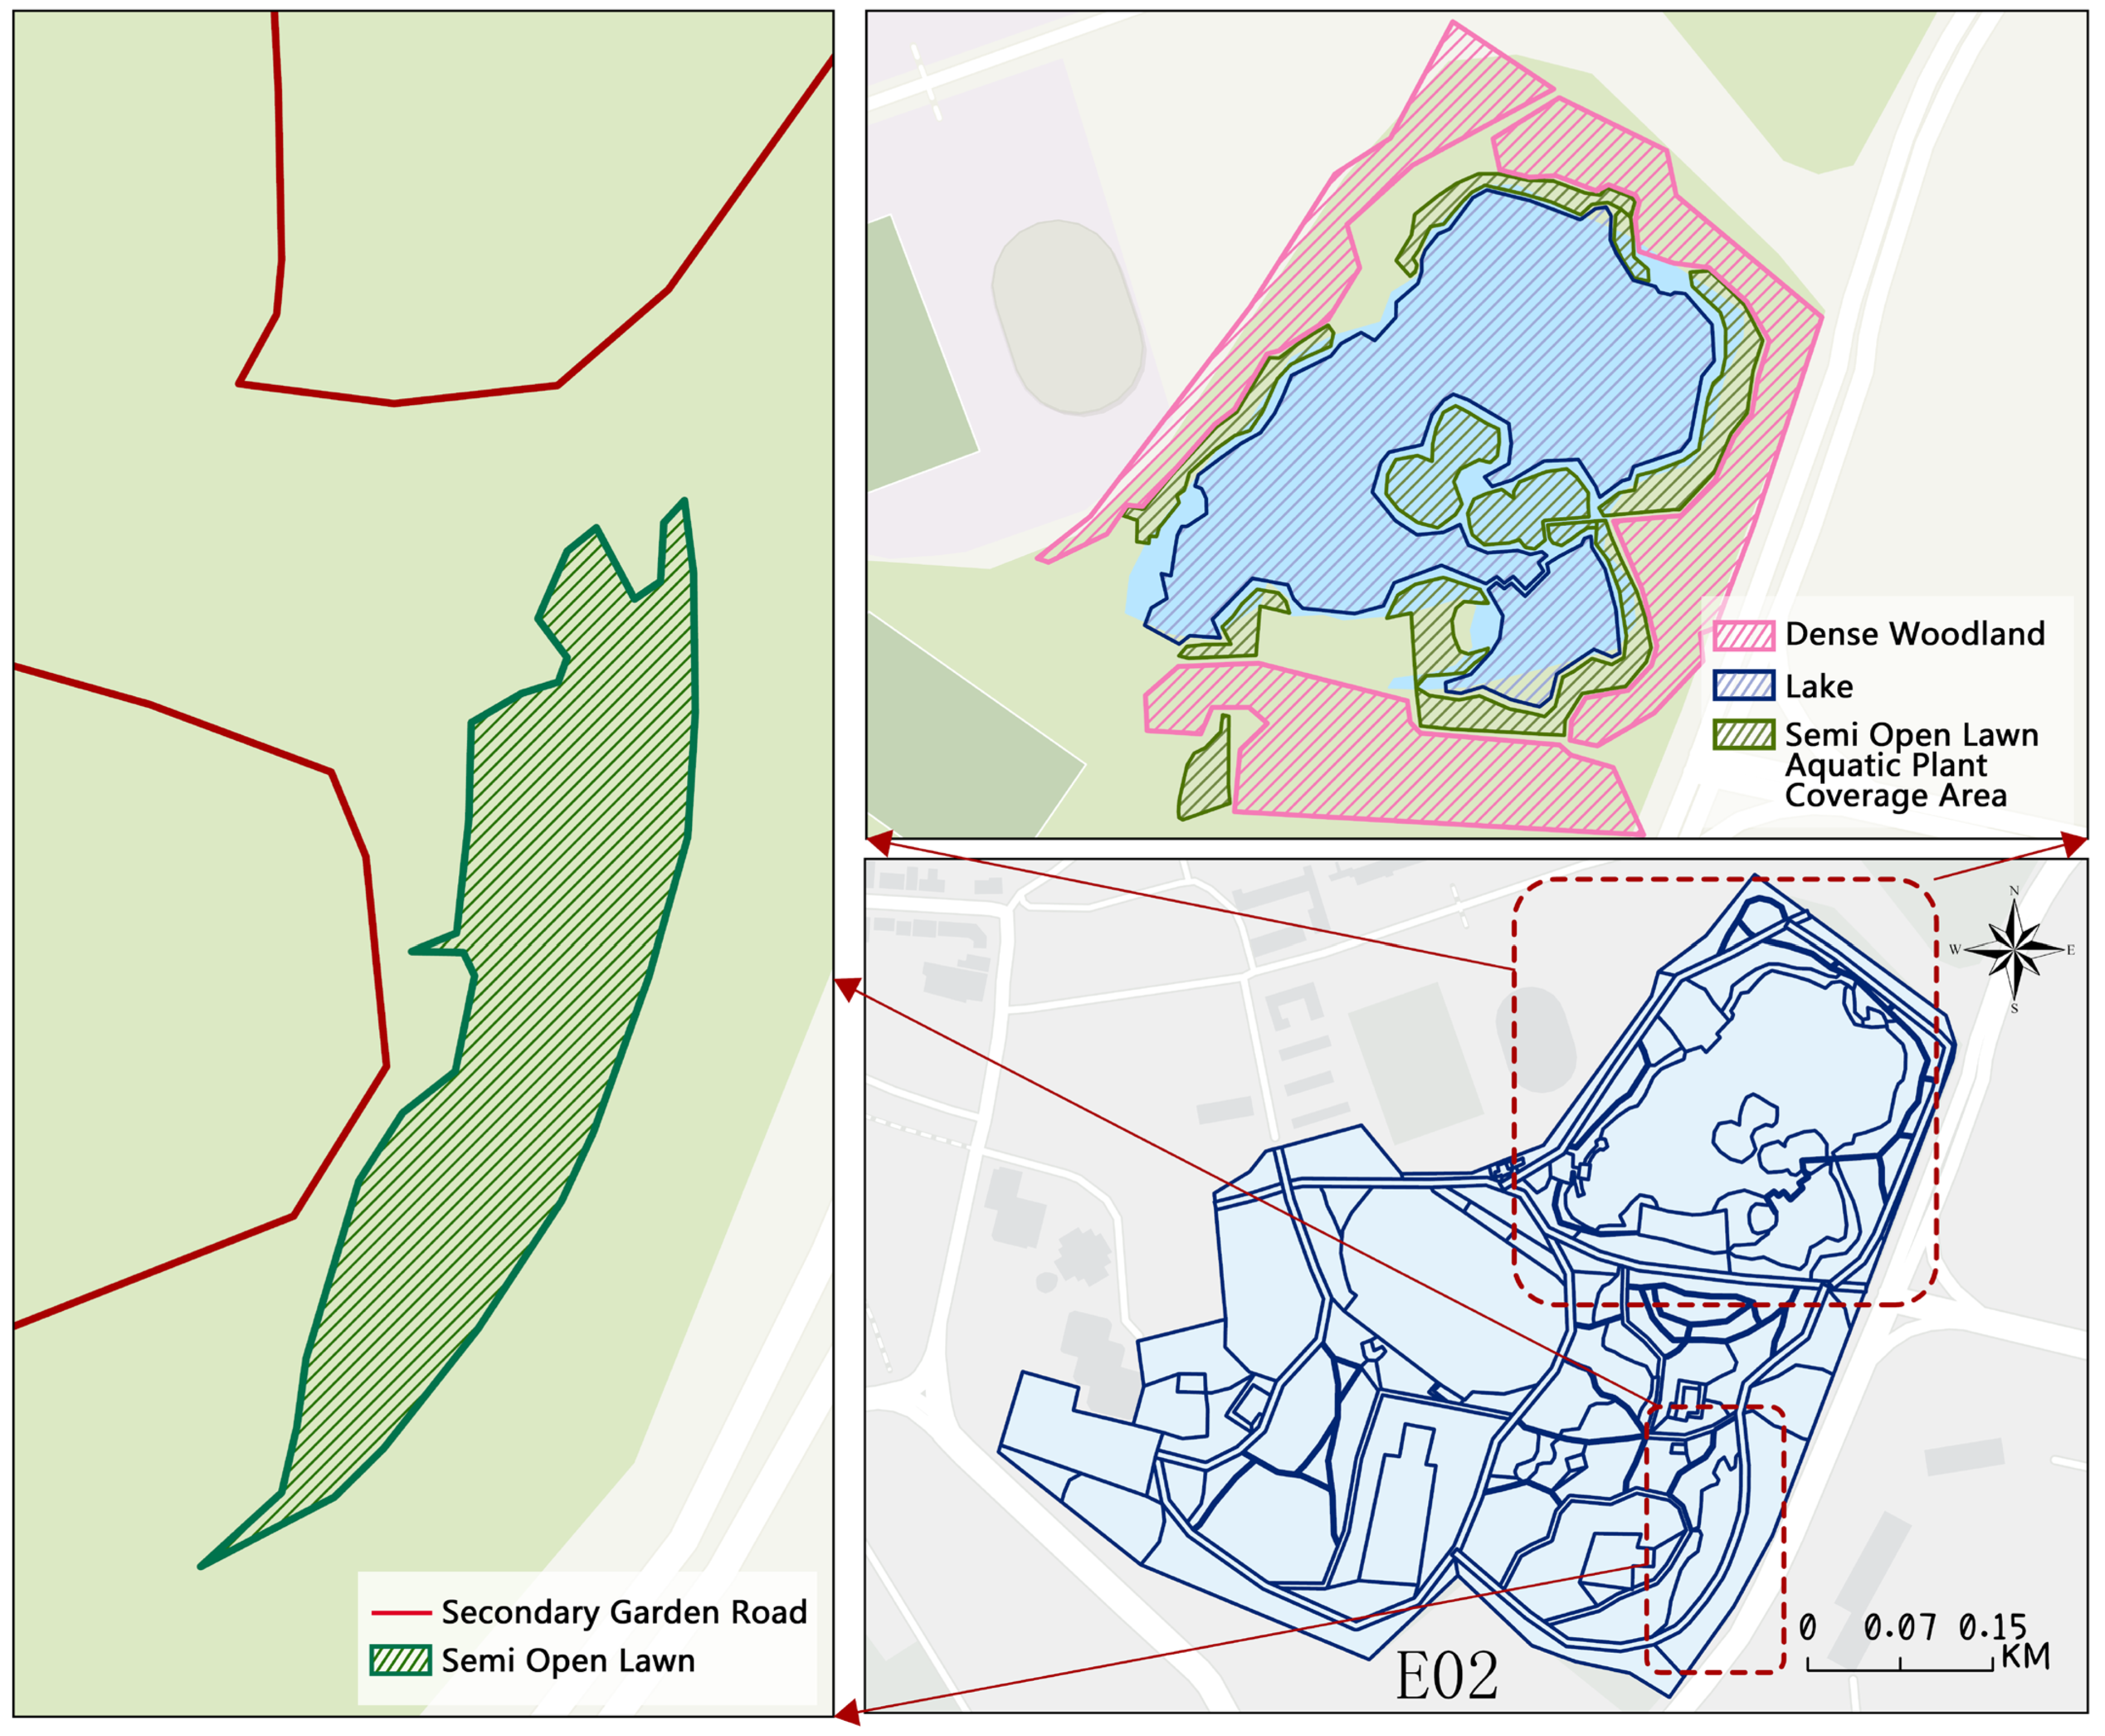
The research revealed that the interaction between “PC2 (medium plaza + small plaza) and PC4 (open grassland + primary park road)” (Figure 5), which represents aggregation and social functions, demonstrated a significant positive effect in the statistical model (Table 10) (β = 151.27, p < 0.00). This interaction term enhances crowd activity density and promotes the formation of high-use zones in parks. However, the implementation of this interaction effect depends on strong functional complementarity and spatial connectivity between element features, referred to as collinearity (VIF) in statistical analysis. For instance, the efficient connection between medium plazas and primary park roads enhances spatial usage efficiency; in contrast, if there is functional or physical separation between element features, even if each is attractive, interaction effects are hard to achieve, such as PC3 (aquatic plant coverage area + lake + dense woodland) × PC5 (secondary park road + semi-open grassland) (Figure 6).
This indicates that when planning urban parks and green open spaces, designers should prioritize diverse and deep combinations of element features with potential interactions, rather than merely stacking different facility types. Design should not only emphasize “complete configuration” but also focus on “rational combinations, smooth circulation, and complementary functions” to strengthen the overall spatial vitality generation capacity.
(2) The amplifying effect of interaction terms on vitality indicates the need for a systematic mindset in configuring element features.
PC5, PC6 and other principal components, initially insignificant in the main effect model, became strongly influential after the inclusion of interaction terms (Table 10). This implies that the effect of element features on vitality is conditional: single features alone are unlikely to activate vitality, but combinations can yield stable activating effects. This further supports Jacobs’ argument that “diversity gives rise to vitality.” Accordingly, in urban park planning and management, both designers and public authorities should avoid an “isolated configuration” approach—e.g., constructing a single facility like a playground or pond without considering potential spatial combinations. It is suggested that the design phase adopt an “interaction testing” principle to simulate and assess combinations of common facilities—based on frequency of use, types of users, and circulation patterns—in order to determine more effective configurations.
(3) External condition features may either promote or inhibit park vitality.
Analysis of external environmental features as covariates reveals a significant positive correlation between accessibility, disposable income, and park vitality, showing a synergistic effect (Table 11). This suggests that similar internal element features may result in different levels of vitality across parks depending on their external social and economic conditions. This is exemplified by Liuhua Lake Park (C01) and People’s Park (G02). Conversely, our findings reveal a negative correlation between the external environmental feature “service capacity” and park vitality (Table 11). This may imply that when service capacity is too high or spatial structure becomes overly dense and complex, excessive crowding may occur, diminishing user experience and ultimately reducing vitality—a phenomenon described as a “reverse synergy effect”. Accordingly, we may conclude that park vitality arises from both the internal layout of element features and the regulating influence of external conditions. Parks situated in densely populated areas should be cautious of overloading the space with excessive features, which may surpass it carrying capacity. In low-density areas, enhancing the park’s appeal to high-income groups or potential visitors becomes a key consideration. Therefore, during park design and management, it is advisable to implement an “internal-external integration” evaluation framework that systematically incorporates location, accessibility, surrounding demographics, and facility layout.
(4) While the model results show potential for application, they must be adapted flexibly to local contexts
Although this study empirically demonstrates the interactive and synergistic effects of park features on vitality using data from several urban parks, variations in cultural preferences, behavioral patterns, and policy contexts across cities may cause differences in the manifestation of these effects. Thus, this study’s conclusions are best suited for typical urban parks characterized by medium to high development density, convenient access, and active user demand. Practitioners, including designers and government officials, should not mechanically replicate the “high-β combinations” suggested by this study, but should adapt the configuration of element features dynamically, taking into account field research, local community demands, and user feedback. Such an approach enables vitality-driven and context-sensitive park planning and governance.

4.4. Limitations and Future Prospects

Although the study systematically investigates the impact of park features on vitality from both internal element features and external environmental features, some limitations remain.
(1) The study has yet to include “internal × external” interaction terms.
While this study examined the structural interactions among internal element features and the synergistic effects of external environmental features, it did not incorporate cross-dimensional “internal × external” interaction effects into the modeling framework. This remains a limitation, which future research may address by introducing such interaction terms to deepen the analysis.
(2) The temporal relevance and broad applicability of the results require enhancement.
Although data were collected over one year, covering working and rest days across seasons for representativeness, key holidays or unforeseen events (such as Christmas or the COVID-19 pandemic) were not reflected. Future research aims to implement long-term data monitoring to improve the temporal validity and wider applicability of the findings.
(3) Future research should integrate “soft” and “hard” features.
Currently, element feature variables focus primarily on parks’ physical structural attributes, facilitating quantitative analysis but insufficiently capturing residents’ subjective perceptions and actual activity patterns—i.e., “soft features.” Integrating surveys, mobility data, or social media perception tags in future studies could provide multidimensional insights, enabling more comprehensive models of interaction and synergy effects.

5. Conclusions

Based on Jacobs’ urban vitality theory, the study area is South China, with data collected from 20 urban comprehensive parks in 8 representative cities. Using linear mixed-effects models—including a principal component main-effect model, an interaction-effect model, and a synergy-effect model—this research empirically examined how internal and external features influence park vitality through interaction and synergy effects, with implications for sustainable urban development. Findings include: (1) The impact of element features on park vitality involves structural interaction. Certain interactive structures positively influence vitality, while others may have adverse effects. Features with a single structure tend not to exhibit significant effects. (2) Adding interaction terms effectively changes the significance of feature structures’ impact on park vitality, with interaction effects generally being more pronounced. (3) Internal and external features interact synergistically to improve park vitality, though inverse synergy effects—where excessive external capacity reduces vitality—may also occur. This study contributes to guiding sustainable urban park design, planning, and management, offering insights for cities with similar socioeconomic and spatial contexts. Beyond the study region, the methodological framework—combining multi-source data, principal component analysis, and linear mixed-effects modeling—can be transferred to other Chinese cities with diverse development stages. Moreover, given that challenges such as high population density, spatial heterogeneity, and the demand for multifunctional green spaces are globally shared, the approach also holds potential for adaptation in international contexts. This highlights the broader applicability of our findings and offers a replicable pathway for advancing research and practice in sustainable park vitality worldwide.

Supplementary Materials

The following supporting information can be downloaded at: https://www.mdpi.com/article/10.3390/su17188335/s1, Figure S1. Daily average heat value in spring; Figure S2. Daily average heat value in summer; Figure S3. Daily average heat value in autumn; Figure S4. Daily average heat value in winter.

Author Contributions

Conceptualization, J.Z.; methodology, J.Z.; software, J.Z., K.A., S.L., J.L., N.K., Y.K., J.C. and J.W.; validation, J.Z.; formal analysis, J.Z.; investigation, J.Z.; resources, J.Z.; data curation, J.Z.; writing—original draft preparation, J.Z.; writing—review and editing, S.L.; visualization, J.Z. and K.A.; supervision, S.L.; project administration, S.L.; funding acquisition, J.Z. and S.L. All authors have read and agreed to the published version of the manuscript.

Funding

This research was funded by the National Natural Science Foundation of China, grant number “52268011”.

Institutional Review Board Statement

Not applicable.

Informed Consent Statement

Not applicable.

Data Availability Statement

The authors have not obtained permission to publish the data. Therefore, the data can be obtained from the corresponding author upon reasonable request.

Acknowledgments

We appreciate the support provided by Hainan University.

Conflicts of Interest

The authors declare no conflicts of interest. The funders had no role in the design of the study; in the collection, analyses, or interpretation of data; in the writing of the manuscript; or in the decision to publish the results.

References

  1. Wei, D.; Wang, Y.; Liu, M.; Lu, Y. User-Generated Content May Increase Urban Park Use: Evidence from Multisource Social Media Data. Environ. Plan. B Urban Anal. City Sci. 2023, 51, 971–986. [Google Scholar] [CrossRef]
  2. Yang, L.; Wu, Q.; Lyu, J. Which Affects Park Satisfaction More, Environmental Features or Spatial Pattern? Landsc. Ecol. 2025, 40, 60. [Google Scholar] [CrossRef]
  3. Hu, J.; Wu, J.; Sun, Y.; Zhao, X.; Hu, G. Spatiotemporal Influence of Urban Park Landscape Features on Visitor Behavior. Sustainability 2023, 15, 5248. [Google Scholar] [CrossRef]
  4. Ayala-Azcárraga, C.; Diaz, D.; Zambrano, L. Characteristics of Urban Parks and Their Relation to User Well-Being. Landsc. Urban Plan. 2019, 189, 27–35. [Google Scholar] [CrossRef]
  5. Zhu, J.; Lu, H.; Zheng, T.; Rong, Y.; Wang, C.; Zhang, W.; Yan, Y.; Tang, L. Vitality of Urban Parks and Its Influencing Factors from the Perspective of Recreational Service Supply, Demand, and Spatial Links. Int. J. Environ. Res. Public Health 2020, 17, 1615. [Google Scholar] [CrossRef]
  6. Zhang, J.; Hu, X.; Wang, J. Spatial Vitality Variation in Community Parks and Their Influencing Factors. PLoS ONE 2025, 20, e0312941. [Google Scholar] [CrossRef]
  7. Li, F.; Yao, N.; Liu, D.; Liu, W.; Sun, Y.; Cheng, W.; Li, X.; Wang, X.; Zhao, Y. Explore the Recreational Service of Large Urban Parks and Its Influential Factors in City Clusters—Experiments from 11 Cities in the Beijing-Tianjin-Hebei Region. J. Clean. Prod. 2021, 314, 128261. [Google Scholar] [CrossRef]
  8. Chen, D.; Long, X.; Li, Z.; Liao, C.; Xie, C.; Che, S. Exploring the Determinants of Urban Green Space Utilization Based on Microblog Check-In Data in Shanghai, China. Forests 2021, 12, 1783. [Google Scholar] [CrossRef]
  9. Hamstead, Z.A.; Fisher, D.; Ilieva, R.T.; Wood, S.A.; McPhearson, T.; Kremer, P. Geolocated Social Media as a Rapid Indicator of Park Visitation and Equitable Park Access. Environ. Urban Syst. 2018, 72, 38–50. [Google Scholar] [CrossRef]
  10. Kabisch, N.; Haase, D. Green Justice or Just Green? Provision of Urban Green Spaces in Berlin, Germany. Landsc. Urban Plan. 2014, 122, 129–139. [Google Scholar] [CrossRef]
  11. Fan, P.; Xu, L.; Yue, W.; Chen, J. Accessibility of Public Urban Green Space in an Urban Periphery: The Case of Shanghai. Landsc. Urban Plan. 2017, 165, 177–192. [Google Scholar] [CrossRef]
  12. Zeng, L.; Liu, C.; Wang, M.; Zhou, C.; Xie, G.; Wu, B. Delineating the Dichotomy and Synergistic Dynamics of Environmental Determinants on Temporally Responsive Park Vitality. Sustainability 2023, 15, 12907. [Google Scholar] [CrossRef]
  13. Chen, S.; Sleipness, O.; Christensen, K.; Yang, B.; Park, K.; Knowles, R.; Yang, Z.; Wang, H. Exploring Associations between Social Interaction and Urban Park Attributes: Design Guideline for Both Overall and Separate Park Quality Enhancement. Cities 2024, 145, 104714. [Google Scholar] [CrossRef]
  14. Jacobs, J. The Death and Life of Great American Cities; Random House: New York, NY, USA, 1961. [Google Scholar]
  15. Montgomery, J. Making a City: Urbanity, Vitality and Urban Design. J. Urban Des. 1998, 3, 93–116. [Google Scholar] [CrossRef]
  16. Carmona, M.; Tiesdell, S.; Heath, T.; Oc, T. Public Places, Urban Spaces: The Dimensions of Urban Design, 2nd ed.; Architectural Press: Oxford, UK, 2010. [Google Scholar]
  17. Delclòs-Alió, X.; Miralles-Guasch, C. Looking at Barcelona through Jane Jacobs’s Eyes: Mapping the Basic Conditions for Urban Vitality in a Mediterranean Conurbation. Land Use Policy 2018, 75, 505–517. [Google Scholar] [CrossRef]
  18. Gómez-Varo, I.; Delclòs-Alió, X.; Miralles-Guasch, C. Jane Jacobs Reloaded: A Contemporary Operationalization of Urban Vitality in a District in Barcelona. Cities 2022, 123, 103565. [Google Scholar] [CrossRef]
  19. Paköz, M.Z.; Yaratgan, D.; Şahin, A. Re-Mapping Urban Vitality through Jane Jacobs’ Criteria: The Case of Kayseri, Turkey. Land Use Policy 2022, 114, 105985. [Google Scholar] [CrossRef]
  20. Sung, H.; Lee, S.; Cheon, S. Operationalizing Jane Jacobs’s Urban Design Theory: Empirical Verification from the Great City of Seoul, Korea. J. Plan. Educ. Res. 2015, 35, 117–130. [Google Scholar] [CrossRef]
  21. Bi, X.; Gan, X.; Jiang, Z.; Li, Z.; Li, J. How Do Landscape Patterns in Urban Parks Affect Multiple Cultural Ecosystem Services Perceived by Residents? Sci. Total Environ. 2024, 946, 174255. [Google Scholar] [CrossRef]
  22. Yang, W.; Li, Y.; Liu, Y.; Fan, P.; Yue, W. Environmental Factors for Outdoor Jogging in Beijing: Insights from Using Explainable Spatial Machine Learning and Massive Trajectory Data. Landsc. Urban Plan. 2024, 243, 104969. [Google Scholar] [CrossRef]
  23. Wu, G.; Yang, D.; Niu, X.; Mi, Z. The Impact of Park Green Space Areas on Urban Vitality: A Case Study of 35 Large and Medium-Sized Cities in China. Land 2024, 13, 1560. [Google Scholar] [CrossRef]
  24. Qin, L.; Zong, W.; Peng, K.; Zhang, R. Assessing Spatial Heterogeneity in Urban Park Vitality for a Sustainable Built Environment: A Case Study of Changsha. Land 2024, 13, 480. [Google Scholar] [CrossRef]
  25. Zhang, W.; Li, S.; Gao, Y.; Liu, W.; Jiao, Y.; Zeng, C.; Gao, L.; Wang, T. Travel Changes and Equitable Access to Urban Parks in the Post COVID-19 Pandemic Period. J. Environ. Manag. 2022, 304, 114217. [Google Scholar] [CrossRef]
  26. Zhang, W.; Su, Y. Perception Study of Urban Green Spaces in Singapore Urban Parks: Spatio-Temporal Evaluation and the Relationship with Land Cover. Urban For. Urban Green. 2024, 99, 128455. [Google Scholar] [CrossRef]
  27. Zhang, J.; Tan, P.Y. Assessment of Spatial Equity of Urban Park Distribution from the Perspective of Supply-Demand Interactions. Urban For. Urban Green. 2023, 80, 127827. [Google Scholar] [CrossRef]
  28. Tan, C.; Tang, Y.; Wu, X. Evaluation of the Equity of Urban Park Green Space Based on Population Data Spatialization: A Case Study of a Central Area of Wuhan, China. Sensors 2019, 19, 2929. [Google Scholar] [CrossRef]
  29. Qiu, J.; Zhou, W.; Li, W. Fitness Culture and Green Space Equity: Accessibility Evaluation of Shanghai Communities. Front. Environ. Sci. 2022, 10, 958649. [Google Scholar] [CrossRef]
  30. Terefe, A.E.; Hou, Y. Determinants Influencing the Accessibility and Use of Urban Green Spaces: A Review of Empirical Evidence. City Environ. Interact. 2024, 24, 100159. [Google Scholar] [CrossRef]
  31. Zhang, R.; Cao, L.; Wang, L.; Wang, L.; Wang, J.; Xu, N.; Luo, J. Assessing the Relationship between Urban Park Spatial Features and Physical Activity Levels in Residents: A Spatial Analysis Utilizing Drone Remote Sensing. Ecol. Indic. 2024, 166, 112520. [Google Scholar] [CrossRef]
  32. Rupprecht, C.D.D.; Byrne, J.A. Informal Urban Green-Space: Comparison of Quantity and Characteristics in Brisbane, Australia and Sapporo, Japan. PLoS ONE 2014, 9, e99784. [Google Scholar] [CrossRef]
  33. Madureira, H.; Nunes, F.; Oliveira, J.V.; Cormier, L.; Madureira, T. Urban Residents’ Beliefs Concerning Green Space Benefits in Four Cities in France and Portugal. Urban For. Urban Green. 2015, 14, 56–64. [Google Scholar] [CrossRef]
  34. Knobel, P.; Dadvand, P.; Alonso, L.; Costa, L.; Español, M.; Maneja, R.; Nieuwenhuijsen, M. Development of the Urban Green Space Quality Assessment Tool (RECITAL). Urban For. Urban Green. 2021, 57, 126895. [Google Scholar] [CrossRef]
  35. Heikinheimo, V.; Di Minin, E.; Tenkanen, H.; Hausmann, A.; Erkkonen, J.; Toivonen, T. User-Generated Geographic Information for Visitor Monitoring in a National Park: A Comparison of Social Media Data and Visitor Survey. ISPRS Int. J. Geo-Inf. 2017, 6, 85. [Google Scholar] [CrossRef]
  36. Guo, H.; Luo, Z.; Li, M.; Kong, S.; Jiang, H. A Literature Review of Big Data-Based Urban Park Research in Visitor Dimension. Land 2022, 11, 864. [Google Scholar] [CrossRef]
  37. Cui, T.; Ye, Y.; Zhuang, Y.; Lin, Q.; Yan, M.; Zhang, L.; Zhu, L.; Ricart, S. A Study of the Changing Characteristics and Influencing Factors of Holiday Visitor Vitality in Urban Parks: The Case of Fuzhou, China. PLoS ONE 2024, 19, e0311546. [Google Scholar] [CrossRef]
  38. Wang, T.; Li, Y.; Li, H.; Chen, S.; Li, H.; Zhang, Y. Research on the Vitality Evaluation of Parks and Squares in Medium-Sized Chinese Cities from the Perspective of Urban Functional Areas. Int. J. Environ. Res. Public Health 2022, 19, 15238. [Google Scholar] [CrossRef]
  39. Dong, Q.; Cai, J.; Chen, S.; He, P.; Chen, X. Spatiotemporal Analysis of Urban Green Spatial Vitality and the Corresponding Influencing Factors: A Case Study of Chengdu, China. Land 2022, 11, 1820. [Google Scholar] [CrossRef]
  40. Chen, J.; Liu, B.; Li, S.; Jiang, B.; Wang, X.; Lu, W.; Hu, Y.; Wen, T.; Feng, Y. Actual Supply-Demand of the Urban Green Space in a Populous and Highly Developed City: Evidence Based on Mobile Signal Data in Guangzhou. Ecol. Indic. 2024, 169, 112839. [Google Scholar] [CrossRef]
  41. Sun, T.; Lu, Y. China-ASEAN Economic and Trade Cooperation: An Investigation into the Current Situation of the New Western Land-Sea Corridor. Econ. Manag. Rev. 2024, 40, 19–30. [Google Scholar]
  42. Pan, W.; Wang, J.; Lu, Z.; Liu, Y.; Li, Y. High-Quality Development in China: Measurement System, Spatial Pattern, and Improvement Paths. Habitat Int. 2021, 118, 102458. [Google Scholar] [CrossRef]
  43. Hu, Y.; Dai, G. Economic Dynamics of China’s Three Major Regions under the Impact of Global Financial Risks: A Comparison of the Guangdong-Hong Kong-Macao Greater Bay Area, Jiangsu-Zhejiang-Shanghai Region and Beijing-Tianjin-Hebei Region. Explor. Econ. Issues 2024, 2024, 136–152. [Google Scholar]
  44. Wang, J.; Han, S.; Lin, H.; Wu, P.; Yuan, J. New-Type Urbanization Ecologically Reshaping China. Heliyon 2023, 9, e12925. [Google Scholar] [CrossRef] [PubMed]
  45. Simonds, J.O. Landscape Architecture: The Shaping of Man's Natural Environment; McGraw-Hill: New York, NY, USA, 1961. [Google Scholar]
  46. Council of Europe. European Landscape Convention; Council of Europe Treaty Series, No. 176; Council of Europe: Florence, Italy, 2000. [Google Scholar]
  47. Luo, S.; Jiang, H.; Yi, D.; Liu, R.; Qin, J.; Liu, Y.; Zhang, J. PM2SFCA: Spatial Access to Urban Parks, Based on Park Perceptions and Multi-Travel Modes. A Case Study in Beijing. ISPRS Int. J. Geo-Inf. 2022, 11, 488. [Google Scholar] [CrossRef]
  48. Cheng, S.; Liao, Z.; Zhu, Y. Dynamic changes in community deprivation of access to urban green spaces by multiple transport modes. Front. Public Health 2021, 9, 615432. [Google Scholar] [CrossRef] [PubMed]
  49. Wang, H.; Dai, X.; Wu, J.; Nie, X. Influence of urban green open space on residents’ physical activity in China. BMC Public Health 2019, 19, 1093. [Google Scholar] [CrossRef]
  50. Weeraratne, N.; Hunt, L.; Kurz, J. Optimizing PCA for Health and Care Research: A Reliable Approach to Component Selection. arXiv 2025, arXiv:2503.24248. [Google Scholar]
  51. Jolliffe, I.T.; Cadima, J. Principal component analysis: A review and recent developments. Philos. Trans. A Math. Phys. Eng. Sci. 2016, 374, 20150202. [Google Scholar] [CrossRef]
  52. Rea, A.; Rea, W. How many components should be retained from a multivariate time series PCA? arXiv 2016, arXiv:1610.03588. [Google Scholar]
  53. Zhuolin, T.; Yang, C. Research Progress of the Two-Step Floating Catchment Area Method and Extensions. Prog. Geogr. 2016, 35, 589–599. [Google Scholar]
  54. Ren, J.; Wang, Y. Analysis of Spatial Accessibility of Park Green Spaces in Huangpu District, Shanghai Based on an Improved Two-Step Mobile Search Method. Adv. Geogr. Sci. 2021, 2021, 774–783. [Google Scholar]
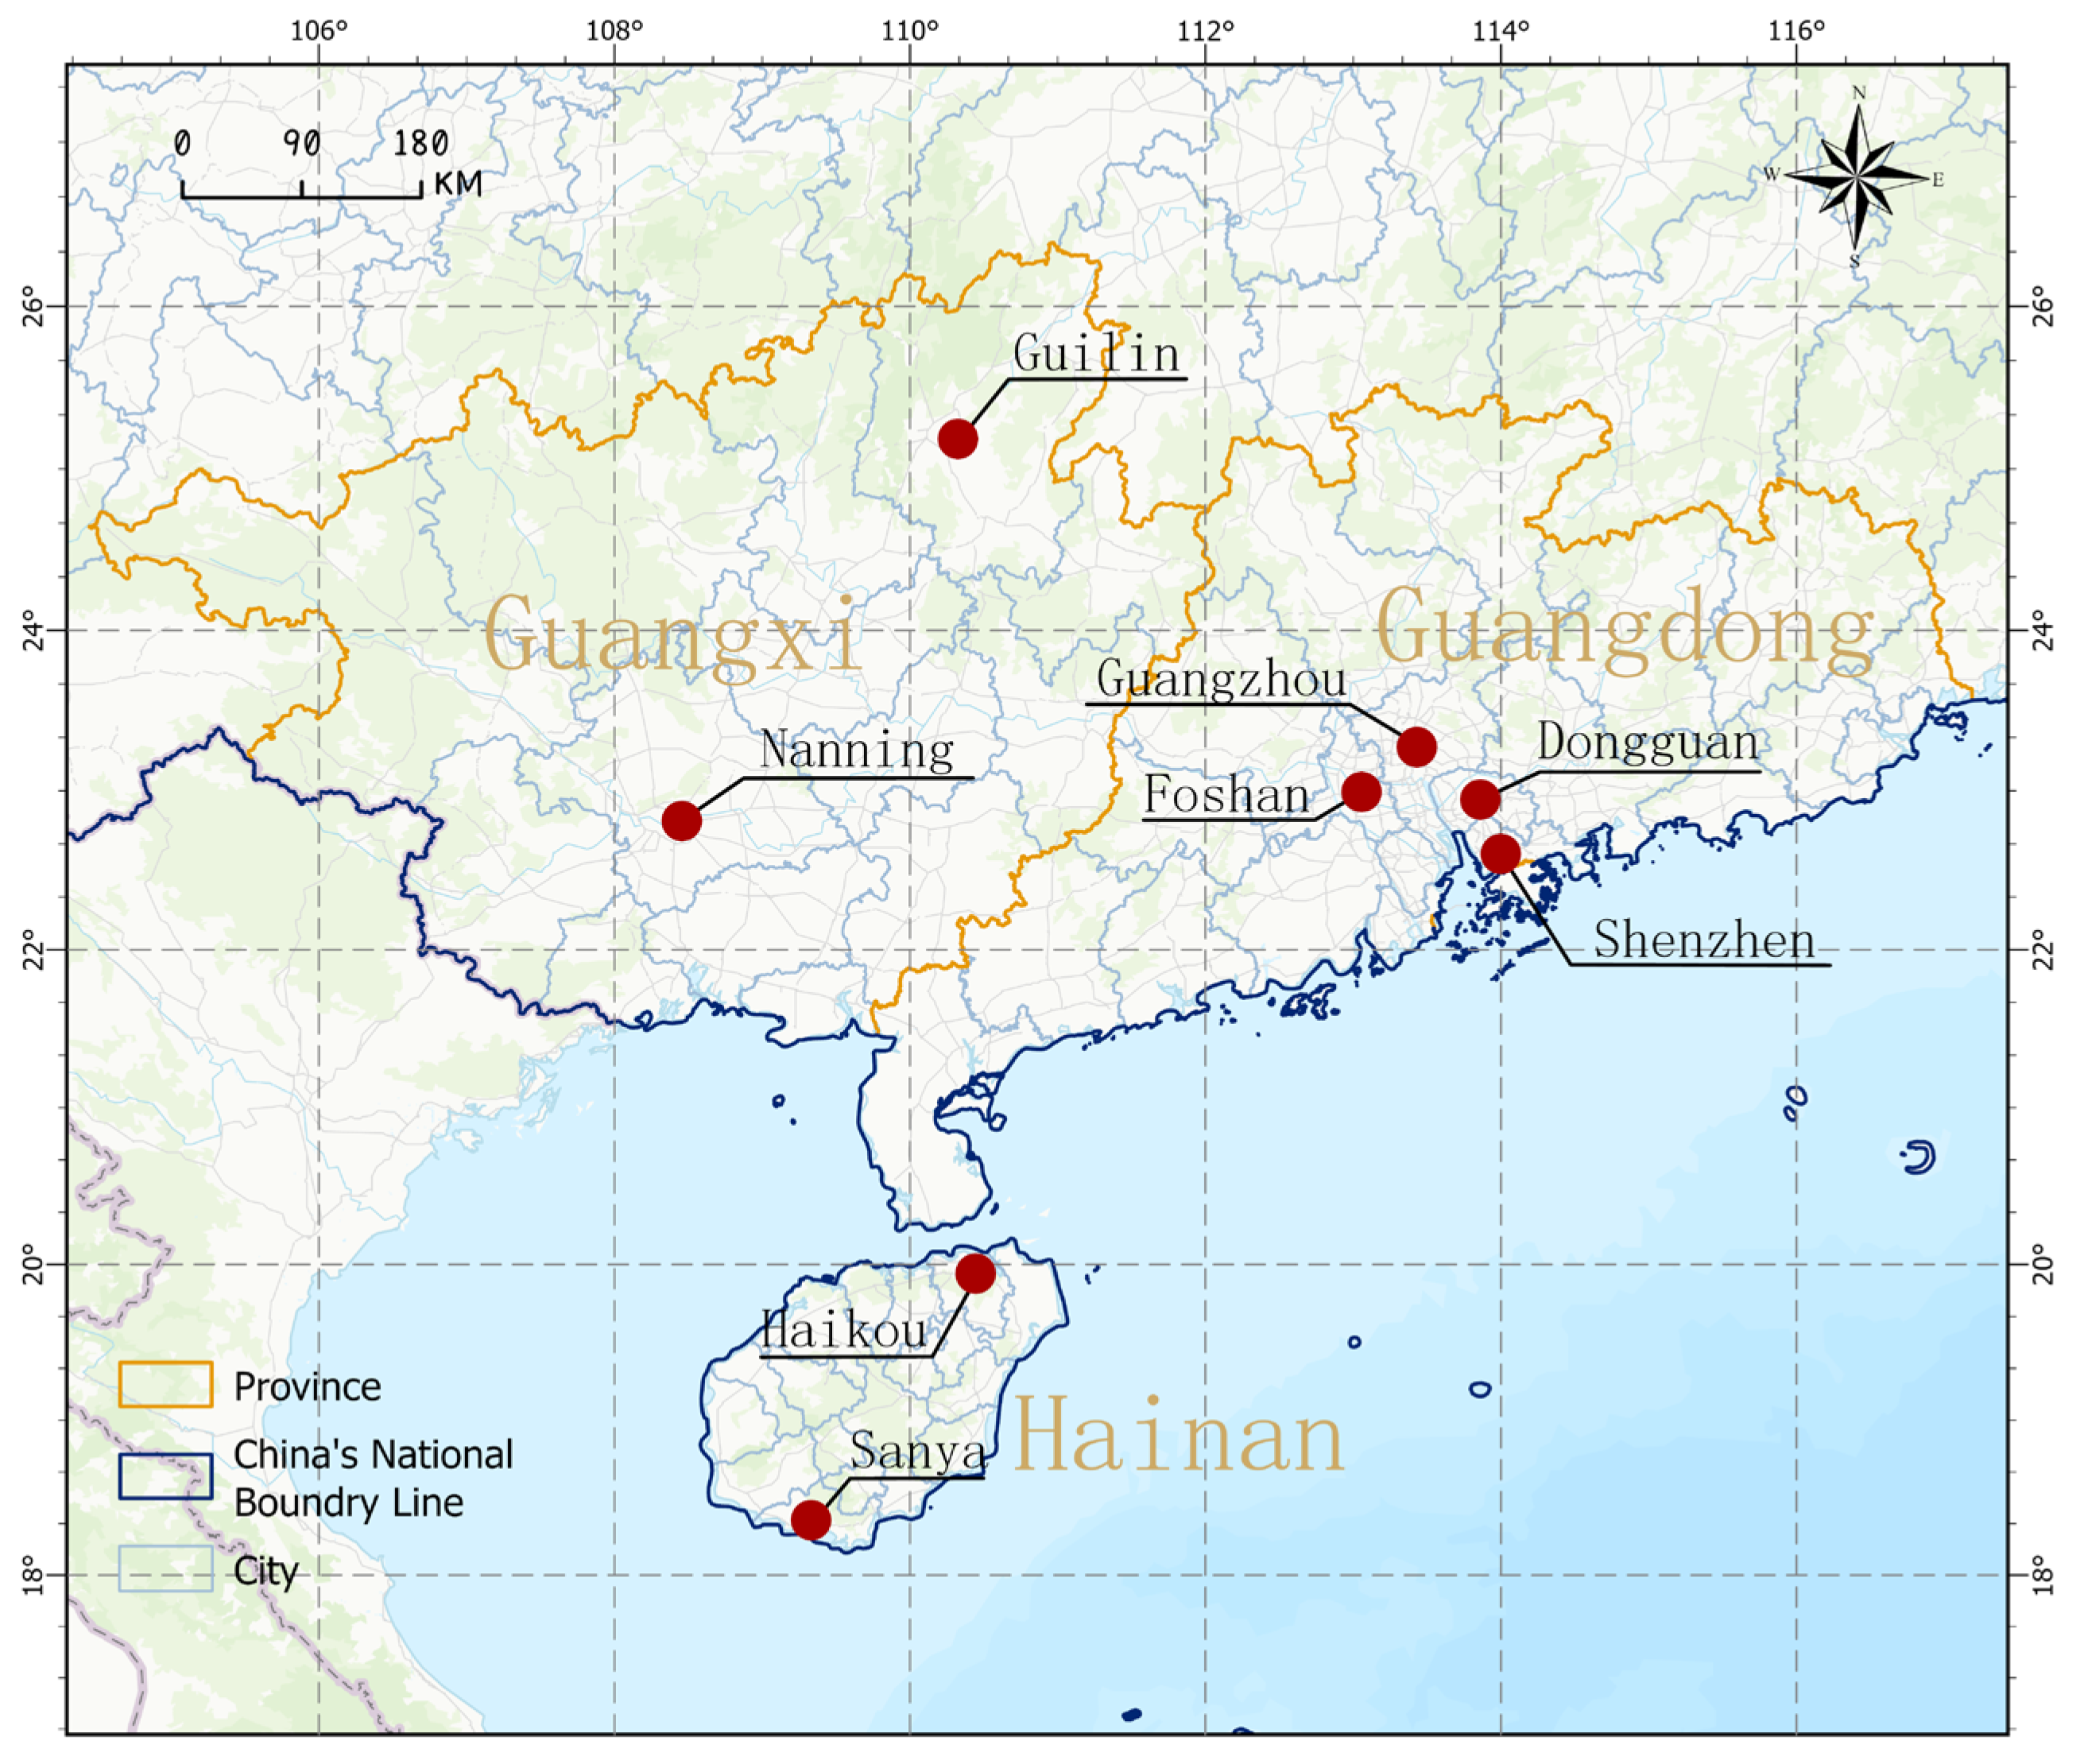
Figure 1. Research area.
Sustainability 17 08335 g001
Figure 2. Research flowchart.
Sustainability 17 08335 g002
Figure 3. Vectorization of element feature area proportions.
Sustainability 17 08335 g003
Figure 4. Daily average park heat value.
Sustainability 17 08335 g004
Figure 5. PC2 × PC4: (Medium Plaza + Small Plaza) × (Primary Park Road + Open Grassland).
Sustainability 17 08335 g005
Figure 6. PC3 × PC5:(Aquatic Plant Coverage Area + Lake + Dense Woodland) × (Secondary Park Road + Semi-open Grassland).
Sustainability 17 08335 g006
Table 1. Sample city and park Numbering table.
CityRegional Economy/City TierComprehensive Urban ParksPark ID
Haikou (A)Hainan Free Trade Port
/Tier-3 City
Baishamen Park, Jinniuling Park,
People’s Park, Evergreen Park
A01, A02
A03, A04
Sanya (B)Hainan Free Trade Port
/Tier-3 City
Egret ParkB01
Guangzhou (C)Greater Bay Area
/Tier-1 City
Liuhuahu Park, Tianhe Park, Zhujiang ParkC01, C02, C03
Shenzhen (D)Greater Bay Area
/Tier-1 City
Bao’an Park, Donghu Park,
Central Park
D01, D02, D03
Dongguan (E)Greater Bay Area
/New Tier-1 City
Humen Park, People’s Park, Songshan Lake ParkE01, E02, E03
Foshan (F)Greater Bay Area
/Tier-2 City
Jihua Park, Wenhua ParkF01, F02
Nanning (G)China-ASEAN Hub
/Tier-2 City
Qingxiu Lake Park, People’s Park, Shishan ParkG01, G02, G03
Guilin (H)China-ASEAN Hub
/Tier-3 City
Guilin Seven Star ParkH01
Note: Greater Bay Area: Guangdong-Hong Kong-Macao Greater Bay Area.
Table 2. Classification of Internal Landscape Features in Urban Parks.
Primary CategoryIntermediate CategorySpecific TypeElements
Geographic
Environment
HydrologyWater BodiesLake, Pond, Stream
Land UseLand CoverWoodlandsDense Woodland,
Sparse Woodland
GrasslandsSparse Woodland Grassland, Semi-open Grassland, Open Grassland
WetlandsAquatic Plant Coverage Area
Built Structures
and Infrastructure
Park RoadsPrimary Park Road, Secondary Park Road, Tertiary Park Road
PlazasLarge Plaza, Medium Plaza,
Small Plaza
Recreational GroundsPlayground, Sports Field
Supporting FacilitiesParking Lot
Table 3. Time Periods of Vitality Data.
Time Periods of Vitality Data (Day)Time Points Within Data PeriodsSource of Vitality Data
SpW Day1, SpW Day2, SpW Day3
SpR Day1, SpR Day2
05:00–23:002023–2024 Baidu Maps
https://huiyan.baidu.com (accessed on 8 May 2024)
SuW Day1, SuWDay2, SuWDay3
SuR Day1, SuR Day2
AuWDay1, AuWDay2, AuW Day3
AuR Day1, AuR Day2
WiW Day1, WiW Day2, WiW Day3
WiR Day1, WiR Day2
Table 5. Principal Components of Element Feature Structures.
Principal ComponentHighly Loaded Element FeaturesElement Feature LoadingsElement Feature StructureVariance
Explained (%)
PC1Sparse Woodland + Sparse Woodland Grassland + Tertiary Park Road0.92, 0.59, 0.77Interactive
structure
12.51
PC2Medium Plaza + Small Plaza0.94, 0.94Interactive
structure
12.33
PC3Aquatic Plant Coverage Area
+ Lake + Dense Woodland
0.85, 0.75,
−0.69
Interactive
structure
11.37
PC4Primary Park Road + Open Grassland0.43, 0.91Interactive
structure
8.35
PC5Secondary Park Road
+ Semi-open Grassland
0.88, 0.71Interactive
structure
8.33
PC6Pond0.96Single structure8.09
PC7Parking Lot +
Sparse Woodland Grassland
0.90, 0.58Interactive
structure
7.61
PC8Sports Field0.94Single structure7.43
PC9Primary Park Road + Large Plaza0.53, 0.90Interactive
structure
6.80
PC10Stream0.95Single structure6.78
PC11Playground0.88Single structure6.35
Table 6. Screening of Principal Component Interaction Terms.
PC1 × PC2PC2 × PC4PC3 × PC7PC4 × PC11PC6 × PC11
PC1 × PC3PC2 × PC5PC3 × PC8PC5 × PC6PC7 × PC8
PC1 × PC4PC2 × PC6PC3 × PC9PC5 × PC7PC7 × PC9
PC1 × PC5PC2 × PC7PC3 × PC10PC5 × PC8PC7 × PC10
PC1 × PC6PC2 × PC8PC3 × PC11PC5 × PC9PC7 × PC11
PC1 × PC7PC2 × PC9PC4 × PC5PC5 × PC10PC8 × PC9
PC1 × PC8PC2 × PC10PC4 × PC6PC5 × PC11PC8 × PC10
PC1 × PC9PC2 × PC11PC4 × PC7PC6 × PC7PC8 × PC11
PC1 × PC10PC3 × PC4PC4 × PC8PC6 × PC8PC9 × PC10
PC1 × PC11PC3 × PC5PC4 × PC9PC6 × PC9PC9 × PC11
PC2 × PC3PC3 × PC6PC4 × PC10PC6 × PC10PC10 × PC11
Table 7. Principal Component Scores and Interaction Terms.
Park IDPC1PC2PC3PC4PC5PC6
A010.11 0.54 0.80 −0.52 0.86 0.26
A02−0.34 −0.98 −0.03 −0.93 −0.69 −1.09
A03−0.13 3.21 0.23 −1.04 1.30 −1.15
A042.52 −1.18 −0.05 −1.20 0.55 0.43
B01−0.40 0.32 2.31 −0.04 −0.30 2.82
C01−1.12 −0.10 1.99 0.08 −0.87 −0.96
C02−0.79 −0.20 −0.41 0.47 0.64 0.22
C03−0.67 −0.20 −1.07 0.37 0.90 1.56
D01−1.51 0.00 −1.74 −0.75 −0.09 0.16
D02−0.50 −0.25 −0.39 0.30 −0.47 −1.15
D030.50 −0.77 0.59 2.17 2.75 −0.87
E01−0.20 0.14 −0.49 2.62 −1.16 −0.25
E020.11 −0.14 0.35 −0.90 −0.28 0.46
E031.72 −0.58 −0.39 −0.51 0.29 −0.46
F011.77 1.73 −0.85 1.36 −1.65 0.84
F020.81 0.61 −0.06 −0.32 −0.73 −0.63
G010.00 −1.11 1.38 0.09 −1.09 −1.03
G02−0.87 0.38 −0.25 −0.39 0.26 −0.25
G03−0.77 −0.87 −0.78 −0.13 0.53 1.00
H01−0.26 −0.55 −1.15 −0.72 −0.75 0.09
PC7PC8PC9PC10PC11
A013.24 0.24 −1.08 0.081.22
A020.27 −0.11 −0.09 −0.42−1.17
A03−0.82 0.14 −0.57 −0.07−0.65
A040.78 0.44 −0.39 −0.43−1.14
B01−0.69 −0.75 0.34 1.36−0.40
C01−0.29 −0.34 −0.70 −1.180.37
C02−0.20 0.30 0.87 −0.88−1.42
C03−0.04 −0.61 0.17 −0.78−0.62
D01−0.22 −0.38 −0.57 −0.34−0.92
D020.91 0.02 −0.49 2.69−0.84
D03−0.64 0.02 0.30 0.82−0.25
E010.42 1.28 −0.11 −0.440.84
E02−1.06 3.71 0.47 −0.060.40
E03−1.76 −1.17 −0.63 −0.271.83
F01−0.06 −0.46 −0.99 −0.39−0.58
F020.90 −0.73 3.72 −0.010.11
G01−0.38 −0.71 −0.47 −0.69−0.72
G02−0.18 −0.53 0.72 −0.292.06
G030.53 −0.25 −0.24 −0.940.99
H01−0.73−0.11−0.262.250.88
Note: Interaction terms included in the model are PC1 × PC2, PC2 × PC4, PC1 × PC7, PC2 × PC5, PC3 × PC5, PC6 × PC11.
Table 8. Variables of External Environmental Features.
Park IDZ-IncomeZ-( R j )Z-( A j )
A01−1.07 0.46 −0.35
A02−0.86 0.67 1.18
A03−0.86 −0.70 −0.91
A04−0.86 0.37 0.49
B01−1.22 −0.33 −0.91
C011.39 0.18 −0.35
C021.62 −0.54 0.13
C031.62 −1.09 −1.00
D010.32 −0.18 0.30
D020.89 2.11 2.29
D031.99 0.32 0.52
E010.09 −0.35 −0.37
E020.09 −0.60 −0.84
E03−0.07 0.05 −0.58
F010.13 −1.15 −1.27
F020.13 −0.47 −0.29
G01−0.45 −0.61 −0.45
G02−1.00 −0.74 −0.30
G03−1.00 −0.46 0.14
H01−0.90 3.05 2.57
Table 9. Principal Components Main Effects of Element Feature Structures.
Principal ComponentElement FeaturesElement Feature StructureβSEtpSignificance
PC1Sparse Woodland + Sparse Woodland Grassland + Tertiary Park RoadInteractive structure11.3114.740.770.45
PC2Medium Plaza + Small PlazaInteractive structure58.1214.743.94<0.00**
PC3Aquatic Plant Coverage Area
+ Lake + Dense Woodland
Interactive structure−29.0514.74−1.970.06
PC4Primary Park Road
+ Open Grassland
Interactive structure47.6614.743.23<0.00**
PC5Secondary Park Road + Semi−open GrasslandInteractive structure10.7814.740.730.47
PC6PondSingle structure18.4514.741.250.23
PC7Parking Lot + Sparse Woodland GrasslandInteractive structure−22.1614.74−1.500.15
PC8Sports FieldSingle structure−5.6514.74−0.380.71
PC9Primary Park Road
+ Large Plaza
Interactive structure−1.4614.74−0.100.92
PC10StreamSingle structure−29.9314.74−2.030.06
PC11PlaygroundSingle structure−33.6514.74−2.280.03*
Note: significance: * p < 0.05; ** p < 0.01; † Marginal Significance (0.05 < p < 0.1).
Table 10. Principal Component Interaction Effects of Element Feature Structures.
Principal ComponentElement FeaturesStructure/
Interaction Term
βSEtp
PC1Sparse Woodland + Sparse Woodland Grassland + Tertiary Park RoadInteractive structure12.708.151.560.14
PC2Medium Plaza + Small PlazaInteractive structure73.1612.925.66<0.00**
PC3Aquatic Plant Coverage Area
+ Lake + Dense Woodland
Interactive structure−12.496.34−1.970.06
PC4Primary Park Road
+ Open Grassland
Interactive structure54.698.016.83<0.00**
PC5Secondary Park Road + Semi−open GrasslandInteractive structure165.3115.8710.42<0.00**
PC6PondSingle structure−46.657.55−6.18<0.00**
PC7Parking Lot + Sparse Woodland GrasslandInteractive structure−64.496.75−9.56<0.00**
PC8Sports FieldSingle structure3.435.140.670.51
PC9Primary Park Road
+ Large Plaza
Interactive structure6.465.921.090.29
PC10StreamSingle structure14.607.062.070.05
PC11PlaygroundSingle structure0.306.040.050.96
PC2
×
PC4
(Medium Plaza + Small Plaza)
× (Primary Park Road + Open Grassland)
Interaction term151.2721.137.16<0.00**
PC1
×
PC2
(Sparse Woodland + Sparse Woodland Grassland + Tertiary Park Road)
×
(Medium Plaza + Small Plaza)
Interaction term99.9312.687.88<0.00**
PC1
×
PC7
(Sparse Woodland + Sparse Woodland Grassland + Tertiary Park Road)
×
(Parking Lot + Sparse Woodland Grassland)
Interaction term68.438.967.64<0.00**
PC3
×
PC5
(Aquatic Plant Coverage Area
+ Lake + Dense Woodland)
×
(Secondary Park Road + Semi−open Grassland)
Interaction term−56.6113.44−4.21<0.00**
PC2
×
PC5
(Medium Plaza + Small Plaza) ×
(Secondary Park Road + Semi−open Grassland)
Interaction term44.5911.833.77<0.00**
PC6 × PC11(Pond) × (Playground)Interaction term−16.3216.40−1.000.33
Note: significance: ** p < 0.01; † Marginal Significance (0.05 < p < 0.1).
Table 11. Synergistic Effects of External Environmental Features.
VariablePark FeaturesTypeβSEtp
PC1Sparse Woodland + Sparse Woodland Grassland + Tertiary Park RoadElement features42.9414.412.98<0.00**
PC2Medium Plaza + Small PlazaElement features100.4219.545.14<0.00**
PC3Aquatic Plant Coverage Area
+ Lake + Dense Woodland
Element features15.2118.260.830.41
PC4Primary Park Road
+ Open Grassland
Element features16.2215.971.020.32
PC5Secondary Park Road
+ Semi-open Grassland
Element features−8.0012.14−0.660.51
PC6PondElement features53.2016.713.18<0.00**
PC7Parking Lot + Sparse Woodland GrasslandElement features−19.1711.40−1.680.10
PC8Sports FieldElement features−4.0210.39−0.390.70
PC9Primary Park Road + Large PlazaElement features−25.1213.84−1.820.08
PC10StreamElement features−35.5023.28−1.530.14
PC11PlaygroundElement features13.0517.930.730.47
Z- ( A j )Vehicular AccessibilityEnvironmental features180.0263.352.84<0.00**
Z- ( ( R j )Service capacityEnvironmental features−137.1255.06−2.490.02*
Z- incomeper capita disposable incomeEnvironmental features58.6619.882.95<0.00**
Note: Significance: * p < 0.05; ** p < 0.01; † Marginal Significance (0.05 < p < 0.1).
Disclaimer/Publisher’s Note: The statements, opinions and data contained in all publications are solely those of the individual author(s) and contributor(s) and not of MDPI and/or the editor(s). MDPI and/or the editor(s) disclaim responsibility for any injury to people or property resulting from any ideas, methods, instructions or products referred to in the content.