Abstract
This study estimates student loan borrowers’ repayment burdens (RBs) in South Korea. Using data from the Survey Report on Labor Conditions by Employment Type and novel administrative records, we estimate life-cycle earnings profiles by income quantile through RIF regression. These estimates are then used to derive RBs for hypothetical borrowers under income-contingent loans (ICLs) and mortgage-type loans, and to evaluate RBs for actual ICL borrowers by matching them with estimated income profiles. The findings suggest that Korea’s student loan system plays a positive role in expanding access to higher education, particularly through ICLs. Many low-income students who benefited from ICLs are later found in the top income deciles. However, raising the repayment threshold irrespective of borrower income may delay repayment and reduce system efficiency. These results underscore the importance of aligning repayment rules with borrowers’ earnings trajectories to ensure both equity and the long-term sustainability of the loan system.
1. Introduction
Those willing and able to study should not be excluded from higher education due to financial constraints. This is an improvement for the society’s efficiency and equity. Indeed, in the absence of government intervention, household income is known to have a significant positive correlation with college enrollment [1,2]. Moreover, even when low-income students enroll in college, they are more likely than higher-income students to drop out due to financial constraints [3,4,5]. Loan programs allow low-income students to complete higher education [1]. Thus, there is broad agreement that the student loan system should be designed to close the family income-related education gap [1,2].
In the majority of OECD nations, public loan systems were established before 2000. In the 1960s, Canada, Finland, Japan, Turkey, and the United States implemented student loan systems [6]. Australia launched the Income Contingent Loan (ICL) in 1989, followed by New Zealand and the United Kingdom in the 1990s [7]. In 2005, South Korea introduced a “government-guaranteed loan”, that serves as the basis of the current mortgage-type loan [8].
To assess the stability of student loan systems in various nations, studies have been undertaken to estimate repayment burdens. Repayment burdens (RB) is the percentage of income taken up by repayments. Chapman and Doris [9] simulate data from Ireland and find that mortgage-type loans impose unsustainable repayment burdens on low-income graduates. Chapman and Liu [10] created a hypothetical student loan system in Vietnam, estimated repayment burdens, and concluded that the system was unsuitable for Vietnam due to high default rates. On the contrary, there are no studies that estimate South Korea’s repayment burden.
In addition to South Korea, Japan, and the United States jointly operate mortgage-type loans and ICLs. The United States and Japan are implementing systems modified from the general ICLs, which were designed by Australia, New Zealand, and the United Kingdom [7,11]. Armstrong et al. [11] discovered that Japanese partial ICL, introduced to alleviate the high repayment burden of mortgage-type loans, did not reduce the repayment burden, and they advocated for a universal ICL system. Barr et al. [7] compared the burden of repayment for mortgage-type loans and the income-based repayment (IBR) loan system in the United States. They discovered that IBR could not address the high repayment burden of mortgage-type loans and proposed an ICL system as an alternative. Unlike other countries, South Korea operates a general Income-Contingent Loan (ICL), allowing for a comparison between general ICLs and mortgage-type loans. Previous studies have estimated the repayment burdens of hypothetical ICLs [7,10,11], but this study estimates the repayment burdens of ICLs that are actually in operation. This research is expected to reveal whether general ICLs, unlike Japanese partial ICLs or Income-Based Repayment (IBR) schemes, can alleviate repayment burdens.
This study aims to estimate student loan repayment burdens (RBs) for both ICLs and mortgage-type loans. To achieve this, we created hypothetical borrower profiles for ICL and mortgage-type loans that are currently operating in Korea. These profiles reflect the unique characteristics of Korean university students, which distinguish them from other countries. Furthermore, unlike previous research, this study employs novel administrative data to construct actual loan cases. Therefore, this study compares ICLs and mortgage-type borrowers, as well as hypothetical and actual borrowers.
In the research findings, only some hypothetical mortgage-type borrowers showed high Repayment Burdens (RBs), and hypothetical ICL borrowers displayed low RBs but defaulted when the repayment threshold was set at a high level. Actual ICL borrowers faced a lower threshold compared to hypothetical borrowers, resulting in a higher actual repayment rate and RBs of less than 11%. Through the analysis, we confirmed the importance of setting the repayment threshold in ICLs. Furthermore, both mortgage-type loans and ICLs exhibited low RBs, leading us to conclude that South Korea’s student loan system is being operated effectively.
A key contribution of this study is that it provides an empirically grounded benchmark for setting appropriate repayment thresholds in income-contingent loan systems. The findings suggest that the threshold should be indexed to macroeconomic indicators such as economic growth and inflation. In the case of Korea, an annual adjustment rate of approximately 4–5% appears to be appropriate.
2. Student Loans in South Korea
Student loans were introduced late in South Korea because higher education heavily depended on the private sector. Public universities represented slightly more than 20% of all universities in terms of the number of universities and students [12]. Before 2002, public funding accounted for less than 20% of total higher education financing, not exceeding 25% until 2008 [12,13]. With approximately 70% of high school graduates enrolling in college and a low tax burden, increasing funding for higher education has been difficult for the Korean government [14].
In this context, the financing of higher education in South Korea underwent a significant transition after 2010. ICL was introduced in 2010 by the Korea Student Aid Foundation (KOSAF), which was founded in 2009. ICL commenced operations concurrently with mortgage-type loans, an extension of existing government-guaranteed loans. The share of public funding for higher education has increased significantly and is expected to reach 40% by 2019 [15]. While other nations have operated student loan programs for a long time, South Korea has a brief history of loan programs and has rapidly expanded loan support. This has raised concerns about the loan system’s stability and sustainability. The loan system’s stability is determined by the repayment rate, which is related to the borrower’s repayment burden.
An interesting feature of South Korea’s student loans is that they operate two loan types: ICLs and mortgage-type loans. ICL, which determines the repayment amount based on the borrower’s income, is available to university students up to the age of 35 whose family income section (Yearly, the Ministry of Health and Welfare designates the reference median income as the median value of the national household income. It sets the Family income section in line with it. The boundary value of Section 5 is the reference median income, and the boundary value of Section 8 is twice the reference median income. However, in determining the income section, a formula is applied that converts each household’s assets into income and adds them to the annual income. Hence, the boundary value of the 8th section corresponds to about the 60th percentile of the income distribution in terms of income), which is below the 8th section set by the KOSAF. According to Statistics Korea, an income bracket below the 8th section means a lower-middle income bracket [16]. Exceptionally, ICL is available for pre-employment post-learners or employees of small and medium-sized businesses up to the age of 45. Under ICL, borrowers are exempt from loan repayment if their annual income is below the repayment threshold. ICL has a variable interest rate; the rate for the Fall 2022 semester is 1.7%. Loan amounts range between $100 and the total attendance cost (An exchange rate of 1000 won per dollar was applied).
A mortgage-type loan provides the borrower with a grace period and a repayment period. The borrower pays only the interest during the grace period and then the principal and interest during the repayment period. Both periods may span up to 10 years. These loans are available to college and graduate students up to the age of 55, and there are no restrictions on household income. The mortgage-type loan has a fixed interest rate, with that of the second semester of 2022 being 1.7%. The loan amount is the same as the ICL. Both ICLs and mortgage-type loans are offered on a semester-by-semester basis, subject to income verification at the beginning of each semester.
In 2020, ICL and mortgage-type loans in South Korea were used by 361,802 and 241,102 borrowers, respectively [17]. In the same year, ICLs totaled $821,500,000, and mortgage-type loans totaled $893,900,000 [18]. These figures represent approximately 47.1% (602,904) and 20.0% (1.715 billion dollars) of the total student enrollment and total tuition fees, respectively [17]. Given the size of KOSAF’s loans, various evaluations of the student loan system are needed, including a comparison between ICL and mortgage-type loans. From the perspective of borrowers’ repayment burden, evaluation is expected to have another implication for the future fiscal balance.
3. Empirical Strategy
3.1. Estimating Lifetime Income by Quantile
Life-cycle earnings profiles for various income levels must be estimated to estimate the repayment burden of student loans. The sustainability of the loan system is determined by borrowers who are able to meet their repayment obligations without relying on external financial assistance. Therefore, this study concentrates on employed individuals who are presumed to repay their loans directly. For the purposes of this analysis, life-cycle earnings are defined as labor income only, excluding capital income, transfer income, and other non-wage sources. Generalized quantile regression can be used to estimate the life-cycle earnings profiles of workers in a given income bracket. This method estimates age-adjusted earnings based on the wage quantile, while holding all workers’ characteristics constant. However, the characteristics of earners in the top decile of earnings distinguish them from those in the bottom decile, and these characteristics influence their age-specific earnings. Therefore, conditional wages are not realistic and are unsuitable for our analysis. This study applies Firpo et al.’s [19] unconditional quantile regression model to estimate the life-cycle earnings profiles of workers by income quantile.
As shown in Equation (1), the unconditional quantile regression model uses a dependent variable transformed into a recentered influence function (RIF). is the wage, and is the wage in the -quantile. is the cumulative distribution function of the wage, and is the density function value at . is the influence function (IF), which includes an indicator function if the analysis is about a particular quantile [19]. For example, if a researcher is interested in the median, is 0.5, and is the median wage. equals 1 for wages below the median and 0 if otherwise.
The value of is the same for all individual observations. To form the RIF, this value is added to the value generated by the IF. Ordinary least squares (OLS) regression estimates the effect of explanatory variables on the dependent variable’s mean. However, it does not estimate the effect of explanatory variables on a statistic other than the mean of the dependent variable, such as wages in a particular decile (). In contrast, the method applied in this study can estimate the effect of explanatory variables on various statistics by setting the appropriate IF for the statistic v(∙), such as , in which the researcher is interested.
Equation (2) was specified with reference to Chapman and Doris [9]. In Equation (2), the RIF defined in Equation (1) is the dependent variable. The predicted values in Equation (2) represent the estimated life-cycle earnings of the τ-quantiles. Repayment burden is the percentage of your annual income that is taken up by annual loan payments. Because wages are estimated through Equation (2), we can calculate repayment burdens by income quantile by obtaining annual loan payments. The annual loan payment is determined using a projected scenario.
To elaborate on the estimation process using real data, we first construct the as shown in Equation (1) using an appropriate influence function corresponding to the distributional statistic () that the researcher is interested in. Second, we estimate the wage equation through regression analysis, as shown in Equation (2), with the as the dependent variable and variables that may affect the wage as explanatory variables.
3.2. Estimating the RB of Actual Borrowers
We estimate the wages of hypothetical borrowers and constructed loan scenarios using survey data. We then utilize administrative data to estimate RBs for real borrowers. Identifying borrowers’ income deciles, life-cycle earnings, and annual repayments is key to estimating RBs. The KOSAF database does not contain ICL borrowers’ income deciles and life-cycle earnings, but it contains the mandatory repayment amount. In ICL, the mandatory repayment amount is based on income, thus allowing income to be backdated. We can estimate the actual borrowers’ RBs if we know their lifetime income deciles.
In the data, the actual borrowers’ lifetime income deciles are not observed. We wish to utilize the lifetime income deciles estimated by the RIF regression above. By matching the actual borrowers’ incomes to their lifetime income deciles, we have all three elements for estimating RBs. For mortgage-type loans, we lack the elements needed to estimate the RB because the payment is determined independently of income. Hence, ICL borrowers’ annual mandatory payments are derived from Equation (3). Equation (3) is based on the official repayment calculation formula provided by KOSAF.
(Annual Mandatory Repayment) = [(Annual Income − Earned Income Deduction) − Repayment Base Income] × 20%
Using the annual mandatory repayment from KOSAF’s database, Equation (3) can be used to calculate income. The National Tax Service provides the amount of the earned income deduction, and KOSAF publishes the repayment base income annually. By matching this income to the estimated life-cycle income quantile, we can identify the income quantiles of ICL borrowers. In other words, we can estimate the actual ICL borrower’s income quantile, average life-cycle earnings corresponding to the quantile, and RB.
The matching process entails the following: First, we identify borrowers of a certain age in the KOSAF’s database who have incurred an ICL obligation and calculate their annual income using Equation (3). Second, for each ICL borrower, the income at a particular age is identified and compared to the income at the same age among the life-cycle earnings quantiles estimated by RIF regression. The borrower is matched to the decile where the two values are most identical. This can be expressed as Equation (4). Equation (4) adopts a matching framework proposed by Kantor [20].
Let be the income of the ICL borrower at age and be the income of the th decile at age estimated by RIF regression. The decile that minimizes becomes the ICL borrower’s income decile. For example, suppose a 27-year-old male in 2017 made mandatory payments between the ages of 27 and 29. His wages are calculated using the mandatory payment information, as , , . Then, substitute the wages of the 10th percentile men aged 27 to 29, , estimated by RIF regression, into (4) to obtain . Find for all fractions. The j corresponding to the minimum value of is the man’s income decile.
4. Data
For this study, we used data from the 2018 Survey Report on Labor Conditions by Employment Type and KOSAF’s administrative data. The former is a survey conducted by Statistics Korea and serves as a reference for labor policy because it includes working conditions, such as wages and working hours. In particular, this data contains information pertinent to this study regarding the educational background of workers aged 15 and above. Using wage information for men aged 25 to 60 and women aged 23 to 60, we calculated the college graduates’ average graduation age by gender using 2018 data from the Economically Active Population Survey (EAPS), which is used to calculate South Korea’s employment rate. The legal retirement age in South Korea is 60. Among college graduates, we estimate life-cycle earnings by decile. There are 274,234 men and 167,645 women, making the total population 441,879. Table 1 shows their descriptive statistics.

Table 1.
Descriptive statistics for survey data.
KOSAF’s DB contains personal information about university students who have borrowed student loans, as well as loan types, loan amounts, and repayment amounts. This study used KOSAF’s DB from 2009, when KOSAF was founded, to the most recent year, 2021. The analysis results are reliable because these administrative data provide information about real borrowers, not hypothetical borrowers. In this study, we utilized information about the mandatory repayments of ICL borrowers, and as previously mentioned, income can be imputed from this information. Because the borrower’s income cannot be estimated, mortgage-type loans are excluded from the match. By matching the imputed income to life-cycle earnings by decile, the actual RB of ICL borrowers can be estimated.
The following process was used to select the borrowers for matching. First, we selected male and female ICL borrowers who were 27 and 25 years old, respectively, in 2017. We chose these ages due to the average time it takes for borrowers to enter the workforce and for their income to exceed the repayment threshold. Then, we sum the mandatory repayment amounts for each borrower from 2017 to 2019 by year. Because we estimate life-cycle earnings using 2018 data, we must use comparable data from 2018 and pre-COVID-19; therefore, these years were selected. Because we have had the comprehensive data since KOSAF’s inception, we have all the borrowers’ loan histories. Since 2017, borrowers who have borrowed at least one student loan are considered to be still in school. They are assumed to be unemployed, and their RB is not estimated.
However, some people have neither borrowed since 2017 nor made a mandatory repayment. They may be either unemployed or have an income that is less than the repayment threshold. They should not be excluded to ensure the matching results are as realistic as possible. Therefore, first, we assume that some of them are unemployed based on their age-specific employment rates and not matched by income quantile. Second, we assume that the remaining borrowers, excluding the unemployed, cannot make the mandatory payments due to their low income. Because they belong to the lower income quantile, they are randomly assigned to the 10th and 20th percentiles.
Table 2 shows the descriptive statistics of the actual ICL borrowers analyzed. Out of 68,205 borrowers, 28,756 were men and 39,449 were women. Among men, 27.5% and 72.5% graduated from junior college and university, respectively. Compared with men, women have a higher and lower percentage of junior college and university graduates, respectively. Men are more likely than women to attend a four-year college or public university. Regarding tuition fees, it is approximately $3447 for men and $3606 for women. The age of first-time ICL use is approximately 23 for men and 20 for women. Men are more likely to major in engineering, whereas women are more likely to major in sociology. For both genders, approximately 80% households had incomes below the baseline median income.
Table 2.
Descriptive statistics on actual borrowers.
5. Results
5.1. Life-Cycle Earnings Profiles
Figure 1 shows the estimated life-cycle earnings profiles of college graduates by gender using RIF regression. Annual real earnings are estimated for each of the nine quantiles from entry to retirement, and an annual productivity growth rate of 1.1% is applied. This is comparable to Ireland’s 1% productivity growth rate used by Chapman and Doris [9]. For both men and women, those in the top decile experienced long-lasting income gains, whereas those in the bottom decile experienced little real wage growth except in the initial years.
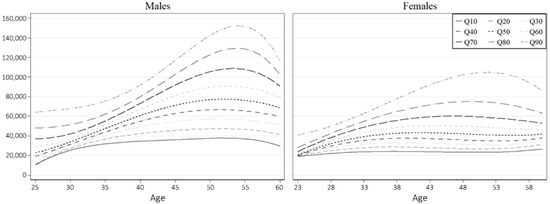
Figure 1.
Estimated life-cycle earnings profiles.
Men have higher life-cycle earnings than women. Men peak in earnings in their mid-50s. In contrast, the women’s top and bottom deciles peak in their early 50s and their late 50s, respectively. For men, the 90th and 10th percentiles peak at approximately $152,000 at age 54 and $318,000 at age 52, respectively. For women, the 90th and 10th percentiles earn approximately $150,000 at age 52 and $27,000 at age 60, respectively.
5.2. Mortgage-Type Loans
Principal and interest are repaid equally in mortgage-type loans. The borrower pays the same monthly amount for a certain period. That is, the loan amount determines the annual repayment amount, which is constant every year. Therefore, a borrower’s RB is only affected by their income. Conditional on an identical amount of loan, a high income means a low RB, whereas a low income means a high RB.
The following scenarios pertain to mortgage-type loans in this study. First, the loan amount is divided into two scenarios: $10,000 or $30,000. From their junior to senior year of college, a student borrows $2500 or $7500 per semester based on the average graduation age. The average graduation age is 25 for men and 23 for women; therefore, the age is 23 for men and 21 for women in their junior year. Second, the grace period is divided into two scenarios: 5 or 10 years. The repayment period is fixed at 10 years in all scenarios; thus, the scenarios are four in total. In addition, a 1.7% fixed interest rate is applied, and the institutional setting of paying only interest on the principal during the grace period is maintained. Appendix B provides supplementary results based on alternative scenarios of interest rate assumptions.
Figure 2 depicts the RBs for a $10,000 mortgage-type loan with a 5-year grace period and 10-year repayment period. The RB decreases for both men and women as the income quantile increases. Moreover, RBs decrease with age as income increases. In their 20s, men have larger RBs than women, but in their 30s, the situation is reversed. This is likely due to the fact that men in South Korea serve in the military in their 20s, delaying their entry into the workforce, and causing them to earn less than women. Baum and Schwartz [21] consider an RB greater than 18% to be an excessive debt burden. None of the RBs in Figure 2 exceeds 18%.
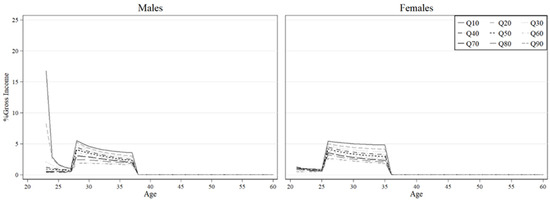
Figure 2.
Mortgage-type loan repayment burdens for undergraduates, various quantiles of the earnings distribution, $10,000 loan with a 5-year grace period, and a 10-year repayment period.
Table 3 estimates the mean and maximum values of RBs by income quantile for mortgage-type loans. Similarly to Figure 2, RBs are higher for women than for men. Moreover, RBs are higher for lower quantiles than for higher quantiles. In the second scenario, the average RB for the bottom decile is highest, reaching 16% for women and 17.5% for men. In particular, the male 10th percentile has a maximum RB of almost 84%. In the third and fourth scenarios, the repayment period is five years longer than in second scenario, resulting in a lower average RB. However, the maximum RB at the 10th percentile is the same because it occurs right after graduation. During this period, the borrower has little or no income and must pay interest on the entire loan amount. Therefore, the maximum RB is the same despite the extended repayment period.
Table 3.
Mortgage-type loan repayment burdens as a percentage of net income, selected percentiles of the life-cycle earnings distribution, varying terms and loan amounts, 1.7% real interest rate.
5.3. Income-Contingent Loans (ICL)
In Korea, ICL falls into two repayment categories: voluntary and mandatory. For the voluntary repayment method, the borrower can repay the loan at will. For the mandatory repayment method, a certain amount must be repaid if the borrower’s income exceeds the repayment threshold. The borrowers will be required to repay after employment if they do not voluntarily repay the loan in full before employment. The repayment will be suspended if their income does not exceed the threshold. Because no implications for repayment burdens exist in the case of voluntary repayment, this study considers mandatory repayment.
The following are the ICL scenarios envisioned in this study. Similarly to mortgage-type loans, the loan amount is divided into two scenarios: $10,000 or $30,000. There are two scenarios because there is neither a grace period nor a repayment period in ICL. The borrowing period is assumed to be in the third and fourth year, which is the same as mortgage-type loans; however, ICL requires additional assumptions regarding employment timing. Because Korean college graduates spend an average of one year searching for a job (Using 2018 data from EAPS, we calculated the average job search duration by gender for college graduates), we assume that men and women enter the workforce at ages 26 and 24, respectively. Due to approximately two years of mandatory military service, Korean men enter the workforce two years later than women on average.
ICL employs a variable interest rate, which varies every semester, and a repayment threshold, which varies yearly. To reflect the current status of lending, we designed the scenario in which borrowers enter their third year in 2019 and begin repayment in 2021. Accordingly, each period’s interest rate and repayment threshold income were applied. However, due to the unpredictability of future interest rates, the second semester 2021 interest rate of 1.7% was applied after 2021. After 2021, we calculated the repayment threshold income by applying a 4.7% annual growth rate to the 2021 threshold income of $13,659. The 4.7% growth rate is the average real threshold income growth rate from 2017 to 2021.
Figure 3 displays the RBs for a borrower who borrowed $10,000 using an ICL and obtained employment a year after graduation. Unlike mortgage-type loans, the RB is proportional to the income decile for both men and women. This is likely because, in ICLs, the borrower’s income determines the mandatory amount. Borrowers in the top decile earn more early in life; therefore, they have larger obligations and pay off their loans faster. Both men and women in the 70th percentile and above pay off their loans in their early 30 s. In contrast, lower quantiles are characterized by longer repayment periods, with some sub-quantiles not completing repayment until retirement age. Comparable to Figure 2, all RBs in Figure 3 do not exceed 18%.
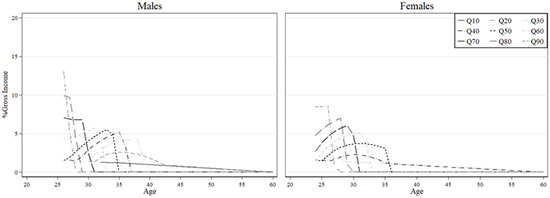
Figure 3.
Income-contingent loan repayment burdens for undergraduates, various quantiles of the earnings distribution, $10,000 loan.
Table 4 shows the estimated mean and maximum RB values by income quantile according to ICL’s scenarios. Unlike mortgage-type loans, the mean and maximum RB values are greater for men than for women. This is likely because men have higher incomes than women, resulting in higher mandatory repayments. Due to ICLs’ institutional features that consider borrower income, the average RBs for ICLs are lower than for mortgage-type loans. The average RB for mortgage-type loans is 17% and the maximum RB can reach 84%. On the other hand, the average RB for ICLs is less than 11% and the maximum RB is 13%. Some quantiles could not make repayment because their incomes were below the repayment threshold. Both women and men in the 10th quantile could not begin lifetime repayment.
Table 4.
Income-contingent loan repayment burdens as a percentage of net income, selected percentiles of the life-cycle earnings distribution, varying loan amounts, and 1.7% real interest rate.
Table 5a,b compares ICL repayment status after 15 or 20 years with a mortgage-type loan. In a mortgage-type loan, the loan is fully repaid after 15 years (with a 5-year grace period and a 10-year repayment period) or after 20 years (with a 10-year grace period and a 10-year repayment period). Therefore, understanding the status of ICL repayment during the same period is essential. The average principal repayment rate was calculated by simulating 1000 borrowers based on their education, gender, and employment. For those who are not employed among the 1000 people, the principal repayment rate is 0%. All other items were estimated for employed borrowers except for the average principal repayment rate. The present repayment value was estimated using a discount rate of 2%, based on the time of the senior year loan.
Table 5.
(a) ICL repayments for males, selected percentiles of the lifetime earnings distribution, varying terms and loan amounts, 1.7% real interest rate. (b) ICL repayments for females, selected percentiles of the lifetime earnings distribution, varying terms and loan amounts, 1.7% real interest rate.
In all scenarios, the 10th percentile of men began repayment, but they did not complete it before retirement age. They made payments for four years when their income exceeded the repayment threshold but stopped when the threshold increased more than their income. Consequently, with a 0% principal repayment rate for four years, they paid only interest. When the 30th percentile borrowed $10,000, they completed repaying it after 20 years; however, when they borrowed $30,000, they were unable to complete repayment before retirement age. Overall, the higher quantiles make higher monthly payments and pay off their debts faster than the lower quantiles.
Meanwhile, Table 5b demonstrates that women fared even worse than men in terms of repayment. After 20 years, the 10th percentile of women in all scenarios had not begun repayment. The women’s 30th and 50th percentiles began repaying their student loans but did not pay off the total amount before retirement age. The 70th percentile of women can pay off a $10,000 loan in full, but not a $30,000 loan. In all scenarios, only the 90th percentile group can fully repay before retirement age. Women’s average RB is lower than men’s, with neither exceeding 10%.
5.4. RBs of the Actual ICL Borrowers
Table 6a,b show the results of matching actual ICL borrowers to specific quantiles of life-cycle earnings. As described earlier, the matched borrowers in 2017 are a male and a female who are 27 and 25 years old, respectively. Given the Korean college graduates’ average job search duration, they are assumed to have started their job search in 2016. Their loan principal was borrowed before graduation, i.e., by 2015. The present value of the repayments was calculated by applying a 2% discount rate based on 2015, the year of the last loan.
Table 6.
(a) ICL repayments for actual male borrowers. (b) ICL repayments for actual female borrowers.
The hypothetical male borrower was 26 years old in 2022, and the actual male borrower was 27 years old in 2017. Due to data characteristics, the base year for the hypothetical and real borrowers is different. In ICL, RB is estimated through borrowers’ wages after employment. Recent data is unavailable because it takes time for real borrowers to be employed and their wages to be observed. The analysis of real borrowers is relatively historical but reliable. By comparing the results for real and hypothetical borrowers, we anticipate drawing policy implications for lending schemes.
Table 6a illustrates the results for male borrowers. Of 28,756, the unemployed comprised 7951 (27.65%) and were excluded from the match. The 90th percentile completes repayment five years earlier than the 50th percentile. We observe fewer differences in repayment between quantiles for real borrowers than for hypothetical borrowers in Table 5a. All groups borrowed student loans in excess of $13,000. As the quantile increases, the average amount borrowed in each quantile increases. This is likely due to borrowers in higher income quantiles attending more expensive schools, such as medical school. RB never exceeded 11% in any given group.
In contrast to Table 5a, more groups are able to complete repayment before retirement age, as a result of their repayment threshold income. Appendix A displays the growth rate of real repayment threshold income. From 2015 to 2017, the real repayment threshold income declined; however, it spiked in 2018, and continues to grow by more than 4% annually. The hypothetical group of male borrowers is assumed to begin repaying their loans at the age of 26 in 2022, whereas the actual male borrowers began repaying at the age of 27 in 2017. At the beginning of the hypothetical borrowers’ careers, when their earnings are low, their 2022 repayment threshold is high, and they are not required to make mandatory repayments. In contrast, the standard income for repayment in 2017 was not high in the early days of the actual borrower’s employment; therefore, the mandatory repayment continued, and the actual borrower’s repayment rate was higher.
Table 6b shows the results for female borrowers. Of 39,449 borrowers, 5465 (13.85%) are unemployed; thus, they are excluded from the analysis. Except for the 10th percentile group, the average loan amount for each female quantile is less than that for men. Due to the difference in income, it takes women one to two years longer to pay off their loans than it takes men. On average, the 90th percentile group pays off 5 years earlier than the 50th percentile group. The RB is below 11% across all groups.
Similarly to men, more real female borrowers than virtual borrowers completed repayment. Although the 50th percentile of hypothetical borrowers did not fully repay their loans, the 50th percentile of actual borrowers did. The hypothetical female borrowers were assumed to begin repayment at the age of 24 in 2022, whereas the actual female borrowers began at the age of 25 in 2017. At the beginning of the actual female borrowers’ employment, their income was low, but the repayment threshold in 2017 was not high, so mandatory repayment continued. Therefore, the real borrowers’ repayment rate is higher than that of the hypothetical borrowers.
6. Conclusions
This study uses microdata to estimate the repayment burden for mortgage-type loans and ICLs based on their institutional characteristics. To estimate the repayment burden, we first use RIF regression to estimate the life-cycle earnings profiles by decile. To estimate the repayment burden for hypothetical borrowers, we then set up scenarios for mortgage-type loans and ICLs.
The repayment burden for mortgage-type loans increases with lower income quantiles, larger loan amounts, and shorter terms. In most cases, however, the estimated repayment burden is 18% or less, indicating that mortgage-type loans in Korea do not have a high repayment burden. The repayment burden of ICLs is lower than that of mortgage-type loans, possibly due to the institutional characteristics of ICLs, in which the repayment obligation is triggered when the borrower’s income exceeds a certain level. For ICLs, certain income deciles do not complete repayment by retirement. This result is more pronounced for women and lower quantile groups and relates to their ability to repay.
Using KOSAF’s database, we compared these results with those of actual borrowers. Using the data on the real ICL borrowers’ mandatory repayments, we estimated their income brackets and repayment burdens. Due to the sharp increase in income thresholds in 2018, we discovered that real borrowers repaid more smoothly than hypothetical borrowers. When real borrowers began earning income in 2017, their income was sufficient relative to the repayment threshold. The hypothetical borrowers were unable to commence repayment because their income was below the 2021 threshold, which has risen since 2018.
Prior studies estimate that low-income borrowers in Japan and the United States experience repayment burdens exceeding 30–40% of their income (Armstrong et al., 2019; Barr et al., 2019) [7,11]. In Japan, the minimum repayment amount is relatively high, which has been identified as a factor contributing to increased repayment burdens and delinquency rates (Armstrong et al., 2019) [11]. In the United States, nominal interest rates exceeding 4% have been shown to further exacerbate borrowers’ repayment burdens (Barr et al., 2019) [7]. By contrast, Korea’s student loan system sets the minimum repayment threshold at a relatively low level and maintains a substantially lower interest rate of 1.7%. These institutional features appear to have mitigated excessive repayment burdens among Korean borrowers and contributed to the overall stability of the system.
The above results have the following policy implications. Increasing the repayment threshold for ICL borrowers, regardless of their income, will delay their loan repayment. To ensure both borrower equity and fiscal sustainability, the repayment threshold should be indexed to economic growth and inflation rates. Excessive year-over-year increases should be avoided, and a moderate annual adjustment rate of 4–5%, as observed during the 2018–2021 period, is considered appropriate. Matching actual ICL borrowers with their income quantiles reveals that student loans serve a positive function. For both men and women, the 10th and 90th percentiles had the highest and second-highest number of borrowers, respectively. Borrowers must have a household income below the 60th percentile of the income distribution to qualify for ICL. Because ICL has enabled students with lower household incomes to complete their higher education, most earn incomes in the 90th percentile. This suggests that ICL is serving its intended purpose effectively.
These findings underscore the importance of ensuring the long-term sustainability of Korea’s student loan system. As the scale of public loan programs expands, sustainability hinges on whether repayment rules—particularly the income threshold—are appropriately calibrated to borrowers’ actual earnings trajectories. A misalignment between threshold levels and income growth may lead to prolonged repayment periods and increased fiscal pressure. To maintain both equity and fiscal viability, ongoing adjustments based on labor market dynamics and income distributions are essential.
This study is limited in that it does not address borrowers’ lived experiences—such as psychological stress, dropout decisions, or family support—focusing instead on quantitative estimates of repayment burdens. Future research should incorporate qualitative data, such as surveys or in-depth interviews, to more thoroughly examine the effects of repayment burdens on educational persistence and social equity. Moreover, future research could extend our analysis by estimating major-specific repayment burdens, contingent on the availability of reliable earnings data by field of study. This would provide valuable insights into how repayment burdens differ across academic disciplines.
Due to its institutional nature, the scope of this study is limited because it covers only the case of ICL mandatory repayment borrowers in KOSAF’s DB. In the case of mortgage-type loans, the loan principal determines the repayment amount. It is independent of the borrower’s income, which makes estimating the income quantile difficult. A total of 25,834 mortgage-type loan borrowers were excluded from the analysis due to the unavailability of income data. This limitation can be overcome if the National Tax Service (NTS) database, which tracks borrowers’ employment status and income, is available. RBs can also be estimated for a variety of student loan types, including mortgage-type loans. In subsequent research, we intend to obtain longitudinal income records from the National Tax Service (NTS) for each borrower, spanning from the year immediately following university graduation to the most recent period available. By linking these income records with detailed repayment histories, we aim to generate more precise estimates of individual repayment burdens. Leveraging NTS data is expected to substantially enhance the accuracy and empirical rigor of future analyses.
Finally, this study is limited in that it does not provide an in-depth discussion of the long-term sustainability of Korea’s student loan system. A comprehensive sustainability analysis would require examination of the loan program’s fiscal soundness, its integration with national education financing, and broader systemic factors. Nonetheless, this study contributes to the literature by offering an empirical assessment of the current structure and repayment burdens, thereby laying the groundwork for future evaluations of sustainability. Subsequent research should examine the financial viability and policy implications of the Korean student loan system in a more integrated manner, with the aim of identifying strategies to promote both equitable access to higher education and long-term system stability.
Author Contributions
Methodology, Y.M.; Formal analysis, Y.M.; Writing–original draft, J.K. and C.C.; Writing–review & editing, C.C.; Project administration, J.K.; Funding acquisition, C.C. All authors have read and agreed to the published version of the manuscript.
Funding
This paper was written with the support program for the Research Oriented Professors of Konkuk University.
Institutional Review Board Statement
Not applicable.
Informed Consent Statement
Not applicable.
Data Availability Statement
Data are available from the authors upon reasonable request and with permission of the relevant data providers.
Conflicts of Interest
The authors declare no conflicts of interest.
Abbreviations
| ICL | Income-contingent Loans |
| KOSAF | Korea Student Aid Foundation |
| NTS | National Tax Service |
| RB | Repayment Burden |
| RIF | Recentered Influence Function |
Appendix A
Table A1.
ICL repayment threshold.
Table A1.
ICL repayment threshold.
| Years | Standard Income for Repayment After Income Deduction (US$) | CPI (%) | Real Standard Income for Repayment (US$) | Rate of Increase (%) |
|---|---|---|---|---|
| 2010 | 6780 | 87.17 | 7777.93 | |
| 2011 | 7160 | 90.68 | 7896.00 | 1.52 |
| 2012 | 7940 | 92.66 | 8568.78 | 8.52 |
| 2013 | 8500 | 93.87 | 9055.27 | 5.68 |
| 2014 | 10,530 | 95.06 | 11,076.64 | 22.32 |
| 2015 | 10,530 | 95.74 | 10,998.99 | −0.70 |
| 2016 | 10,530 | 96.67 | 10,893.12 | −0.96 |
| 2017 | 10,530 | 98.55 | 10,685.40 | −1.91 |
| 2018 | 11,860 | 100.00 | 11,860.00 | 10.99 |
| 2019 | 12,430 | 100.38 | 12,382.51 | 4.41 |
| 2020 | 13,230 | 100.92 | 13,109.08 | 5.87 |
| 2021 | 14,130 | 103.45 | 13,659.37 | 4.20 |
Appendix B
Table A2.
Mortgage-type loan repayment burdens as a percentage of net income, selected percentiles of the life-cycle earnings distribution, varying terms and loan amounts, 1% real interest rate.
Table A2.
Mortgage-type loan repayment burdens as a percentage of net income, selected percentiles of the life-cycle earnings distribution, varying terms and loan amounts, 1% real interest rate.
| 10th | 30th | 50th | 70th | 90th | |
|---|---|---|---|---|---|
| Base case: $10,000 loan, 15-year term, repayments begin 5 years after graduation | |||||
| Women | |||||
| Mean | 4.971 | 4.018 | 3.407 | 2.834 | 2.163 |
| Maximum | 7.767 | 5.984 | 5.325 | 4.569 | 3.357 |
| Men | |||||
| Mean | 4.652 | 3.081 | 2.514 | 2.032 | 1.386 |
| Maximum | 16.492 | 6.453 | 5.300 | 4.015 | 2.447 |
| $30,000 loan, 15-year term, repayments begin 5 years after graduation | |||||
| Women | |||||
| Mean | 14.913 | 12.053 | 10.221 | 8.503 | 6.488 |
| Maximum | 23.300 | 17.951 | 15.976 | 13.706 | 10.071 |
| Men | |||||
| Mean | 13.957 | 9.244 | 7.543 | 6.096 | 4.158 |
| Maximum | 49.477 | 19.358 | 15.900 | 12.045 | 7.341 |
| $10,000 loan, 20-year term, repayments begin 10 years after graduation | |||||
| Women | |||||
| Mean | 4.103 | 3.176 | 2.580 | 2.066 | 1.554 |
| Maximum | 7.767 | 5.890 | 4.739 | 3.914 | 3.114 |
| Men | |||||
| Mean | 3.117 | 1.838 | 1.468 | 1.212 | 0.915 |
| Maximum | 16.492 | 3.565 | 3.084 | 2.654 | 1.891 |
| $30,000 loan, 20-year term, repayments begin 10 years after graduation | |||||
| Women | |||||
| Mean | 12.309 | 9.528 | 7.741 | 6.198 | 4.661 |
| Maximum | 23.300 | 17.669 | 14.217 | 11.743 | 9.341 |
| Men | |||||
| Mean | 9.351 | 5.515 | 4.404 | 3.637 | 2.746 |
| Maximum | 49.477 | 10.696 | 9.251 | 7.961 | 5.672 |
Table A3.
Mortgage-type loan repayment burdens as a percentage of net income, selected percentiles of the life-cycle earnings distribution, varying terms and loan amounts, 2.5% real interest rate.
Table A3.
Mortgage-type loan repayment burdens as a percentage of net income, selected percentiles of the life-cycle earnings distribution, varying terms and loan amounts, 2.5% real interest rate.
| 10th | 30th | 50th | 70th | 90th | |
|---|---|---|---|---|---|
| Base case: $10,000 loan, 15-year term, repayments begin 5 years after graduation | |||||
| Women | |||||
| Mean | 3.729 | 2.944 | 2.384 | 1.912 | 1.341 |
| Maximum | 5.801 | 5.072 | 4.188 | 3.311 | 2.149 |
| Men | |||||
| Mean | 7.447 | 2.110 | 1.569 | 1.212 | 0.895 |
| Maximum | 67.600 | 3.965 | 2.904 | 2.026 | 1.413 |
| $30,000 loan, 15-year term, repayments begin 5 years after graduation | |||||
| Women | |||||
| Mean | 11.188 | 8.833 | 7.151 | 5.735 | 4.022 |
| Maximum | 17.403 | 15.217 | 12.565 | 9.932 | 6.446 |
| Men | |||||
| Mean | 22.341 | 6.329 | 4.706 | 3.637 | 2.684 |
| Maximum | 202.801 | 11.894 | 8.711 | 6.078 | 4.240 |
| $10,000 loan, 20-year term, repayments begin 10 years after graduation | |||||
| Women | |||||
| Mean | 2.844 | 2.042 | 1.615 | 1.294 | 0.951 |
| Maximum | 5.143 | 3.780 | 3.056 | 2.524 | 1.865 |
| Men | |||||
| Mean | 5.208 | 1.308 | 0.978 | 0.800 | 0.635 |
| Maximum | 67.600 | 2.386 | 2.031 | 1.670 | 1.240 |
| $30,000 loan, 20-year term, repayments begin 10 years after graduation | |||||
| Women | |||||
| Mean | 8.532 | 6.127 | 4.844 | 3.881 | 2.853 |
| Maximum | 15.429 | 11.341 | 9.169 | 7.572 | 5.594 |
| Men | |||||
| Mean | 15.625 | 3.924 | 2.934 | 2.401 | 1.904 |
| Maximum | 202.801 | 7.158 | 6.092 | 5.011 | 3.719 |
Table A4.
ICL repayments for males, selected percentiles of the lifetime earnings distribution, varying terms and loan amounts, 1% real interest rate.
Table A4.
ICL repayments for males, selected percentiles of the lifetime earnings distribution, varying terms and loan amounts, 1% real interest rate.
| 10th | 30th | 50th | 70th | 90th | |
|---|---|---|---|---|---|
| Base case: $10,000 loan, repayments begin 1 year after graduation, at age 38 (15 years later) | |||||
| Mean% principal repaid | 57 | 100 | 100 | 100 | 100 |
| # years payment | 9 | 9 | 9 | 6 | 2 |
| Age final payment | 43 | 36 | 34 | 31 | 27 |
| Repayment burdens | 2.97 | 3.83 | 4.24 | 7.39 | 8.98 |
| Mean monthly payment | 66 | 103 | 101 | 147 | 434 |
| Mean payment, 21–29 | - | 24 | 51 | 162 | 434 |
| Total repayments | 7095 | 11,117 | 10,877 | 10,587 | 10,405 |
| Total discounted by 2% | 5729 | 9265 | 9486 | 9743 | 9910 |
| $30,000 loan, repayments begin 1 year after graduation, at age 38 (15 years later) | |||||
| Mean% principal repaid | 8 | 46 | 87 | 100 | 100 |
| # years payment | 9 | 11 | 13 | 11 | 6 |
| Age final payment | - | 43 | 39 | 36 | 31 |
| Repayment burdens | 2.97 | 5.10 | 6.45 | 8.02 | 10.78 |
| Mean monthly payment | 66 | 136 | 192 | 250 | 441 |
| Mean payment, 21–29 | - | 24 | 51 | 162 | 472 |
| Total repayments | 7095 | 18,008 | 29,980 | 32,940 | 31,785 |
| Total discounted by 2% | 5729 | 14,564 | 24,474 | 28,214 | 29,210 |
| $10,000 loan, repayments begin 1 year after graduation, at age 43 (20 years later) | |||||
| Mean% principal repaid | 100 | 100 | 100 | 100 | 100 |
| # years payment | 14 | 9 | 9 | 6 | 2 |
| Age final payment | 43 | 36 | 34 | 31 | 27 |
| Repayment burdens | 2.95 | 3.83 | 4.24 | 7.39 | 8.98 |
| Mean monthly payment | 69 | 103 | 101 | 147 | 434 |
| Mean payment, 21–29 | - | 24 | 51 | 162 | 434 |
| Total repayments | 11,527 | 11,117 | 10,877 | 10,587 | 10,405 |
| Total discounted by 2% | 8922 | 9265 | 9486 | 9743 | 9910 |
| $30,000 loan, repayments begin 1 year after graduation, at age 43 (20 years later) | |||||
| Mean% principal repaid | 21 | 100 | 100 | 100 | 100 |
| # years payment | 14 | 16 | 14 | 11 | 6 |
| Age final payment | - | 43 | 39 | 36 | 31 |
| Repayment burdens | 3.17 | 5.93 | 6.03 | 8.02 | 10.78 |
| Mean monthly payment | 74 | 181 | 202 | 250 | 441 |
| Mean payment, 21–29 | - | 24 | 51 | 162 | 472 |
| Total repayments | 12,379 | 34,840 | 33,907 | 32,940 | 31,785 |
| Total discounted by 2% | 9507 | 26,597 | 27,392 | 28,214 | 29,210 |
Note: An annual growth rate of 2% is applied to the repayment threshold.
Table A5.
ICL repayments for females, selected percentiles of the lifetime earnings distribution, varying terms and loan amounts, 1% real interest rate.
Table A5.
ICL repayments for females, selected percentiles of the lifetime earnings distribution, varying terms and loan amounts, 1% real interest rate.
| 10th | 30th | 50th | 70th | 90th | |
|---|---|---|---|---|---|
| Base case: $10,000 loan, repayments begin 1 year after graduation, at age 36 (15 years later) | |||||
| Mean% principal repaid | 0 | 46 | 100 | 100 | 100 |
| # years payment | 0 | 12 | 11 | 8 | 4 |
| Age final payment | - | . | 34 | 31 | 27 |
| Mean RBs | - | 2.68 | 3.95 | 5.45 | 8.68 |
| Mean monthly payment | - | 42 | 83 | 112 | 219 |
| Mean payment, 21–29 | . | 31 | 60 | 114 | 219 |
| Total repayments | 0 | 6000 | 11,011 | 10,764 | 10,519 |
| Total discounted by 2% | 0 | 5000 | 9375 | 9586 | 9805 |
| $30,000 loan, repayments begin 1 year after graduation, at age 36 (15 years later) | |||||
| Mean% principal repaid | 0 | 5 | 33 | 73 | 100 |
| # years payment | 0 | 12 | 13 | 13 | 10 |
| Age final payment | - | . | 58 | 39 | 33 |
| Mean RBs | - | 2.68 | 4.92 | 7.05 | 9.04 |
| Mean monthly payment | - | 42 | 91 | 165 | 272 |
| Mean payment, 21–29 | - | 31 | 60 | 114 | 251 |
| Total repayments | 0 | 6000 | 14,259 | 25,761 | 32,600 |
| Total discounted by 2% | 0 | 5000 | 11,869 | 21,486 | 28,501 |
| $10,000 loan, repayments begin 1 year after graduation, at age 41 (20 years later) | |||||
| Mean% principal repaid | 0 | 67 | 100 | 100 | 100 |
| # years payment | 0 | 17 | 11 | 8 | 4 |
| Age final payment | - | . | 34 | 31 | 27 |
| Mean RBs | - | 2.66 | 3.95 | 5.45 | 8.68 |
| Mean monthly payment | - | 41 | 83 | 112 | 219 |
| Mean payment, 21–29 | - | 31 | 60 | 114 | 219 |
| Total repayments | 0 | 8342 | 11,011 | 10,764 | 10,519 |
| Total discounted by 2% | 0 | 6679 | 9375 | 9586 | 9805 |
| $30,000 loan, repayments begin 1 year after graduation, at age 41 (20 years later) | |||||
| Mean% principal repaid | 0 | 8 | 55 | 100 | 100 |
| # years payment | 0 | 17 | 18 | 16 | 10 |
| Age final payment | - | . | 58 | 39 | 33 |
| Mean RBs | - | 2.64 | 5.30 | 7.05 | 9.04 |
| Mean monthly payment | - | 41 | 101 | 177 | 272 |
| Mean payment, 21–29 | - | 31 | 60 | 114 | 251 |
| Total repayments | 0 | 8342 | 21,750 | 33,907 | 32,600 |
| Total discounted by 2% | 0 | 6679 | 17,220 | 27,429 | 28,501 |
Note: An annual growth rate of 2% is applied to the repayment threshold.
Table A6.
ICL repayments for males, selected percentiles of the lifetime earnings distribution, varying terms and loan amounts, 2.5% real interest rate.
Table A6.
ICL repayments for males, selected percentiles of the lifetime earnings distribution, varying terms and loan amounts, 2.5% real interest rate.
| 10th | 30th | 50th | 70th | 90th | |
|---|---|---|---|---|---|
| Base case: $10,000 loan, repayments begin 1 year after graduation, at age 38 (15 years later) | |||||
| Mean% principal repaid | 1 | 100 | 100 | 100 | 100 |
| # years payment | 9 | 10 | 10 | 6 | 2 |
| Age final payment | - | 38 | 35 | 31 | 27 |
| Repayment burdens | 1.54 | 3.67 | 3.98 | 6.13 | 9.14 |
| Mean monthly payment | 33 | 107 | 100 | 155 | 443 |
| Mean payment, 21–29 | - | 22 | 45 | 155 | 443 |
| Total repayments | 3591 | 12,873 | 12,046 | 11,157 | 10,631 |
| Total discounted by 2% | 2932 | 10,434 | 10,368 | 10,219 | 10,123 |
| $30,000 loan, repayments begin 1 year after graduation, at age 38 (15 years later) | |||||
| Mean% principal repaid | 0 | 11 | 54 | 100 | 100 |
| # years payment | 9 | 10 | 13 | 12 | 6 |
| Age final payment | - | 50 | 42 | 37 | 31 |
| Repayment burdens | 1.54 | 4.24 | 5.57 | 7.81 | 11.21 |
| Mean monthly payment | 33 | 115 | 166 | 258 | 465 |
| Mean payment, 21–29 | - | 22 | 45 | 155 | 466 |
| Total repayments | 3591 | 13,826 | 25,829 | 37,099 | 33,470 |
| Total discounted by 2% | 2932 | 11,156 | 21,096 | 31,275 | 30,656 |
| $10,000 loan, repayments begin 1 year after graduation, at age 43 (20 years later) | |||||
| Mean% principal repaid | 4 | 100 | 100 | 100 | 100 |
| # years payment | 13 | 10 | 10 | 6 | 2 |
| Age final payment | - | 38 | 35 | 31 | 27 |
| Repayment burdens | 1.41 | 3.67 | 3.98 | 6.13 | 9.14 |
| Mean monthly payment | 32 | 107 | 100 | 155 | 443 |
| Mean payment, 21–29 | - | 22 | 45 | 155 | 443 |
| Total repayments | 4930 | 12,873 | 12,046 | 11,157 | 10,631 |
| Total discounted by 2% | 3899 | 10,434 | 10,368 | 10,219 | 10,123 |
| $30,000 loan, repayments begin 1 year after graduation, at age 43 (20 years later) | |||||
| Mean% principal repaid | 0 | 46 | 100 | 100 | 100 |
| # years payment | 13 | 15 | 17 | 12 | 6 |
| Age final payment | - | 50 | 42 | 37 | 31 |
| Repayment burdens | 1.41 | 4.92 | 5.80 | 7.81 | 11.21 |
| Mean monthly payment | 32 | 151 | 198 | 258 | 465 |
| Mean payment, 21–29 | - | 22 | 45 | 155 | 466 |
| Total repayments | 4930 | 27,128 | 40,354 | 37,099 | 33,470 |
| Total discounted by 2% | 3899 | 20,648 | 31,654 | 31,275 | 30,656 |
Note: An annual growth rate of 3.5% is applied to the repayment threshold.
Table A7.
ICL repayments for females, selected percentiles of the lifetime earnings distribution, varying terms and loan amounts, 2.5% real interest rate.
Table A7.
ICL repayments for females, selected percentiles of the lifetime earnings distribution, varying terms and loan amounts, 2.5% real interest rate.
| 10th | 30th | 50th | 70th | 90th | |
|---|---|---|---|---|---|
| Base case: $10,000 loan, repayments begin 1 year after graduation, at age 36 (15 years later) | |||||
| Mean% principal repaid | 0 | 0 | 86 | 100 | 100 |
| # years payment | 0 | 11 | 13 | 9 | 5 |
| Age final payment | - | - | 38 | 32 | 28 |
| Mean RBs | - | 1.49 | 3.48 | 4.89 | 6.70 |
| Mean monthly payment | - | 23 | 72 | 108 | 182 |
| Mean payment, 21–29 | - | 24 | 51 | 104 | 182 |
| Total repayments | 0 | 3063 | 11,232 | 11,700 | 10,947 |
| Total discounted by 2% | 0 | 2578 | 9386 | 10,314 | 10,181 |
| $30,000 loan, repayments begin 1 year after graduation, at age 36 (15 years later) | |||||
| Mean% principal repaid | 0 | 0 | 2 | 45 | 100 |
| # years payment | 0 | 11 | 13 | 13 | 11 |
| Age final payment | - | - | - | 44 | 34 |
| Mean RBs | - | 1.49 | 3.89 | 6.51 | 8.53 |
| Mean monthly payment | - | 23 | 72 | 146 | 273 |
| Mean payment, 21–29 | - | 24 | 51 | 104 | 241 |
| Total repayments | 0 | 3063 | 11,232 | 22,706 | 36,018 |
| Total discounted by 2% | 0 | 2578 | 9386 | 18,977 | 31,094 |
| $10,000 loan, repayments begin 1 year after graduation, at age 41 (20 years later) | |||||
| Mean% principal repaid | 0 | 0 | 100 | 100 | 100 |
| # years payment | 0 | 12 | 15 | 9 | 5 |
| Age final payment | - | - | 38 | 32 | 28 |
| Mean RBs | - | 1.46 | 3.48 | 4.89 | 6.70 |
| Mean monthly payment | - | 23 | 71 | 108 | 182 |
| Mean payment, 21–29 | - | 24 | 51 | 104 | 182 |
| Total repayments | 0 | 3278 | 12,699 | 11,700 | 10,947 |
| Total discounted by 2% | 0 | 2737 | 10,469 | 10,314 | 10,181 |
| $30,000 loan, repayments begin 1 year after graduation, at age 41 (20 years later) | |||||
| Mean% principal repaid | 0 | 0 | 5 | 80 | 100 |
| # years payment | 0 | 12 | 18 | 18 | 11 |
| Age final payment | - | - | - | 44 | 34 |
| Mean RBs | - | 1.46 | 3.86 | 6.23 | 8.53 |
| Mean monthly payment | - | 23 | 73 | 162 | 273 |
| Mean payment, 21–29 | - | 24 | 51 | 104 | 241 |
| Total repayments | 0 | 3278 | 15,707 | 35,057 | 36,018 |
| Total discounted by 2% | 0 | 2737 | 12,592 | 27,794 | 31,094 |
Note: An annual growth rate of 3.5% is applied to the repayment threshold.
References
- Belley, P.; Lochner, L. The changing role of family income and ability in determining educational achievement. J. Hum. Cap. 2007, 1, 37–89. [Google Scholar] [CrossRef]
- Lochner, L.J.; Monge-Naranjo, A. The nature of credit constraints and human capital. Am. Econ. Rev. 2011, 101, 2487–2529. [Google Scholar] [CrossRef]
- Contini, D.; Zotti, A. Do financial conditions play a role in university dropout? New evidence from administrative data. In Teaching, Research and Academic Careers: An Analysis of the Interrelations and Impacts; Springer: Cham, Switzerland, 2022; pp. 39–70. [Google Scholar]
- Manski, C.F. Parental Income and College Opportunity; Democratic Study Center: Washington, DC, USA, 1992. [Google Scholar]
- Stinebrickner, R.; Stinebrickner, T.R. Understanding educational outcomes of students from low-income families: Evidence from a liberal arts college with a full tuition subsidy program. J. Hum. Resour. 2003, 38, 591–617. [Google Scholar] [CrossRef]
- OECD. Education at a Glance 2015: OECD Indicators; OECD Publishing: Paris, France, 2015. [Google Scholar]
- Barr, N.; Chapman, B.; Dearden, L.; Dynarski, S. The US college loans system: Lessons from Australia and England. Econ. Educ. Rev. 2019, 71, 32–48. [Google Scholar] [CrossRef]
- Kim, J.; Wiederspan, M. Evaluating South Korea’s introduction of an income contingent loan program. Res. High. Educ. 2021, 62, 1–25. [Google Scholar] [CrossRef]
- Chapman, B.; Doris, A. Modelling higher education financing reform for Ireland. Econ. Educ. Rev. 2019, 71, 109–119. [Google Scholar] [CrossRef]
- Chapman, B.; Liu, A.Y. Repayment burdens of student loans for Vietnamese higher education. Econ. Educ. Rev. 2013, 37, 298–308. [Google Scholar] [CrossRef]
- Armstrong, S.; Dearden, L.; Kobayashi, M.; Nagase, N. Student loans in Japan: Current problems and possible solutions. Econ. Educ. Rev. 2019, 71, 120–134. [Google Scholar]
- Kim, T. Higher education reforms in South Korea: Public—Private problems in internationalising and incorporating universities. Policy Futures Educ. 2008, 6, 558–568. [Google Scholar] [CrossRef]
- Song, K.C. A discussion on the enactment plan of the grant law for higher education. J. Econ. Financ. Educ. 2010, 19, 125–153. [Google Scholar]
- Hong, H.K.; Chae, J.E. Student loan policies in Korea: Evolution, opportunities and challenges. Educ. Res. J. 2011, 26, 99–122. [Google Scholar]
- Ban, S.J. The policy suggestions for higher education financial expansion to overcome the structural crisis in higher education system. J. Econ. Financ. Educ. 2023, 32, 31–58. [Google Scholar]
- Statistics Korea. Middle-Income Bracket. Available online: https://kostat.go.kr/menu.es?mid=b80304020000 (accessed on 7 August 2025).
- Kim, D.W.; Ban, J.Y. A Study on the research trends in government student loans using text mining. Educ. Res. Tomorrow 2021, 34, 23–52. [Google Scholar] [CrossRef]
- Kim, J.Y. Student loans and housing behaviors: Focused on Korean millennials. Hous. Stud. Rev. 2022, 30, 5–30. [Google Scholar]
- Firpo, S.; Fortin, N.M.; Lemieux, T. Unconditional quantile regressions. Econometrica 2009, 77, 953–973. [Google Scholar] [CrossRef]
- Kantor, D. MAHAPICK: Stata Module to Select Matching Observations Based on a Mahalanobis Distance Measure. 2012. Available online: https://econpapers.repec.org/software/bocbocode/s456703.htm (accessed on 7 September 2025).
- Baum, S.; Schwartz, S. How Much Debt Is Too Much? Defining Benchmarks for Manageable Student Debt. College Board. 2006. Available online: https://ticas.org/files/pub_files/Manageable_Debt_FINAL_4.20.06.pdf (accessed on 7 September 2025).
Disclaimer/Publisher’s Note: The statements, opinions and data contained in all publications are solely those of the individual author(s) and contributor(s) and not of MDPI and/or the editor(s). MDPI and/or the editor(s) disclaim responsibility for any injury to people or property resulting from any ideas, methods, instructions or products referred to in the content. |
© 2025 by the authors. Licensee MDPI, Basel, Switzerland. This article is an open access article distributed under the terms and conditions of the Creative Commons Attribution (CC BY) license (https://creativecommons.org/licenses/by/4.0/).