Abstract
Tourism’s rapid growth has significant and negative effects on the environment, society, and economy. Sustainable tourism practices are essential in order to mitigate these effects. Virtual reality (VR) technologies offer the possibility of implementing sustainable tourism policies by providing immersive experiences that replace real ones. Moreover, VR can be a useful tool for the protection and promotion of cultural and natural heritage. The article discusses the potential directions for sustainable tourism using VR. This technology can reduce the burden on popular tourist sites without losing their value to visitors. Additionally, it can promote less popular destinations in the wider public awareness. A case study of the implementation of a virtual tour at the Pahlavon Mahmud Mausoleum in Khiva (Uzbekistan) is presented. The research method was designed to evaluate the acceptability of VR technology among a convenience sampling of n = 57 Gen Z consumers (university students 20–24 years of age), who completed interviews following their participation in a voluntary virtual walking tour. The research results suggest that VR can be an acceptable and useful tool for implementing sustainable tourism policies in the near future. Another conclusion is that virtual sightseeing should not fully replace onsite tourism.
1. Introduction
Tourism has various influences, which can have positive and negative impacts on destinations and communities. The benefits of tourism are, for example, job creation and revenue generation [1,2], investment attraction [3], cultural exchange [4,5,6], social cohesion [7,8], infrastructure development [9,10], and conservation efforts [11,12]. Dodds [13] highlights several negative impacts of tourism, including overcrowding and overtourism, and a lack of cultural understanding and sensitivity, as well as environmental degradation. These impacts affect not only tourists, but also local residents (strain on local resources, increased cost of living, and traffic congestion), cultural institutions (over-commercialization and loss of authenticity), and the city government (infrastructure strain).
Local authorities and the management of cultural institutions can take reactive measures to deal with the existing negative consequences of tourism, such as capacity management (limiting the number of visitors) [14,15], demand management (adjusting factors like ticket prices and opening hours) [13,16], and crowd control (limiting entrance times and using queuing systems) [17,18,19]. The other type is proactive measures aimed at preventing their occurrence, or at least limiting their increase. Those are sustainable planning [20] (raising the economic sustainability of environmental conservation and social equity), infrastructure development (developing systems of public transportation and eco-friendly accommodations) [2], and community engagement (involving citizens into the decision-making process; equally sharing tourism benefits) [21].
One would say that Virtual Reality could be a medium for the proactive measures mentioned above [22,23]. Research conducted by Kouroupi and Metaxas [24] confirmed that the technologies creating the metaverse, including VR, can reduce the negative impacts of overtourism “… by providing virtual experiences that decrease the physical impact of tourism. Virtual experiences can provide visitors with a taste of a destination without requiring them to physically travel there, thereby reducing the tourism industry’s footprint”. VR does not create a physical crowd, and offers experience at one’s own pace, without risking offending religious feelings by unintentionally improper behavior onsite. The study by Kim et al. [25] proved, despite the strong influence of individual characteristics, that “telepresence had more significant impacts on perceived usefulness and perceived enjoyment compared to the direct effects of interactivity/vividness on perceived usefulness/perceived enjoyment”.
The phenomena of Virtual Reality Tourism (VRT) can already be measured—Calisto and Sarkar [26] present an in-depth review of the literature focusing on the areas of technology use and the reasons for using VR from the perspective of managers and tourists. Other matters include law regulations [27] and the need to provide information about (or even protect) the authenticity of the VR content [28,29,30], which can be achieved, for example, using steganography methods [31,32,33].
Unfortunately, while VRT can assist in the campaign against overtourism, the unsupervised and unlimited development of VRT can still lead to (1) the propagation of negative business practices (for example, allowing and encouraging the illegal and unlicensed rental of accommodation [34]), (2) harmful stereotypes, (3) no involvement from local communities or efforts to promote responsible tourism practices, and (4) the creation of products and services unrelated to the original goal—e.g., learning about other cultures (over-commercialization). The answer to these problems is sustainable tourism (ST). The World Tourism Organization (UNWTO) defines sustainable tourism as “tourism that takes a full account of its current and future economic, social and environmental impacts, addressing the needs of visitors, the industry, the environment and host communities” [35]. “Tourism and the Sustainable Development Goals—Journey to 2030”, which is a UNWTO publication [3], proposes recommendations on how to shift towards a more sustainable tourism sector by aligning policies, business operations, and investments. There are 17 sustainable development goals (SDGs) that link with tourism. According to those, VRT, to be considered sustainable, should prioritize environmentally friendly production methods (SDG 12), promote responsible travel behaviors (SDG 11, 12, and 13), and support local economies (SDG 8).
The importance of VR in supporting the development of sustainable tourism was discussed, among others, by Talwar et al. [36] during the COVID-19 pandemic. They point out that “the organismic states of favorable attitude and eco-guilt would initiate a pro-environmental response in the form of individuals’ willingness to sacrifice their hedonic pleasure from in-situ travel to protect the environment and continue to use VRT as a sustainable travel option even after the pandemic is over.” In a subsequent work, Talwar et al. [37] point out, similarly, that “The results indicate that individuals who believe they can—through their own example—encourage their family, friends, peers and social circle to use VRT to enjoy touristic travel in an environmentally friendly way will tend not only to use VRT frequently but also to spend time, money and effort to support and promote its use.”
In the authors’ opinion, VR can support ST in its three key aspects:
- In terms of the economic impact—by reducing the physical presence of tourists at locations, which can alleviate the pressure on the local infrastructure and service.
- In terms of the social impact—by the promotion of cross-cultural understanding by allowing visitors to learn about the local customs, traditions, and way of life in a responsible and respectful manner.
- In terms of the environmental impact—by raising awareness about environmental issues affecting destinations, such as conservation efforts, wildlife preservation, or climate change mitigation.
Studies on the relationships between young people and VR have been conducted many times [38,39]. For example, [40] presents the results of a study on the attractiveness of VRT as a new form of travel for Generation Z (Gen Z), defined as individuals born between 1997–2012, representing 2 billion consumers, and 26 percent of the world’s population [41]. Differences in motivation for VR travels to existing and unreachable places, as well as to historical places and imagined worlds were demonstrated. Similar studies [42], but conducted in terms of the ability of VRT to satisfactorily recall traditional tourist experiences, indicate that the authenticity and level of satisfaction with VR is comparable to physical tours, but especially for people with previous exposure to VR. Studies also confirm the positive relationship between VRT and the intention to engage in physical travels [43].
Gen Z is a generation that requires a special approach within the context of tourism. According to Denzon [44], these persons are strongly oriented towards social media that offer knowledge about places to visit, as well as those sources that can provide engaging content to peers. Research has also documented future Gen Z trends to include the following: (a) prioritizing wellness and self-care during travel; (b) adapting travel strategies based upon social media content; (c) the ability to create appealing user-generated content; (d) supporting sustainability during travel (i.e., demand for sustainable accommodations, transportation, and activities); (e) innovations that enhance the travel experience (e.g., VR technology); and (f) digital platforms that heighten the online discoverability of travel destinations and accompanying services [44]. Travelperk [45] confirms these statements and regards Gen Z as representing the “next generation of travelers”, that have very distinct characteristics when compared to other generations. It also states that Gen Z travelers are highly oriented towards social media influencers [45,46]. According to the European Travel Commission [45,47], Gen Z travelers are more likely to participate in cultural exchange within visited communities, use technology, and discover new places. The Commission also states that, in the coming decade, these travelers “will grow and become the primary decision-makers in travel”.
Other research has investigated Gen Z travel behavior in terms of cultural heritage [48,49,50] and in general [51,52]. These research efforts provide support for those factors, trends, and characteristics previously discussed. The current article contributes to the topic as well, by substantiating the importance between the interconnection of VR, heritage, and sustainable tourism.
The main goal of this study was to determine the factors influencing the acceptance of VR exposures as effective sustainable tourism tools. To achieve this goal, pilot acceptability studies were prepared and conducted. Acceptability studies were conducted based on the authors’ VR application, accompanied by a survey crafted for VR needs. The following research questions were posed:
RQ1. Do respondents see the positive role of VR in sustainable tourism?
RQ2. Can VR be accepted by respondents as a substitute for onsite tourism?
RQ3. Can VR encourage respondents to visit real heritage sites?
RQ4. How VR can help to improve the sustainability of tourism?
RQ5. What are the threats of using VR as a part of sustainable tourism?
2. Materials and Methods
This section is divided into subsections describing study design (respondents, and procedure), VR application (historical setting, technologies used, and mechanics), questionnaire design (questions, and consistency), and data analysis (tools and methods of data analysis). No generative artificial intelligence (GenAI) has been used in this paper to generate text, data, or graphics, or to assist in study design, data collection, analysis, or interpretation.
2.1. Study Design
The research utilized a virtual tour test application. The study involved completing a survey about VR and the role it can play in tourism, VR sessions, and supplementing the survey with participants’ impressions of the session. If the VR session changed their minds, participants were given the opportunity to change their initial answers. Before the study, each participant was made familiar with the purpose of the study, the main theme of the VR session, and the main theme of the study. The survey questions were supplemented with a free-form verbal interview about the impressions of each participant. Conclusions from these conversations were also attached to the main survey.
The target group for the study consisted of students enrolled at the Lublin University of Technology. Their age range being between 18–26 years old corresponds to the Gen Z segment. Such young tourists, especially engineering studies participants, show increasing tourist activity mixed with curiosity and mature awareness of technology. The authors believe that these mixture of characteristics may result in very constructive, sometimes critical, feedback.
Research procedure is presented in Figure 1. The first step was respondent (participant) preselection, when people with obvious contraindications (e.g., health issues) to participating in a VR session, or uninterested in the research topic, were excluded from the study. The second step was study presentation, when respondents were informed about the research purpose. Basic notions, like sustainable tourism, etc., were explained as well. During the explanation, statements that may influence respondent’s choices were avoided. The third step was signing documents, when respondents signed all necessary consents and declarations. These documents were archived. It was possible to drop participation in the research at this stage—the respondent was interviewed about the reasons later. The next step was pre-survey—its content is described in another subsection, “pre” because it was conducted before the virtual tour. The next step was VR tour—setting and VR application are described in another subsection. If the respondents were tired, sleep-deprived, or hungry (according to brief informal interview), they were not allowed to participate in the VR session on that day—they were asked to come back later in proper condition. Respondents were instructed on how to participate in the virtual tour using the VR laboratory equipment. The time of virtual tour was not officially limited, although assumed duration was below 30 min. No signs of rushing (either of any time limit) were given to a respondent. It was respondent’s choice whether he stood or seated during the VR session. At any stage of the virtual tour, a respondent could drop participation in the research, e.g., due to unexpected symptoms of cybersickness—the respondent was interviewed about the reasons later. Each virtual walk was documented and archived. Next, the post-survey was conducted. Respondent was given the same questionnaire (and a pen of different color) as in the case of pre-survey. Two benefits of such approach may be mentioned—being able to see whether participation in the virtual walk changed respondent’s opinions and more efficient coping with respondents in the VR laboratory. During pre- and post-survey, statements that may influence respondent’s choices were avoided. Survey questionnaires were archived. At last, unstructured interview was conducted, to reveal knowledge, facts, thoughts, and/or reasons that may have not been expressed on a survey questionnaire. Finally, archiving activities were performed, to keep experiment data.
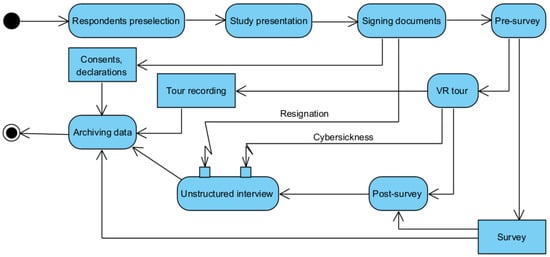
Figure 1.
Research procedure.
2.2. VR Application
The VR tour, that is one of the central points of this study, was based on the virtual tour application created by the Lab3D (part of the Department of Computer Science, Lublin University of Technology) members. Tour participants were using VR goggles to visit the Pahlavon Mahmud mausoleum, that was reconstructed in virtual reality from 3D scans of the real place acquired by the Lab3D members. The mausoleum is a memorial monument situated in the Itchan Kala (Old Town) area in Khiva, Uzbekistan (Figure 2). The whole complex has a total area of 50 × 30 m, and consists of the inner mausoleum chambers and the courtyard. It was originally built in 1664 over a grave of Pahlavon Mahmud, a local poet, whose tomb is considered a sacred place by some Uzbeks and Turkmens. The place is frequently visited by regular tourists and even pilgrimed to [53].
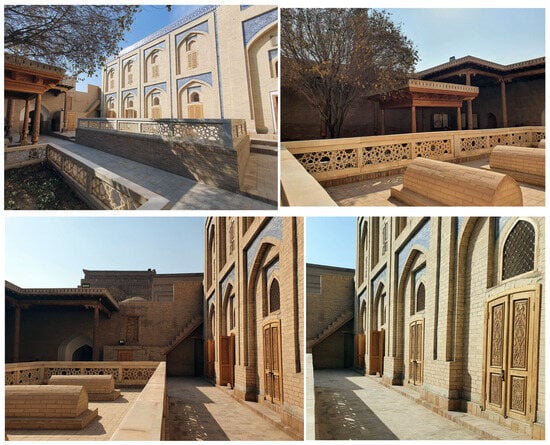
Figure 2.
Photographs of the Pahlavon Mahmud mausoleum from different perspectives, taken by the Lab3D members. The photographs show the original scenery, that was moved to the virtual reality.
The VR application is constructed of a single scene in Unity, where only the scanned building is available to visit, without any additional elements. It was built from scratch using Unity 3D engine and its Virtual Reality platform (Figure 3).
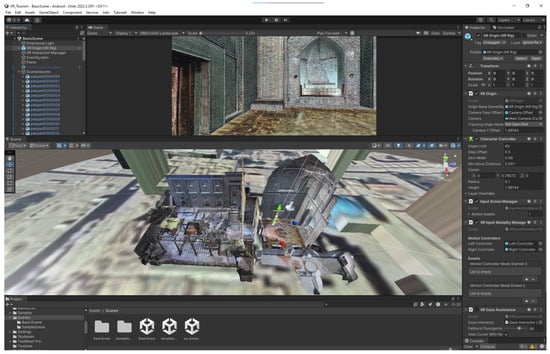
Figure 3.
Unity environment while constructing the VR application being a tour over the Pahlavon Mahmud mausoleum.
The 3D scanning process of the mausoleum has been conducted during the 5th Scientific Expedition of Lublin University of Technology to Central Asia in 2021, using the methodology described in [54]. The 3D data have been gathered using Faro Focus S350 TLS (terrestrial laser scanner) device. Dense, colorized point clouds were acquired of the inner chambers and the courtyard open-air interior. These data enabled creation of the VR mesh models of the central chamber (version 1 in 2022) and the whole complex interior (version 2 in 2024).
The VR application did not restrict users from free-roaming. It put the greatest emphasis only on the ability to visit a foreign place. The main scene consisted of the scanned interior and courtyards, and artificial lighting (aligned with the date and time of acquiring the 3D scans). An XR device support was also added. The application was prepared using generic XR support assets, to achieve interoperability with a broad range of VR headsets (Figure 4). During the study, HTC Vive Pro 2 devices were used; however the application was also compatible with other OpenXR headsets, such as Meta Quest Pro.
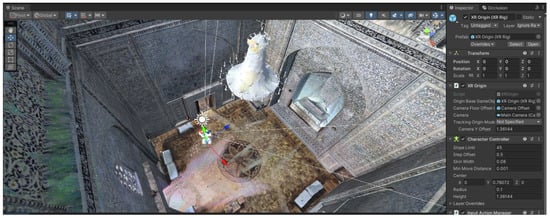
Figure 4.
Example of a scene in the VR application being a tour over the Pahlavon Mahmud mausoleum.
2.3. Survey Questionnaire Design
As was already mentioned, the study participants were surveyed before and after they performed sightseeing in virtual reality, via the application described in Section 2.2. Pre- and post-survey were filled in with different color, to see the preferences change.
While creating the survey questionnaire, the inspiration was taken from the work of Sagnier et al. [55] titled “User Acceptance of Virtual Reality: An Extended Technology Acceptance Model”. The authors did not copy the approach (did not follow all the guidelines and principles of the original); rather, they tried to address the main areas appointed in the mentioned work, while, at the same time, struggling to answer research questions posed in their article, related to factors determining VR and heritage mix as an effective sustainable tourism tool.
The survey questionnaire began with questions concerning respondents’ background. It started with demographic data: country of origin, age, field of study, student status, and gender. The mix of open and closed questions was used. Next, the questionnaire asked about experience in VR techniques usage and attitude towards heritage and sustainable tourism. This part included multi-choice questions (e.g., for picking purposes of using VR techniques) and closed questions, asking to rate some aspect, using the scale from 1 (the worst) to 5 (the best), with 3 being neutral. The following section asked about satisfaction regarding technical aspects of using VR techniques for the heritage purposes, including interface, quality, and elements of virtual walk, as well as the extent of a cybersickness. Next, open questions were asked about advantages, disadvantages, and possible applications of VR in terms of heritage and sustainable tourism. At last, questions about satisfaction level and VR techniques applications in the context of sustainable tourism were posed. This part included closed questions, using the scale from 1 (the worst) to 5 (the best), with 3 being neutral.
The last part of the survey questionnaire was especially important, as it is directly related to searching for answers to the following question: Does VR fulfill a positive role in the context of sustainable tourism? Other general questions that are addressed by the questionnaire are as follows: How does VR relate to onsite tourism? What are the pros and cons of such coexistence? What is blocking VR usage? The questionnaire should also be a useful source of knowledge for what background led respondents to expressing particular statements and ideas.
The survey questionnaire was designed to be slightly more comprehensible than presented, for the purpose of subsequent research goals posed in further articles. Despite the demographics, for the purposes of this article, the following questions were selected:
- Q7—To what extent are you interested in tourism topics? 1–5 (Not interested at all–Very interested)
- Q8—To what extent are you interested in heritage topics? 1–5 (Not interested at all–Very interested)
- Q10—What is your experience with virtual reality techniques? 1–5 (I have no previous experience–I am living in virtual reality)
- Q11—How frequently do you visit heritage sites? ((a) I am not visiting them at all, (b) Once for a few years, (c) Few times a year, (d) Few times a month, (e) Few times a week, and (f) Everyday)
- Q14—How much do you like exploring new (from the perspective of your experience) technologies? 1–5 (Definitely NOT at all–Definitely VERY much)
- Q15—Do you think that virtual reality solutions are easy to use—how hard was it for you? 1–5 (Definitely easy–Definitely difficult)
- Q16—Do you think that virtual reality solutions are useful in terms of sustainable tourism? 1–5 (Definitely NO–Definitely YES)
- Q17—Do you think that you can use virtual reality solutions to participate in sustainable tourism? 1–5 (Definitely NO–Definitely YES)
- Q18—To what extent you find virtual reality solutions attractive? Keep in mind their purpose being heritage and sustainable tourism. 1–5 (Definitely NOT attractive–Definitely VERY attractive)
- Q19—How much joy was brought to you, thanks to the participation in our virtual walk? 1–5 (NO joy at all–A LOT of joy)
- Q20—Did you like the interface quality of our virtual reality solution? 1–5 (Definitely NO—Definitely YES)
- Q21—Did you feel “present” during our virtual walk? “Presence” can be explained as “a state of consciousness, the (psychological) sense of being in the virtual environment”. 1–5 (Definitely NO–Definitely YES)
- Q22—Are you happy with the extent to which the technology (used for the purpose of making our virtual reality solution) is capable of creating an illusion of reality? 1–5 (Definitely NO–Definitely YES)
- Q23—Did you feel any cybersickness symptoms while participating in our virtual walk? 1–5 (NOT at all–VERY)
- Q25—Do you think that a virtual walk could make you want to visit a real heritage site? 1–5 (Definitely NO–Definitely YES)
- Q31—Based on your whole experience, what is your level of satisfaction with onsite tourism? 1–5 (Very low satisfaction–Very high satisfaction)
- Q32—Based on your whole experience, what is your level of satisfaction with virtual tourism? 1–5 (Very low satisfaction–Very high satisfaction)
- Q33—Based on your whole experience, do you think that virtual reality techniques fit well to the trend of tourism sustainability? 1–5 (NOT at all–VERY well)
Due to the specifics of the questionnaire construction, biases related to language (questionnaires were written in English) and question interpretation problems were expected. English was chosen as commonly known international language, that is taught on many education levels, including first years of university studies. The mentioned problems were counteracted by the presence of a research supervisor, who explained language intricacies and reacted to questions regarding the sense (purpose) of questions. The supervisor knew that his actions cannot impose ideas on the study participants and be another source of bias.
2.4. Data Analysis
Box plots (including 1st and 3rd quartile, median, minimum, and maximum), histograms, and pie charts were used to graphically present the data. Due to the ordinal nature of the analyzed variables, nonparametric tests were used. When comparing two independent groups, the Mann–Whitney U test was used. To compare two nominal variables, the Chi-square test was used, and Goodman’s Kruskal Tau test to check for effect size (strength of association). The asymptotic significance test of the Spearman correlation coefficient was used for correlations between variables. Statistical significance was set at p < 0.05. The results were analyzed using R 4.4.2 (R Core Team, R Foundation for Statistical Computing, Vienna, Austria).
Table 1 presents the ranges of the correlation coefficient, based on which the correlation strength categories, used to interpret the results, were determined. Similar ranges are commonly acknowledged in the literature.

Table 1.
Classification of correlation strength based on the absolute value of the correlation coefficient.
It was important for the survey questionnaire to be internally consistent; thus, the Cronbach’s alpha test was performed. The test involved questionnaire questions (and answers to them) that were picked for the purpose of this article—the scale of answers was unified to meet the test requirements. The alpha value, saying that the consistency is acceptably correct, is frequently set as 0.7 [56].
In order to check whether it is possible to predict a person’s attitude towards the use of VR in sustainable tourism development, based on the answers given to the remaining survey questions, a decision tree was used. Decision trees work by recursively splitting the data into subsets that maximally reduce uncertainty. The C5.0 algorithm was used. This model extends the classification algorithms developed by Ross Quinlan. The number of boosting iterations was set to 100 and the best model (providing the shortest paths) was used.
3. Results
This section presents the descriptive and exploratory statistics performed on the gathered data. As was mentioned before, the internal consistency of the survey questionnaire was checked with Cronbach’s alpha test, and reached the threshold of being fairly acceptable, i.e., 0.733.
3.1. Descriptive Statistics
In total, feedback from 57 study participants was gathered: 55 persons originating from Poland, 1 from Ukraine, and 1 from Belarus. All of them were students of Lublin University of Technology: 3 of them were studying Multimedia Engineering, while the rest of them (54 persons) were Computer Science students; 47 persons were attending Bachelor’s degree studies, 9 persons Master’s degree studies, and, finally, 1 person did not provide such information (Figure 5A); and 50 men and 7 women participated in the study (Figure 5B). The age of respondents varied from 20 years old to 24 years old (Figure 6A).
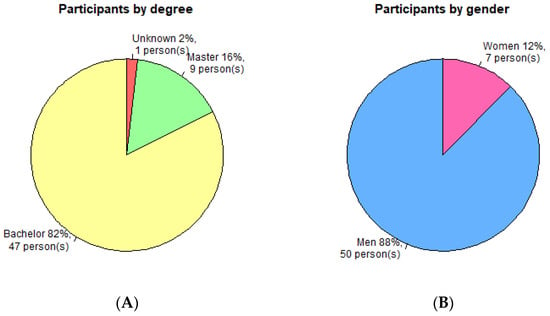
Figure 5.
Division of participants by degree of studies (A) and gender (B).
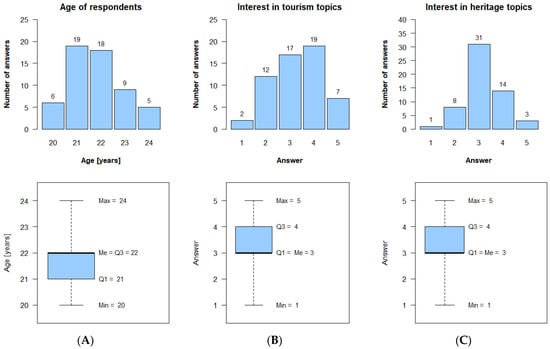
Figure 6.
Histograms and box plots depicting distribution of answers regarding (A) the age of respondents, (B) interest in tourism topics—Q7, and (C) interest in heritage topics—Q8.
The distribution of answers to selected questions is presented in Figure 6, Figure 7, Figure 8, Figure 9, Figure 10, Figure 11 and Figure 12. The respondents expressed fair interest in tourism and heritage topics; most of their answers are located between the second and the third quartile. See Figure 6 for details. The respondents were, in general, highly satisfied with the specificity of onsite tourism (73% of them gave an answer of at least 4; see Figure 10C), although most of them declared that they visited heritage-related places once every a few years, or a few times a year (respectively, 50% and 36% of them; see Figure 12).
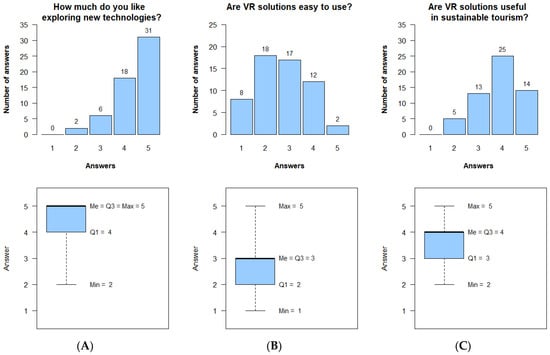
Figure 7.
Histograms and box plots depicting distribution of answers regarding (A) liking to explore new technologies—Q14, (B) easiness of VR solutions use—Q15, and (C) usefulness of VR solutions in sustainable tourism—Q16.
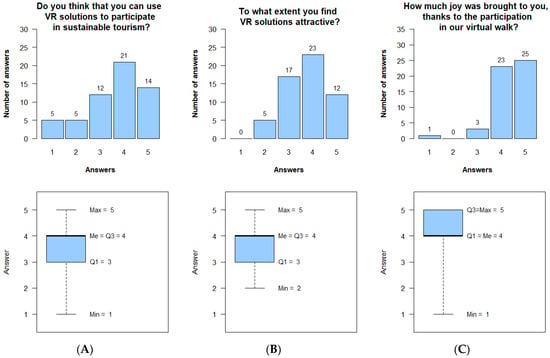
Figure 8.
Histograms and box plots depicting distribution of answers regarding (A) use of VR solutions to participate in sustainable tourism—Q17, (B) VR solutions attractiveness—Q18, and (C) joy brought to a person thanks to the participation in the VR tour—Q19.
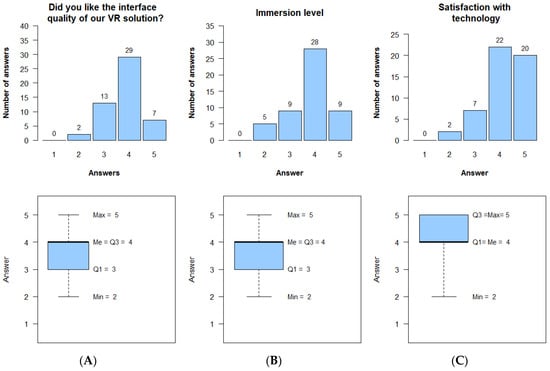
Figure 9.
Histograms and box plots depicting distribution of answers regarding (A) quality of the VR tour user interface—Q20, (B) immersion level—Q21, and (C) satisfaction with technology—Q22.
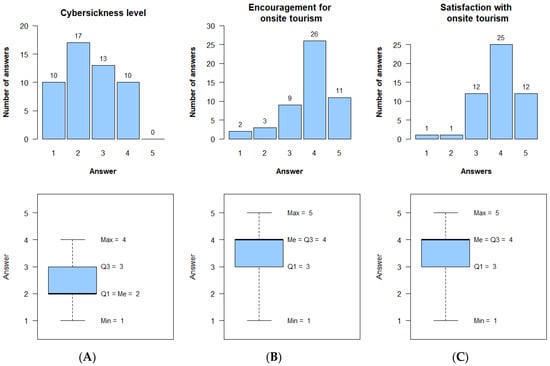
Figure 10.
Histograms and box plots depicting distribution of answers regarding (A) cybersickness level—Q23, (B) encouragement for onsite tourism—Q25, and (C) satisfaction with onsite tourism—Q31.
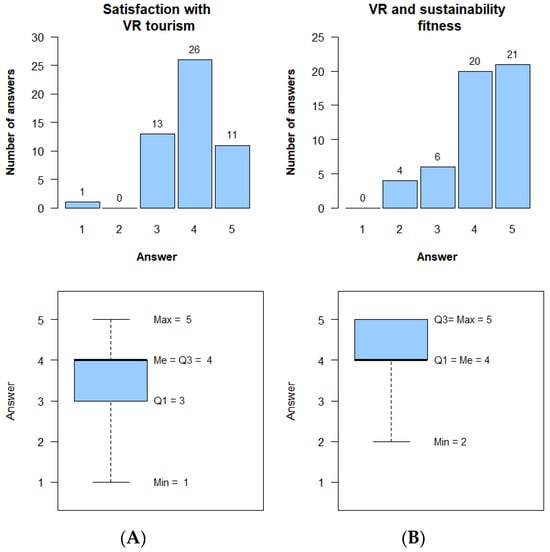
Figure 11.
Histograms and box plots depicting distribution of answers regarding (A) satisfaction with VR tourism—Q32, and (B) VR and sustainability fitness—Q33.
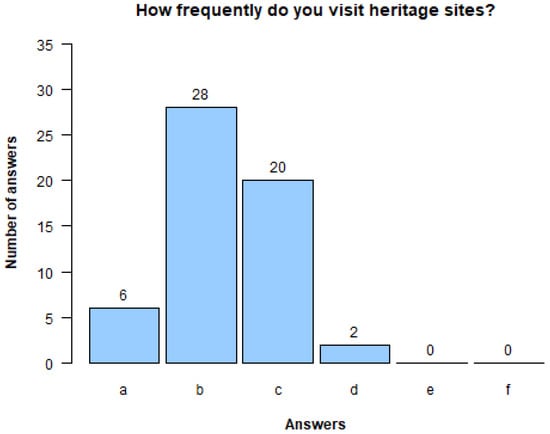
Figure 12.
Histogram of answers regarding frequency of visiting heritage sites—Q11 ((a) I am not visiting them at all, (b) Once for a few years, (c) Few times a year, (d) Few times a month, (e) Few times a week, and (f) Everyday).
The respondents were quite enthusiastic about exploring new technologies (75% of them gave an answer of at least 4; see Figure 7A), VR solutions’ attractiveness (61% of them gave an answer of at least 4; see Figure 8B), and joy brought to them by participation in the VR tour (92% of them gave an answer at least 4; the authors did not encourage them to give good grades; see Figure 8C); however, they perceived the VR solution as being moderately difficult to use (54% of them gave an answer of 3 or more; exceptionally, 1 means the most easy; see Figure 7B). Unfortunately, the procedure of participation in the VR tour is typical for modern solutions, and the expressed level of complexity cannot be avoided. The respondents think that VR solutions are useful in sustainable tourism (68% of them gave an answer of at least 4; see Figure 7C), and that they can use these solutions for such purpose (75% of them gave an answer of at least 3; see Figure 8A).
Despite seeing the VR tour interface as not the most favorite and the easiest one to use (71% of them gave an answer of at least 4; see Figure 9A), the respondents claimed very high satisfaction with the technology (82% of them gave an answer of at least 4; see Figure 9C), and high immersion level (73% of them gave an answer of at least 4; see Figure 9B).
Despite a moderate manifestation of cybersickness (60% of them experienced mild (answer 2) and moderate (answer 3) symptoms; see Figure 10A), taking into account their whole-life experiences, the respondents were highly satisfied with the concept of VR tourism (73% of them gave an answer of at least 4; see Figure 11A), and thought that VR and sustainable tourism are a very good match (80% of them gave an answer of at least 4; see Figure 11B). They even stated that VR tours may be successful in encouraging people to sightsee the real places (73% of them gave an answer of at least 4; see Figure 10B).
3.2. Exploratory Analysis
In order to search for the dependencies in data that are important for answering the research questions, the statistical tests, correlation coefficients, and decision tree were calculated. How all these relate to answering the research questions is broadly explained in the Discussion section of this article. As a result of the correlations and a decision tree, it was possible to reveal at least some of the motivations behind the respondents’ answers.
No dependencies were found between the studied degree and the other survey questions, after testing it with the Chi-square and Goodman’s Kruskal Tau. The same result was obtained in the case of dependencies between gender and the other survey questions. Each time, the p-value was far higher than 0.05, or the tau value close to zero, or both. Moreover, no significant differences were found in the responses to the questions regarding satisfaction with onsite tourism (Q31) and satisfaction with VR tourism (Q32) (p-value = 0.933, Mann-Whitney U test, with the alternative hypothesis that there are differences).
Table 2 presents statistically significant correlations of a meaningful strength between the survey questions used for the purpose of this article. Columns contain the numbers of correlated questions, the rho value, the p-value, and the explanation as to how one question influences the other one. The content of Table 2 was visually presented in Figure 13, which constitutes the correlation matrix between questions, where only significant (p-value < 0.05) correlations of at least moderate strength (rho of at least 0.3) are visible. The survey questions Q15 and Q23 are reverse-scaled (positive to negative) compared to the other questions (negative to positive).

Table 2.
Spearman’s correlations computed for the survey questions.
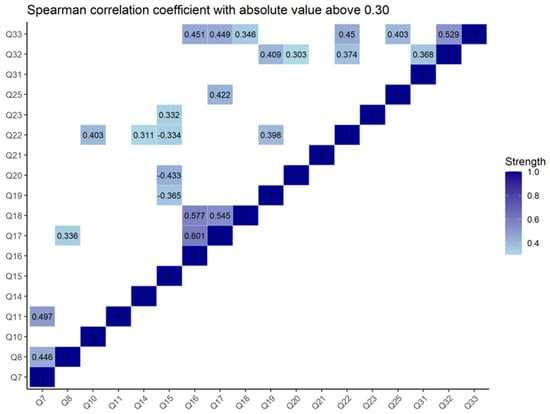
Figure 13.
Spearman correlation coefficient matrix.
In order to predict (at least to some extent), on a scale of 1–5, based on several questions, a person’s attitude towards the use of VR in sustainable tourism development (Q33), a classification (decision) tree was built. It has an accuracy of up to two possible answers at the end of the path; i.e., at the end of each path, one specific answer is indicated, or, in the case where this was not possible, two answers with the probability of each of them occurring (see Figure 14). Based on the collected data, it was not possible to build a tree that would determine all paths with the accuracy of one specific answer. A stratified 10-fold cross-validation was conducted to evaluate the model’s performance. An average classification accuracy of 57.8% was obtained across all runs. Notably, more than half of the cases exceeded a 60% accuracy, indicating that the model can achieve a reasonable predictive performance. The median Cohen’s Kappa of 0.28 reflects a fair agreement beyond chance, suggesting that the model captures meaningful patterns in the data. These results indicate that, while the overall performance is modest, the model demonstrates consistent potential.
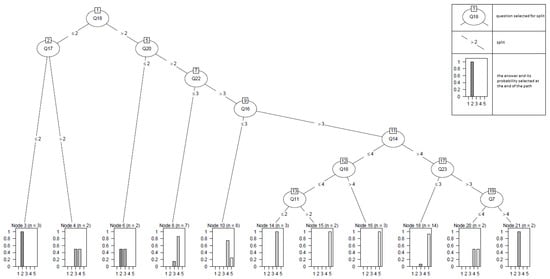
Figure 14.
Decision tree showing the path to answering the survey question Q33. The graph at the end of each path shows the probability of obtaining a specific answer (1–5) from that path.
The most positive answers (4 or 5) to Q33 are associated with a more positive general attitude (Q18) and satisfaction with VR technology (Q20 and Q22), interest in new technologies (Q14), general interest in tourism and cultural heritage (Q7 and Q11), and openness to using VR in sustainable tourism (Q16 and Q17). An interesting result is that the severity of cybersickness symptoms (Q23) did not have a very negative impact on the answers. Despite the occurrence of strong symptoms, even, the final answer to Q33 was high on the scale.
4. Discussion
This article posed five research questions related to the main goal of the study, which was determining the acceptance of VR exposures as effective sustainable tourism tools. In the following subsections, the answers to these questions are discussed.
These research questions reflect aspects important for the community that were revealed during discussions accompanying the authors’ heritage digitization and dissemination activities. Research question 1 is the most general one, asking if it is worth it to consider using VR as a tool of sustainable tourism, while the other research questions dive into the specific aspects (discussing bright sides and shades) important for the community.
4.1. Research Question 1
RQ1 was stated as follows: “Do respondents see the positive role of VR in sustainable tourism?”. In the authors’ opinion, the answer is yes.
A data analysis revealed that 80% of the study participants gave 4 and 5 as the answer to the survey question Q33, stating, this way, that virtual reality techniques fit well (or even very well) to the trend of tourism sustainability.
Moreover, a statistical analysis of other data revealed the following statistically significant, positive correlations of moderate strength (listed in descending order by strength) between VR techniques’ fitness to the trend of tourism sustainability (Q33) and (a) the level of satisfaction with virtual tourism (Q32), (b) the capability of technology to create an illusion of reality (Q22), (c) the ability to participate in sustainable tourism via VR solutions (Q17), (d) VR solutions’ usefulness in terms of sustainable tourism (Q16), (e) inspiration by VR to visit a real heritage site, and (f) the attractiveness of VR solutions in the context of heritage and sustainable tourism (Q18).
The decision tree that was built upon the gathered survey data was used to identify factors influencing respondents when answering question Q33 (about VR techniques’ fitness to the trend of tourism sustainability). The most influential factors are enclosed in the following survey questions: (a) Q18—those who find VR solutions more attractive (in the context of heritage and sustainable tourism) will give higher grades for Q33, and (b) Q22—those who value the better capability of technology to create an illusion of reality will give higher grades for Q33. The factors of minor influence on the Q33 answer value are enclosed in the following survey questions: (a) Q16—those who give slightly better grades for the VR solutions’ usefulness in terms of sustainable tourism will also give slightly higher grades for Q33, (b) Q14—those who like to explore new technologies more will give slightly lower grades for Q33 (assumed to have a more critical assessment of the technology), (c) Q7—those who are more interested in tourism topics will give slightly lower grades for Q33 (assumed to have a more critical assessment of the VR tour content), and (d) Q11—those who visit heritage sites more frequently will give slightly higher grades for Q33 (supposedly taking into account mobility/travel challenges).
4.2. Research Question 2
RQ2 was stated as follows: “Can VR be accepted by respondents as a substitute for onsite tourism?”. In the authors’ opinion, the answer is no. The current state of VR technology allows it to support onsite sustainable tourism, but not to replace the onsite tourism entirely. It is confirmed by this and other studies conducted by the authors.
Referring to the respondents’ opinions expressed during the study in interviews and open questions, most of them see VR exposures as one of the sustainable tourism tools. It can be used for planning activities, picking interesting places to visit, supplementing historical knowledge, or as a technological curiosity. They do not currently see VR as the substitute for onsite tourism. However, what about the future? What should be addressed to provide successful (well-acknowledged and enjoyable) VR tours?
The survey questionnaire contained questions asking about the acceptance rate, such as Q32 (idea and technology level), Q22 (technology level), and Q21 (immersion level). In answer to Q32, the respondents graded their level of satisfaction with virtual tourism, which was overall moderate (4 in 51% of cases, and 3 in 25% of cases). In answer to Q22, the respondents graded well the capability of the technology to create an illusion of reality (5 in 39% of cases, and 4 in 43% of cases). In answer to Q21, respondents graded their immersion level as fair (4 in 55% of cases). The answers to Q21 and Q22 may suggest that the respondents, due to their background, are aware of the current technological limitations and capabilities; thus, they rated the VR application as complying with modern standards, although they still noticed significant gaps in immersion (which is currently typical).
The Mann–Whitney test showed with statistical significance: if someone rated the level of satisfaction with onsite tourism highly (Q31), then the level of satisfaction with virtual tourism was rated highly as well (Q32). It finds confirmation in the data of statistical correlations as well.
A statistical analysis of the gathered data revealed some statistically significant, positive correlations of moderate strength. Particularly noteworthy correlations are between the level of satisfaction with virtual tourism (Q32) and (a) the joy brought by the participation in the VR tour (Q19), (b) the quality of the VR tour user interface (Q20), (c) the capability of the technology to create an illusion of reality (Q22), (d) and the level of satisfaction with onsite tourism (Q31). Other correlations are between the capability of the technology to create an illusion of reality (Q22) and (a) the experience with VR solutions (Q10), (b) the frequency of visiting heritage sites (Q11), (c) liking to explore new technologies (Q14), (d) VR solutions’ ease of use (Q15), and (e) the joy brought by the participation in the VR tour (Q19). Question Q21 does not correlate with others.
4.3. Research Question 3
RQ3 was stated as follows: “Can VR encourage respondents to visit real heritage sites?”. In the authors’ opinion, the answer is yes. The current state of VR technology allows it to support onsite sustainable tourism. Some of relationships between onsite and virtual tourism, confirming the authors’ answer, have been already explored in the previous subsections.
A data analysis revealed that 51% of the study participants gave 4 and 22% gave 5 as the answer to the survey question Q25, stating, this way, that a virtual walk could make a person want to visit a real heritage site. This is a noteworthy part of the answer to RQ3.
A statistical analysis of other data revealed a statistically significant, positive correlation of moderate strength between the willingness to visit a real heritage site after the VR tour (Q25) and the readiness to participate in sustainable tourism via VR solutions (Q17). Other statistically significant, positive correlations of moderate strength were found between the degree of interest in heritage topics (Q8) and (a) the attractiveness of VR solutions in the context of heritage and sustainable tourism (Q18), and (b) the degree of interest in tourism topics (Q7).
4.4. Research Question 4
RQ4 was stated as follows: “How VR can help to improve the sustainability of tourism?”. The most important part of the answer is whether VR technologies have a chance to become an element of sustainable tourism. This part, in the context of the respondents’ answers, was answered positively. It is also a starting point for new organizational and social possibilities.
In the authors’ opinion, the use of VR can contribute to a more conscious planning of trips by tourists—it may include planning (even at home) the initial routes, lists of interesting monuments/places/objects to see, or even being able to perform part of the trip in a virtual form. Local authorities can gain the ability to plan onsite infrastructure, based on the analysis of the traffic (within the Internet or inside VR) generated by the users of VR materials. A more rational and thoughtful management of tourist traffic, incorporating VR-related data, will support preserving the original state/shape of heritage for future generations, which is one of the sustainability goals.
Another advantage of presenting heritage in virtual form is widening access to that heritage, e.g., for people excluded from travelling. Exclusion may result from a person’s physical limitations, or restrictions imposed by local governments on particular persons, or not being wealthy enough to pay travel expenses, or being afraid of foreign places.
The possibility of charging fees for using digitized materials in a differentiated manner gives the local community an opportunity to preserve generating income from the heritage they possess. Digital content usually can more easily gain a broader audience than its analog (real-life) version, which may generate even bigger revenue. The earned money can be used for implementing other sustainability measures.
4.5. Research Question 5
RQ5 was stated as follows: “What are the threats of using VR as a part of sustainable tourism?”. These threats may be related to the following:
- Not being able to handle onsite, in a sustainable way, the increased tourist traffic, generated by the popularity of a digital version of heritage;
- In the case of particular places in very specific circumstances, totally replacing onsite tourism with its virtual form, leading to the worst scenario: loss of work places;
- The threat of the digital exclusion of people not being able to take VR tours, due to the health issues, age, wealth, or personal preferences;
- The unsupervised and unlimited development of VR solutions may lead to presenting heritage in a way not originally wanted by local societies or violating property rights to the digital version of the actual heritage.
An interesting factor preventing people from using VR tours is cybersickness, which is unexpectedly common. According to the survey, question Q23, 34% of respondents claimed to have mild symptoms, 26% moderate symptoms, and 20% strong symptoms. Cybersickness symptoms, in almost all cases, did not prevent respondents from participating in the VR tour. A statistical analysis revealed a statistically significant, positive correlation of moderate strength between the cybersickness level (Q23) and declared VR solutions’ ease of use (Q15), which is quite a natural dependency.
4.6. Comparison with Other Studies
It may seem that virtual tourism can be such an authentic and satisfying experience that it becomes an alternative to onsite tourism [42], but the authors disagree with this statement. The current state of VR technology allows it to support onsite sustainable tourism but not entirely replace it. In the authors’ opinion, VR can encourage respondents to visit real heritage sites. A similar statement was presented by Hoang et al. [43]. They stated that VR technology can be used as a tool to enhance the tourism industry by providing a more immersive and enjoyable experience for tourists, which can lead to increased visit intentions and repeat visits to destinations. In another study, VR was even identified as a form of advertising [57]. In this sense, it creates inspiration for all those who want to go on vacation but have not yet found the right destination. Therefore, as a result, VR can contribute to more thoughtful trip planning, thus supporting sustainable tourism, which is consistent with the authors’ study.
One factor preventing people from using VR tours may be cybersickness. In a study by Sagnier et al. [55], the intention to use VR is negatively influenced by cybersickness; the worse the symptoms are, the less willing they are to use VR. This is consistent with the authors’ results; however, as long as these symptoms are mild or moderate, participants may be still satisfied with their VR experience.
Many articles on VR and sustainable tourism rely solely on surveys based on past experiences or focus on an analysis of the available literature. Few articles are based on studies in which participants take part in some kind of VR experience provided by the researchers. However, some studies utilize an initial introduction to VR technology and subsequent online surveys. For example, Jiang et al. [58] studied the impact of virtual technologies on tourist reuse behavior and social sustainability using a sample of 409 participants in a semi-controlled experiment. Similar research using “a quasi-experimental design with 937 cases” can be found in the works of Sharma et al. [42]. In the authors’ study, the survey was combined with a controlled VR tour, which improved the reliability of the collected responses.
Surugiu et al. [59] investigated if VR, according to the Gen Z, is suitable for the promotion of tourism. A survey on 447 persons revealed that the possibility of virtual exploration may engage Gen Zs, enhance satisfaction, and foster loyalty. At the same time, Ülker et al. [60] claimed that VR addresses both hedonic and utilitarian consumption. Oyunchimeg et al. [61] analyzed the feedback from 202 Gen Z respondents, in terms of travel-related attitudes, motivations, and decisions. The relationship between VR usability and travel decisions was revealed. As the result, the incorporation of VR technology into tourism marketing strategies targeting young tourists was considered. Abdul Rahman [62] explores the acceptance of VR for accessing tourism product information among Gen Zs. Based on analyses of 100 questionnaires, he concluded there was a willingness to use VR as an important part of the tourism activities of young people.
Although the works of these and other authors mention different aspects of Gen Z, VR, travel, and tourism, they lack a strong focus on sustainability aspects of such interconnection, and the consequences arising from it. The current article addresses all these threads in one place, in a way that is not seen in the literature. According to the authors, respondents see the positive role of VR in sustainable tourism as well. The novelty is the strong focus on sustainability and seeking the factors that may make a VR solution successful, that was not emphasized by the cited works.
Some of the works try to investigate the factors, mainly from a sociological perspective, that cause a VR solution to be perceived as successful. To mention a few examples, Bilińska et al. [63] investigated the trend of online tourism (a topic a lot broader than just VR)—will the interest level be preserved and how the things will evolve? In total, 380 persons from Poland took part in the study. Moreover, the areas in which VR has particular usefulness were identified, including education, accessibility, and heritage protection. Calderón-Fajardo et al. [64] investigated metaverse adoption patterns in tourism among Gen Z and Millennials. The conclusions put an emphasis on “the need to develop immersive and personalised experiences that attract consumers”, and “focus on innovation (…) enabling tourism companies to capture the attention”. On the other hand, Zhu et al. [65], based on the study involving 509 Gen Zs being questioned, concluded that “functional value (immersive presence and convenience), emotional value (enjoyment), epistemic value (curiosity and novelty), social value (online social interaction), and conditional value (the overcrowded form of tourism) are positively related to user satisfaction with VR tourism”.
The current article is oriented on (explore) the specific coexistence of technology and sustainability—which is unique. Gen Zs involved in the research are able to provide high-quality feedback during the technology evaluation by being the coherent group of technical university students and participating in a fully controlled laboratory experiment involving the use of a state-of-the-art VR solution. No other work was found that asks exactly the same questions as the current article, in the context of answering the question as to whether virtual reality techniques fit well to the trend of tourism sustainability. It emerged, not only from the authors’ own experiences, that a VR solution of low quality may discourage a tourist from the whole concept. For that purpose, a decision tree was developed in order to support discovering what is important for creating a successful VR solution that will support sustainable tourism.
When compared to the existing literature, the current article contributes by responding through contact with the technology, field experimentation, and specific indications of technology applications, not through sociological theories and mass surveys. The UNESCO site 3D scan was used as the scenery for a VR walk—this particular site was never shown before in such way. In the authors’ opinion, the VR application is of decent visual quality (although still of worse visual quality than the real place) when compared to other authors, for example, [66,67]. This is due to research that indicates the importance of the visual quality of VR on the intention to use it [68]. At last, a fresh set of ideas from the authors’ own experience (what are the threats and opportunities of VR usage in the context of sustainable tourism?) was provided.
Finally, the authors agree that VR is fairly well-investigated, although not in the context of the simultaneous interconnection of Gen Z and sustainable tourism, which is the scope of this article.
5. Conclusions
The main goal of this study was to determine the factors influencing the acceptance of VR exposures as effective sustainable tourism tools. To achieve this goal, the above-described acceptability studies were prepared. The VR application, a virtual walk across Pahlavon Mausoleum complex in Khiva, Uzbekistan, was presented to the study participants (Gen Z), who were surveyed before and after the walk. Acceptability studies were conducted based on the authors’ VR application, accompanied by a survey crafted for VR needs.
The main conclusions include the following: The study participants see the positive role of VR in sustainable tourism. VR tourism will not entirely replace onsite tourism—the authors and the study participants believe in the coexistence of these two approaches, and the supporting role of VR solutions. The identified factors lead to the assumption that VR usage may both encourage or discourage people to some particular heritage, depending on its technical and historical quality. Using VR brings new benefits in terms of sustainable tourism, such as home-based trip planning, tourist traffic prediction, gaining additional revenue for local societies, and addressing people excluded from traveling. Among the threats to the tourism sustainability, the unintended use of digital heritage, the legal aspects of managing property rights, and being the victim of success (overcrowding onsite heritage places) can be mentioned.
The state of the technology allows us to create appealing VR tours. They can even be based on 3D scans of entire scenes, including the buildings, small/medium objects, and surroundings. Nevertheless, they still have problems with full immersion; thus, the atmosphere of the original place cannot be fully reproduced.
6. Limitations, and Recommendations for Future Research
The research results, i.e., opinions expressed and performance of respondents during the VR session, may depend on the psychical and physical condition of a respondent. In order to counteract this bias, respondents who were tired, sleep-deprived, or hungry were not allowed to participate in the VR session on that day—they were asked to come back later in proper condition. Persons that might be severely affected by the cybersickness were not allowed to participate in a VR session at all.
It is a common situation that, when respondents fill in a survey, they have no chance to correct their opinions later. In this case, respondents filled in the survey before and after the VR session, in order to catch the change in their attitude. It was also a chance to obtain more reliable opinions in the case of respondents who had very low true experience with VR technologies, despite declaring a higher one.
The number of respondents is limited to 57, and all of them are students of Lublin University of Technology. However, it has to be noted that this research involved participation in a VR session carried out in a laboratory room under the supervision of a researcher. Such an experiment setup is very time-consuming, as the total time includes the following: VR session (up to 30 min per respondent), filling in a survey (two times), preparing a room and equipment, and, finally, data postprocessing. The stationary nature of the experiment is a source of difficulties in obtaining a more geographically spread and representative group. This is also the reason why other VR-related works indicate the study participants in the tens, not in the hundreds, such as [69,70]. If the research is only about gathering opinions through surveys, then it is relatively easy to scale up the number of respondents to the hundreds or even the thousands.
The survey was written in English. It should not be problematic for the respondents, as they were learning the English language as a part of their studies at the Lublin University of Technology. Nevertheless, a respondent could always ask a researcher for support. Moreover, from the beginning, the research background was introduced to respondents, including an explanation of sustainability and sustainable tourism. At last, the survey was validated with the Cronbach’s alpha test.
The respondents involved in the research were students of Multimedia Engineering (3 persons) and Computer Science (54 persons). This may introduce bias due to their educational background. Both degree courses are conducted at the same faculty, that is, the Faculty of Electrical Engineering and Computer Science, Lublin University of Technology. According to the survey results, the profiles of both groups do not vary in an extraordinary way. The Multimedia Engineering students belonged to Gen Z, had a technical background, and even declared that they had a short contact with VR technologies.
The authors are aware that, in order to provide fully generalizable results, a bigger and more diversified group of respondents is needed. This is one of the main topics for future works.
The already gathered material includes varied feedback from the respondents. It may be used for developing a set of recommendations on how to build appealing VR tours. It may include aspects like music, sounds, textual descriptions, visual characteristics, the way of moving across the scenery (e.g., clipping through the walls or not), and many more.
Finally, the Department of Computer Science (Lublin University of Technology), as a result of the intensive heritage 3D digitization activities, is able to use 3D TLS scans of historical building complexes as the main scenery for other VR tours. In parallel, a better visual quality and higher level of immersion should be pursued.
Author Contributions
Conceptualization, M.M., K.Ż., and S.P.S.; methodology, M.M., and K.Ż.; software, M.B., and S.P.S.; validation, S.P.S., A.L.D., K.Ż., T.S., and M.B.; formal analysis, A.L.D., and K.Ż.; investigation, T.S., S.P.S., and M.B.; resources, S.P.S., M.B., and T.S.; data curation, A.L.D., K.Ż., and S.P.S.; writing—original draft preparation, K.Ż., A.L.D., S.P.S., and M.M.; writing—review and editing, M.M., K.Ż., A.L.D., and S.P.S.; visualization, A.L.D., K.Ż., S.P.S., M.B., and T.S.; supervision, S.P.S., M.M., and K.Ż.; project administration, M.M.; funding acquisition, M.M., and S.P.S. All authors have read and agreed to the published version of the manuscript.
Funding
This research received no external funding.
Institutional Review Board Statement
The study was conducted in accordance with the Declaration of Helsinki, and approved by the Ethics Committee of the Lublin University of Technology (protocol code 11/2024, date of approval 3 July 2024).
Informed Consent Statement
Informed consent was obtained from all subjects involved in the study.
Data Availability Statement
The original contributions presented in this study are included in the article. Further inquiries can be directed to the corresponding author.
Conflicts of Interest
The authors declare no conflicts of interest.
References
- Shekhar, C. The Impact of Tourism on Local Communities: A Literature Review of Socio-Economic Factors. J. Harbin Eng. Univ. 2023, 44, 1851–1859. [Google Scholar] [CrossRef]
- Sun, D.; Zhou, Y.; Ali, Q.; Khan, M.T.I. The Role of Digitalization, Infrastructure, and Economic Stability in Tourism Growth: A Pathway towards Smart Tourism Destinations. Nat. Resour. Forum 2025, 49, 1308–1329. [Google Scholar] [CrossRef]
- World Tourism Organization (UNWTO); United Nations Development Programme (UNDP). Tourism and the Sustainable Development Goals—Journey to 2030; World Tourism Organization (UNWTO): Madrid, Spain, 2017; ISBN 978-92-844-1940-1. [Google Scholar] [CrossRef]
- Amoiradis, C.; Velissariou, E.; Stankova, M. Tourism as a Socio-Cultural Phenomenon: A Critical Analysis. J. Soc. Political Sci. 2021, 4, 10–21. [Google Scholar] [CrossRef]
- Tran, L.T.T. Metaverse-Driven Sustainable Tourism: A Horizon 2050 Paper. Tour. Rev. 2025, 80, 349–359. [Google Scholar] [CrossRef]
- Kęsik, J.; Miłosz, M.; Montusiewicz, J.; Żyła, K. Towards an Easy-to-Implement Method of Obtaining 3D Models of Historical Wooden Churches Using a Combination of Modern Techniques. Muzeol. A Kultúrne Dedičstvo 2025, 13, 113–137. [Google Scholar] [CrossRef]
- Luo, J.; Jian, I.Y.; Yung, E.H.K.; Chan, E.H.W.; Chen, W. Pursuing Social Cohesion in Cultural Tourism Destinations: Liminality as a Mediator. Curr. Issues Tour. 2024, 27, 2499–2515. [Google Scholar] [CrossRef]
- Csurgó, B.; Smith, M.K. Cultural Heritage, Sense of Place and Tourism: An Analysis of Cultural Ecosystem Services in Rural Hungary. Sustainability 2022, 14, 7305. [Google Scholar] [CrossRef]
- Abbas, J.; Mamirkulova, G.; Al-Sulaiti, I.; Al-Sulaiti, K.I.; Dar, I.B. Mega-Infrastructure Development, Tourism Sustainability and Quality of Life Assessment at World Heritage Sites: Catering to COVID-19 Challenges. Kybernetes 2024, 54, 1993–2018. [Google Scholar] [CrossRef]
- Hussain, A.; Mandić, A.; Fusté-Forné, F. Transforming Communities: Analyzing the Effects of Infrastructure and Tourism Development on Social Capital, Livelihoods, and Resilience in Gilgit-Baltistan, Pakistan. J. Hosp. Tour. Manag. 2024, 59, 276–295. [Google Scholar] [CrossRef]
- Batool, N.; Wani, M.D.; Shah, S.A.; Dada, Z.A. Tourists’ Attitude and Willingness to Pay on Conservation Efforts: Evidence from the West Himalayan Eco-Tourism Sites. Environ. Dev. Sustain. 2024, 27, 18933–18951. [Google Scholar] [CrossRef]
- Ferdowsi, S. Management of Geoheritage Conservation and Vulnerability in Tourism Destinations. Tour. Rev. 2024, 80, 601–623. [Google Scholar] [CrossRef]
- Dodds, R.; Butler, R. The Phenomena of Overtourism: A Review. Int. J. Tour. Cities 2019, 5, 519–528. [Google Scholar] [CrossRef]
- Pásková, M.; Wall, G.; Zejda, D.; Zelenka, J. Tourism Carrying Capacity Reconceptualization: Modelling and Management of Destinations. J. Destin. Mark. Manag. 2021, 21, 100638. [Google Scholar] [CrossRef]
- Pham, K.; Andereck, K.L.; Vogt, C.A. Overtourism: A Potential Outcome in Contemporary Tourism—Causes, Solutions, and Management Challenges. In Sustainable Development and Resilience of Tourism; Chhabra, D., Atal, N., Maheshwari, A., Eds.; Springer: Cham, Switzerland, 2024; pp. 187–206. ISBN 978-3-031-63145-0. [Google Scholar] [CrossRef]
- Yang, E.; Smith, J.W. Tourism Supply and Demand in the Gateway Communities of Southeastern Utah (USA). J. Destin. Mark. Manag. 2024, 32, 100899. [Google Scholar] [CrossRef]
- Koh, E. The End of Over-Tourism? Opportunities in a Post-COVID-19 World. Int. J. Tour. Cities 2020, 6, 1015–1023. [Google Scholar] [CrossRef]
- Chengo, M.; Bitok, J.; Maingi, S.W. Crowd Management, Risk Assessment Strategies and Sports Tourism Events in Nairobi County, Kenya. J. Hosp. Tour. Manag. 2024, 7, 46–66. [Google Scholar] [CrossRef]
- Chiwaridzo, O.T.; Masengu, R. AI Technologies for Personalized and Sustainable Tourism; IGI Global Scientific Publishing: Hershey, PA, USA, 2024; ISBN 979-8-3693-5678-4. [Google Scholar] [CrossRef]
- Padin, C. A Sustainable Tourism Planning Model: Components and Relationships. Eur. Bus. Rev. 2012, 24, 510–518. [Google Scholar] [CrossRef]
- Mammadova, A.; May, S.M.; Tomita, Y.; Harada, S. Synergies and Conflicts in Dual-Designated UNESCO Sites: Managing Governance, Conservation, Tourism, and Community Engagement at Mount Hakusan Global Geopark and Biosphere Reserve, Japan. Land 2025, 14, 488. [Google Scholar] [CrossRef]
- Żyła, K.; Montusiewicz, J.; Skulimowski, S.; Kayumov, R. VR Technologies as an Extension to the Museum Exhibition: A Case Study of the Silk Road Museums in Samarkand. Muzeol. A Kultúrne Dedičstvo 2020, 8, 73–93. [Google Scholar] [CrossRef]
- Milosz, M.; Skulimowski, S.; Kęsik, J.; Montusiewicz, J. Virtual and Interactive Museum of Archaeological Artefacts from Afrasiyab—An Ancient City on the Silk Road. Digit. Appl. Archaeol. Cult. Herit. 2020, 18, e00155. [Google Scholar] [CrossRef]
- Kouroupi, N.; Metaxas, T. Can the Metaverse and Its Associated Digital Tools and Technologies Provide an Opportunity for Destinations to Address the Vulnerability of Overtourism? Tour. Hosp. 2023, 4, 355–373. [Google Scholar] [CrossRef]
- Kim, J.-H.; Kim, M.; Park, M.; Yoo, J. How Interactivity and Vividness Influence Consumer Virtual Reality Shopping Experience: The Mediating Role of Telepresence. J. Res. Interact. Mark. 2021, 15, 502–525. [Google Scholar] [CrossRef]
- Calisto, M.d.L.; Sarkar, S. A Systematic Review of Virtual Reality in Tourism and Hospitality: The Known and the Paths to Follow. Int. J. Hosp. Manag. 2024, 116, 103623. [Google Scholar] [CrossRef]
- Wagner, A.; de Clippele, M.-S. Safeguarding Cultural Heritage in the Digital Era—A Critical Challenge. Int. J. Semiot. Law—Rev. Int. Sémiot. Jurid. 2023, 36, 1915–1923. [Google Scholar] [CrossRef]
- Liu, Y.; Liu, J.; Argyriou, A.; Ma, S.; Wang, L.; Xu, Z. 360-Degree VR Video Watermarking Based on Spherical Wavelet Transform. ACM Trans. Multimed. Comput. Commun. Appl. 2021, 17, 38. [Google Scholar] [CrossRef]
- Mehraj, S.; Mushtaq, S.; Parah, S.A.; Giri, K.J.; Sheikh, J.A. A Robust Watermarking Scheme for Hybrid Attacks on Heritage Images. J. Ambient Intell. Humaniz. Comput. 2023, 14, 7367–7380. [Google Scholar] [CrossRef]
- Chong, H.T.; Lim, C.K.; Rafi, A.; Tan, K.L.; Mokhtar, M. Comprehensive Systematic Review on Virtual Reality for Cultural Heritage Practices: Coherent Taxonomy and Motivations. Multimed. Syst. 2022, 28, 711–726. [Google Scholar] [CrossRef]
- Kozieł, G.; Malomuzh, L. 3D Model Fragile Watermarking Scheme for Authenticity Verification. Adv. Sci. Technol. Res. J. 2024, 18, 351–365. [Google Scholar] [CrossRef] [PubMed]
- Koziel, G. Simplified Steganographic Algorithm Based on Fourier Transform. Adv. Sci. Lett. 2014, 20, 505–509. [Google Scholar] [CrossRef]
- Koziel, G. Fourier Transform Based Methods in Sound Steganography. Actual Probl. Econ. 2011, 120, 321–328. [Google Scholar]
- Gutiérrez, J.; García-Palomares, J.C.; Romanillos, G.; Salas-Olmedo, M.H. The Eruption of Airbnb in Tourist Cities: Comparing Spatial Patterns of Hotels and Peer-to-Peer Accommodation in Barcelona. Tour. Manag. 2017, 62, 278–291. [Google Scholar] [CrossRef]
- Department of Economic and Social Affairs. Sustainable Tourism. Available online: https://sdgs.un.org/topics/sustainable-tourism (accessed on 22 June 2025).
- Talwar, S.; Kaur, P.; Nunkoo, R.; Dhir, A. Digitalization and Sustainability: Virtual Reality Tourism in a Post Pandemic World. J. Sustain. Tour. 2023, 31, 2564–2591. [Google Scholar] [CrossRef]
- Talwar, S.; Kaur, P.; Escobar, O.; Lan, S. Virtual Reality Tourism to Satisfy Wanderlust without Wandering: An Unconventional Innovation to Promote Sustainability. J. Bus. Res. 2022, 152, 128–143. [Google Scholar] [CrossRef]
- Wu, Q.; Li, M.-Q.; Wang, J.-H. Behavioral Intentions in Metaverse Tourism: An Extended Technology Acceptance Model with Flow Theory. Information 2024, 15, 632. [Google Scholar] [CrossRef]
- Dacko, S.G.; Shora, L. Exploring Tourists’ Intentions to Use VR for Sustainable Tourism. In Management, Tourism and Smart Technologies. ICMTT 2024; Rocha, Á., Montenegro, C., Pereira, E.T., Victor, J.A.M., Ibarra, W., Eds.; Lecture Notes in Networks and Systems; Springer: Cham, Switzerland, 2024; Volume 1191, ISBN 978-3-031-74827-1. [Google Scholar] [CrossRef]
- Mavrin, I.; Turșie, C.; Lupșa Matichescu, M. Exploring Sustainable Tourism Through Virtual Travel: Generation Z’s Perspectives. Sustainability 2024, 16, 10858. [Google Scholar] [CrossRef]
- Revankar, S. Gen Z Statistics–What We Know About This Generation? (2025). Electro IQ. Available online: https://electroiq.com/stats/gen-z-statistics/ (accessed on 31 July 2025).
- Sharma, I.; Lim, W.M.; Aggarwal, A. Virtual Reality as a Sustainable Alternative for Authentic and Satisfying Tourism Experiences. Tour. Recreat. Res. 2024, 1–13. [Google Scholar] [CrossRef]
- Hoang, S.D.; Dey, S.K.; Tučková, Z.; Pham, T.P. Harnessing the Power of Virtual Reality: Enhancing Telepresence and Inspiring Sustainable Travel Intentions in the Tourism Industry. Technol. Soc. 2023, 75, 102378. [Google Scholar] [CrossRef]
- Denzon, G. Exploring Generation Z Travel Trends: A Guide for Tour Operators. Available online: https://www.ticketinghub.com/blog/gen-z-travel-trends (accessed on 15 July 2025).
- 30+ Gen Z Travel Statistics & Trends [2025 Update]. Available online: https://www.travelperk.com/blog/gen-z-travel-statistics-trends/ (accessed on 15 July 2025).
- de Jong, A. Understanding Gen Z Travel Needs and Demands. Available online: https://goodtourisminstitute.com/library/gen-z-travel/ (accessed on 15 July 2025).
- Study on Generation Z Travellers. Available online: https://etc-corporate.org/reports/study-on-generation-z-travellers/ (accessed on 15 July 2025).
- Wu, G.-M.; Chen, S.-R.; Xu, Y.-H. Generativity and Inheritance: Understanding Generation Z’s Intention to Participate in Cultural Heritage Tourism. J. Herit. Tour. 2023, 18, 465–482. [Google Scholar] [CrossRef]
- Komarac, T.; Ozretić Došen, Đ. Understanding Virtual Museum Visits: Generation Z Experiences. Mus. Manag. Curatorship 2024, 39, 357–376. [Google Scholar] [CrossRef]
- Handarkho, Y.D.; Khaerunnisa; Cininta, M. The Impact of Protection Motivation and Place Attachment on Gen-Z’s Intent to Participate in World Heritage Site Preservation Using ICT. J. Cult. Herit. Manag. Sustain. Dev. 2025; ahead-of-print. [Google Scholar] [CrossRef]
- Marques, J.; Gomes, S.; Ferreira, M.; Rebuá, M.; Marques, H. Generation Z and Travel Motivations: The Impact of Age, Gender, and Residence. Tour. Hosp. 2025, 6, 82. [Google Scholar] [CrossRef]
- Sharma, M.; Rawat, N.; Joshi, S.; Misra, A. Assessing the Role of Destination and Nature-Based Destination Image in Gen Z Solo Travellers pro-Sustainable Tourism Behaviour: The Moderating Role of Social Media Influencers Trust. Qual. Quant. 2025, 1–21. [Google Scholar] [CrossRef]
- Pahlavon Mahmud Complex. Available online: https://en.wikipedia.org/w/index.php?title=Pahlavon_Mahmud_Complex&oldid=1266131325 (accessed on 22 June 2025).
- Kęsik, J.; Żyła, K.; Montusiewicz, J.; Miłosz, M.; Neamtu, C.; Juszczyk, M. A Methodical Approach to 3D Scanning of Heritage Objects Being under Continuous Display. Appl. Sci. 2023, 13, 441. [Google Scholar] [CrossRef]
- Sagnier, C.; Loup-Escande, E.; Lourdeaux, D.; Thouvenin, I.; Valléry, G. User Acceptance of Virtual Reality: An Extended Technology Acceptance Model. Int. J. Hum.–Comput. Interact. 2020, 36, 993–1007. [Google Scholar] [CrossRef]
- Lance, C.E.; Butts, M.M.; Michels, L.C. The Sources of Four Commonly Reported Cutoff Criteria: What Did They Really Say? Organ. Res. Methods 2006, 9, 202–220. [Google Scholar] [CrossRef]
- Oncioiu, I.; Priescu, I. The Use of Virtual Reality in Tourism Destinations as a Tool to Develop Tourist Behavior Perspective. Sustainability 2022, 14, 4191. [Google Scholar] [CrossRef]
- Jiang, C.; Phoong, S.W.; Moghavvemi, S. Cultural Odyssey in the Metaverse: Investigating the Impact of Virtual Technologies on Tourist Reuse Behavior and Social Sustainability. Humanit. Soc. Sci. Commun. 2025, 12, 866. [Google Scholar] [CrossRef]
- Surugiu, C.; Grădinaru, C.; Surugiu, M.-R. Drivers of VR Adoption by Generation Z: Education, Entertainment, and Perceived Marketing Impact. Adm. Sci. 2025, 15, 41. [Google Scholar] [CrossRef]
- Ülker, S.V.; Sümer, B.N.; Sönmez Kence, E.; Hızlı Sayar, F.G. Psychophysiological Investigation of the Effects of Virtual Reality, the New Dimension of Retail Shopping, on Generation Z. Int. J. Hum.–Comput. Interact. 2024, 41, 3926–3939. [Google Scholar] [CrossRef]
- Oyunchimeg, L.; Enkhjargal, D.; Bilguunjargal, Z.; Gantuya, N. Virtual Reality and Its Implication for Destination Marketing—A Case Study of Generation Z. Geogr. Issues 2025, 25, 68–83. [Google Scholar] [CrossRef]
- Abdul Rahman, A. Virtual Reality Acceptance in Tourism Product Information: A Study among Young Travelers in Pulau Pangkor, Perak. Asian J. Prof. Bus. Stud. 2025, 6. [Google Scholar] [CrossRef]
- Bilińska, K.; Pabian, B.; Pabian, A.; Reformat, B. Development Trends and Potential in the Field of Virtual Tourism after the COVID-19 Pandemic: Generation Z Example. Sustainability 2023, 15, 1889. [Google Scholar] [CrossRef]
- Calderón-Fajardo, V.; Puig-Cabrera, M.; Rodríguez-Rodríguez, I. Beyond the Real World: Metaverse Adoption Patterns in Tourism among Gen Z and Millennials. Curr. Issues Tour. 2025, 28, 1261–1281. [Google Scholar] [CrossRef]
- Zhu, Y.; Li, J.; Han, X.; Wang, R.; Wang, C.; Pu, C. Embracing the Future: Perceived Value, Technology Optimism and VR Tourism Behavioral Outcomes Among Generation Z. Int. J. Hum.–Comput. Interact. 2024, 41, 2337–2351. [Google Scholar] [CrossRef]
- Beck, J.; Rainoldi, M.; Egger, R. Virtual Reality in Tourism: A State-of-the-Art Review. Tour. Rev. 2019, 74, 586–612. [Google Scholar] [CrossRef]
- Rauscher, M.; Humpe, A.; Brehm, L. Virtual Reality in Tourism: Is it ‘Real’ Enough? Acad. Tur. 2020, 13, 127–138. [Google Scholar] [CrossRef]
- Yersüren, S.; Özel, C.H. The Effect of Virtual Reality Experience Quality on Destination Visit Intention and Virtual Reality Travel Intention. J. Hosp. Tour. Technol. 2024, 15, 70–103. [Google Scholar] [CrossRef]
- Innocente, C.; Nonis, F.; Lo Faro, A.; Ruggieri, R.; Ulrich, L.; Vezzetti, E. A Metaverse Platform for Preserving and Promoting Intangible Cultural Heritage. Appl. Sci. 2024, 14, 3426. [Google Scholar] [CrossRef]
- Ki, S.; Park, S.; Ryu, J. The Effects of Classroom Management Efficacy on Interest Development in Guided Role-Playing Simulations for Sustainable Pre-Service Teacher Training. Sustainability 2025, 17, 6257. [Google Scholar] [CrossRef]
Disclaimer/Publisher’s Note: The statements, opinions and data contained in all publications are solely those of the individual author(s) and contributor(s) and not of MDPI and/or the editor(s). MDPI and/or the editor(s) disclaim responsibility for any injury to people or property resulting from any ideas, methods, instructions or products referred to in the content. |
© 2025 by the authors. Licensee MDPI, Basel, Switzerland. This article is an open access article distributed under the terms and conditions of the Creative Commons Attribution (CC BY) license (https://creativecommons.org/licenses/by/4.0/).