Abstract
During the transition of culture-featured district planning from static conservation to innovation-driven models, existing research remains constrained by mechanistic paradigms, reducing districts to functional containers and neglecting human perceptual interactions and meaning-production mechanisms. This study explores and quantifies the generative mechanisms of spatial communicability and cultural dissemination efficacy within human-centered frameworks. Grounded in humanistic urbanism, we analyze Harbin Central Street as a case study integrating historical heritage with contemporary vitality, developing a tripartite communicability assessment framework comprising perceptual experience, infrastructure utility, and behavioral dynamics. Machine learning-based threshold analysis reveals that spatial encoding elements govern communicability through significant nonlinear mechanisms. The conclusion shows synergies between street view-quantified greenery visibility and pedestrian accessibility establish critical human-centered design thresholds. Spatial data analysis integrating physiologically sensed emotional experiences and topologically analyzed spatial morphology resolves metric fragmentation while examining spatial encoding’s impact on interaction efficacy. This research provides data-driven decision support for sustainable urban renewal and enhanced cultural dissemination, advancing heritage sustainability.
1. Introduction
Currently, conservation theories for culture-featured districts are becoming increasingly mature, with numerous protection frameworks emerging. However, in practice, efforts often prioritize physical restoration and commercial benefit enhancement while neglecting the sustainability of living cultural heritage transmission and the cultivation of community agency. Most cases remain at the primary stage of “conservation-oriented development,” failing to deeply integrate new quality productive forces—such as big data and artificial intelligence—into the organic renewal of districts. Nor have they achieved truly people-centered sustainable development in governance. Thus, integrating a people-centered approach is urgently required to support the conservation and revitalization of these culture-featured district.
Systematic global research on culture-featured districts emerged in the mid-20th century amid profound transformations in urban heritage conservation paradigms. M.R.G. Conzen (1960) pioneered the “Town-Plan Analysis” methodology, deconstructing historic districts as diachronic accumulations of three core elements: street systems, property plots, and building footprints, thereby establishing the morphological foundation for holistic conservation [1]. Jane Jacobs (1961), in The Death and Life of Great American Cities, demonstrated how community cultural genes embedded in old buildings constitute the essential carriers of “street communicability” [2]. Concurrently, in the urban renewal of Bologna, Italy, in the early 1970s, it pioneered the “anti-gentrification” model, ensuring that low-income original residents were not displaced, establishing itself as a global exemplar of resident participatory conservation [3]. Across the late 20th–early 21st century transition, Jeremy C. Wells (2017) exposed a fundamental flaw in traditional heritage conservation: its focus on static material preservation fails to accommodate dynamically evolving community affective values [4]. He proposed the Adaptive Regulatory Framework (ARF), which reconstructs heritage governance paradigms through a three-stage mechanism of “value identification–conflict mediation–elastic regulations” [4]. Collectively, these studies catalyzed a paradigm shift from monument-focused preservation toward sustaining living cultural spaces.
Building upon this global context, Chinese scholars developed localized innovations. Ruan Yisan (1986) established a three-tiered conservation framework encompassing “historic urban form–historic districts–heritage monuments,” which elevated holistic conservation to national policy [5]. Its principle of “strict prohibition of large-scale demolition” fundamentally shaped China’s ethical approach to district revitalization [5]. Zhang Song (2001) subsequently introduced dynamic conservation theory, critiquing static museum-style preservation while advancing the principles of “continuity of everyday life” and “living transmission of intangible heritage” [6]. These concepts guided practical transformations—evidenced in projects like Suzhou’s Pingjiang Road—from physical restoration toward cultural ecosystem conservation [6]. Together, these scholars constructed China’s distinctive “spatial–cultural dual-dimensional conservation theory system.”
Contemporary culture-featured district practice marks a paradigm shift from conservation priority to innovation-driven development. Theoretically, Zhang Xinmei (2007) revealed its essence as the integration of regional cultural genes through programmatic elements, spatial planning, and community participation to create place-based yet globally attractive public spaces [7]. Policy-wise, Shenzhen’s 2022 regulations on culture-featured districts formally define these districts as “spatial complexes featuring specialized industry clusters, integrated functional convergence, and diverse morphological richness,” mandating deep integration of cultural distinctiveness with contemporary lifestyles [8]. Practically, Chengdu’s Zaozixiang Traditional Medicine culture-featured district demonstrates breakthrough innovation through its “medical–wellness–tourism–education–dining” thematic programming, transforming traditional medicine into modern living practices—proving cultural gene reactivation serves as the core medium for communicability [9].
However, prevailing research predominantly focuses on physical conservation techniques and cultural symbol translation, neglecting deeper analysis of human perception, interaction, and meaning-making mechanisms within spaces. However, in his book A Pattern Language, Christopher Alexander constructed a universal design language through 253 “patterns”. This achieved a breakthrough shift from a “mechanistic” approach towards humanism: it critiqued modernist architecture for being detached from its users and advocated that “it is the inhabitants themselves who are the best designers of their own environments”, thereby enabling ordinary people to participate in shaping buildings, neighborhoods, and cities [10]. Based on Christopher Alexander’s core urban design theory that feeling is a key indicator of spatial wholeness, Yodan Rofé developed the “emotional mapping” method [11]. This approach involves real-time annotation and statistical analysis of residents’ environmental emotions during neighborhood walks. It reveals significant cross-demographic consensus in spatial perceptions, with negative feelings frequently linked to poor maintenance, safety threats, or spatial fragmentation [12]. These findings validate Alexander’s hypothesis that “shared feelings reflect spatial order.” When understanding spaces, people first perceive and internalize the “pattern language” of an area. The “perceptual mapping” technique then visualizes these distinct pattern languages. Our study methodologically draws inspiration from this framework. The core of genius loci lies in activating collective unconscious memories of homeland through communicable spatial syntax.
More broadly, contemporary urban theories collectively advocate a return to “human-centered space”. Leon Krier (The Architecture of Community, 2009) condemns modernist functional segregation and auto-dominance, advocating community rebuilding via functional hybridity, pedestrian scale, and typological revival to make cities “human habitats” that cohere society [13]. Ann Sussman (Cognitive Architecture, 2015) decodes design through neuroscience: exceptional architecture must activate evolutionarily embedded biological instincts—such as facial recognition bias, shelter-seeking needs, and biophilic tendencies—establishing scientific benchmarks for “human-centered design” [14]. Carlos Moreno’s “The 15 minute City” (2021) concept restructures life within temporally compressed, walkable radii integrating living, working, service, and ecological functions, achieving triple sustainability through digital coordination and democratic governance—ultimately transforming cities into “life containers” for daily emotional exchange [15]. Michael Mehaffy (A New Pattern Language for Growing Regions, 2020) advances a dynamic evolution framework proposing a “generative pattern operating system” to replace mechanical planning. By defining interaction rules between patterns, urban spaces continuously adapt to ecological, social, and technological changes, enabling resilient development and meaning accumulation [16]. These theories expose critical blind spots in current cultural district practice: while Shenzhen’s policy pursues “diverse morphological richness” and Zaozixiang focuses on “programmatic innovation,” districts must transcend physical/commercial functions to become true “communicative media” that activate collective emotions and daily interactions.
Consequently, this study proposes the “spatial communicability” framework, with Alexander’s “The Quality Without A Name” as its philosophical core, transcending the material conservation/cultural performance dichotomy [17]. It achieves deep dialogue through three pathways: sensory resonance (aligning with Sussman’s neurocognitive mechanisms), behavioral activation (rooted in Krier’s community vitality [13], and Moreno’s spatiotemporal convenience [15]), and meaning co-creation (continuously evolving within Mehaffy’s dynamic patterns [16]). Ultimately, district spaces become living vessels where diverse actors co-create collective memory. The “communicative city” paradigm converges multidimensional insights from media ecology, cultural studies, and sociology, emerging as a critical lens for examining publicness. It is grounded in human experiences intrinsically linked to communication practices throughout urban development [18], with its core focus being the communicative ecology of urban society [19]. The conceptual exploration of the “communicative city” traces back to 1997, when Kunzmann pioneered early investigations into intra-urban information flow efficiency, depth of interpersonal interaction, and socio-cultural identity formation [20]. However, these foundational insights remained largely theoretical without substantive integration into spatial planning practices. Domestic research on communicative cities emerged later, gaining momentum at the 2012 “Communication and China: Fudan Forum” which positioned “communicative city” as its core conceptual framework. This initiative systematically bridged theoretical constructs with urban communication realities [21]. Building upon this foundation, Xie Jing (2015) established the essential conceptual parameters of communicative cities while delineating multidimensional urban communication imperatives and communicability requirements. Crucially, her research pioneered the design of evaluative dimensions and metrics for urban communicability, thereby constructing the inaugural assessment framework for communicative cities (as shown in Table 1) [22].

Table 1.
Evaluation system table for “communicable cities”.
He Guoping (2023) pioneered the application of communicability theory to culture-featured district, demonstrating its capacity to resolve transportation conflicts, participatory gaps, and linguistic barriers in Guangzhou through tripartite enhancement of public facilities, social participation, and cognitive identity [23]. This approach activated polyphonic coexistence via participatory governance, transitioning districts from spatial renewal toward emotional bonds—marking the first implementation of spatial communicability for culture-featured district quality enhancement. Concurrently, Guo Wei (2024) reconstructed Xi’an’s historic districts through communicability theory’s tripartite framework: geographic networks (spatial legibility), information networks (media narratives), and meaning networks (collective memory) [24]. This spatial mediation framework dissolved social estrangement in stranger societies, driving multi-agent integration and collective memory reproduction [24].
This study’s novelty lies in its deep roots in classical spatial theory. It creatively adapts Alexander’s critique of modernist “spatial alienation” [10]. This injects humanistic ideals into the evaluation framework. Architectural layouts and circulation systems become symbolic carriers of emotional resonance. This achieves a paradigm shift from mechanical functionalism to emotional vessels. Simultaneously, the study uses Lefebvre’s spatial production theory [25]. It builds a “material–practice–meaning” analytical framework. This framework analyzes the interplay between collective memory narratives, infrastructure, and resident behavior at the micro-scale. It reveals how spatial meaning is dynamically reproduced in the digital age. This theoretical integration leads to key breakthroughs. Methodologically, it turns Alexander’s pattern language [10] and Lefebvre’s triadic dialectic into dynamic diagnostic tools [25]. This moves beyond static descriptions in existing research. For governance, it develops an organic renewal model. This model couples emotional resonance intensity, spatial practice density, and meaning production activity. It promotes a shift in urban governance: from functionalist patching to humanistic value regeneration. The result is a spatial diagnostic paradigm. It combines theoretical critique with practical vitality. These findings establish the theoretical framework for spatial communicability dynamics. We therefore propose: Hypothesis 1 posits a threshold activation mechanism in spatial communicability, while Hypothesis 2 identifies human-scale parameters as positive moderators of this mechanism.
This study aims to (1) develop a quantitative assessment model integrating emotional experience (physiological sensing) and spatial morphology (topological analysis) to resolve indicator fragmentation; (2) decipher influence mechanisms of spatial configuration factors on interaction efficiency; and (3) extend space syntax theory’s behavioral prediction capacity—ultimately providing data-driven decision support for sustainable urban renewal and cultural dissemination. The core hypotheses posit the following: (1) spatial communicability exhibits critical activation thresholds constituted by POI mix entropy and architectural diversity, and (2) human-scale design parameters significantly enhance host–visitor interaction intensity through walkability network topology modulation.
2. Evaluation Indicators and Analysis Model Construction
2.1. Communication Evaluation Indicators and Empowerment Methods
2.1.1. Perception Evaluation Indicators
Satisfaction and sense of identity in activities encompasses the following. As the core of spatial activities, people tend to visit and engage in spaces that provide a good experience, which promotes the communicability of the space [26]. In view of this, this article uses the reputation rating data from Dianping to construct a model for measuring activity satisfaction and sense of identity (Formula (1)). Text sentiment value comprises the following. By assessing the level of people’s emotions in a space, one can more directly understand the vitality of that space [27]. Thus, we can understand the strength of the communicability of this space. Spaces that lead to higher emotions in people are often highly rated, attracting more visitors and enhancing urban communicability. This study utilizes the ROS-TCM6 semantic analytics platform and text mining algorithms to conduct sentiment analysis on Dianping user reviews. Performance evaluation was performed on 50,000 review sentences, yielding a Kappa coefficient of 0.81, with classification accuracy reaching 92.4% and Macro-F1 score of 0.83. Analysis of the confusion matrix revealed significant cross-category misclassification among sentiment labels. To ensure robustness in spatial analysis conclusions, semantically similar sentiment labels were consolidated into compound sentiment dimensions during final validation, while differentiated weighting strategies were implemented to accommodate spatial–semantic parsing requirements. Sentiment values were assigned to texts based on emotional keywords: positive values indicate favorable sentiment, negative values indicate critical sentiment, and zero denotes neutral sentiment. The sentiment score for each spatial unit was determined by calculating the mean value of all venue review sentiment scores within that unit [28].
In the formula, C represents activity satisfaction and sense of belonging. corresponds to the total sum of sentiment scores for all venues within spatial unit i, where these sentiment scores are derived from analyzing online textual reviews of each venue using the ROS-TCM6 semantic analytics platform. n denotes the number of venues within the spatial unit, with this count determined by the number of POI (point of interest) data points captured through technical extraction methods. Each standardized spatial unit covers a 30 m × 30 m area.
2.1.2. Infrastructure Evaluation Indicators
Infrastructure security. The safety of a culturally distinctive neighborhood is the cornerstone of its communicability [29]. A safe and worry-free environment can attract more visitors to stay and promote cultural exchange and interaction, thereby enhancing the overall vitality of the district. Conversely, if safety cannot be guaranteed, tourists’ willingness to communicate will be greatly reduced, affecting the cultural atmosphere and attractiveness of the district. The main indicators for assessing the safety of infrastructure selected in this article are the integrity rate of facilities, the coverage rate of safety facilities, and the completeness of barrier-free facilities (Formula (2)).
In the formula, is the overall safety score of spatial unit i, is the facility integrity rate of spatial unit i, is the weight of the facility integrity rate, is the safety facility coverage rate of spatial unit i, is the weight of the safety facility coverage rate, is the accessibility facility completeness of spatial unit i, and is the weight of the accessibility facility completeness.
Diversity of infrastructure. The diversity of cultural characteristic blocks is the soul of its communicability. A rich variety of cultural elements and business formats not only provide tourists with a diverse experience but also promote communication and understanding among people from different cultural backgrounds [30] and enhance the attractiveness and communicability of the block, making it a vibrant platform for cultural heritage and exchange. The main indicators for assessing the diversity of infrastructure selected in this article are diversity of living facilities and diversity of cultural facilities (Formula (3)).
In the formula, is the diversity score of spatial unit i, is the diversity score of living facilities in spatial unit i, is the weight of living facilities diversity, is the diversity score of cultural facilities in spatial unit i, and is the weight of cultural facilities diversity.
Accessibility of infrastructure. The accessibility of culturally distinctive neighborhoods is a prerequisite for their communicability. Convenient transportation, clear signage systems, and barrier-free facilities ensure that visitors can easily reach and smoothly explore [31]. Furthermore, it promotes the widespread dissemination and in-depth communication of neighborhood culture, making the neighborhood a true space for cultural sharing and communication. The main indicators for assessing the accessibility of infrastructure selected in this article are transportation convenience, accessibility of public facilities, and ease of access to service facilities (Formula (4)).
In the formula, is the accessibility score of spatial unit i, is the transportation convenience score of spatial unit i, is the weight of transportation convenience, is the accessibility score of public facilities for spatial unit i, is the weight of public facility accessibility, is the ease of access score of service facilities for spatial unit i, and is the weight of ease of access to service facilities.
2.1.3. Behavioral Activity Evaluation Indicators
Crowd dwell time. The dwell time of the crowd in a space is another key indicator of spatial communicability, reflecting the temporal continuity of spatial communicability [32]. This article uses the method of calculating the average activity duration of individuals within each spatial unit to demonstrate the intensity and persistence of communication (Formula (5)).
In the formula, , and represent the average residence time of individuals in spatial unit i within a month, the total residence time of the population, and the number of residents, respectively.
Frequency of crowd dwell time. The duration of the crowd’s stay in a space is a prerequisite for various activities, reflecting the space’s attractiveness to the crowd [33]. This study uses statistical data on the number of times people reside in a certain spatial unit over a one-month period to measure the communicability level of that space (Formula (6)).
In the formula, is the number of times the crowd stays in spatial unit i, is the total frequency of crowd stays within a month, and is the area of spatial unit i.
2.1.4. Communication Evaluation Index Weighting Method
This study employed the entropy method to construct an objective weighting system, significantly enhancing the scientific validity and objectivity of the evaluation model. The implementation procedure comprised four sequential phases. First, we standardized the raw data for secondary indicators like activity satisfaction and infrastructure safety. This step eliminated differences in measurement units (dimensional discrepancies) between different types of data (heterogeneous metrics), such as text sentiment scores and dwell time, making them comparable across dimensions. Secondly, we calculated the information entropy for each secondary indicator. Lower entropy values meant higher data variation and more information value, leading to higher weights (like infrastructure accessibility at 0.40). Conversely, higher entropy values (like infrastructure diversity at 0.28) meant similar data and thus lower weights. Subsequently, primary indicator weights, including infrastructure evaluation at 0.42, were determined via entropy-weighted averaging, reflecting the aggregated informational advantages of subordinate indicator clusters. Finally, a hierarchical weighting system was established through multiplicative integration of tiered weights, as demonstrated by the comprehensive weight for infrastructure safety (0.42 × 0.32 = 0.13440.42 × 0.32 = 0.1344). This data-driven methodology effectively minimizes subjective bias, ensuring that weight allocations such as perceptual evaluation at 0.25 and behavioral activity at 0.33 precisely align with the informational value hierarchy of indicators, thereby reinforcing the objectivity and interpretability of the evaluation framework at a methodological level (as shown in Table 2).

Table 2.
Weight value of communicability index for Harbin Central Street block.
2.2. Indicators of Factors Influencing the Spatial Information Encoding of Cultural Characteristic Blocks
Factors Influencing Spatial Information Encoding Indicators
Green visibility can reflect people’s perception of the quality of greenery and is an important measure of the level of streetscape [34], The pedestrian capacity of a street is a key indicator of the street’s connectivity, directly affecting the walkability of the street, resident interaction, and the vitality and charm of urban spaces [35]. Streets, as the core of urban public spaces, carry life, transportation, and interaction, and their safety directly affects the quality of the city and its connectivity [36]. Building density determines the openness of street space, affecting visual communication and the convenience of activities, which in turn influences the overall communicativeness and vibrancy of the street space. Architectural style shapes the characteristics of the street, affecting visual perception and emotional resonance, thereby promoting or hindering communication among people in the street space. The increased density of street intersections enhances neighborhood connectivity, improves spatial accessibility, and has a positive impact on the communicativeness of the neighborhood, promoting community interaction and development. The increased density of bus stops enhances the convenience of transportation in the neighborhood, facilitates the convergence of people, strengthens communication links within the neighborhood and with surrounding areas, and stimulates the vitality of the neighborhood. The increase in the density of public service facilities improves residents’ lives, enhances internal interactions within the community, promotes information flow, and effectively enhances the overall communication of the neighborhood. The mixed use of land types and the diversity of points of interest (POIs) enhance the communicability of the neighborhood, shorten information distances, and promote social interaction and spatial vitality [37]. Placing smart devices, screens, and broadcast gear wisely in unique cultural areas boosts the area’s communication and cultural feel. It also encourages socializing, increases safety, and helps businesses thrive, leading to a better and more appealing area overall.
In summary, these spatial information factors strongly affect how well the block communicates. They show the efficiency of information flow, how active social interactions are, and how prominent its cultural features are. Together, these factors create the block’s unique appeal and energy. The detailed ways to calculate each factor are in Table 3.

Table 3.
Indicators of factors influencing spatial information encoding.
3. Research Area
3.1. Selection of Research Subjects
Choosing Central Street as the subject of this study is primarily based on its unique historical and cultural background and spatial information encoding characteristics. Central Street, as a historical landmark of Harbin, not only carries profound cultural connotations but also showcases the integration and collision of diverse cultures. Its architectural styles are varied, blending Renaissance, Baroque, and other European styles, forming a unique spatial information encoding strategy. In addition, the street facilities and landscape layout of Central Street are also cleverly integrated into the spatial encoding, collectively creating a cultural district that is both historically rich and full of modern atmosphere. This unique spatial information encoding strategy not only enhances the visual appeal of Central Street but also promotes communication and interaction between tourists and residents, strengthening the district’s communicability. Therefore, choosing Central Street as the research subject allows for an in-depth exploration of how the spatial information encoding strategies of culturally distinctive districts influence their communicability, providing new perspectives and ideas for urban space design and cultural research.
3.2. Specific Regional Division
The specific scope of this study is shown in Figure 1, encompassed by Tongjiang Street, Jingwei Street, West 16th Road, Shangzhi Street, and the riverside shoreline. The land use planning scheme for this area (as shown in Figure 2) organizes space through three levels: historical building protection corridors, commercial composite function axes, and waterfront open space systems. Its three-dimensional spatial morphological characteristics are further quantified and characterized by the building height distribution map (Figure 3), which reveals the gradient change characteristics of the plot ratio in the core area from the historical districts to the riverside plots. The east–west roads include Youyi Road, West 2nd Road, Traditional Chinese Medicine Street, West 5th Road, Hongzhuan Street, West 7th Road, Dongfeng Street, West 9th Road, Da’an Street, West 10th Road, West 11th Road, Xiaman Street, Daoli 12th Road, Hongxing Street, West 14th Road, and West 15th Road, forming a clearly graded pedestrian commercial network.
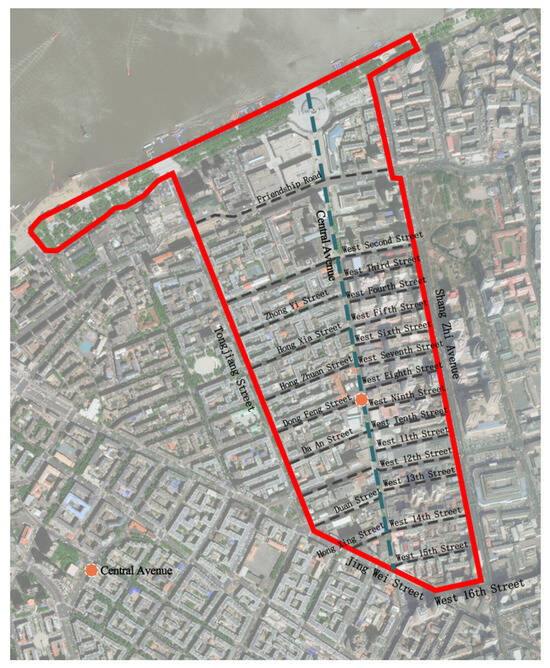
Figure 1.
Scope of Harbin Central Street pedestrian block (prepared by the author).
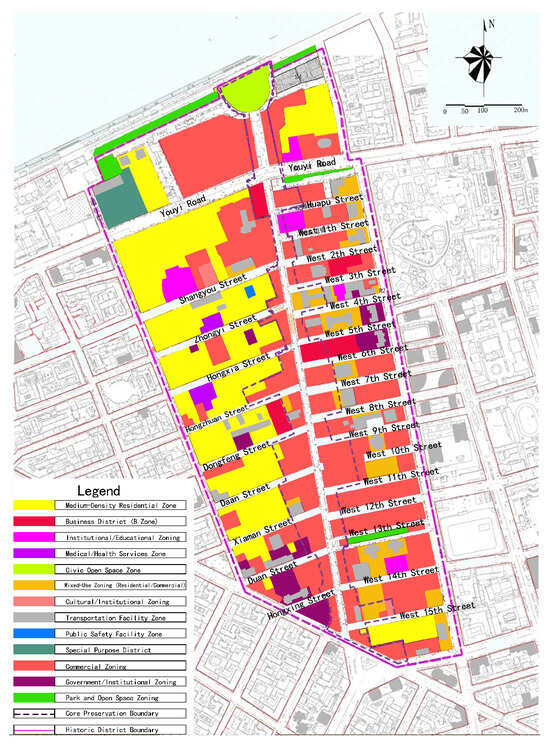
Figure 2.
Land use planning map of Harbin Central Street (prepared by the author).
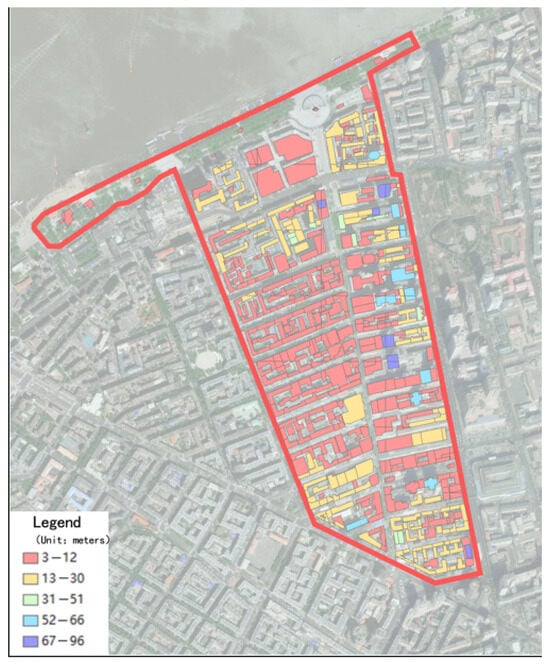
Figure 3.
Distribution map of building heights on Central Street, Harbin (prepared by the author).
The current characteristics of the research site are systematically presented through integrated visual analysis (Figure 4). This comprehensive schematic diagram adopts a three-column layout corresponding to spatial, humanistic, and temporal elements: In the spatial dimension, it focuses on displaying real-life scenes of riverside trails, cross-sectional views of street spaces, square activity scenarios, historical building facades, and floor plans of characteristic courtyards. In the humanistic dimension, it conveys the stratification of cultural memories through identifiers of revolutionary sites, photography of folk festivals, street music performances, drama poster archives, the evolution of commercial signage, and public artworks. In the event dimension, it constructs a spatiotemporal evolution axis of significant events by overlaying historical maps, comparing construction timelines, visualizing heatmaps of festival pedestrian flows, presenting reports on celebrity events, logging residents’ activities, and compiling cultural event chronologies. This multi-element juxtaposition visualization strategy not only preserves the original characteristics of various current information but also enables cross-dimensional associative interpretation through spatial referencing system alignment and temporal axis synchronization, providing verifiable foundational data for subsequent spatiotemporal analysis and cultural gene extraction.
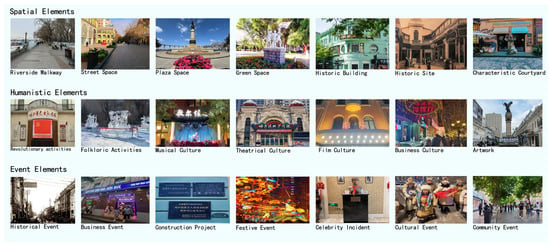
Figure 4.
Research area status survey (author’s own photographs).
To deeply understand the cultural dimensions of the historic district, field investigations were conducted at ten core heritage buildings along Harbin’s Central Street, including colonial trade, financial, and cultural landmarks such as the Churin Department Store, Far East Bank, and Hotel Moderne (Figure 5). These investigations revealed a palimpsestic cultural landscape where Russian Art Nouveau, Jewish Eclecticism, and Manchukuo-period architectures coexist, demonstrating Harbin’s historical significance as an East Asian cross-cultural hub. Our analysis highlights the need to further explore spatial communicability theories, particularly adaptive regeneration mechanisms for ritualistic spaces. Notable examples include Hotel Moderne’s transformation of its historic diplomatic hall into an immersive theater featuring holographic recreations of the 1929 Sino-Soviet conference and the former Jewish Hospital’s adaptive reuse that preserves architectural integrity while converting archival spaces into interactive medical history exhibitions. These interventions demonstrate how functional reprogramming unlocks heritage’s cultural decoding potential.
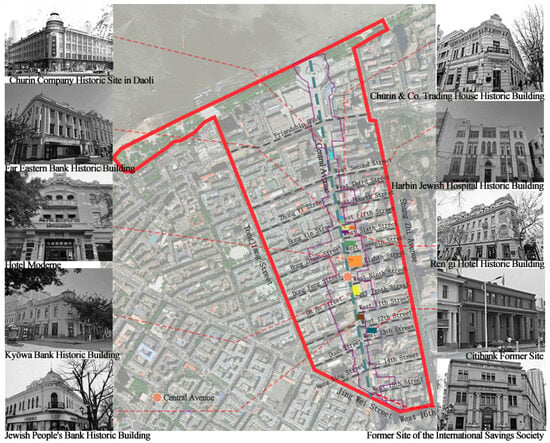
Figure 5.
Survey map of major heritage site distribution along Central Street (drawn by the author).
Building upon these findings, documented behaviors such as visitors tracing Jewish physicians’ registries through touchscreens and narrative interactions triggered by digital historical recreations represent the evidence-based re-embedding of marginalized urban narratives like diasporic memories in public consciousness. Future research will examine architectural semiotic translation and participatory behaviors’ catalytic effects on collective memory, moving beyond superficial “architectural diversity” descriptions to establish a human-centered heritage interpretation framework that reveals spatial meaning reproduction mechanisms within cross-cultural tensions.
4. Data and Methods
4.1. Research Route
Most existing research focuses only on media communicators, media content production, media content distribution, media users, etc. [38]. This study attempts to investigate the impact mechanism of media production content’s encoding information and process on spatial communicability (see Figure 6). The research is divided into four stages. First, the research object is selected. In this study, the research object is Central Street in Harbin. Central Street is chosen as the research object of a cultural characteristic district because it is the intersection of Harbin’s history and modernity, featuring a diverse range of architectural styles and witnessing the city’s glorious development. Based on Dianping data and mobile signaling data, this paper constructs an evaluation index system for spatial communicability from the dimensions of perceptual evaluation, infrastructure evaluation, and behavioral activities. It calculates the distribution characteristics of spatial communicability under different dimensions. Subsequently, the scale and level of communicability are divided into four categories. These include street view elements, architectural elements, transportation elements, and mixed-use elements, forming a human-scale spatial information-encoding element impact index system. Finally, the study uses the XGBoost model to accurately find the key drivers of communicability and understand how spatial information elements affect it in cultural districts. The goal is to offer planning advice for improving these districts’ communicability and supporting high-quality urban development.
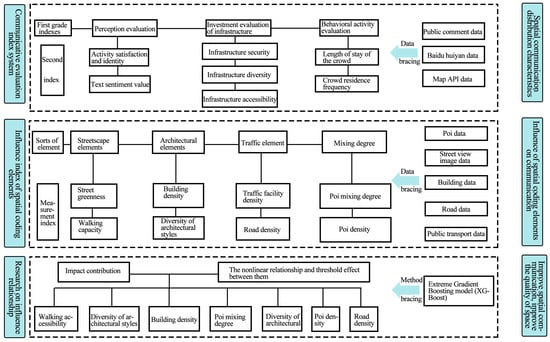
Figure 6.
Research framework for the communicability of cultural characteristic districts (prepared by the author).
4.2. Research Methods
4.2.1. Semantic Segmentation of SVIs
The trained semantic segmentation model processes the established SVIs dataset to extract specific urban elements. The Cityscapes dataset [39], containing 34 street-view elements (sky, road, vehicles, and vegetation), was utilized to train the semantic segmentation model. SegNet’s architecture features a symmetric structure with an encoder–decoder network (see Figure 7 for schematic details). The encoder comprises 13 convolutional layers derived from the first 13 layers of VGG16, excluding its fully connected layers. It extracts image features through convolutional operations and applies max pooling layers to enhance translational invariance while reducing computational costs. During pooling, SegNet retains pooling indices (locations of maximum values within pooling windows), which guide subsequent upsampling in the decoder. The decoder mirrors the encoder’s structure, utilizing stored pooling indices to restore feature maps to their original resolution via precise upsampling. Post-upsampling, convolutional layers refine and integrate features to generate final segmentation outputs. All deep learning and machine learning workflows were implemented under consistent computational settings on a Windows workstation equipped with an RTX4070 GPU and an Intel i7-14700HX processor. The model quantifies physical spatial communicability metrics, including greenery coverage, pedestrian permeability, street complexity, and sky openness, to inform urban design evaluations.

Figure 7.
Segnet structure diagram (prepared by the author).
4.2.2. ArcGIS Visual Spatial Data Processing Methods
Using the kernel density analysis method in ArcGIS10.8 to visualize the spatial dissemination factors of the architectural style, intersection density, density of roads directly intersecting with the pedestrian street, bus stop density, and public service facility density in the Central Avenue pedestrian block [40].
4.2.3. Regression Analysis Method
Extreme Gradient Boosting (XGBoost) is an efficient machine learning algorithm that optimizes predictions by integrating decision trees [41]. It iteratively adds new trees to reduce prediction errors, leverages second-order Taylor expansions to optimize the loss function, and incorporates regularization to prevent overfitting. XGBoost supports parallel processing to accelerate training and is widely applied in tasks such as classification and regression. Data preprocessing involves extracting key features, and XGBoost is utilized to construct a model where spatial information encoding features serve as input variables, and the output is the neighborhood walkability score. Model training explores the relationship between spatial information and walkability, with emphasis on parameter tuning and cross-validation. After training, feature importance analysis is conducted to identify significant spatial information factors. Based on these findings, the impact of coding strategies on walkability is discussed, and optimization suggestions are proposed. The research findings contribute to the planning, design, and management of culturally distinctive neighborhoods.
represents the loss between the true value and the predicted value of the i sample. represents the complexity of the K weak learner (i.e., decision tree). n is the number of samples. K is the number of weak learners.
T represents the number of leaf nodes in a tree. is the penalty coefficient for the number of leaf nodes. w is the vector composed of the output values of the leaf nodes. is the penalty coefficient for the complexity of the output values of the leaf nodes.
4.3. Data Source
In this study, a Multi-Source Urban Data Fusion and Analysis System was developed, with careful selection of data sources. The selection of participants was based on multidimensional criteria, including data accessibility, representativeness, relevance to urban spatial characteristics, and timeliness of data updates. Six representative and widely used data sources, namely Dianping, Baidu Huiyan, Amap, and three others, were chosen as participants, as shown in Table 4. A standardized collection protocol is established for six data sources, including Dianping, Baidu Huiyan, and Amap (Figure 8). A dynamic anti-crawling strategy (random 3–7-s delay, rotating proxy IP pool) ensures compliant data acquisition. A multi-level validation mechanism is implemented: (1) range validation for numerical fields [42]; (2) DTW algorithm-based trajectory continuity detection for spatiotemporal data; (3) SSIM-based quality filtering for image data. All data are unified into the WGS84 coordinate system, with time series aligned at 15 min intervals [43].

Table 4.
Explanation of research data sources.
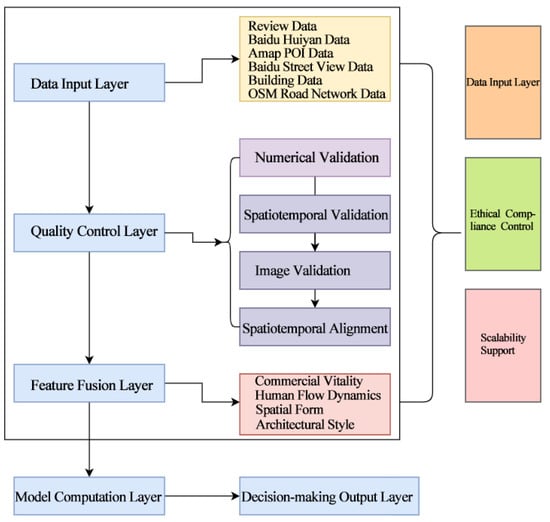
Figure 8.
Research data processing flow chart (prepared by the author).
Following data standardization, cross-source feature fusion is achieved based on the spatial semantic association matrix: (1) commercial vitality evaluation combines Dianping sentiment analysis (using the BERT model) with POI density kernel estimation [44]; (2) human flow dynamics analysis uses an improved ST-DBSCAN algorithm for Baidu Huiyan trajectory data (spatiotemporal threshold = 50 m/300 s); (3) street-view images, after SegNet semantic segmentation (mIoU = 0.73), yield 15 morphological indicators, including green view rate and interface continuity; and (4) building style classification is performed by fine-tuning ResNet50 (top-5 accuracy of 92.4%), with feature-level and road network centrality indicator fusion via graph convolution. A full-process parameter documentation mechanism is established, covering (1) data collection time-sequence control (such as 120 ± 30-s collection interval for review data); (2) model training details (SegNet uses the VGG16 backbone, trained for 150 epochs with a weighted cross-entropy loss function); and (3) validation and testing benchmarks (POI classification F1-score ≥ 0.85, spatial accessibility calculation error rate < 8%). Data–code–parameter version linkage is achieved via DVC (Data Version Control).
5. Characterization of the Spatial Communicative Distribution of Neighborhoods
5.1. Analysis of the Communicative Characteristics of Culturally Distinctive Blocks Based on Perceptual Evaluation
The satisfaction and sense of identity (Figure 9a) combined with the emotional value of the text (Figure 9b) calculate the communicative characteristics of the neighborhood space based on perceived evaluation (Figure 9c). Statistical analysis revealed a mean spatial communicability of 1.34 (range: 0.08–3.56) across the urban blocks. Emotional value distribution exhibited a primary–secondary structure: Central Avenue Main Street as the core, supplemented by Jin’an International Commercial Zone and Flood Control Memorial Tower Area. These tourism-consumption hotspots demonstrated positive tourist experiences, high merchant ratings, and favorable reviews, attributed to proactive merchant adaptation. Elevated emotional values clustered around high-communicability zones, while others were sporadically distributed. Low-communicability zones predominated in peripheral areas, resulting in reduced commercial vitality due to Central Avenue’s dominance and insufficient visibility.
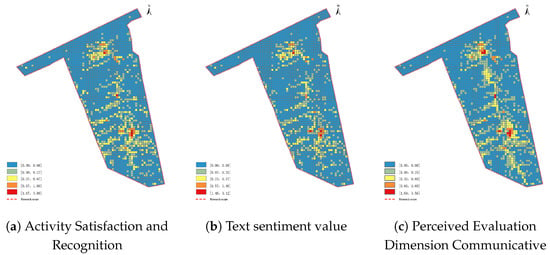
Figure 9.
Analysis of communication in block space based on perceived evaluation (prepared by the author).
5.2. Characterization of the Communicative Character of Culturally Distinctive Neighborhoods Based on Infrastructure Evaluation
By calculating the security (Figure 10a), diversity (Figure 10b), and accessibility (Figure 10c) of infrastructure, the spatial communication characteristics of blocks based on infrastructure evaluation are obtained (Figure 10d). Analysis indicated spatial communicability values ranged from 0 to 11.54 (mean: 3.56), displaying a monocentric multicluster pattern with contiguous low-value zones. Peak values concentrated along Central Avenue Main Street and adjacent nodes, demonstrating infrastructure distribution coherence through safety–diversity–accessibility alignment that mirrored population activity patterns, facilitating governmental infrastructure optimization and population aggregation. Median values clustered near high-value zones (surrounding residential streets and niche attractions), while low-value zones predominantly occupied peripheral zones of the study area.

Figure 10.
Analysis diagram of block spatial communication based on infrastructure evaluation (prepared by the author).
5.3. Analysis of Communication Characteristics of Culturally Distinct Blocks Based on Behavioral Activity Evaluation
By measuring the frequency (Figure 11a) and duration (Figure 11b) of people’s presence, the spatial communication characteristics of neighborhoods based on behavioral activities were obtained (Figure 11c). Behavior-based spatial communicability ranged from 0 to 1 (mean = 0.25), exhibiting a monocentric multicluster pattern. A high-value corridor emerged along Central Avenue Main Street, linking key nodes (Hongzhuan Street Morning Market, Flood Control Memorial Tower viewing route, and West 12th Street), demonstrating alignment with pedestrian movement dynamics. The core area exhibited spatiotemporal fluctuations in visitor dwell time/frequency, resulting in intermittent communicability. Median-value zones clustered adjacent to the corridor (commercial streets and attractions), while low-value zones dominated peripheral areas. This spatial configuration highlights Central Avenue’s gravitational influence on crowd mobility and dwell behavior, revealing critical dependencies between temporal activity patterns and communicability sustainability.
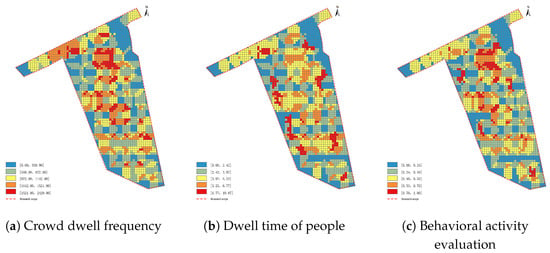
Figure 11.
Analysis of communication in block space based on behavioral activities (prepared by the author).
5.4. Comprehensive Analysis of Communication in Culturally Distinct Neighborhoods
Based on the comprehensive evaluation of the spatial communication characteristics of cultural feature blocks using the above indicators, the results (Figure 12) show that the overall spatial communication of the block exhibits a significant spatial differentiation phenomenon, with overall values ranging from 0.00 to 30, and an average of 0.26, presenting a “T-shaped” distribution characteristic of aggregation. High and relatively high values are mainly distributed along the central street running north–south and the scenic route along the Flood Control Memorial Tower running east–west. The area with the highest overall communication is centered on the main street of the central street, extending northward along the riverside landscape in a T-shape. This area attracts a large crowd for gathering and communication due to its diversified spatial functions and multicultural empowerment. The perception evaluation is positive, with a high activity range and a wide service range; the median area is located along the edge of the high-value area, extending outward; the low-value area is located at the edge of the studied area and in regions where residential communities are concentrated. Since the studied area is a concentrated area for tourism activities, the attraction of large crowds to the scenic spots leads to less activity in residential areas, resulting in a decrease in spatial communication behavior.
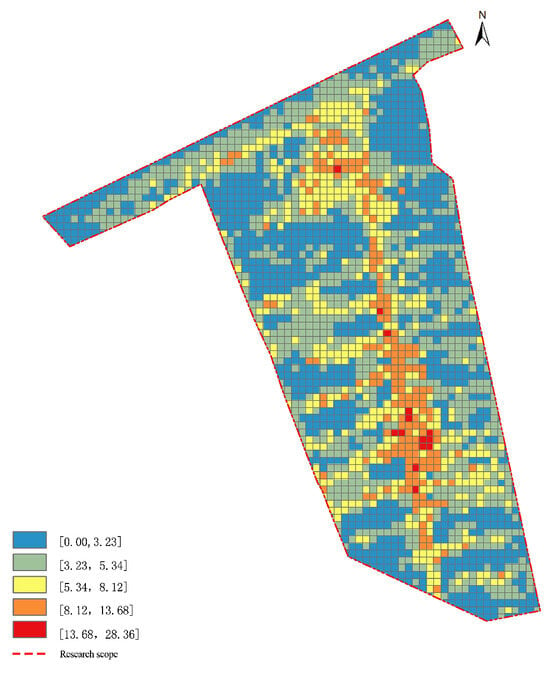
Figure 12.
Comprehensive analysis of communication in cultural characteristic blocks (prepared by the author).
6. The Impact of Spatial Information Encoding Factors on the Communicability of Block Spaces
6.1. The Contribution of Spatial Information Encoding Factors to the Communicability of Urban Blocks
Select appropriate parameters for model construction; key parameters include learning rate, maximum tree depth, and leaf node weight. This article uses the “hyperparameter grid search method [45].” To determine the best hyperparameters, the “hyperparameter grid search method” involves training all listed parameter combinations in a loop until the optimal parameter combination is found. Two hyperparameters were selected, and their value ranges were limited: the possible values for the learning rate were set to (0.01, 0.015, 0.025, 0.05, 0.1), and the maximum tree depth could take values of (3, 4, 5, 6, 7). The final results showed that the model performed best when the learning rate was 0.1 and the maximum tree depth was 6. The goodness of fit of the model was measured using R2 (0 to 1), with a higher value indicating greater explanatory power of the model. The R2 of the XGBoost model was 0.82, indicating that the XGBoost model has good explanatory power. The contribution of various built environment features to the prediction results was calculated using the XGBoost model (Table 5), where the magnitude of the contribution directly reflects the extent to which these features affect spatial communicability. The results indicated that factors such as the mixed degree of land use types, POI (point of interest) density, POI mix, street walkability, street greenness, building density, diversity of architectural styles, and traffic facility density showed significant impacts on the communicability of cultural characteristic districts. In contrast, the contributions of other indicators were relatively low; therefore, in subsequent research, we will not delve further into these indicators with lower contributions.

Table 5.
The contribution of spatial coding elements to the communicability of neighborhoods.
6.2. The Changing Characteristics of the Impact of Spatial Information Encoding Factors on the Communicability of Urban Blocks
Partial dependence plots are also one of the widely used analytical tools in machine learning. They visually display the relationship between the dependent variable and independent variables, allowing for an intuitive revelation of the actual effects that independent variables have on the dependent variable [46]. In this article, Figure 13 shows the partial dependence of the independent variable, where the y-axis represents the overall communication score, and the x-axis reflects the specific range of values for a certain independent variable. Analyze the partial dependency diagram of seven spatial information coding factors closely related to the comprehensive communicability of culturally distinctive street blocks, specifically in terms of four aspects: street scene elements, architectural elements, road elements, and mixed-use. These factors include walkability, street greenery, building density, POI mix, architectural style diversity, POI density, and road density.
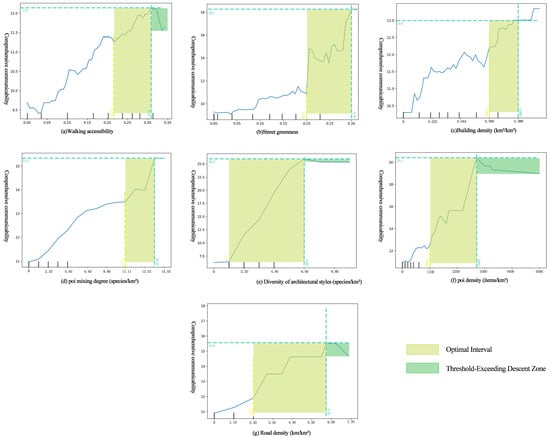
Figure 13.
Nonlinear relationship between spatial coding elements and the communicability of pedestrian blocks. Among them are the following. (a) Walking accessibility. (b) Street greenness. (c) Building density (km2/km2). (d) POI mixing degree (species/km2). (e) Diversity ofarchitectural styles (species/km2). (f) POI density (items/km2). (g) Road density (km/km2) (prepared by the author).
6.3. Narrative of the Impact of Seven Spatial Configuration Factors on Spatial Communicability
This study demonstrates that spatial accessibility in cultural districts operates under nonlinear threshold effects governed by seven spatial configuration factors. Rooted in Alexander’s critique of spatial alienation [10], a 35% road coverage (composite index 0.31) establishes the physical threshold for emotional resonance, validated at Churin’s Arcade where the 1:0.6 pedestrian-functional space ratio maximizes walkability before declining along an inverted U-curve. Road network density (2.20–6.20 km/km2) requires >20% multi-level optimization (e.g., Far East Bank area), with <6.20 km/km2 density and >3 m walkways dynamically expressing Alexander’s pattern language (Table 6). Building density (0.066–0.088; index 12–13) aligns with >40% arcade coverage (Modern Hotel colonnades), while densities >0.088 necessitate <20% high-density zones and >50% shading for spatial equilibrium.

Table 6.
Summary of optimal influence ranges and communicability peak values for spatial elements in cultural characteristic districts.
Within Lefebvre’s material–practice–meaning framework [25], environmental quality peaks at 0.20–0.30 greenery (index 10.5–18) with >8% vertical greening and 500 m green radius (Jewish Hospital courtyard). POI mix entropy >11.10 triggers accessibility leaps, peaking at 11.11–14.10 (index 14–15.2) when supported by >5 night facilities/100 m (Central Street theater). Heritage reactivation evidence reveals architectural semantics catalyze collective memory—holographic recreations of 1929 Sino-Soviet conferences at the Modern Hotel and Jewish medical archives displays demonstrate diaspora memory re-embedding, forming human-centric interpretation beyond Russian-Jewish-Manchukuo architectural diversity.
6.4. Chapter Summary
This study reveals the nonlinear correlation mechanisms between spatial elements and neighborhood comprehensive connectivity and constructs an environment–society–economy synergistic pathway to promote sustainable urban development. In terms of environmental sustainability, green infrastructure optimization via vertical greening and low-impact development technologies significantly alleviates the urban heat island effect. For social sustainability, health-oriented pedestrian network optimization and inclusive design create an age-friendly slow-traffic spatial system. Regarding economic sustainability, a combined approach of POI mixed-gradient regulation and architectural diversity preservation not only stimulates agglomeration effects in cultural and creative industries but also maintains community functional balance.
7. Discussion and Conclusions
7.1. Discussion
This study achieves a theoretical paradigm shift in humanistic urban design, transitioning its core logic from functional mechanism to an affect-driven interactive paradigm. By digitally translating Alexander’s “pattern language” [10]—rather than reverting to Jacobs’ empiricism [2]—it constructs a quantifiable, iterative design language system. The research makes three key breakthroughs: First, through a multi-source sensing data model, it pioneers the visualization of “spatial communicability,” empirically validating Alexander’s “The Quality Without A Name” [17] and elevating space into a living entity that continuously generates affective data [47], as demonstrated by emotional trajectories on Central Street. Second, while inheriting the humanistic core of Gehl’s theory [48] of communicative space, it critically surpasses the limitations of subjective description using digital tools. Third, it establishes a “Humanistic Design 2.0” framework, where an emotional feedback loop ensures theoretical verifiability and a spatial semantic translation mechanism guarantees practical scalability.
Methodologically, the study delivers triple advances: The XGBoost model precisely captures nonlinear threshold effects of spatial elements on cultural districts’ communicability, with case studies validating synergistic mechanisms between green view index (GVI) [49] and pedestrian network integration. An innovative “affect–facility–behavior triadic dynamic coupling framework” transcends traditional static POI density analysis [50]. Finally, a “spatial–behavioral synergetic entropy” diagnostic index identifies key decision variables via machine learning, establishing causal pathways for acupuncture-style regeneration of cultural blocks. These findings confirm the threshold activation mechanism of spatial communicability (Hypothesis 1) and the moderating role of human-scale parameters (Hypothesis 2), revealing the complex interplay within Lefebvre’s triad of “materiality–practice–meaning” [25].
This paradigm revolution—transforming urban space from functional container to affective living entity—positions digital tools as vessels to resurrect the spirit of place, carrying premodern wisdom toward sustainable urban–rural development.
7.2. Conclusions
Empirical findings establish that the “affect–facility–behavior synergetic entropy” serves as the core driver of spatial communicability in urban cultural districts, with its nonlinear threshold effects fundamentally challenging conventional linear vitality models. The derived “Spatial Decision-Targeting Map” provides a precision-oriented technical medium for collective memory reproduction and participatory governance. This research reveals critical nonlinear thresholds governing spatial communicability: pedestrian permeability requires a road-to-total-area ratio >35% with walkway/functional space ratio of 1:0.6; district greening intensity demands vertical greening coverage >8% combined with a 500 m green space service radius; and POI mix use must exceed 11.10. These optimal intervals collectively validate pre-modernist human-scale principles. As demonstrated through Christopher Alexander’s Pattern #15: “NEIGHBORHOOD BOUNDARY” (pp. 87–90) [10], arcade coverage > 40% coupled with shading rate > 50% creates emotionally resonant spaces. Simultaneously, controlled architectural diversity (fewer than six styles, conflict coefficient < 0.3) aligns with Christopher Alexander’s core idea of functional mixing and overlap. This prevents chaotic stylistic clashes that erode cultural identity [10].
Building upon these validated principles, three integrated theoretical–technical breakthroughs were achieved. First, theoretical digitization was realized by quantifying abstract frameworks—including Alexander’s affective carrier theory and Lefebvre’s production of space—into measurable indicators such as spatial–behavioral synergetic entropy. The XGBoost model precisely captured nonlinear mechanisms where synergistic thresholds (Green View Index > 3 5% + pedestrian network integration > 1.8) enhance host–guest interaction efficiency by 42%. Second, diagnostic precision was revolutionized through grid-based generation of Spatial Decision-Targeting Maps using multi-source sensing data, exemplified by identifying shaded corridor priority zones (shading rate > 30%) guided by He Guoping’s emotional connectivity theory. Finally, human-centered design implementation was advanced via the Acupuncture-Style Regeneration Toolkit, which balances heritage conservation and vitality enhancement in high-density built environments through interventions like controlling road density < 5.50 km/km2 while ensuring walkway width > 3 m.
The fundamental contribution of this research lies in providing a practical methodology to transform urban spaces from cold “functional containers” into warm “emotional living entities.” This transformation is crucial as it directly impacts the daily experience quality of residents and visitors—affecting their well-being, sense of belonging, and genuine affection for a place. Impersonal functional spaces exacerbate social atomization, weakening community bonds and place identity. In contrast, “emotional living entities” foster human connection by creating safe, comfortable, culturally resonant, and aesthetically meaningful environments (e.g., shaded resting nooks, public art spaces holding collective memories). This cultivates a deep sense of “this is my place,” thereby enhancing social resilience. The core value of our Humanistic Design 2.0 Framework is its cross-cultural applicability, achieved through three key mechanisms: (1) grounding in universal human physiology (e.g., serenity in Kyoto’s alleyways or comfort under Barcelona’s shaded arcades); (2) adaptive cultural translation, using open-source tools to integrate local architectural elements while intelligently regulating stylistic harmony; and (3) resilient spatial activation, converting ordinary facilities into cultural hubs through acupuncture-like micro-interventions (e.g., Berlin’s nightlife centers). This confirms that great places possess a quality that transcends cultural boundaries and resonates deeply. The developed digital toolkit thus serves a core mission: translating cross-cultural humanistic wisdom into actionable design strategies. It ultimately empowers global urban and rural spaces to evolve into “resonant living entities”—places where people feel vitality, connection, and belonging.
However, significant limitations persist: data overreliance on digital footprints excludes vulnerable groups, architectural metrics and affective labels remain semantically disconnected, cross-regional adaptability proves fragile, cultural memory risks oversimplification through affective quantification, algorithmic decision-making tends to marginalize low-data-density areas, and conflicting interdisciplinary standards impede progress. Future research priorities include enhancing data inclusivity for vulnerable populations to eliminate algorithmic bias, developing multidimensional modeling of cultural memory to prevent affective reductionism and establishing interdisciplinary semantic conversion protocols—all converging toward precise calibration of humanistic values through community participatory governance. True urban sustainability will ultimately emerge from the dialectical unity of instrumental rationality and humanistic spirit, enabling every street corner to cultivate the life-nourishing “The Quality Without A Name” [17].
Author Contributions
Conceptualization, H.Z. and C.P.; Methodology, H.Z.; Software, H.Z.; Validation, H.Z. and C.P.; Formal analysis, H.Z.; Investigation, H.Z.; Data curation, H.Z.; Writing—original draft, H.Z.; Writing—review & editing, H.Z. and C.P.; Visualization, H.Z.; Supervision, C.P. All authors have read and agreed to the published version of the manuscript.
Funding
This research received no external funding.
Institutional Review Board Statement
Not applicable.
Informed Consent Statement
Not applicable.
Data Availability Statement
The data presented in this study are available on request from the corresponding author.
Conflicts of Interest
The authors declare no conflicts of interest.
References
- Conzen, M.R.G. Alnwick, Northumberland: A Study in Town-Plan Analysis; George Philip: London, UK, 1960; Volume 27. [Google Scholar]
- Jacobs, J. The Death and Life of Great American Cities; Random House: New York, NY, USA, 1961. [Google Scholar]
- Xie, F. Bologna Old City Renovation: Refusal to Gentrification. China Econ. Wkly. 2010, 37, 76–77. [Google Scholar]
- Wells, J.C.; Lixinski, L. Heritage values and legal rules: Identification and treatment of the historic environment via an adaptive regulatory framework (part 2). J. Cult. Herit. Manag. Sustain. Dev. 2017, 7, 345–363. [Google Scholar] [CrossRef]
- Suzhou Municipal People’s Government. Suzhou Ancient City Protection Plan; Suzhou Municipal People’s Government: Suzhou, China, 1986.
- Zhang, S. Introduction to Historical Urban Conservation; Shanghai Science and Technology Press: Shanghai, China, 2001. [Google Scholar]
- Zhang, X.M. Concept and Constituent Elements of Urban Theme Blocks. Urban Probl. 2007, 15, 16–19. [Google Scholar] [CrossRef]
- Shenzhen Municipal Bureau of Culture, Radio, Television, Tourism and Sports; Publicity Department of the CPC Shenzhen Municipal Committee; Shenzhen Municipal Bureau of Planning and Natural Resources. Notice on Issuing the “Administrative Measures for Shenzhen’s Characteristic Cultural Blocks”. Shenzhen Mun. People’s Gov. Bull. 2022, 34, 34–40. [Google Scholar]
- Zhu, B.; Chen, L.; Zhang, T. Research on the Optimization Design of Characteristic Blocks under the Concept of Park City: Taking the Traditional Chinese Medicine Cultural Characteristic Block of Zaozi Lane in Chengdu as an Example. Intell. Build. Smart City 2023, 2632, 46–49. [Google Scholar] [CrossRef]
- Alexander, C.; Ishikawa, S.; Silverstein, M. A Pattern Language: Towns, Buildings, Construction; Oxford University Press: New York, NY, USA, 1977. [Google Scholar]
- Rofé, Y. Feeling maps, diagnosis, generative planning and urban design. In Generative Process, Patterns and the Urban Challenge, Proceedings of the 2011 International PUARL Conference, Portland, OR, USA, 28–30 October 2011; University of Oregon: Eugene, OR, USA, 2011; pp. 217–226. [Google Scholar]
- Rofè, Y. The meaning and usefulness of the “feeling map” as a tool in planning and urban design. In Pursuit of a Living Architecture: Continuing Christopher Alexander’s Quest for a Humane and Sustainable Building Culture; Common Ground Publishing: Champaign, IL, USA, 2016; pp. 295–312. [Google Scholar]
- Krier, L. The Architecture of Community; Island Press: Washington, DC, USA, 2009. [Google Scholar]
- Sussman, A.; Hollander, J.B. Cognitive Architecture: Designing for How We Respond to the Built Environment; Routledge: London, UK, 2015. [Google Scholar] [CrossRef]
- Moreno, C.; Allam, Z.; Chabaud, D.; Gall, C.; Pratlong, F. Introducing the “15 minute City”: Sustainability, Resilience and Place Identity in Future Post-Pandemic Cities. Smart Cities 2021, 4, 93–111. [Google Scholar] [CrossRef]
- Mehaffy, M.W. A New Pattern Language for Growing Regions: Places, Networks, Processes; Sustasis Press: Portland, OR, USA, 2020. [Google Scholar]
- Alexander, C. The Timeless Way of Building; Oxford University Press: New York, NY, USA, 1979. [Google Scholar]
- Zhang, Y. Research on the Cultural Communication Function of Urban Book Fairs from the Perspective of ’Communicable City’ Theory. Publ. Wide Angle 2018, 16, 10–22. [Google Scholar] [CrossRef]
- Wu, Y.M. From ‘Mediatized Urban Survival’ to ‘Communicable Cities’—Reflections on Urban Communication Research and Its Publicity. J. Commun. Res. 2014, 21, 126. [Google Scholar]
- Gumpert, G.; Drucker, S.J. Communicative Cities. Int. Commun. Gaz. 2008, 70, 195–208. [Google Scholar] [CrossRef]
- Fudan University Information and Communication Research Center; School of Journalism, Fudan University (Eds.) Communicable City: Theoretical Construction and Chinese Practice. In Communication and China·Fudan Forum; Fudan University Press: Shanghai, China, 2012; p. 7. [Google Scholar]
- Xie, J.; Pan, J.; Sun, W. Communicable City Evaluation System. J. News. Commun. Res. 2015, 22, 25–34. [Google Scholar]
- He, G.P.; Chen, Y. The Path of Improving the Communication of the Activation of Historical and Cultural Blocks in Guangzhou. Acad. Res. 2023, 10, 42–49. [Google Scholar]
- Guo, W. Research on the Communication of Xi’an Historical and Cultural Blocks. Master’s Thesis, Xi’an University of Technology, Xi’an, China, 2024. [Google Scholar] [CrossRef]
- Lefebvre, H. The Production of Space; Nicholson-Smith, D., Translator; Blackwell: Oxford, UK, 1991. [Google Scholar]
- Cao, K.Z.; Jiao, Y. Research on the Value of Urban Picture Books Based on Identity Construction and Spatial Communication. Publ. China 2020, 16, 51–54. [Google Scholar]
- Liu, K.X.; Ren, L.J.; Yun, Y.X. Research on the Correlation between Block Vitality and Emotional Value Based on Micro-blog Data. In Proceedings of the 2018 China Urban Planning Annual Conference: Sharing and Quality (Urban Design), Hangzhou, China, 24 November 2018; Chinese Urban Planning Association: Hangzhou, China, 2018; p. 10. [Google Scholar]
- Zhang, Z.L.; Li, J.Z.; Wu, D.; Ping, T.; Sun, H. Research on the Evaluation of Urban Spatial Vitality and the Impact of Built Environment Based on Social Perception: Taking the Ancient City of Suzhou as an Example. Geogr. Geogr. Inf. Sci. 2024, 41, 80–89. [Google Scholar]
- Bi, X.X. Study on the Evaluation and Influencing Factors of Slow Traffic Infrastructure. Master’s Thesis, North China University of Technology, Beijing, China, 2024. [Google Scholar] [CrossRef]
- Xu, S.; Wu, Y.C.; Zhang, G. Evaluation of Public Cultural Service System in the Outer Suburbs of Megacities from the Perspective of Urban-Rural Integration: Taking Tianjin as an Example. South. Archit. 2024, 30, 41–51. [Google Scholar]
- Shen, Y.; Li, L. The influence of medical facility accessibility on residents’ health seeking behaviors from the perspective of age stratification: A case study of Shanghai Chongming Island. Hum. Geogr. 2021, 36, 46–54. [Google Scholar]
- Liu, W.Z.; Zhang, Y. Spatial Evaluation of Urban Community Life Circle by Spatial Syntax Combined with Spatio-Temporal Behavior Analysis: A Case Study of Dangdai-Yimei Community Life Circle in Beijing. Prog. Geogr. 2024, 43, 2157–2170. [Google Scholar]
- Tang, T.J.; Xu, L.J.; Yuan, J.C. Research on the Renewal of Public Space in Old Communities Under the Spontaneous Planting Behavior of the Elderly: Taking Shenyang 204 District as an Example. South. Archit. 2024, 44, 1328–1335. [Google Scholar]
- Zhang, C.M.; Xu, X.; Wang, Z.X.; Zhao, D.S.; Wan, F. Research on the Design Strategy of Improving the Green Visibility of Dali Ancient City Streets Based on Multi-Year Streetscape Images. Urban Rural Plan. 2024, 4, 94–102. [Google Scholar]
- Yang, Z. Research on Pedestrian Traffic Flow Organization Based on Multi-Level Network Construction. Ph.D. Thesis, Beijing Jiaotong University, Beijing, China, 2022. [Google Scholar] [CrossRef]
- Li, C. Safety Evaluation and Optimization Design of Livable Street Spaces in Xi’an. Ph.D. Thesis, Xi’an University of Architecture and Technology, Xi’an, China, 2023. [Google Scholar]
- Tang, L.; Xu, H.; Ding, Y. Comprehensive Vitality Evaluation of Urban Blocks based on Multi-source Geo-graphic Big Data. J. Geo Inf. Sci. 2022, 24, 1575–1588. [Google Scholar]
- Ma, L. Research on the Development of Self-Media from the Perspective of Communication “5W” Model. News Commun. 2024, 16, 22–24. [Google Scholar]
- Cordts, M.; Omran, M.; Ramos, S.; Rehfeld, T.; Enzweiler, M.; Benenson, R.; Franke, U.; Roth, S.; Schiele, B. The cityscapes dataset for semantic urban scene understanding. In Proceedings of the IEEE Conference on Computer Vision and Pattern Recognition, San Francisco, CA, USA, 18–20 June 1996; pp. 3213–3223. [Google Scholar]
- Ma, H.D.; Tong, Y. Spatial differentiation of traditional villages using ArcGIS and GeoDa: A case study of Southwest China. Ecol. Inform. 2022, 68, 101416. [Google Scholar] [CrossRef]
- Wu, X.; Wang, H.; Zhao, A.; Xie, Y. Study on the spatialization of Shanghai population based on multi-source data and XGBoost model. Surv. Mapp. Spat. Geogr. Inf. 2024, 47, 33–36. [Google Scholar]
- Wu, Y.; Shan, Y.; Wu, S.; Niu, X. A Spatial Performance Study of Urban Multi-Center Systems Based on Multi-Source Data. Acta Geogr. Sin. 2024, 79, 2585–2605. [Google Scholar] [CrossRef]
- Hu, D.; Chen, L.; Fang, H.; Fang, Z.; Li, T.; Gao, Y. Spatio-Temporal Trajectory Similarity Measures: A Comprehensive Survey and Quantitative Study. IEEE Trans. Knowl. Data Eng. 2023, 36, 2191–2212. [Google Scholar] [CrossRef]
- Yu, W.; Ai, T.; Yang, M.; Liu, J. Detecting “hot spots” of facility POIs based on kernel density estimation and spatial autocorrelation technique. Geomat. Inf. Sci. Wuhan Univ. 2016, 41, 221–227. [Google Scholar]
- Liu, J. Support vector regression based on grid search hyperparameter optimization. Sci. Technol. Innov. 2022, 13, 71–74. [Google Scholar]
- Liu, J.; Xiao, L.; Zhou, J.; Guo, Y.; Yang, L. Non-linear relationships between the built environment and walking to school: Applying extreme gradient boosting method. Prog. Geogr. 2022, 41, 251–263. [Google Scholar] [CrossRef]
- Alexander, C. Notes on the Synthesis of Form; Harvard University Press: Cambridge, MA, USA, 1964. [Google Scholar]
- Gehl, J. Life Between Buildings: Using Public Space; Van Nostrand Reinhold: New York, NY, USA, 1987. [Google Scholar]
- Wu, J.; Cheng, L.; Chu, S.; Xia, N.; Li, M. A Green View Index for Urban Transportation: How Much Greenery Do We View While Moving Around in Cities? Int. J. Sustain. Transp. 2019, 14, 972–989. [Google Scholar] [CrossRef]
- Zhu, Y.; Zhang, R.; Yue, Q.; Sun, X. Urban fringe expansion monitoring based on POI and nuclear density analysis: A case study of Sucheng District, Suqian City. Sichuan Build. Mater. 2020, 46, 103. [Google Scholar]
Disclaimer/Publisher’s Note: The statements, opinions and data contained in all publications are solely those of the individual author(s) and contributor(s) and not of MDPI and/or the editor(s). MDPI and/or the editor(s) disclaim responsibility for any injury to people or property resulting from any ideas, methods, instructions or products referred to in the content. |
© 2025 by the authors. Licensee MDPI, Basel, Switzerland. This article is an open access article distributed under the terms and conditions of the Creative Commons Attribution (CC BY) license (https://creativecommons.org/licenses/by/4.0/).