1. Introduction
With the growing severity of global climate change and increasing environmental constraints, green innovation has become a key driver of sustainable development. In the context of China’s transition to high-quality economic growth, green innovation plays a crucial role in improving industrial competitiveness and achieving the dual goals of carbon peaking and carbon neutrality [
1,
2]. However, most existing studies focus on the quantity of green innovation, while relatively few examine green innovation efficiency, which captures how effectively innovation inputs such as capital and labor are converted into environmentally beneficial outcomes, making it a more comprehensive measure of green development performance [
3,
4]. This is particularly relevant for evaluating policy effectiveness, as improvements in efficiency may reduce marginal abatement costs and accelerate decarbonization. Although China has achieved notable results in green patents and R&D investments, the actual transformation efficiency of green innovation is still inadequate [
5]. Some regions and firms show low efficiency due to weak incentives, market distortions, and limited technology diffusion. In addition, green innovation often suffers from externalities and underinvestment, leading to a mismatch between input and output [
6]. Therefore, a shift from focusing solely on innovation quantity to emphasizing efficiency is essential for China’s green transformation.
To support green transformation, the Chinese government has introduced various environmental policies, among which the Circular Economy Demonstration Policy (CEDP) is a prominent example. Launched after the enactment of the Circular Economy Promotion Law in 2008, the CEDP designates certain cities as “demonstration cities” where local governments are required to implement circular economy pilot programs, promote industrial symbiosis, and improve resource efficiency through regulatory incentives, performance targets, and sometimes fiscal support. The circular economy promotes closed-loop resource use and lifecycle thinking to achieve coordinated economic and environmental goals [
7,
8]. Since the Circular Economy Promotion Law was enacted in 2008, China has established demonstration cities and parks to pilot circular economy practices. The policy has evolved from focusing on pollution control to emphasizing systemic change and industrial restructuring [
9,
10]. For example, Wu et al. [
11] finds that CEDP significantly enhances green innovation capacity. However, current studies mostly examine the impact of CEDP on green innovation quantity and overlook efficiency outcomes. Globally, while circular economy interventions are increasingly recognized as essential to sustainable development, there is still limited rigorous policy evaluation of their effectiveness using causal inference methods. Most existing studies focus on Europe’s material efficiency targets or waste reduction goals but fall short of evaluating innovation outcomes. Therefore, this paper contributes to the broader international literature by providing new empirical evidence on the effects of circular economy policies on innovation efficiency in a large emerging economy.
Recent literature has identified a wide range of factors affecting green innovation efficiency, including environmental regulation, financial incentives, industrial structure, and regional collaboration [
12,
13]. Policies such as green finance reform and low-carbon city initiatives have been shown to improve green innovation outcomes [
14,
15]. In terms of measurement, scholars have moved beyond using green patent counts alone. Advanced methods such as Data Envelopment Analysis (DEA), Super-SBM models, and Malmquist index are now widely used to measure green innovation efficiency from both desirable and undesirable output perspectives [
16,
17]. These methods allow for a more accurate evaluation of the balance between environmental goals and economic inputs. In particular, the Super-SBM model with undesirable outputs captures pollution and inefficiencies, offering a more realistic assessment [
3]. Moreover, spatial econometric models have been applied to explore the regional spillover effects of green innovation [
2]. Despite these advances, studies rarely examine how policy institutions influence green innovation efficiency or the underlying mechanisms.
Although the circular economy and green innovation are conceptually linked, empirical studies connecting the two remain limited. Most research focuses on the circular economy’s impact on resource use, waste reduction, and industry transformation [
18,
19], while its effect on green innovation efficiency is underexplored. Some scholars argue that circular practices stimulate green innovation by encouraging recycling, cleaner production, and sustainable design [
20,
21]. However, these studies are often case-specific and lack causal identification strategies. Current research tends to rely on pre-post comparisons without considering potential selection bias. Moreover, it remains unclear through which mechanisms CEDP affects green innovation efficiency. Does it reduce factor distortions, enhance market integration, or improve resource allocation? In addition, little attention has been paid to the heterogeneous effects of CEDP across cities of different sizes and regions. A comprehensive analysis that includes efficiency outcomes, mechanism testing, and heterogeneity is needed.
To summarize, there are four main gaps in the current literature. First, most studies use simple output indicators such as patent counts and fail to measure green innovation efficiency comprehensively. Second, few studies adopt rigorous causal inference methods to assess the impact of CEDP, making it difficult to distinguish policy effects from other confounding factors. Third, the mechanisms through which CEDP influences green innovation efficiency remain unclear, and there is a lack of theoretical and empirical exploration on this front. Fourth, the spatial heterogeneity of policy impacts has not been adequately addressed, leaving questions about how city characteristics shape policy outcomes. These gaps call for more robust empirical strategies, improved efficiency metrics, and deeper mechanism analysis to understand the role of CEDP in enhancing green innovation.
This study aims to evaluate the impact of the Circular Economy Demonstration Policy on green innovation efficiency in Chinese cities from 2010 to 2021. First, we construct a comprehensive green innovation efficiency index using a Super-SBM model that accounts for undesirable outputs, such as pollution, providing a more accurate picture than patent-based metrics. Second, we exploit the staggered implementation of CEDP and use a DID model to identify causal effects. Third, we explore the underlying mechanisms by testing three channels: capital distortion reduction, market integration, and resource allocation efficiency. Fourth, we conduct heterogeneity analyses based on city size and geographic location to investigate differential policy impacts. Our contributions are threefold: (1) we contribute to the international literature on policy evaluation of circular economy interventions by offering new evidence from China, an underrepresented yet crucial case; (2) we provide a more robust efficiency-based assessment of green innovation; (3) we offer causal evidence of CEDP’s effectiveness and reveal its transmission mechanisms. This study enriches the literature on environmental policy and green innovation, offering new insights into how institutional interventions shape sustainable development outcomes in emerging economies.
2. Theoretical Analysis and Research Hypotheses
2.1. Impact of Circular Economy Demonstration Policy on Green Innovation Efficiency
The Circular Economy Demonstration Policy (CEDP) serves as an institutional innovation aimed at achieving the dual goals of environmental protection and economic development. By promoting resource recycling, waste minimization, and eco-industrial parks, the policy provides an enabling environment for green innovation. According to Wu et al. [
11], cities implementing CEDP have shown significant improvement in green innovation activities. However, most of these studies focus on green patent outputs rather than efficiency, overlooking whether the resources devoted to innovation are optimally utilized. Theoretically, the Porter Hypothesis [
22] suggests that well-designed environmental policies can stimulate innovation efficiency by pushing firms to optimize processes. Additionally, Ghisellini et al. [
7] argue that circular economy initiatives encourage systemic transformation and the integration of clean technologies. These institutional features may enhance the marginal productivity of green innovation inputs, thus improving efficiency.
Furthermore, CEDP may help overcome market failures by providing public support, reducing risk, and correcting externalities associated with green innovation. Therefore, the circular economy policy is expected to improve not only the scale but also the efficiency of green innovation activities. Based on these considerations, the core mechanism through which CEDP affects green innovation efficiency can be understood as the reallocation and optimization of resources, including capital, market factors, and human and material inputs, to overcome inefficiencies and market distortions. This leads to our consolidated hypothesis:
Hypothesis 1. The Circular Economy Demonstration Policy significantly improves green innovation efficiency in Chinese cities by promoting more efficient allocation of resources and reducing market and institutional distortions.
2.2. Mechanisms of Resource Reallocation Improving Green Innovation Efficiency
Building on the above, the key mechanisms driving the improvement in green innovation efficiency under CEDP can be classified into three interrelated but theoretically distinct channels:
One important mechanism through which CEDP may enhance green innovation efficiency is by reducing capital distortions and improving the allocation of financial resources. In many developing regions, capital misallocation remains a structural issue, with resources flowing to low-productivity sectors due to administrative interventions or financing constraints [
23,
24]. The implementation of CEDP often brings with it improved investment standards and stronger institutional oversight, thereby reducing inefficient capital flows. According to Yao et al. [
25], capital distortions have a significantly negative effect on green technological innovation. In contrast, effective reallocation of capital toward high-efficiency, environmentally friendly projects improves total factor productivity and innovation returns [
26]. By promoting sustainable finance and enhancing transparency in project evaluation, CEDP can facilitate better capital matching. Additionally, green project prioritization under CEDP reduces over-investment in polluting sectors and encourages the upgrading of existing industrial structures. Consequently, cities under the CEDP are better able to channel capital into productive green innovations.
Market integration is another critical channel through which CEDP may impact green innovation efficiency. Fragmented markets and institutional barriers often lead to resource stickiness and prevent efficient innovation diffusion across regions [
27]. The CEDP promotes regional cooperation, cross-boundary industrial linkages, and the development of circular supply chains, thereby fostering a more integrated market environment. Integrated markets reduce information asymmetry, facilitate technology spillovers, and enhance specialization, all of which contribute to higher innovation efficiency [
28]. Moreover, market integration enhances scale economies and reduces transaction costs, improving the cost-effectiveness of green R&D. By promoting nationwide circular economy benchmarks, CEDP creates institutional incentives for standardization and coordinated innovation. Based on this reasoning, these dynamics not only enhance the competitive environment but also ensure that innovation inputs are deployed more effectively.
The CEDP may improve green innovation efficiency by promoting more effective allocation of both material and human resources. Inefficient resource allocation often leads to waste, duplication, and reduced innovation productivity [
28,
29,
30]. CEDP encourages systematic planning, promotes digital platforms for resource reuse, and supports technologies that optimize resource deployment [
31]. For example, the integration of digital infrastructure within circular economy zones facilitates real-time tracking and dynamic reallocation of energy, labor, and material inputs. Moreover, circular economy initiatives create institutional mechanisms that reduce coordination failures and support strategic prioritization of R&D activities. Empirical studies confirm that better resource allocation leads to improved productivity and environmental performance [
32,
33]. Based on this logic, CEDP not only increases the availability of green innovation inputs but also improves their marginal contribution to output.
These three channels, while related, represent conceptually distinct aspects of resource reallocation and institutional improvement, which together contribute to raising green innovation efficiency.
Hence, we formalize the following hypotheses:
Hypothesis 2a. The Circular Economy Demonstration Policy improves green innovation efficiency by reducing capital distortions and improving capital allocation.
Hypothesis 2b. The Circular Economy Demonstration Policy enhances green innovation efficiency by promoting market integration and facilitating innovation diffusion.
Hypothesis 2c. The Circular Economy Demonstration Policy enhances green innovation efficiency by improving the allocation and utilization efficiency of human and material resources.
3. Specifications
3.1. Baseline Model
To empirically examine the impact of the Circular Economy Demonstration Policy (CEDP) on green innovation efficiency, this study employs a Difference-in-Differences (DID) approach. The DID method is well-suited to policy evaluation because it allows for the identification of causal effects by comparing changes in outcomes between treated and untreated groups before and after the implementation of the policy. Given the staggered introduction of CEDP across cities and years, DID effectively captures policy variation while controlling for time-invariant city characteristics and common shocks. However, we acknowledge that the standard DID with a simple post × treatment dummy may be biased under staggered adoption timing [
34]. To address this, we complement the baseline analysis with an event-study approach and apply the [
35] estimator as robustness checks (see
Section 4). Compared with simple before-and-after or cross-sectional methods, DID can reduce bias from unobserved heterogeneity. The baseline empirical specification is as follows:
where
represents the green innovation efficiency of city
i in year
t. is a policy dummy variable that equals 1 if city
i is a demonstration city in year
t or after, and 0 otherwise.
is a vector of control variables,
denotes city fixed effects,
denotes year fixed effects, and
is the error term. The coefficient
captures the average treatment effect of the policy. To ensure the validity of the DID approach, we test the parallel trends assumption by examining pre-treatment trends in outcome variables between treated and untreated cities. We also control for potential omitted variable bias by including a rich set of time-varying covariates and fixed effects. Selection bias is mitigated due to the quasi-experimental nature of staggered policy implementation.
3.2. Mechanism Testing Model
To further investigate the internal mechanisms through which
enhances green innovation efficiency, we incorporate interaction terms between the policy variable and potential mediators. These mediators include capital misallocation, market integration, and resource allocation efficiency. The specification is as follows:
In this model, stands for one of the mechanism variables. The coefficient identifies whether and how the mediating variable amplifies or weakens the effect of on green innovation efficiency. A significantly positive would imply that the mechanism plays a reinforcing role.
3.3. Variable Measurement
3.3.1. Explained Variable
Green innovation efficiency (
GIE) is the core dependent variable of this study. Following Chen et al. [
36] we use the super-efficiency Slack-Based Measure (SBM) model to evaluate city-level green innovation efficiency. Compared to traditional DEA models, the SBM method overcomes the slackness issue by incorporating slack variables into the objective function, thereby improving measurement accuracy. Additionally, the model accounts for undesirable outputs such as pollution emissions, which is essential for capturing the environmental dimension of innovation. Specifically, the inputs include R&D personnel and R&D capital, while the desirable output is the number of green patents granted. The undesirable outputs include SO
2 emissions, wastewater discharge, and solid waste generation at the city level. These variables come from the China Environmental Statistical Yearbook and patent databases, as detailed in
Section 3.4.
The general structure of the super-efficiency SBM model is:
Subject to constraints ensuring that inputs, desirable outputs, and undesirable outputs across cities and time remain within feasible bounds. In this setting, ω is the efficiency score; , , and represent slack terms for input, desirable output, and undesirable output, respectively; and , , are the observed values. This formulation allows for comprehensive efficiency measurement while accounting for environmental impacts.
3.3.2. Key Explanatory Variable
The core explanatory variable () in this study is a binary policy indicator reflecting whether a city is designated as a Circular Economy Demonstration City. Based on official lists released by the National Development and Reform Commission and related documents, we assign a value of 1 to cities that began implementing the policy in given year or thereafter, and 0 otherwise. This time-varying treatment variable allows us to distinguish between treated and untreated cities across different years. The staggered implementation provides quasi-natural experimental conditions for causal identification. By aligning implementation years to the corresponding cities, the variable construction ensures accurate reflection of policy exposure.
3.3.3. Control Variables
To mitigate potential omitted variable bias, we include a set of time-varying control variables at the city level. Economic density (ED)is measured as GDP per square kilometer, capturing the intensity of economic activity. Population size (PS) is the log of the end-of-year population, reflecting urban scale. Foreign direct investment (FDI) is expressed as the share of utilized foreign capital to GDP. Government intervention (GOVN) is measured by the ratio of fiscal expenditure to GDP. Education expenditure (EDU) is proxied by the ratio of education spending to general fiscal expenditure. Industrial structure upgrading (IS) is calculated using a weighted index of the shares of primary, secondary, and tertiary industries (with weights of 1, 2, and 3). ED and PS are log-transformed to reduce heteroscedasticity. FDI and GOVN are standardized, while IS retains original weights to capture structural transitions.
3.4. Data Sources and Descriptive Statistics
This study constructs a balanced panel dataset of 285 Chinese cities from 2010 to 2021, resulting in 3384 observations (285 cities × 12 years ≈ 3420; the slight shortfall is due to some missing data filled by linear interpolation where possible). Data on economic and social variables are sourced from the China Urban Statistical Yearbook and China Science and Technology Statistical Yearbook. Environmental indicators come from the China Environmental Statistical Yearbook and provincial environmental bulletins. CEDP implementation data is compiled from official National Development and Reform Commission announcements. Patent data and green innovation outputs are obtained from the State Intellectual Property Office. Monetary values are deflated to 2012 prices using the provincial GDP deflator. City-level clustering is applied to standard errors to correct for serial correlation.
Table 1 provides summary statistics. The average GIE of 0.410 indicates moderate green innovation efficiency, with a minimum of 0.284 and a maximum exceeding 1, reflecting heterogeneity in performance across cities and time. The CEDP dummy has a mean of 0.045, consistent with a minority of cities being demonstration cities at any point. The near-complete panel and small number of missing values support the robustness of our analysis.
4. Empirical Results
4.1. Baseline Regression Results
According to Equation (1), we employ a DID approach to evaluate the impact of the Circular Economy Demonstration Policy (CEDP) on green innovation efficiency (GIE) across Chinese cities.
Table 2 presents the baseline regression results. Column (1) shows the results without any control variables or fixed effects. The coefficient of the policy variable is significantly positive at the 1% level, indicating that the implementation of the CEDP is associated with higher green innovation efficiency. In column (2), after including city-level control variables—such as economic density, population size, foreign direct investment, government intervention, education expenditure, and industrial structure—the coefficient on the policy remains significantly positive, although slightly reduced in magnitude. Columns (3) and (4) introduce city and year fixed effects, respectively, controlling for unobservable city-specific characteristics and time shocks. The coefficient of CEDP remains robust and statistically significant in all specifications.
Specifically, the fully controlled model in column (4) shows a CEDP coefficient of 0.015, suggesting a 1.5 percentage point improvement in green innovation efficiency following policy implementation. Among control variables, economic density (ED) and population size (PS) both have positive and significant coefficients, implying that urban agglomeration and scale economies support green innovation outcomes. In contrast, foreign direct investment (FDI), government expenditure (GOVN), and education expenditure (EDU) show negative coefficients, which may suggest inefficiencies in the allocation or utilization of these resources. The industrial structure upgrading (IS) variable has a consistently positive and significant effect, underscoring the role of advanced industry composition in facilitating green innovation. The baseline regression results offer strong evidence that the Circular Economy Demonstration Policy significantly promotes green innovation efficiency at the city level. These findings are robust across multiple model specifications and highlight the effectiveness of institutional policy interventions in driving green and sustainable urban development.
4.2. Common Trend Test and Dynamic Test
To ensure the validity of the DID approach, it is essential to verify the common trend assumption. This assumption requires that, in the absence of the policy intervention, the treatment and control groups would have followed parallel trends over time.
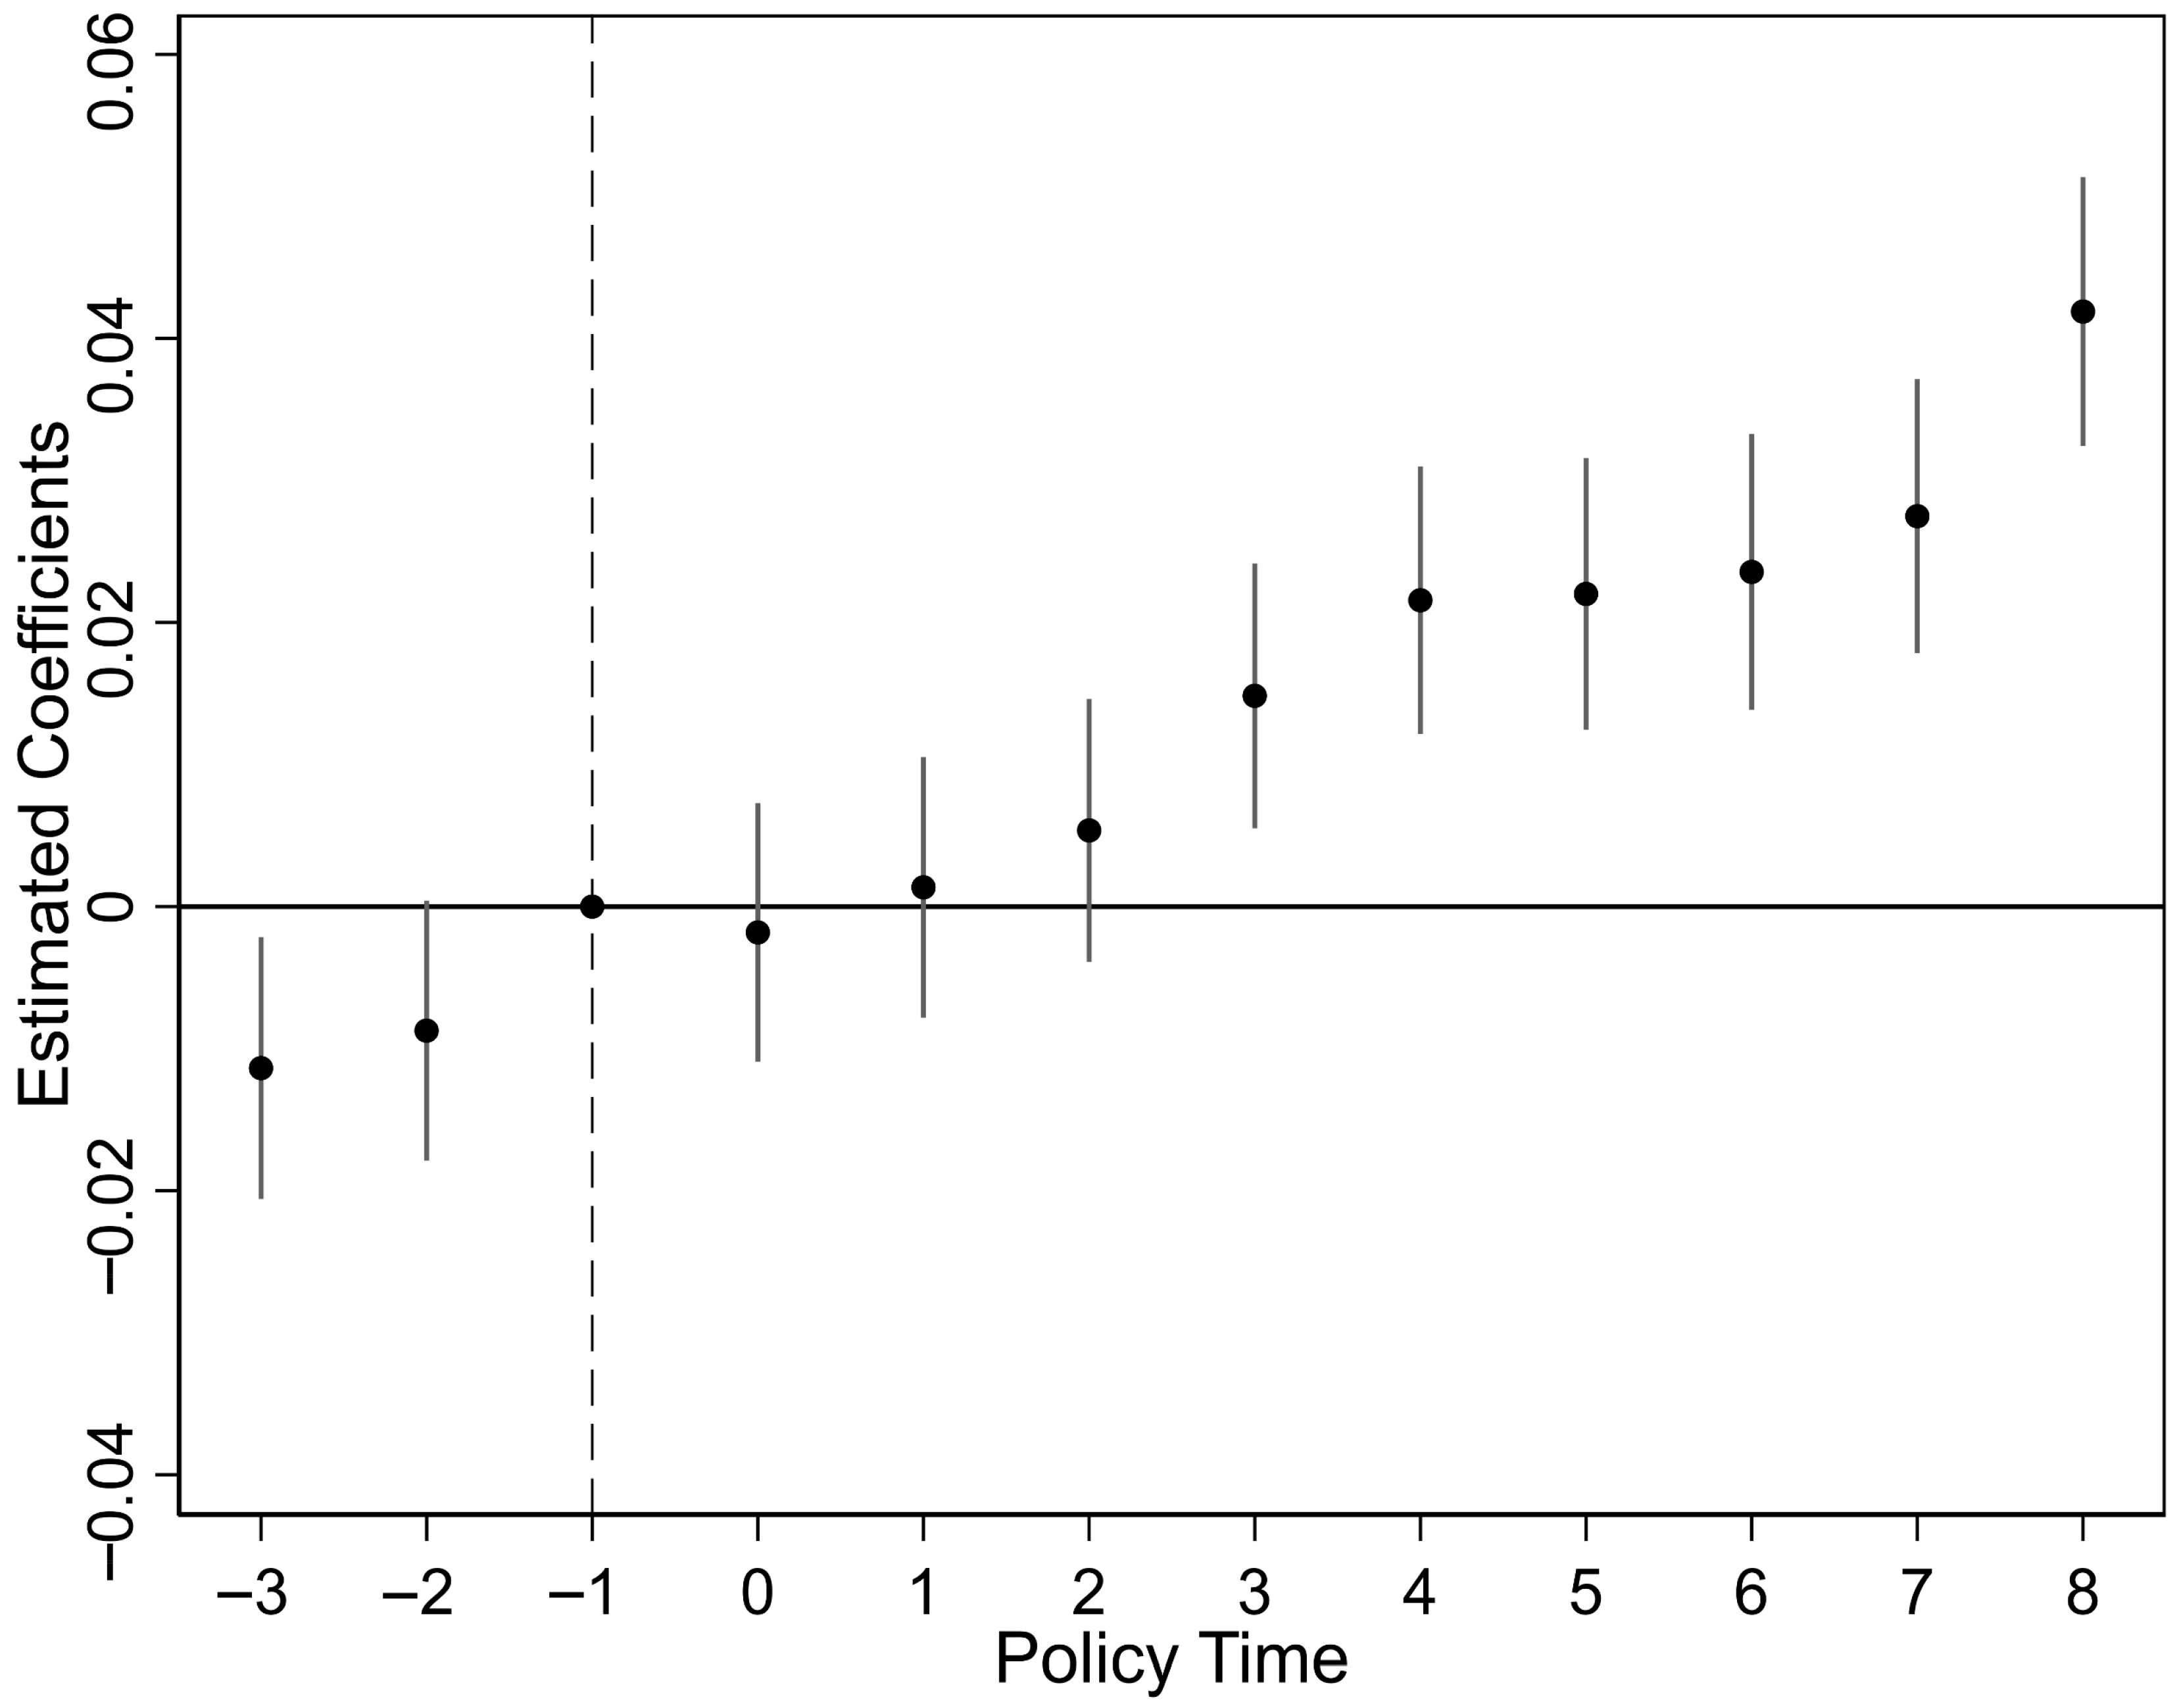
Figure 1 presents the results of the parallel trend and dynamic effects test based on an event-study specification. The estimated coefficients for the years prior to the implementation of the Circular Economy Demonstration Policy (
CEDP) are statistically insignificant and close to zero. This indicates that there were no significant differences in green innovation efficiency (
GIE) between treated and untreated cities before the policy was introduced, thus supporting the parallel trend assumption.
Furthermore, the dynamic treatment effects after policy implementation provide insights into the evolution of policy impact over time. As shown in
Figure 1, the coefficients become positive and statistically significant beginning in the third year after implementation and continue to increase in magnitude over subsequent years. This pattern suggests that the effect of the
CEDP on green innovation efficiency is not immediate but exhibits a time-lagged response. The progressive upward trend in coefficients implies that the benefits of the policy accumulate over time, likely due to gradual improvements in institutional capacity, infrastructure, and policy adaptation.
The dynamic analysis also reveals that the policy impact is persistent, with positive effects sustained for up to eight years after implementation. This provides strong evidence that the CEDP has long-term benefits in enhancing urban green innovation efficiency. The results highlight the importance of stable and continuous policy support to achieve sustainable improvements. In sum, the parallel trend test confirms the validity of our empirical strategy, while the dynamic test illustrates the policy’s delayed and growing effects. These findings further strengthen the causal interpretation of our baseline results.
4.3. Robustness Checks
This study further verifies the credibility of the baseline findings by conducting a placebo test. The core idea is to randomly assign the policy treatment
CEDP to cities and examine whether the falsely assigned treatment also generates a significant impact on green innovation efficiency (
GIE). If the observed policy effect is truly driven by the implementation of the Circular Economy Demonstration Policy, then the artificially constructed placebo policy should not produce significant results. As shown in
Table 3, the estimated coefficients of the placebo variable across all four model specifications are statistically insignificant. The values range from −0.002 to 0.001, and none of them pass even the 10% significance threshold. This indicates that green innovation efficiency does not respond to the pseudo-policy shock, reinforcing the argument that the actual effect observed in the baseline model is not driven by chance or omitted variable bias. Moreover, the control variables in the placebo test generally maintain similar signs and levels of significance, demonstrating the internal consistency of the model. Importantly, after including city and year fixed effects, the placebo coefficients remain insignificant, confirming that the results are not sensitive to model specifications or fixed-effect settings. The robustness test results thus provide strong support for the reliability of our main conclusions. They validate that the significant positive impact of
CEDP on
GIE found in the baseline regression is not spurious. Overall, the placebo test enhances the robustness and credibility of our empirical strategy.
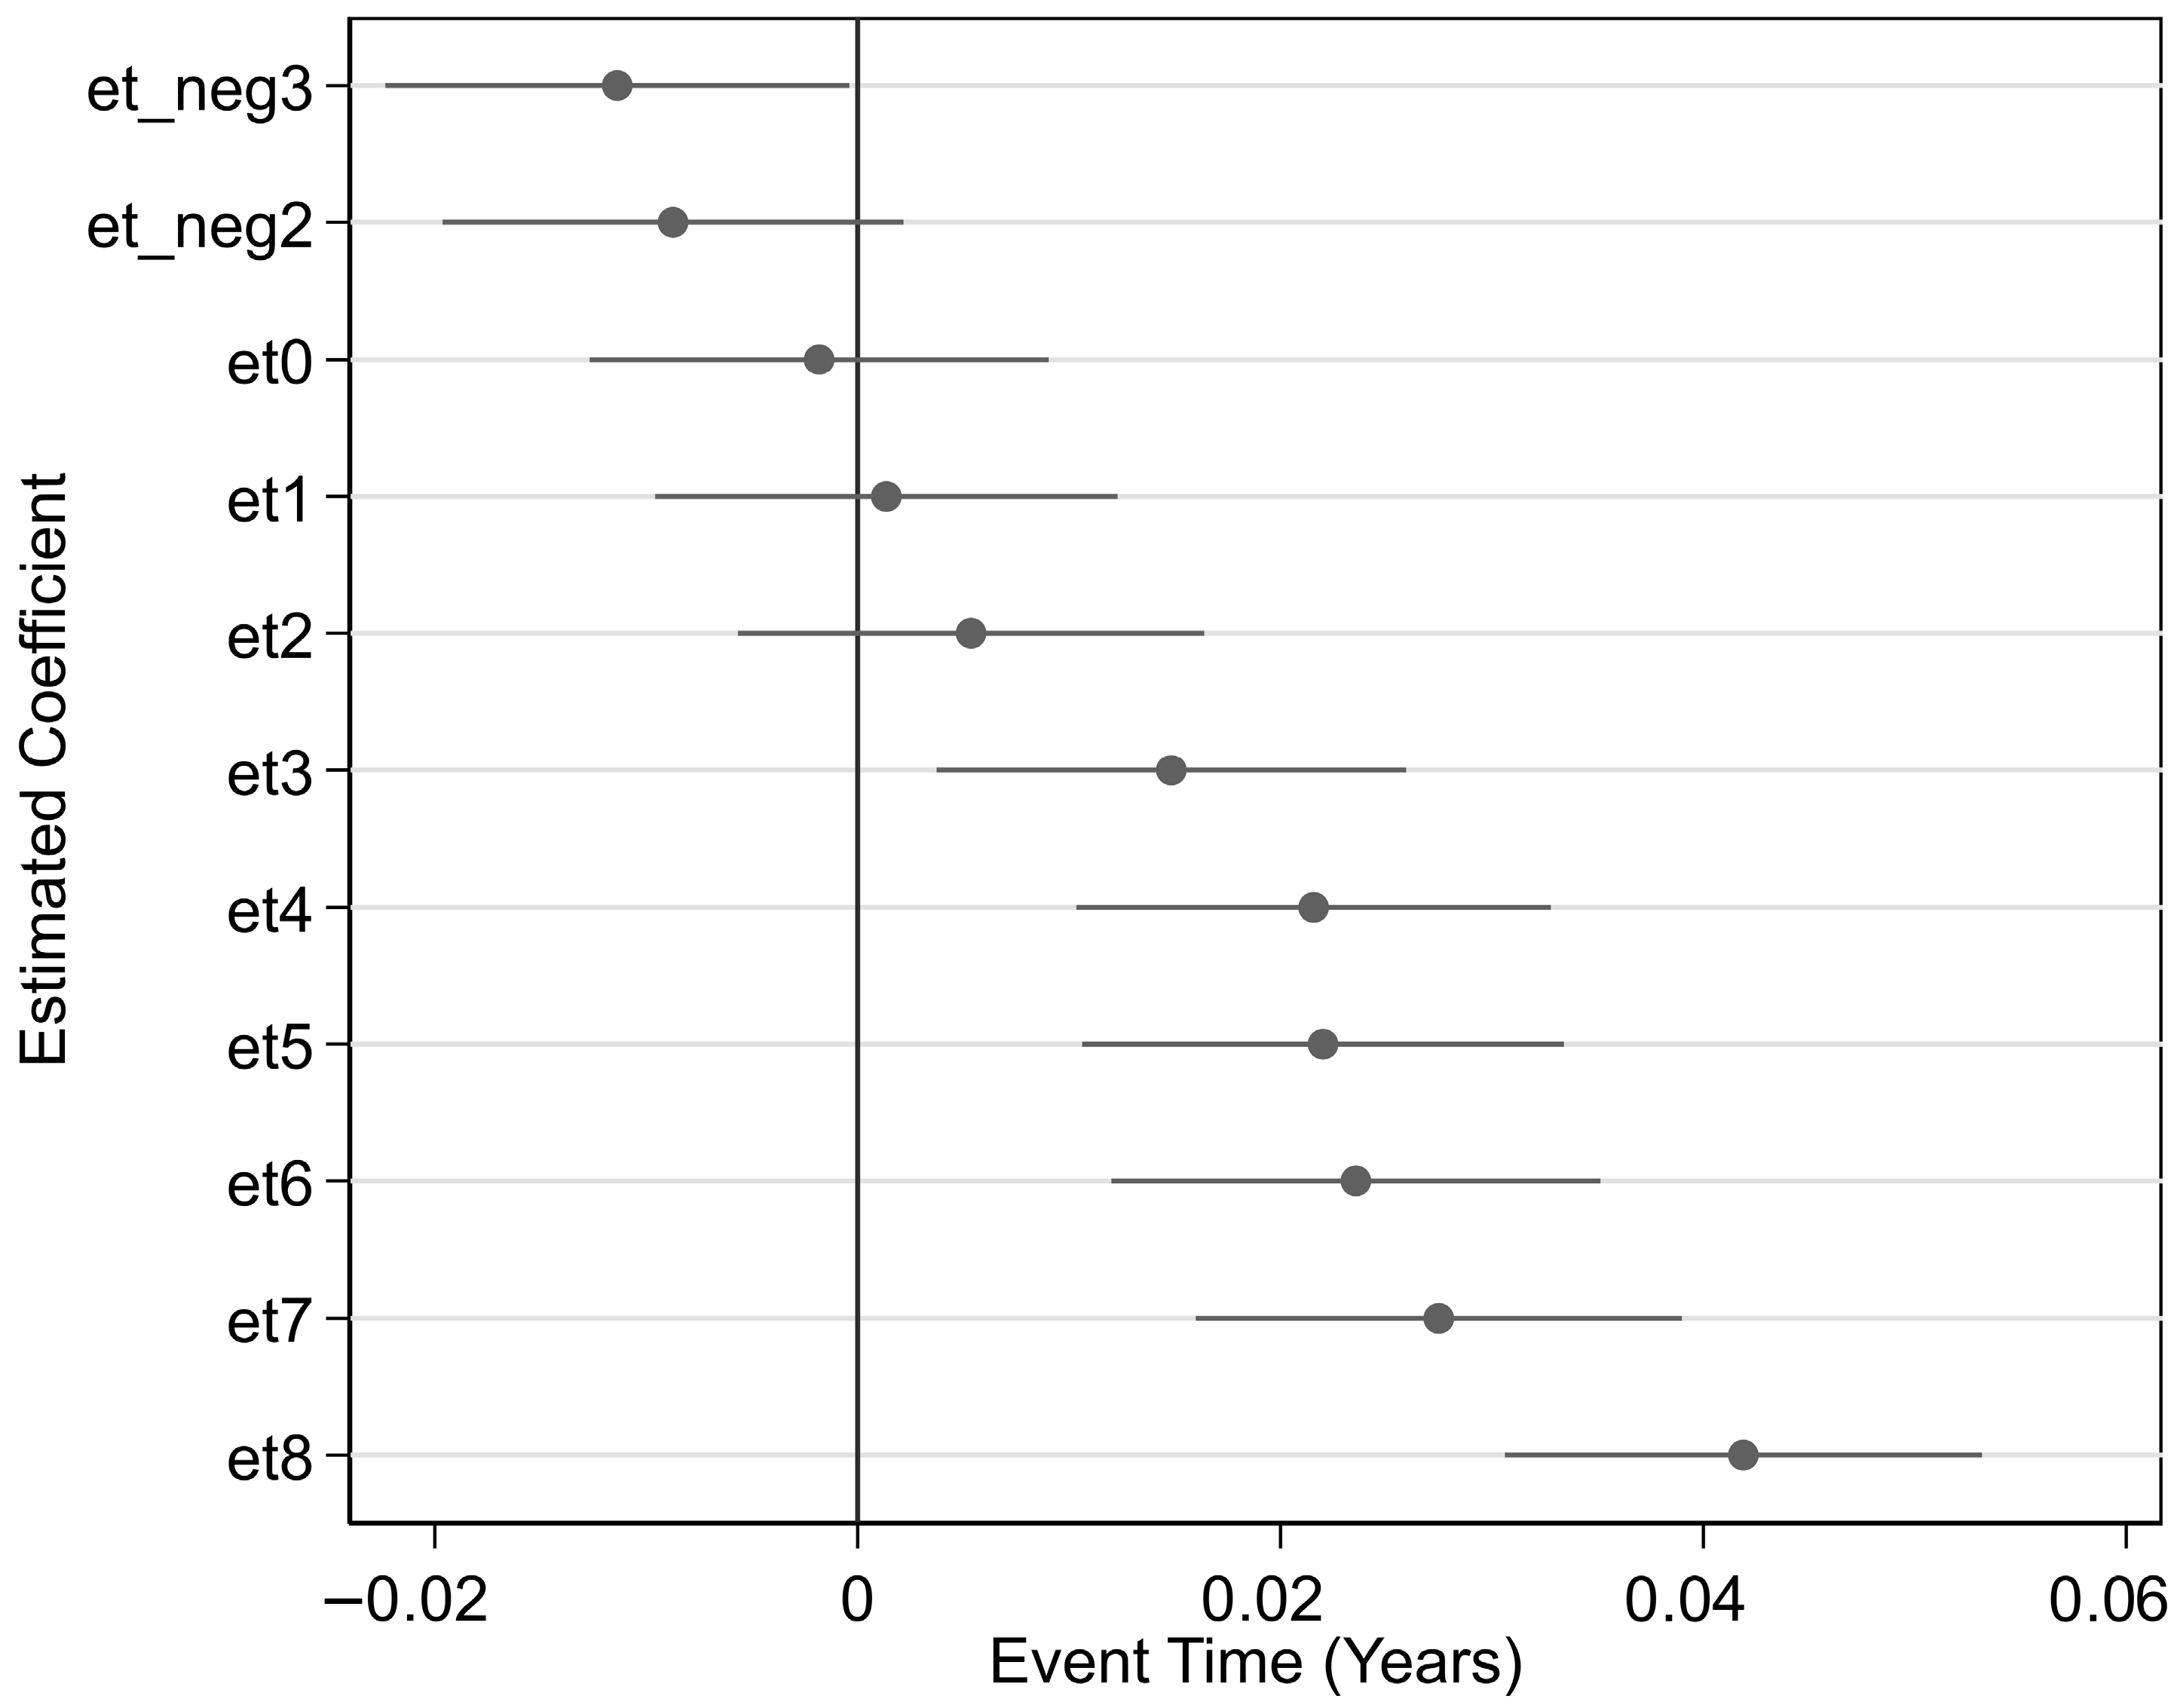
To further examine the dynamic effect of the Circular Economy Demonstration Policy (CEDP) on green innovation efficiency (GIE), we implement an event-study analysis using a set of event-time indicators ranging from three years prior to eight years after the policy implementation. The year prior to the policy serves as the reference period. The results, depicted in
Appendix A,
Figure A1—Event Study Results—reveal that pre-treatment coefficients are statistically insignificant, lending support to the parallel trends assumption. Post-treatment coefficients exhibit a gradually increasing and statistically significant positive trend, suggesting the policy’s effect emerges with a lag and intensifies over time. These dynamic effects provide additional support for the robustness and causal interpretation of our main findings.
To complement the main results, this study additionally examines the effect of the policy on green patent output (GP), which serves as a supplementary outcome variable rather than a robustness check of efficiency. Green patents are commonly used in the literature as a valid proxy for capturing green innovation activities, offering a useful alternative for robustness verification. As shown in
Table 4, the estimated coefficient of the key explanatory variable
CEDP remains significantly positive across all specifications, ranging from 47.779 to 50.981 at the 1% level. This consistency suggests that the Circular Economy Demonstration Policy effectively promotes green innovation, regardless of which outcome measure is used. Additionally, most control variables exhibit expected signs and statistical significance, further supporting the robustness of the model structure. Economic density and population size continue to display positive effects on green patent output, indicating the innovation-enhancing role of urban agglomeration. The industrial upgrading index is also significantly positive, reinforcing the link between structural transformation and innovation. Although education expenditure and government intervention show negative effects, these may reflect delayed policy outcomes or resource misallocations. After controlling for city and year fixed effects, the results remain stable and statistically significant. These findings confirm that the main conclusions are not driven by the specific measurement of green innovation and thus strengthen the empirical credibility of this study.
To further verify the reliability of the baseline results, this study adopts a Propensity Score Matching Difference-in-Differences (PSM-DID) approach. This method helps to mitigate potential sample selection bias by ensuring that treated and control cities are more comparable in their observable characteristics before policy implementation. Based on the results in
Table 5, the coefficient of CEDP remains significantly positive across all model specifications, with values ranging from 0.018 to 0.032, and all significant at the 1% or 5% levels. These findings reaffirm that the Circular Economy Demonstration Policy has a robust positive effect on green innovation efficiency even after addressing selection bias. Furthermore, the coefficients of most control variables remain consistent with the baseline regression, which further confirms the stability of the model structure. The inclusion of city and year fixed effects does not substantially alter the estimated policy effect, indicating that the impact is not driven by time-varying or region-specific unobserved factors. The adjusted R-squared values are relatively high, suggesting a good model fit. Overall, the PSM-DID results provide strong support for the robustness and credibility of the baseline findings. The number of observations in
Table 5 is smaller than in previous regressions due to the implementation of the Propensity Score Matching (PSM) procedure. Specifically, cities in the control group that could not be adequately matched to treated cities based on observable covariates were excluded from the analysis. This sample reduction ensures the comparability of treatment and control groups and enhances causal inference reliability.
5. Mechanism Analysis
This section examines the internal mechanisms through which the Circular Economy Demonstration Policy (CEDP) improves green innovation efficiency (GIE) in Chinese cities. Based on the results in the improved format of
Table 6, we analyze three key channels: (1) reduction of capital distortion (DISTK), (2) improvement of resource allocation efficiency (ALLO), and (3) enhancement of market integration (DIST). The interaction terms between CEDP and these variables reveal how the policy influences green innovation through these pathways. In addition, we quantify the contribution of each channel to the total CEDP effect using the Karlson–Holm–Breen (KHB) decomposition method.
The first mechanism is the reduction of capital distortion, which plays a crucial role in enhancing green innovation efficiency. In
Table 6, DISTK represents the level of capital distortion, and its positive coefficient suggests that lower capital distortion supports higher green innovation efficiency. Importantly, the interaction between CEDP and DISTK (CEDP × DISTK) is significantly positive, indicating that the policy mitigates capital misallocation problems. This finding implies that CEDP helps redirect capital from inefficient or polluting uses toward more productive, environmentally friendly investments. Capital distortion often arises from institutional barriers or financing constraints, which limit the flow of funds to green innovation projects. By establishing stricter investment standards and improving institutional oversight, the policy reduces such distortions and promotes more efficient capital allocation. Consequently, cities under CEDP can better allocate financial resources to green technologies, improving overall innovation efficiency. The KHB decomposition shows that this mechanism explains approximately 41% of the total policy effect on GIE.
The second mechanism involves market integration, which is critical for the diffusion and scaling of green innovations. The variable DIST captures the level of market integration, and its positive coefficient confirms that better-integrated markets are conducive to improving green innovation efficiency. The significant and positive interaction term between CEDP and market integration (CEDP×DIST) indicates that the policy strengthens this channel. By promoting regional cooperation and building circular supply chains across city and provincial boundaries, CEDP reduces institutional and market fragmentation. This integration helps lower transaction costs and information asymmetry, fostering knowledge spillovers and technology diffusion. Furthermore, integrated markets enable economies of scale and specialization, which are essential for cost-effective green R&D. The policy also encourages the establishment of standardized circular economy benchmarks, facilitating coordinated innovation efforts among firms and institutions. These developments create a more competitive and collaborative environment, where green innovations can thrive and spread efficiently. According to the KHB analysis, market integration accounts for about 29% of the total CEDP effect on GIE.
The third mechanism is the improvement of resource allocation efficiency, as reflected in the variable ALLO and its interaction with CEDP. The positive and highly significant coefficient on ALLO suggests that better allocation of resources such as energy, labor, and materials directly contributes to higher green innovation efficiency. The strong positive interaction term (CEDP×ALLO) shows that CEDP substantially amplifies this effect. The policy supports the use of digital platforms and data-driven management systems that enable real-time tracking and dynamic reallocation of inputs. This reduces waste, duplication, and inefficiencies in resource deployment, ensuring that innovation activities receive the most effective support. By fostering strategic coordination and prioritization of green R&D efforts, CEDP helps overcome typical coordination failures in resource management. These improvements not only increase the quantity of inputs but also raise their marginal productivity, resulting in higher innovation output per unit of resource. The KHB results indicate that this channel explains roughly 23% of the overall policy effect.
Moreover, the results reveal significant and negative coefficients for FDI, GOVN, and EDU, suggesting that foreign direct investment, local government size, and education inputs are not always aligned with green innovation. This could be due to pollution-intensive FDI inflows, inefficiencies in local government investment, or misalignment between education programs and technological needs. These findings are consistent with prior studies highlighting the “pollution haven” hypothesis in FDI, and the misallocation of public resources.
To further probe the interaction between mechanisms, we employ a structural equation modeling (SEM) framework to explore the indirect and direct effects among capital misallocation (DISTK), market integration (DIST), and resource allocation efficiency (ALLO). The SEM results suggest that capital misallocation negatively impacts market integration, indicating that higher capital distortion restricts market fluidity by limiting interregional capital flows and reinforcing local protectionism. This indirect negative pathway implies that capital misallocation not only directly reduces green innovation efficiency but also does so by weakening market integration. Meanwhile, resource allocation efficiency positively influences both market integration and green innovation efficiency, demonstrating a reinforcing role. Therefore, the total effect of capital misallocation on green innovation efficiency comprises both a direct negative effect and an indirect negative effect mediated by market integration. This highlights the importance of coordinated policy efforts that simultaneously target financial market reforms and institutional market integration to maximize the effectiveness of CEDP. By explicitly modeling these interactions, our analysis provides a more comprehensive understanding of the internal mechanisms through which CEDP enhances green innovation efficiency, effectively addressing the previously noted limitation.
6. Further Analysis
First, we examine the heterogeneity of the Circular Economy Demonstration Policy (CEDP) effects based on city size, dividing the sample into central cities and non-central cities. As shown in
Table 7, the coefficient of CEDP is positive and statistically significant for central cities (0.204,
p < 0.01), while it is close to zero and insignificant for non-central cities (0.001). This indicates that CEDP’s impact on green innovation efficiency (GIE) is much stronger in larger, more developed cities. Central cities typically have better infrastructure, more advanced technology, and richer human capital, enabling them to better leverage the policy’s incentives. Additionally, these cities often have more diversified industries and stronger institutional capacities to implement circular economy initiatives effectively. The control variables, such as education (ED) and market size (PS), have significant positive effects in both groups, reaffirming their importance as drivers of innovation. Meanwhile, foreign direct investment (FDI), government intervention (GOVN), and education expenditure (EDU) show negative effects, with larger magnitudes in central cities, possibly reflecting more complex adjustment costs or inefficiencies. These findings suggest that policymakers should consider city size differences and tailor support measures to maximize the policy’s effectiveness across diverse urban environments.
Second,
Table 8 presents heterogeneity results by capital city status. The effect of CEDP is positive and significant in capital cities, with a coefficient of 0.238 (
p < 0.01), while it is nearly zero and insignificant in non-capital cities (−0.002). This highlights the advantage capital cities have in utilizing policy incentives due to concentrated political, economic, and technological resources. The more mature institutional environment and stronger enforcement mechanisms in capitals likely contribute to these differences. Education (ED) and market size (PS) again have significant positive impacts on green innovation in both groups, emphasizing their foundational role. Negative effects of FDI, government intervention, and education expenditure persist, with larger coefficients in capital cities. These patterns imply that despite the resource advantages in capital cities, challenges related to managing external investments and policy implementation remain. For non-capital cities, strengthening institutional capacity and reducing barriers are essential to fully benefit from the circular economy policy.
Third, we explore geographic heterogeneity by region, dividing cities into eastern, central, and western groups, as shown in
Table 9. The coefficient for CEDP is significantly positive in eastern cities (0.046,
p < 0.01), negative and significant in central cities (-0.018,
p < 0.01), and positive but insignificant in western cities (0.007). This counter-intuitive negative effect in central cities may reflect two potential issues. First, there may be unfavorable pre-treatment trends, as central regions were already facing stagnation in innovation capacity prior to the policy’s implementation. Second, the implementation of CEDP may have diverted limited administrative or financial resources away from other key innovation-supporting activities, leading to unintended negative outcomes. Moreover, central regions often exhibit moderate institutional capacity—neither as robust as eastern cities nor as supported by compensatory aid as western cities—leaving them vulnerable to inefficient policy execution. Control variables such as education and market size also have the strongest positive effects in eastern cities, with weaker or insignificant influences in other regions. Negative or insignificant impacts of FDI and government intervention across regions highlight common challenges in governance and external resource management. These results also provide empirical support for our policy recommendations: given the observed regional asymmetry, future circular economy policies should adopt a regionally differentiated approach, with special attention to institutional strengthening in central regions to avoid policy misalignment or inefficiencies.
7. Conclusions and Policy Implications
This study investigates whether and how China’s Circular Economy Demonstration Policy (CEDP) promotes urban green innovation efficiency (GIE)—a critical policy question in the context of sustainable development and environmental governance in emerging economies. We conduct a rigorous evaluation using a DID approach with city-level data spanning 2010 to 2021. The baseline findings offer robust evidence that CEDP significantly enhances GIE, with the fully controlled model indicating an average increase of 1.5 percentage points following policy implementation. Notably, the policy’s effect is not immediate; it exhibits a time-lagged pattern, becoming statistically significant from the third year onward and accumulating over time, as confirmed by dynamic effect tests. The validity of the parallel trend assumption further strengthens the empirical reliability of the results. A series of robustness checks—including placebo tests, substitution of the dependent variable with green patent output, and propensity score matching with DID—consistently confirm the positive and causal impact of the policy. Mechanism analysis reveals that CEDP works through three main pathways: reducing capital distortion (DISTK), enhancing market integration (DIST), and improving resource allocation efficiency (ALLO). Importantly, this study finds that these mechanisms are not isolated but mutually reinforcing, suggesting the need for a systemic approach to policy design.
Additionally, heterogeneity analyses indicate that the policy’s benefits are concentrated in central cities, capital cities, and eastern regions, highlighting how pre-existing economic and institutional capacities amplify policy effectiveness. However, in central China, we find an unexpected negative impact, which may reflect pre-policy differences, resource diversion, or implementation frictions—a finding that calls for further exploration in future research.
Several important insights emerge from these findings regarding environmental policy effectiveness in developing economies: First, the delayed yet intensifying effect of CEDP underscores the need for patience in policy evaluation and the importance of long-term institutional learning, infrastructure upgrading, and firm-level adaptation. Second, the pronounced heterogeneity across city types and regions raises critical concerns about both equity and efficiency. Central and eastern cities are better positioned to leverage CEDP due to their human capital, financial resources, and institutional maturity, while non-central and western cities face structural and institutional constraints. Third, the counterintuitive negative coefficients for education expenditure (EDU) and foreign direct investment (FDI) may indicate inefficiencies—e.g., education spending being misaligned with green innovation needs or FDI concentrated in pollution-intensive industries. This highlights the need to improve the quality—not just the quantity—of resource inputs. Finally, the mechanism analysis reveals that enabling institutional and market conditions—such as reducing resource misallocation and lowering market fragmentation—are as crucial as direct subsidies. This aligns with institutional theory, which emphasizes that well-functioning markets and credible policy signals are essential for green innovation.
The findings from this study offer several actionable implications: First, CEDP implementation should be regionally tailored. Eastern and central cities should focus on advanced circular industrial chains and innovation clusters, while western and less developed areas require basic infrastructure and governance capacity-building to create a supportive environment for circular economy initiatives. Second, institutional capacity building is essential, particularly for non-core and peripheral cities. This includes technical assistance, digital resource-sharing platforms, and inter-city collaboration networks to promote knowledge exchange and reduce implementation barriers. Third, policy design should focus not only on subsidies but also on optimizing enabling mechanisms. Reforms aimed at green credit allocation, cross-regional supply chain integration, and resource mobility can enhance GIE more sustainably and equitably.
Despite these insights, the study has several limitations. First, our measurement of GIE is primarily based on patent and input-output data, potentially overlooking non-patent or informal innovations. Future work could incorporate qualitative case studies or alternative innovation indicators. Second, while the DID approach and robustness tests reduce bias, unobserved confounders such as leadership quality or social trust may still affect the results. Third, although we identify key mechanisms, we do not model their dynamic interdependence. Future research using Structural Equation Modeling (SEM) or system dynamics could better capture these complex relationships.


