Article

Exploring the Triple Dividend Effect and Threshold Effect of Environmental Protection Tax: Evidence from Chinese Listed Companies

1
Institute of Economics and Management, Ural Federal University Named After the First President of Russia B.N. Yeltsin, Yekaterinburg 620062, Russia
2
Institute for Research of Social and Economic Changes and Financial Policy, Financial University Under the Government of the Russian Federation, Moscow 125167, Russia
*
Author to whom correspondence should be addressed.
Sustainability 2025, 17(15), 7038; https://doi.org/10.3390/su17157038 (registering DOI)
Submission received: 28 June 2025 / Revised: 24 July 2025 / Accepted: 31 July 2025 / Published: 3 August 2025
(This article belongs to the Section Air, Climate Change and Sustainability)

Abstract

This study uses financial data from 872 Chinese listed companies (2018–2022). It tests the triple dividend effect and threshold effect of China’s environmental protection tax (EPT) using high-dimensional fixed effects models and panel threshold models. We document that (1) EPT creates an environmental dividend for Chinese listed companies. It significantly reduces pollution emissions. A 1-unit tax increase reduces LnTPPE by 2.5%. (2) EPT creates a significant innovation dividend. It forces enterprises to improve the quality of authorized patents. A 1-unit tax increase raises patent technological complexity by 0.79%. (3) EPT creates an economic dividend. It significantly improves firm performance. A 1-unit tax increase raises relative corporate revenue by 38.1%. (4) EPT exerts significant threshold effects on micro-level triple dividend outcomes among Chinese listed companies. A heterogeneity analysis shows significant differences in threshold effects between non-heavily polluting and heavily polluting industries. This study confirms that China’s EPT generates a micro-level triple dividend effect alongside coexisting threshold effects for listed companies. This provides literature references for China to design and implement differentiated policies and offers a quantitative empirical case for implementing globally sustainable EPT strategies.

1. Introduction

Global climate crises and ecological deterioration are intensifying. The Porter Hypothesis [1] posits that appropriate environmental regulation can stimulate corporate innovation and enhance long-term competitiveness. Environmental taxes correct pollution behaviors through policy signals, theoretically improving ecological conditions, stimulating green technology innovation, and promoting economic growth [2,3]. As a crucial policy tool balancing economic growth and ecological protection, environmental taxes are widely regarded as vital pathways for sustainable development [4,5]. From the 1990s environmental tax reforms pioneered by Nordic countries to China’s implementation of the environmental protection tax law (EPT) in 2018, replacing its previous pollutant discharge fee system, significant variations in policy effectiveness have emerged since EPT’s 2018 enactment. Its potential multiple benefits and drawbacks have attracted extensive academic attention. Research shows divergent views on EPT’s “inhibitive effect” and “promotive effect” [6]. Environmental taxation’s inhibitory effect on carbon emissions is widely confirmed [7]. Chenghao et al. [8] verified EPT’s promotive effect on China’s regional economy. Deng et al. [9] identified a double dividend achieved through enhanced corporate resilience and carbon reduction. Kettner et al. [10] studied Austria’s carbon pricing revenue recycling mechanisms, demonstrating their potential for achieving a triple dividend: emission reduction, economic growth, and consumption equity. Pereira et al. [11] noted that appropriately using tax revenues for tax reductions and energy efficiency investments can achieve a triple dividend: emission reduction, economic promotion, and fiscal improvement. However, actual schemes miss opportunities by failing to optimize revenue usage.
The concept of the “double dividend effect” was proposed [12]. Its continuous development led to exploring the “triple dividend effect” [13,14]. Based on the above practical and theoretical backgrounds, this study defines EPT as achieving three simultaneous objectives: improving environmental quality (environmental dividend), promoting corporate green technology innovation (innovation dividend), and advancing economic development (economic dividend).
Current research limitations highlight the complexity of studying triple dividend mechanisms. There are three theoretical gaps: First, most studies focus solely on one or two dividend dimensions, fragmenting the intrinsic linkages among environmental, innovation, and economic effects. Second, traditional models over-rely on linear assumptions; most research examines only emission reduction effects [15,16], neglecting cross-period impacts on innovation quality (e.g., patent complexity) and firm value. Threshold effect research is fragmented [17,18], ignoring EPT’s threshold effects—for instance, the Porter Hypothesis cannot explain innovation effects when tax burden exceeds critical points. Third, research on industrial heterogeneity lags, lacking quantitative evidence on regulatory response differences between heavily and non-heavily polluting industries. Studies on policy transmission mechanisms remain fragmented, failing to establish a unified analytical framework for environmental taxes’ synergistic effects on pollution control, technological innovation, and value creation.
In practical research, theoretical shortcomings manifest in two aspects: First, existing studies simplistically treat EPT policy effects as exogenous shocks for empirical analysis [3,8,19,20], without constructing multidimensional empirical and robustness analyses. Second, policy implementation is studied as a “one-size-fits-all” strategy with singular evaluation dimensions. This theory–practice gap urgently necessitates building an integrated micro-mechanism analysis system.
China’s EPT, implemented in 2018, adopts differentiated tax rates and tax reduction measures. This design enhances the policy flexibility of EPT and provides a unique environment for studying corporate triple dividend mechanisms.
This study proposes five sets of hypotheses. H1-H3 verify the micro-level triple dividends of EPT (environmental emission reduction/green innovation/economic performance improvement), H4 reveals the nonlinear threshold effect of the triple dividends (environmental/innovation/economic dimensions critical points), and H5 confirms that the threshold responses of non-heavily polluting industries and heavily polluting industries are significantly different.
The distinctive contribution lies in establishing the first integrated analytical framework combining triple dividends, threshold effects, and industrial heterogeneity, providing a micro-empirical engine for precision regulation of environmental policy transitions.
This study is structured as follows: Section 1: EPT theory and practical background, research gaps, research questions, and innovations. Section 2: Developing the analytical framework and proposing research hypotheses. Section 3: Data sources (Chinese listed company panel data), variable definitions, model specification. Section 4: Analysis of triple dividend effects and threshold effects, robustness checks, and heterogeneity analysis. Section 5: Hypothesis validation, theoretical and practical contributions, limitations, and future research directions. Section 6: Summary of findings.

2. Literature Review and Theoretical Hypotheses

2.1. Literature Review on EPT’s Environmental Dividend

Research on EPT’s environmental dividend mainly focuses on the scale effect and structural effect of pollution reduction. Recent studies confirm EPT’s emission reduction effect [21,22,23]. Others study EPT’s role in promoting corporate ESG [24,25,26]. From a micro-enterprise research perspective and methodology, the majority of studies employ the difference-in-differences (DID) method to establish micro-enterprise empirical research [9,27,28]. These studies have empirically demonstrated, to a certain extent, the policy effectiveness of environmental taxes in controlling pollution reduction, achieving the environmental dividend effect. Theoretically, they primarily rely on the green dividend within the double dividend theory to explore how environmental goals are achieved [9,29,30]. In 1991, British economist David [13] formally proposed the “double dividend”. Bovenberg [14] further empirically demonstrates that environmental taxes affect economic development through two channels, yielding a double dividend.
In summary, the environmental dividend in this study stems from this origin. Current research has two limitations: (1) Over-reliance on linear models ignores the “threshold compensation” effect of EPT on pollution control. (2) The micro-level transmission mechanism is unclear. There is no empirical evidence on how EPT drives pollution control decisions through cost internalization.

2.2. Literature Review on EPT’s Innovation Dividend

Research on EPT’s innovation dividend has shifted from the “cost inhibition” paradigm to the “innovation compensation” paradigm [1,31]. In the context of environmental taxation, the balance between the cost effect and innovation offset effect manifests as a dynamic mechanism. EPT constrains enterprises through an environmental cost signaling mechanism, internalizing pollution externalities to mitigate the negative impacts of taxation [32,33]. This mechanism spurs enterprises to intensify investments in green technology R&D, leading to synergistic improvements in technological innovation and environmental performance [34,35]. By leveraging the “innovation offset effect,” EPT incentivizes enterprises to enhance their green technology innovation (GTI) capabilities, thereby neutralizing incremental environmental compliance costs. At the policy level, implementing tax credit transfer mechanisms can alleviate corporate tax burdens, with endogenous revenue growth directly strengthening GTI capacity. Furthermore, empirical studies indicate that green taxation exhibits no statistically significant impact on overall innovation, environmental innovation, or non-environmental innovation in developed economies in the short term [36]. Some studies [37,38,39,40] suggest EPT drives innovation through an “R&D subsidy effect,” but do not distinguish patent quality dimensions. Breakthrough research [41,42] found EPT can improve corporate patent technology, but lacks examination of technological synergy (e.g., cross-field patent portfolios). The recent literature [19] constructed a “knowledge spillover index,” proving EPT increases the proportion of cross-group patents via a “technological catch-up effect.” Gaps remain: measurement of technological complexity lags; traditional patent classification cannot capture patent depth; and industry heterogeneity mechanisms are unknown.

2.3. Literature Review on EPT’s Economic Dividend

Some studies [43,44,45] empirically prove EPT can promote economic growth. Studies also point to the double dividend effect (coexistence of environmental and economic dividends) [9,46,47,48], and the feasibility of a triple dividend [10,11]. Some even suggest a quadruple dividend effect for carbon taxes [49]. However, few studies examine the triple dividend effect of China’s EPT.

2.4. Literature Review on EPT’s Threshold Effect

Studies on threshold effects or nonlinear relationships of EPT [3,17,18,49,50] primarily focus on developed economies and OECD countries, with minimal research examining EPT impacts within individual nations and scarce investigation into its micro-level corporate effects. Classic research [51] proposed the “single threshold model,” showing EPT’s pollution suppression effect strengthens significantly beyond a threshold, but did not consider multidimensional threshold variables. Research [52] found EPT has U-shaped relationships with energy transition under different conditions. Current research neglects how EPT effects influence threshold effects or nonlinear relationships at the micro-enterprise level, with mechanisms of sectoral heterogeneity among micro-level enterprises remaining unclear.

2.5. Theory and Hypotheses

Building upon Porter’s Hypothesis [1], the double dividend theory of environmental taxation [43], this study examines the triple dividend effect and threshold effect of China’s EPT. It reveals the micro-level mechanisms through which environmental taxes influence corporate performance via multiple pathways. By internalizing pollution costs through policy signals [3,21,22,23], it directly suppresses emissions, spurs corporate green technology innovation [34,35], and ultimately achieves scale economy effects [10,11,43,44,45]. Therefore, Hypotheses 1, 2, and 3 are proposed:
H1. 
The implementation of EPT has significantly reduced corporate pollution emission levels.
H2. 
EPT has significantly improved green technological innovation.
H3. 
EPT has a significant positive effect on corporate performance.
Hansen [51] pioneered the systematic analytical framework for fixed-effect panel threshold models, establishing the methodological foundation for related research. This framework has been widely applied and significantly extended in subsequent studies. The recent literature [53,54,55] continues to deepen its applications, focusing particularly on identifying and estimating more complex conditional threshold effects, with threshold theory continuing to evolve. Therefore, to verify the nonlinear relationships of the aforementioned EPT triple dividend effects in this study, Hypothesis 4 is proposed:
H4a. 
EPT’s pollution reduction effect has a threshold effect.
H4b. 
EPT’s technological innovation effect has a threshold effect.
H4c. 
EPT’s firm performance enhancement effect has a threshold effect.
EPT imposes cost transmission pressures, causing enterprises with heavily polluting versus non-heavily polluting industries characteristics to exhibit differing resilience capacities. This leads to significant divergence in their thresholds and effect intensities in responding to policy shocks. Thus, Hypothesis 5 is proposed in this study:
H5. 
The threshold effects of EPT’s triple dividends differ significantly between non-heavily polluting industries and heavily polluting industries.
By matching China’s corporate pollution database, financial data, and patent data, this study provides micro-level evidence for the “Porter Effect” of EPT and extends the double dividend to a triple dividend effect. It offers a theoretical basis and practical insights for optimizing EPT design and promoting the sustainable development of enterprises under the “Dual Carbon” goals.

3. Research Design

3.1. Data

The raw data comes from annual reports of listed companies. It was compiled and calculated by the “PPMANDATA” platform, sourced from the PPMANDATA database. Second, EPT data was collected. This involved selecting and extracting EPT data published by China’s A-share listed companies. The data covers the period from 2018 to 2022. Companies were classified based on whether they belong to heavily polluting industries. Companies with excessive missing values were excluded. Some missing values were filled using a regression prediction model. Some variables were sourced from the CSMAR database. Invention patent data came from the China National Intellectual Property Administration. Companies classified as (ST), (PT), and (*ST) were also excluded. Finally, a sample of 872 companies was obtained, totaling 4360 observations.

3.2. Variables

Table 1 contains the names of the variables, their explanations and calculation methods, and the data source used. As introduced and demonstrated by Rao et al. [56], Shen & Zhang [57], and Zhou et al. [58], the study incorporates a comprehensive set of control variables that are carefully selected to summarize the operating and financial health of listed companies. The selection of these control variables is well supported in the literature.
This study uses the quality of patent applications as a proxy variable for the innovation dividend. It innovates in measuring both applied patent quality and granted patent quality. First, this study collects the main classification codes of patents held by listed companies. China uses the IPC patent classification system. The format is “Section—Class—Subclass—Main Group—Subgroup,” for example, “A01B01/00.” Simply counting the number of unique main classification codes in a firm’s patents does not accurately reflect internal differences in patent quality. It may overestimate patent quality. For example, Company A has three patents with main classification codes: A01B01/01, A01B01/02. Company B has three patents with main classification codes: A01B02/00, B02C03/00. Both companies have the same number of unique classification codes. However, Company A’s patents only utilize variations within the single main group A01B01. Company B’s patents utilize two distinct main groups: A01B02 and B02C03. Clearly, Company B’s patents demonstrate a broader and likely more advanced application of technology. Therefore, Company B has higher patent quality.
To address this, this study defines corporate patent quality at the main group level, drawing on the calculation concept of the Herfindahl Index:
P a t e n t i t =   1 X m i t X i t 2
where Xmit is the cumulative number of invention and utility model patent applications by firm i in main group m up to year t; Xit is the cumulative number of all patent applications by firm i across all main groups up to year t.
A higher value of Patentit indicates a higher quality of the firm’s patent applications. The same logic applies to measuring the quality of granted patents. In data processing for this metric, we only included invention patents and utility model patents. This is for two reasons: 1. Design patents use a completely different classification system from invention and utility model patents. They cannot be calculated using the same method. 2. Compared to invention and utility model patents, design patents reflect relatively lower independent innovation capability. They do not adequately represent the complexity of knowledge applied during patent creation. Therefore, design patents were excluded.

3.3. Descriptive Statistics of Variables

Table 2 contains 4360 observations. The number of observations for all variables is 4360. This indicates the dataset is complete with no missing values. The data is described in detail as follows:
Water Pollution Equivalents: Comprehensive water pollution equivalent and total pollution equivalent show very low volatility.
Patent Quality: High quality but contains zero values. The relatively small standard deviation indicates overall high patent quality among sample listed companies, with a relatively concentrated distribution.
Financial Scale: Operating revenue, total profit, and net profit are substantial. The mean values of the logarithms of operating revenue, total profit, and net profit, when converted back to original values, are very large. This shows the sample mainly consists of large- and medium-sized enterprises. The relatively large standard deviations indicate significant size differences between Chinese listed companies.
Environmental Tax Burden: The mean actual paid EPT (14.519) is slightly lower than the mean payable EPT (14.698). This suggests that sample Chinese listed companies, overall, exhibit slight tax avoidance or benefit from tax incentives. The large standard deviation indicates significant differences in environmental tax burden between Chinese listed companies. The wide range between max and min values further confirms substantial variation in EPT burden across Chinese listed companies.
Financial Performance and Risk: The OPGR fluctuates greatly, and there are significant differences between different companies. Cash ratio, average cash short-term debt repayment capacity is acceptable, there are tax incentives/penalties in the comprehensive tax rate, and R&D investment is relatively concentrated. ROA: Mean 0.030, standard deviation 0.081. Min −1.856, Max 0.759. Overall profitability is low and highly volatile, with significant losses in some Chinese listed companies.
Financial Leverage and Risk: Financial Leverage: Mean 1.525 appears acceptable, but the standard deviation is very large (4.634). Min −6.365 indicates negative shareholder equity with a large absolute value. Max 270.994 shows liabilities far exceeding assets.
Asset–Liability Ratio: Mean 47.2%, within the commonly considered reasonable range of 40–60%.
Financial Expenses: Mean 18.148, standard deviation 1.612, indicating significant variation in interest burdens among Chinese listed companies.
These descriptive insights lay the foundation for a more detailed examination of the impact of EPT on corporate micro-performance and preliminarily reveal the mysteries of corporate environmental management, financial stability, and operations, laying the foundation for in-depth empirical exploration.

3.4. Triple Dividend Effect Model Construction

The two-way fixed effects (TWFE) model is a robust empirical tool for testing policy effects. It is a standard and powerful method for handling panel data. It controls unobservable time-invariant heterogeneity and time trends. This makes it highly suitable for evaluating the effect of the EPT, effectively mitigating omitted variable bias.
Therefore, this study directly uses the TWFE model to verify the triple dividend effect of the EPT. It also controls for firm, year, and whether the firm belongs to a heavily polluting industry. Three TWFE models are constructed as follows:
Y i j t =   α 0 +   α 1 X i j t +   k = 1 n α k c o n t r o l i , t   +   μ i + γ t +   ϕ j +   ε i t j
W i j t = β 0 t + β 1 X i j t + k = 1 n β k c o n t r o l i , t + μ i + γ t + ϕ j + ε i t j
Z i j t = δ 0 + δ 1 X i j t + k = 1 n δ k c o n t r o l i , t + μ i + γ t + ϕ j + ε i t j
where Yijt is the dependent variable for firm i in industry j in year t; α is the constant term; EPTit is the core explanatory variable (EPT); μi represents the individual fixed effect (firm-specific); λt represents the time fixed effect (year-specific); θj represents the fixed effect for whether the firm belongs to a heavily polluting industry; and εijt is the random error term.
Based on the above models, empirical analysis is conducted. Regressions are run both with and without control variables.

3.5. Threshold Effect Model Construction

This study models based on Hansen’s static panel threshold regression model. It explores the nonlinear relationship between the EPT and the triple dividend effects on Chinese listed companies. Existing studies confirm divergent impacts of GDP and industrialization on emission distributions [59]. According to the empirical evidence of Deng et al. [17], pollution emissions are used as the nonlinear threshold of taxation and green technology. The theoretical mechanism stems from compliance cost-to-profit elasticity. In this study, pollution equivalent directly determines EPT’s tax base (Article 7 of China’s environmental protection tax law). When pollution equivalent resides in the transition zone, EPT compels clean production to achieve cost savings, ultimately enhancing corporate profits. Therefore, this study uses the total pollution emission equivalent as the threshold of all dividend effects, with the symbol LnTPE. Hypothesis: For a specific threshold value γ, σ , θ , when LnTPE ≤ γ / σ / θ  and when LnTPE >  γ / σ / θ , the impact of EPT on the triple dividends is significantly different. The econometric model is constructed as shown in Equations (5)–(7).
Y i t = α 0 + α 11 L n T P E i t × I L n T P E i t γ 1 + α 12 L n T P E i t × I γ 1 < L n T P E i t γ 2 +
+ α 1 n L n T P E i t × I ( γ n 1 < L n T P E i t γ n ) + α 1 K i , t m + α 2 Q i t + ε i t j
W i t = β 0 + β 11 L n T P E i t × I L n T P E i t σ 1 + β 12 L n T P E i t × I σ 1 < L n T P E i t σ 2 +
+ β 1 n L n T P E i t × I ( σ n 1 < L n T P E i t σ n ) + β 1 W i , t m + β 2 Q i t + ε i t j
Z i t = δ 0 + δ 11 L n T P E i t × I L n T P E i t θ 1 + δ 12 L n T P E i t × I θ 1 < L n T P E i t θ 2 +
+ δ 1 n L n T P E i t × I ( θ n 1 < L n T P E i t θ n ) + δ 1 Z i , t m + δ 2 Q i t + ε i t j
where Y i t ,   W i t , and Z i t represent the environmental dividend threshold effect, innovation dividend threshold effect, and economic dividend threshold effect for firm i in period t, respectively; α 0 ,   β 0 , and   δ 0 represent the individual effect; I(·) is the indicator function (it equals 0 if the inequality inside the brackets is false and 1 if it is true. Threshold Value One: γ 1 , γ 2 ,…, γ n . Threshold Value Two: σ 1 , σ 2 ,…,   σ n . Threshold Value Three: θ 1 , θ 2 ,…, θ n . These threshold values are unknown and are estimated during the regression process); Q i t represents the control variables; ε is the random disturbance term; α 11 , α 12 ,…, α 1 n ; β 11 , β 12 ,…,   β 1 n ; and δ 11 ,   δ 12 ,…,   δ 1 n represent the coefficients of the EPT’s effect on the firm’s triple dividends when the threshold variable falls into different threshold value intervals.

4. Results

4.1. Environmental Dividend Effect

Table 3 contains the regression results of the environmental dividend effect. From Table 3, benchmark regression column (1), the coefficient for LnAEPT is significantly negative in the LnTPPE model. Including control variables, controlling for individual fixed effects, time fixed effects, and fixed effects for heavily polluting versus non-heavily polluting industries, and using standard errors clustered at the individual level, the coefficient of EPT is significantly negative. Therefore, the existence of an environmental dividend effect is confirmed, supporting H1.

4.2. Innovation Dividend Effect

From Table 4, benchmark regression column (4), the LnAEPT coefficient is significantly positive in the QAP model. Including control variables, controlling for individual fixed effects, time fixed effects, and fixed effects for heavily polluting versus non-heavily polluting industries, and using standard errors clustered at the individual level, the coefficient of EPT is significantly positive. This confirms that EPT enhances corporate green technology innovation quality through the “Innovation Compensation Effect”. It fully verifies the double dividend mechanism of the “Porter Hypothesis”: the transmission path from emission reduction dividend to innovation dividend. Therefore, the existence of the innovation dividend effect is verified. We support H2.

4.3. Economic Dividend Effect Test

Based on Table 5, benchmark regression column (7), the LnAEPT coefficient is significantly positive in the LnTOI model. Including control variables, controlling for individual fixed effects, time fixed effects, and fixed effects for heavily polluting versus non-heavily polluting industries, and using standard errors clustered at the individual level, the coefficient of EPT is significantly positive. This confirms the existence of an economic dividend from EPT. This breaks the misconception that “environmental protection harms profitability”. Therefore, the existence of the economic dividend effect is verified. We support H3.

4.4. Robustness Tests for Triple Dividend Effects

To verify the robustness of the benchmark regression results, we conducted a series of tests, including replacing the core explanatory variable, replacing the explained variable, and conducting placebo tests.
(1)
Replacing core explanatory variable
Replace the explanatory variable from LnAEPT to LnREPT. The regression results are shown in Table 3, column (2), Table 4, column (5), and Table 5, column (8). The coefficients are significant at the 1% level. It verifies again that the benchmark regression results of this study are robust.
(2)
Replacing explained variable
As shown in Table 3, column (3), replace the total phosphorus pollution equivalent in the environmental dividend effect with the comprehensive water pollution equivalent. The regression coefficient is significantly negative at the 5% level, confirming the environmental dividend effect. As shown in Table 4, column (6), replace QAP in the innovation dividend effect with PAQ. The regression coefficient is significantly positive at the 5% level, confirming the innovation dividend effect. As shown in Table 5, column (9), replace LnTOI in the economic dividend effect with LnTP. The regression coefficient is significantly positive at the 1% level, confirming the economic dividend effect. These results show that the benchmark regression results of this study are robust.
(3)
Placebo test
The placebo test is shown in Figure 1. This test is designed to verify the robustness of the EPT’s impact on the triple dividend effect. The experimental group is randomly simulated 1000 times. Most of the estimated p-values exceed 0.1, which is not statistically significant. The estimated values follow a normal distribution. The placebo estimated coefficient is significantly different from the benchmark regression coefficient. This result shows that the results of this study are not accidental and are not affected by other policies or random factors.

4.5. Triple Dividend Endogeneity Treatment

To alleviate potential endogeneity issues, the first lag of the core explanatory variable was used as an instrumental variable and added to the model regression [60,61,62]. The regression results are shown in Table 6, columns (10) to (12). After including the instrumental variable, the main regression coefficients are significant at the 1%, 5%, and 1% levels, respectively. This indicates that the EPT has a triple dividend effect on Chinese listed companies. It further confirms the acceptance of H1, H2, and H3.

4.6. Threshold Effect Test

Using Stata 18.0 software, the threshold effects of the EPT on the environmental dividend, innovation dividend, and economic dividend were tested separately. The Bootstrap method was employed with 300 repetitions to confirm the number of thresholds. The results of the threshold effect test are shown in Table 7. It can be seen from Table 7 that EPT has a double threshold effect on the environmental dividend effect, a single threshold effect on the innovation dividend, and a double threshold effect on the economic dividend effect.

4.7. Threshold Effect Regression Results

According to the threshold effect test results, this study uses a double threshold model to estimate the threshold effect of EPT on environmental dividends and economic dividends, and uses a single threshold model to estimate the threshold effect of innovation dividends. The results are shown in Table 8 and Table 9.
Table 8 shows under the double threshold for the variable LnTPE. The F-statistic of the first threshold value (0.1461) of environmental dividend is 883.68, significant at the 1% level. The F-statistic of the second threshold value (0.1481) of environmental dividend is 278.71, significant at the 1% level. The F-statistic of the single threshold value (0.1469) of innovation dividend is 65.66, significant at the 1% level. The F-statistic of the first threshold value (0.1482) of economic dividend is 54.78, significant at the 5% level. The F-statistic of the second threshold value (0.1493) of economic dividend is 30.10, significant at the 5% level.
Table 9 shows the regression results of the triple dividend threshold effect. Specifically, Environmental Dividend (Table 9, column 13): When LnTPE ≤ 0.1461, the coefficient of EPT is significantly negative. A one-unit increase in EPT leads to a significant decrease of approximately 0.0386 units in LnTPPE, representing the strongest inhibitory effect. When 0.1461 < LnTPE ≤ 0.1481, the coefficient of EPT is significantly negative. EPT still significantly inhibits pollution emission, but the inhibitory effect weakens. When LnTPE > 0.1481, the coefficient of EPT is significantly negative. This indicates that for enterprises with inherently higher pollution levels, EPT still significantly inhibits their pollution emission, but the inhibitory effect further weakens.
Innovation Dividend (Table 8, column 20): When LnTPE ≤ 0.1469, the coefficient of EPT is significantly positive. For enterprises with lower pollution levels, a one-unit increase in EPT significantly increases QAP by approximately 0.0069 units. When LnTPE > 0.1469, the coefficient of EPT is significantly positive. This indicates that for enterprises with higher pollution levels, a one-unit increase in EPT significantly increases QAP by approximately 0.0081 units, and the increase magnitude is slightly higher than for the low-pollution group.
Economic Dividend (Table 8, column 21): When LnTPE ≤ 0.1482, the coefficient of EPT is significantly positive. A one-unit increase in EPT leads to a significant increase of approximately 0.3700 units in LnTOI. When 0.1482 < LnTPE ≤ 0.1493, the coefficient of EPT is significantly positive. EPT still significantly increases operating income, and the increase magnitude is slightly higher than for the low-pollution group. When LnTPE > 0.1493, the coefficient of EPT is significantly positive. This indicates that for enterprises with higher pollution levels, a one-unit increase in EPT significantly increases operating income by approximately 0.3800 units, and the increase magnitude is the highest. In summary, this study verified H4.
Figure 2 shows the Likelihood Ratio (LR) function graph for the threshold effects of the triple dividends on Chinese listed companies. It can be seen that the threshold value for the firm’s triple dividends crosses the LR value (LR = 7.35). These threshold values are significant at the 95% confidence level. This indicates that the EPT has a threshold effect on all three dividends (environmental, innovation, economic) for Chinese listed companies.

4.8. Robustness Test for Threshold Effects

To determine if the threshold regression results are robust, this study continues to use the method of replacing explanatory variables for re-estimation and replaces LnAEPT with LnREPT for regression analysis. The results are shown in Table 10.
Overall, the estimated coefficients from the threshold regression still exhibit remarkable consistency, further validating the robustness of the threshold regression results.

4.9. Threshold Effect Endogeneity Treatment

To further alleviate potential endogeneity issues, the first lag of the core explanatory variable was used as an instrumental variable and added to the threshold regression. The threshold regression results are shown in Table 11, columns (19) to (21). After including the instrumental variable, the threshold effect regression coefficients are all significant. This indicates that the EPT has a threshold effect on the triple dividends.

4.10. Heterogeneity Analysis: Heavily Polluting vs. Non-Heavily Polluting Industries

This study further explores differences in threshold effect identification by conducting heterogeneity tests of the threshold effects. With reference to studies by Zhou et al. [63] and Zor [64], and according to the List of Environmental Verification Industry Classifications for Listed Companies issued by the Ministry of Environmental Protection of the People’s Republic of China (now the Ministry of Ecology and Environment) on 24 June 2008, 19 sub-industries within mining, manufacturing, and the production and supply of electricity, heat, gas, and water are classified as heavily polluting industries. Consequently, this study categorizes the sample into heavily polluting and non-heavily polluting industries based on the latest industry classification codes issued by the China Securities Regulatory Commission (CSRC). We then conduct heterogeneity tests.

4.10.1. Heterogeneity of Environmental Dividend Threshold Effect: Heavily Polluting vs. Non-Heavily Polluting Industries

The threshold effects and regression results for the environmental dividend in non-heavily polluting industries and heavily polluting industries are shown in Table 12 and Table 13.
Non-heavily polluting industries: When the environmental dividend threshold variable is below the threshold value of 0.1462, the regression coefficient of EPT on environmental dividend is significantly negative at the 1% level, indicating the strongest inhibitory effect. When exceeding the threshold of 0.1493, the coefficient becomes statistically insignificant, reflecting a weakened inhibitory effect.
Heavily polluting industries: When the environmental dividend threshold variable is below the threshold value of 0.1461, the regression coefficient of EPT on environmental dividend is significantly negative at the 1% level. The inhibitory effect weakens when exceeding the threshold values. Regardless of the EPT level, it has a negative effect on the water pollution level of both types of industries. However, the effect is more sensitive for heavily polluting industries. The suppression effect becomes stronger for them.
There is a significant heterogeneous difference compared to non-heavily polluting industries. This indicates a significant change in the heterogeneous impact of the EPT on the first environmental dividend threshold for heavily polluting industries.
Figure 3 shows the Likelihood Ratio (LR) function graphs for the environmental dividend threshold effect in non-heavily polluting industries and heavily polluting industries. The double threshold value for the environmental dividend in both non-heavily polluting industries and heavily polluting industries crosses the critical LR value (LR = 7.35). This indicates the threshold value is significant at the 95% confidence level. Therefore, the EPT has a double threshold effect on the environmental dividend for both non-heavily polluting industries and heavily polluting industries.

4.10.2. Heterogeneity of Innovation Dividend Threshold Effect: Heavily Polluting vs. Non-Heavily Polluting Industries

The threshold effects and regression results for the innovation dividend in non-heavily polluting industries and heavily polluting industries are shown in Table 14 and Table 15.
Non-heavily polluting industries: When the innovation dividend threshold variable is below 0.1469, the regression coefficient of EPT on innovation dividend is positive but statistically significant only at the 10% level, indicating the weakest stimulative effect. When exceeding the threshold, the coefficient becomes significant at the 5% level with an enhanced stimulative effect.
Heavily polluting industries: When the innovation dividend threshold variable is below 0.1460, the regression coefficient of EPT on innovation dividend is positive but statistically insignificant. When exceeding the threshold, the coefficient gains significance at the 10% level, demonstrating a strengthened stimulative effect. Specifically, the effect is more sensitive for heavily polluting industries. The promotion effect becomes stronger for them. There is a significant heterogeneous difference compared to non-heavily polluting industries.
Figure 4 shows the Likelihood Ratio (LR) function graphs for the innovation dividend threshold effect in non-heavily polluting industries and heavily polluting industries. The single threshold value for the innovation dividend in both non-heavily polluting industries and heavily polluting industries crosses the critical LR value (LR = 7.35). This indicates the threshold value is significant at the 95% confidence level. Specifically, EPT exhibits statistically distinguishable single threshold effects on the innovation dividend for both non-heavily and heavily polluting industries, with industry-specific threshold values.

4.10.3. Heterogeneity of Economic Dividend Threshold Effect: Heavily Polluting vs. Non-Heavily Polluting Industries

The threshold effects and regression results for the economic dividend in non-heavily polluting industries and heavily polluting industries are shown in Table 16 and Table 17.
Non-heavily polluting industries: When the economic dividend threshold variable is below 0.1481, the regression coefficient of EPT on economic dividend is significantly positive at the 1% level, representing the weakest stimulative effect. Beyond this threshold, a monotonic enhancement of the stimulative effect is observed, though no double threshold effect exists.
Heavily polluting industries: EPT demonstrates a general enhancement effect on economic dividend; however, no statistically significant threshold effect is detected.
Specifically, when exceeding the threshold value, the effect is more sensitive for non-heavily polluting industries. The promotion effect becomes stronger for them. There is a significant heterogeneous difference compared to heavily polluting industries. This indicates a significant change in the heterogeneous impact of the EPT on the economic dividend threshold for non-heavily and heavily polluting industries.
Figure 5 shows the Likelihood Ratio (LR) function graphs for the economic dividend threshold effect in non-heavily and heavily polluting industries. The single threshold value for the economic dividend in non-heavily polluting industries crosses the critical LR value (LR = 7.35). This indicates the threshold value is significant at the 95% confidence level. However, no statistically significant threshold effect on economic dividend has been detected for heavily polluting industries. Specifically, EPT demonstrates statistically distinct heterogeneous effects on the economic dividend threshold response between non-heavily and heavily polluting industries.

5. Discussion

5.1. Triple Dividend Hypothesis Validation Analysis

This study uses panel data from 872 Chinese listed companies (2018–2022). It verifies the triple dividend effect and threshold effect of the EPT using two-way fixed effects and threshold models. The results fully support hypotheses H1 to H5. They reveal the synergy mechanism between environmental regulation and corporate development.
Environmental Dividend (H1): The EPT significantly suppresses the LnTPPE. The coefficient is −0.0250 (p < 0.01). A 1-unit tax increase reduces LnTPPE by 2.5%. This aligns with Porter’s Hypothesis [1]. It shows that EPT strengthens emission reduction incentives. This matches studies finding that environmental taxes suppress pollution [3,21,22,23].
Innovation Dividend (H2): The elasticity of QAP to EPT is 0.0079 (p < 0.01). A 1-unit tax increase raises patent technological complexity by 0.79%. This breaks the traditional “pollution avoidance” theory. It reveals the micro-mechanism of the innovation compensation effect. It aligns with studies finding that EPT promotes innovation [31,34,35,65]. High-tax industries file cross-group patents (e.g., “B02C03 solid waste treatment” and “A01B02 emission reduction”). This diversifies risk.
Economic Dividend (H3): The elasticity of LnTOI to EPT is 0.381 (p < 0.01). A 1-unit tax increase raises LnTOI complexity by 38.1%. This confirms the “pollution control—market competitiveness” transformation path. It matches studies finding that EPT promotes economic growth and firm performance [10,11,43,44,45].
Robustness tests strengthen the conclusions. After replacing core variables and conducting placebo tests, the triple dividend effects remain significant. After instrumental variable methods, endogeneity issues did not distort the results. Therefore, H1, H2, and H3 have been confirmed.

5.2. Triple Dividend Threshold Effect Hypothesis Analysis

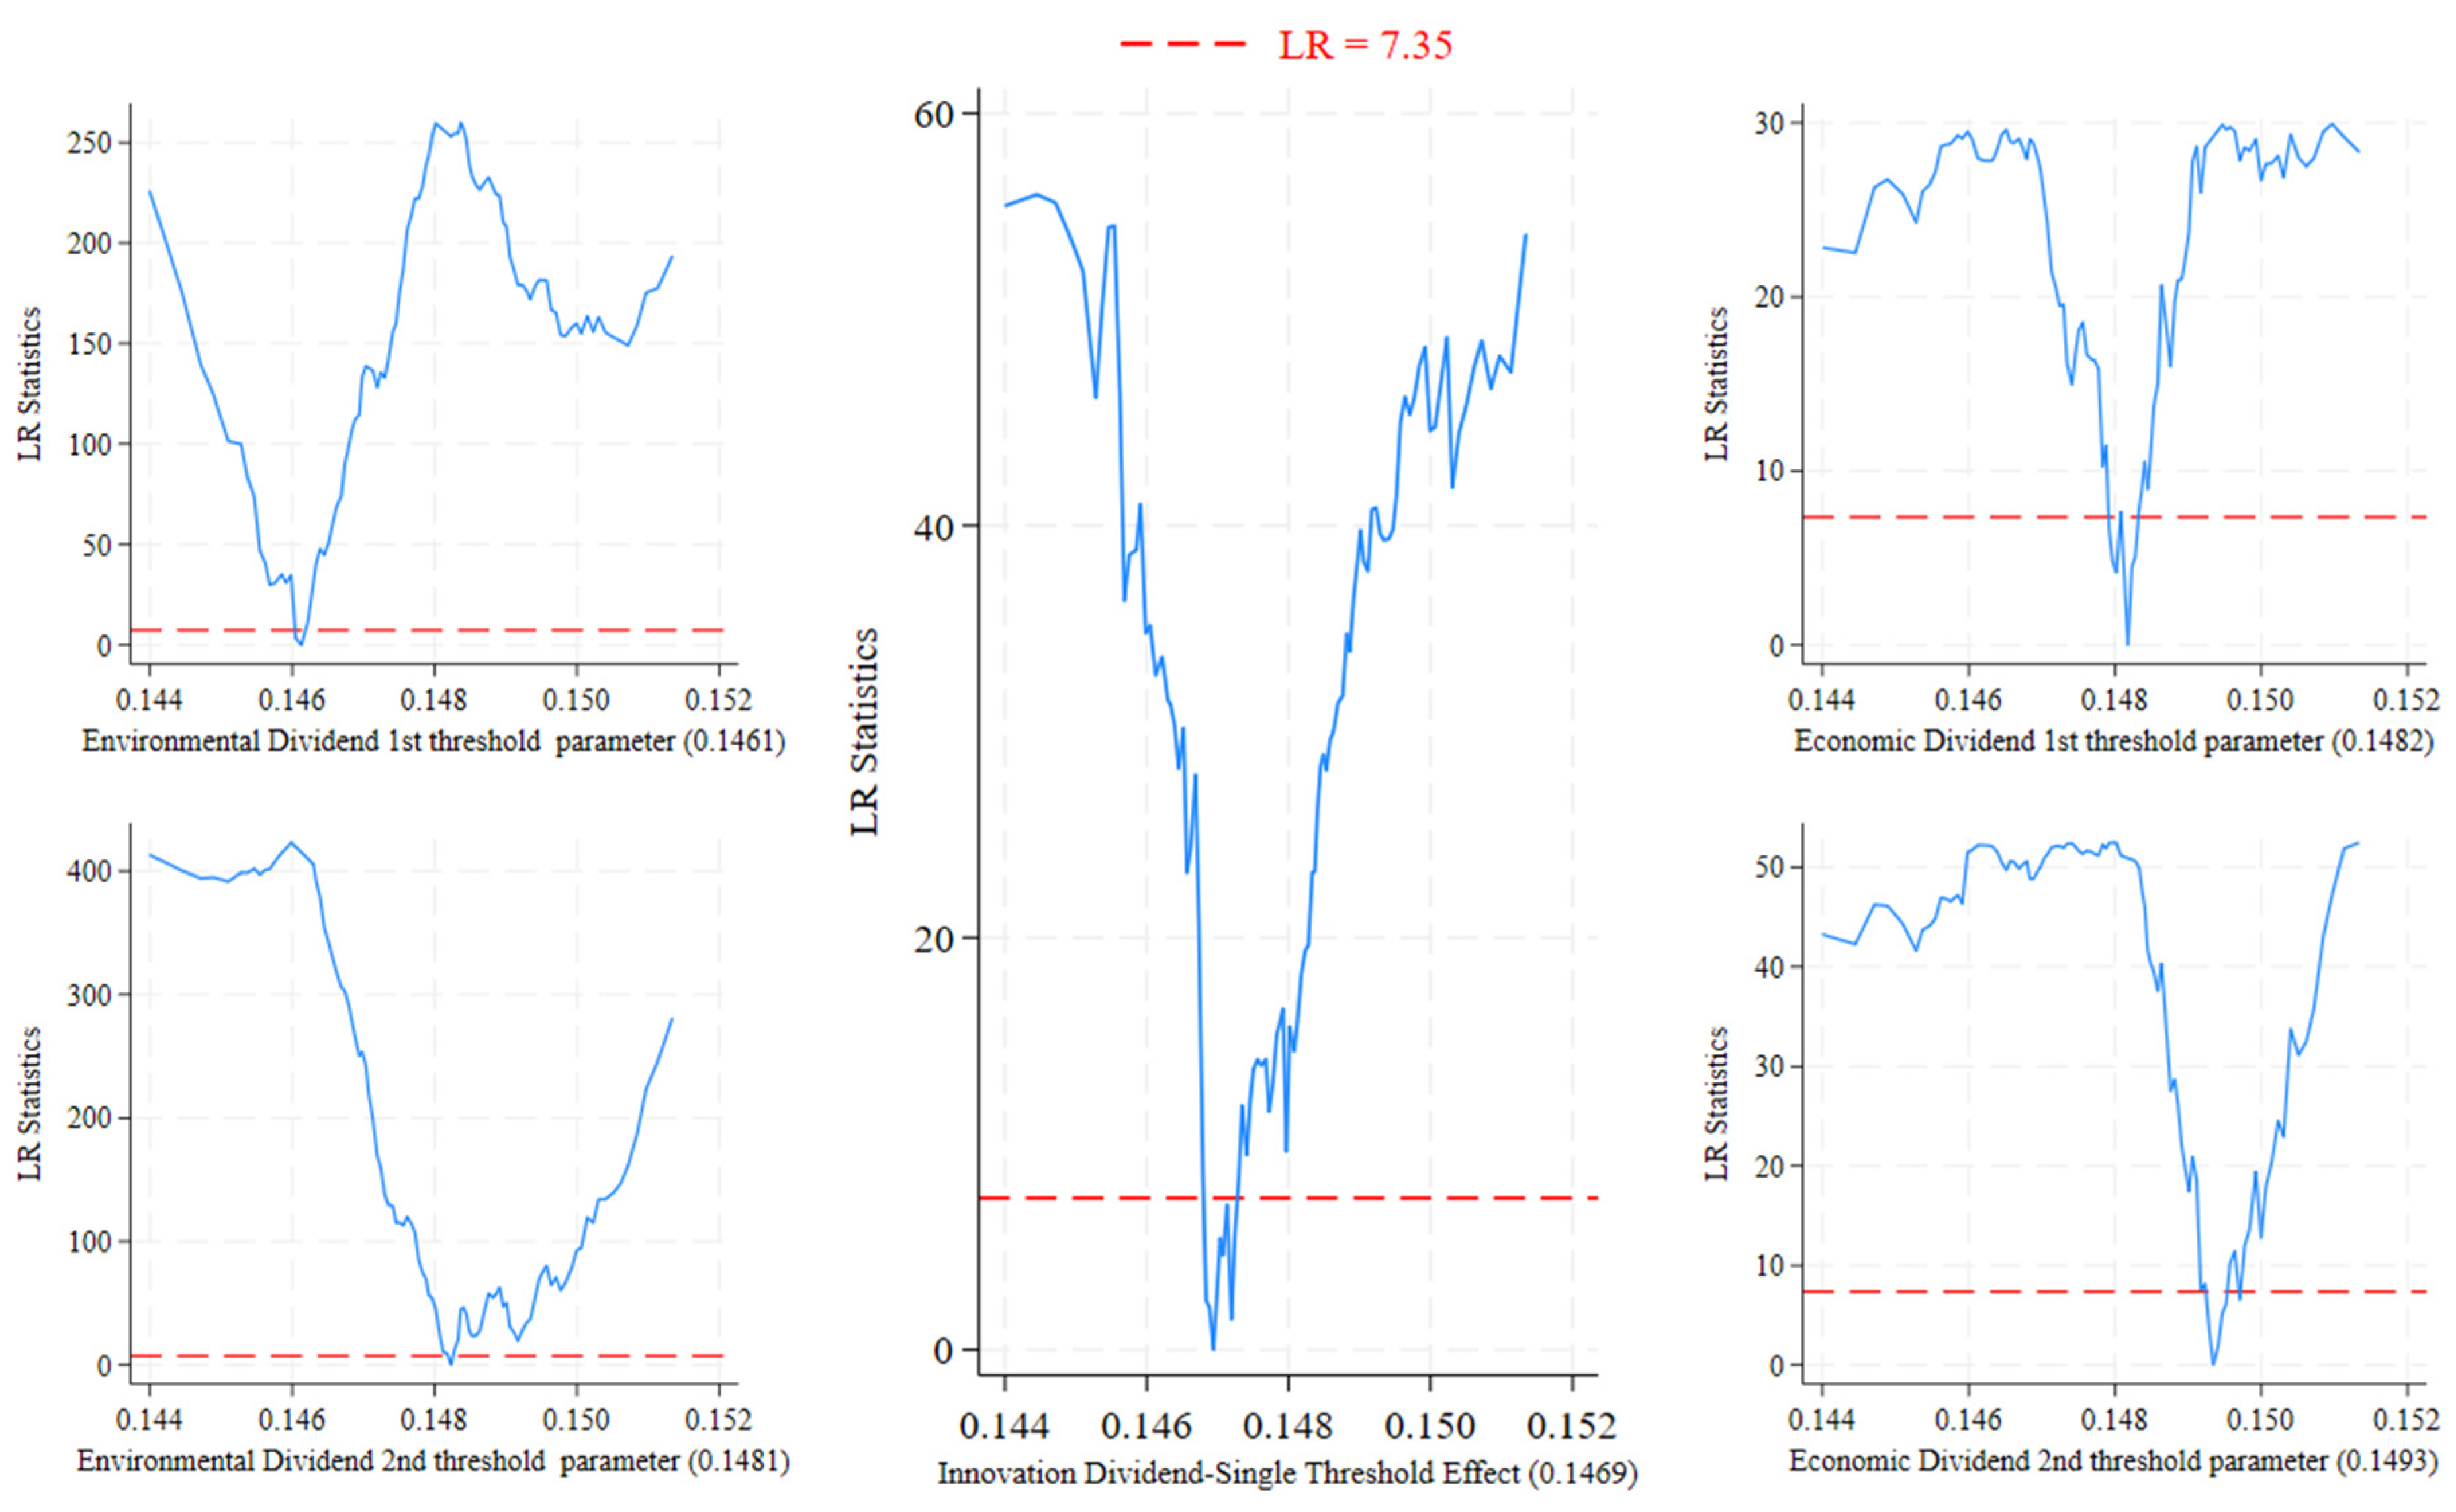
Using Hansen’s panel threshold model, significant threshold effects exist for the triple dividends. This verifies the nonlinear nature of H4a, H4b, and H4c.
Environmental Dividend Threshold: When LnTPE ≤ 0.1461, EPT exerts its strongest inhibitory effect. The emission reduction effect progressively weakens across the subsequent intervals of 0.1461 < LnTPE ≤ 0.1481 and LnTPE > 0.1481. This demonstrates that EPT generates significant emission reduction effects for enterprises at all pollution levels, with the magnitude diminishing as firms’ own pollution intensity increases. Enterprises with lower pollution levels exhibit greater sensitivity to EPT, resulting in stronger emission reduction outcomes. Conversely, heavily polluting firms demonstrate reduced sensitivity and weaker inhibitory effects. This pattern aligns with the marginal abatement cost theory in environmental economics [66], whereby low-pollution firms achieve cost-effective reductions through operational adjustments, while high-pollution enterprises face steep cost curves for substantial abatement due to technological constraints and infrastructure lock-in [18].
Innovation Dividend Threshold: When LnTPE ≤ 0.1469, EPT significantly enhances QAP for low-pollution enterprises. For firms with LnTPE > 0.1469, the innovation-stimulating effect becomes marginally stronger. Specifically, EPT exerts a statistically significant positive impact on corporate innovation quality, with a slightly more pronounced incentive effect observed in highly polluting firms. This phenomenon arises because heavily polluting enterprises face greater environmental compliance pressure. To ensure operational viability and meet emission standards, they exhibit stronger motivation to pursue breakthrough innovations that offset rising compliance costs [36]. These findings substantiate the positive aspect of the Porter Hypothesis, wherein properly designed environmental regulations can stimulate innovation competitiveness.
Economic Dividend Threshold: When LnTPE ≤ 0.1482, EPT’s coefficient exhibits statistical significance with a positive sign. This positive effect progressively strengthens across the intervals 0.1482 < LnTPE ≤ 0.1493 and LnTPE > 0.1493, where the average marginal effect increases from 1.0% to 1.6%. The enhancement effect reaches its most pronounced magnitude when LnTPE exceeds 0.1493. EPT demonstrates statistically significant positive impacts on corporate operating revenue. Critically, this revenue-enhancing effect intensifies monotonically as firms’ own pollution levels increase. This “strong nonlinearity” shows that low-pollution industries gain market premiums via green certification. High-pollution industries experience “suppress first, boost later.” Short-term pollution control costs rise, but long-term circular economy optimizes cost structure, enhancing performance [2,3,17,49,50]. For enterprises with pollution equivalent below 0.1493, provide interest-subsidized technology transition loans, including partial People’s Bank of China relending rate reductions. For medium–high polluters exceeding industry-average pollution intensity per unit output, activate tiered tax rates, penalties for exceeding thresholds, and reductions for compliance.
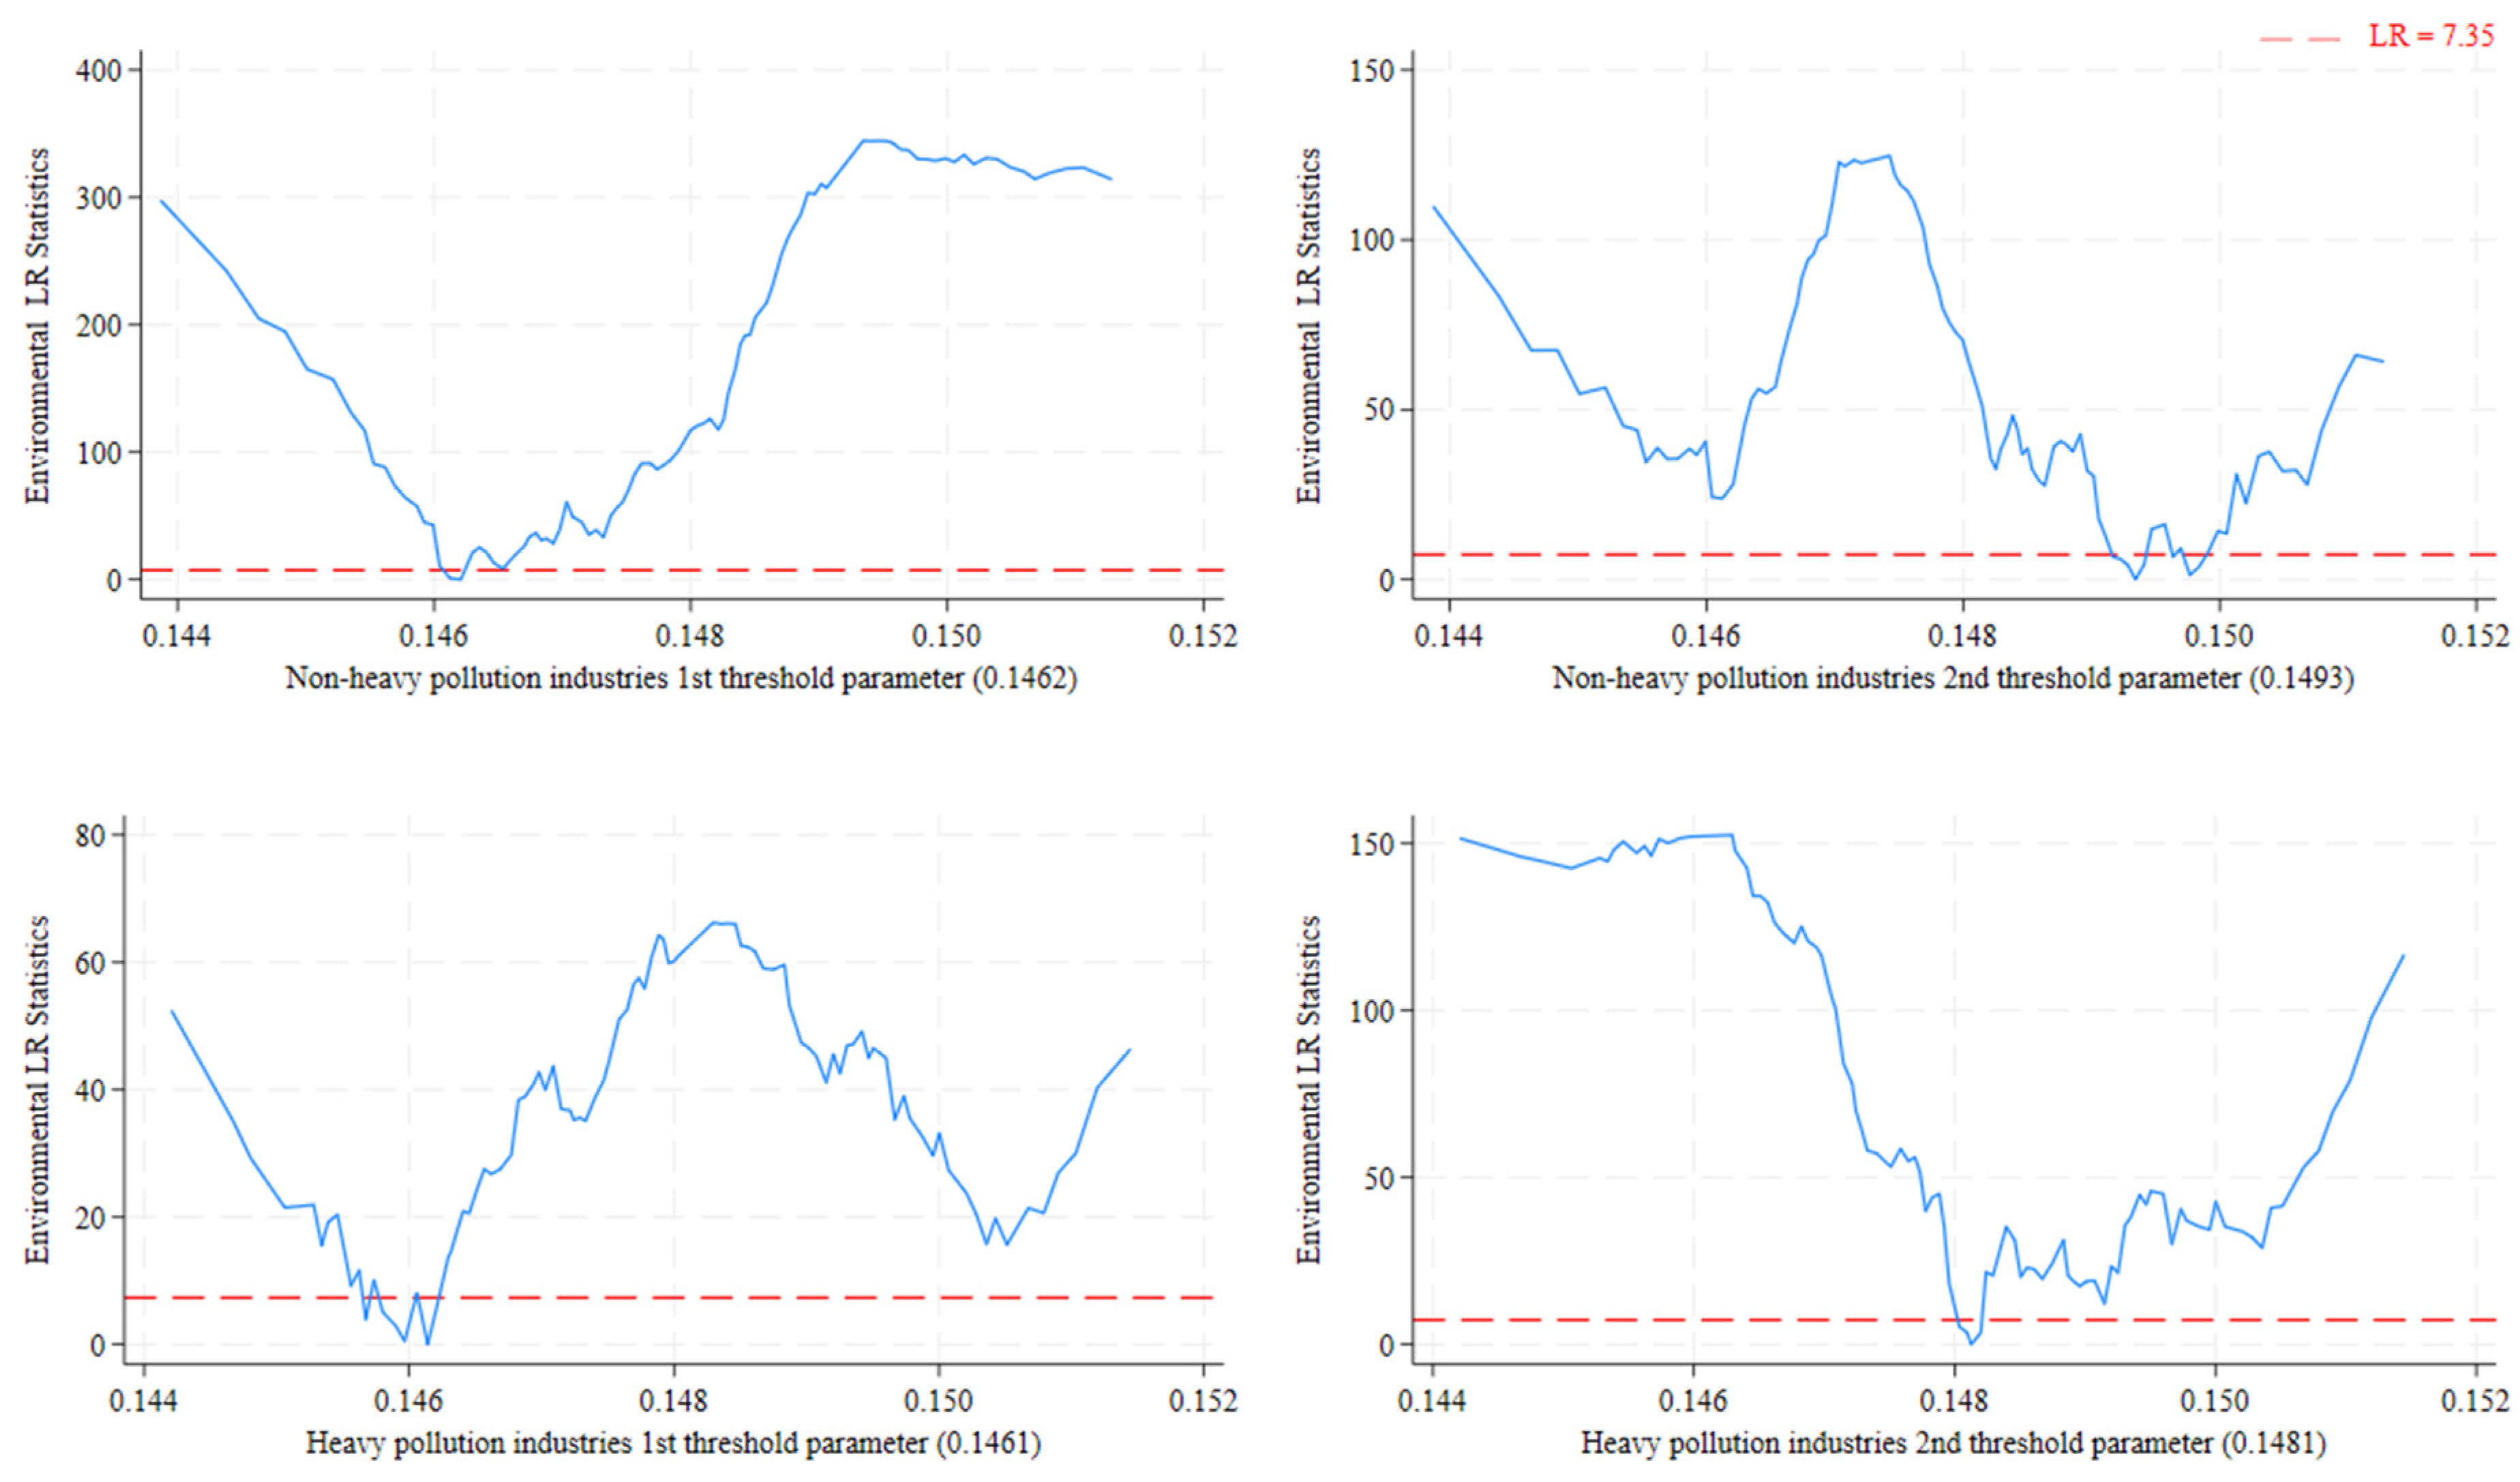
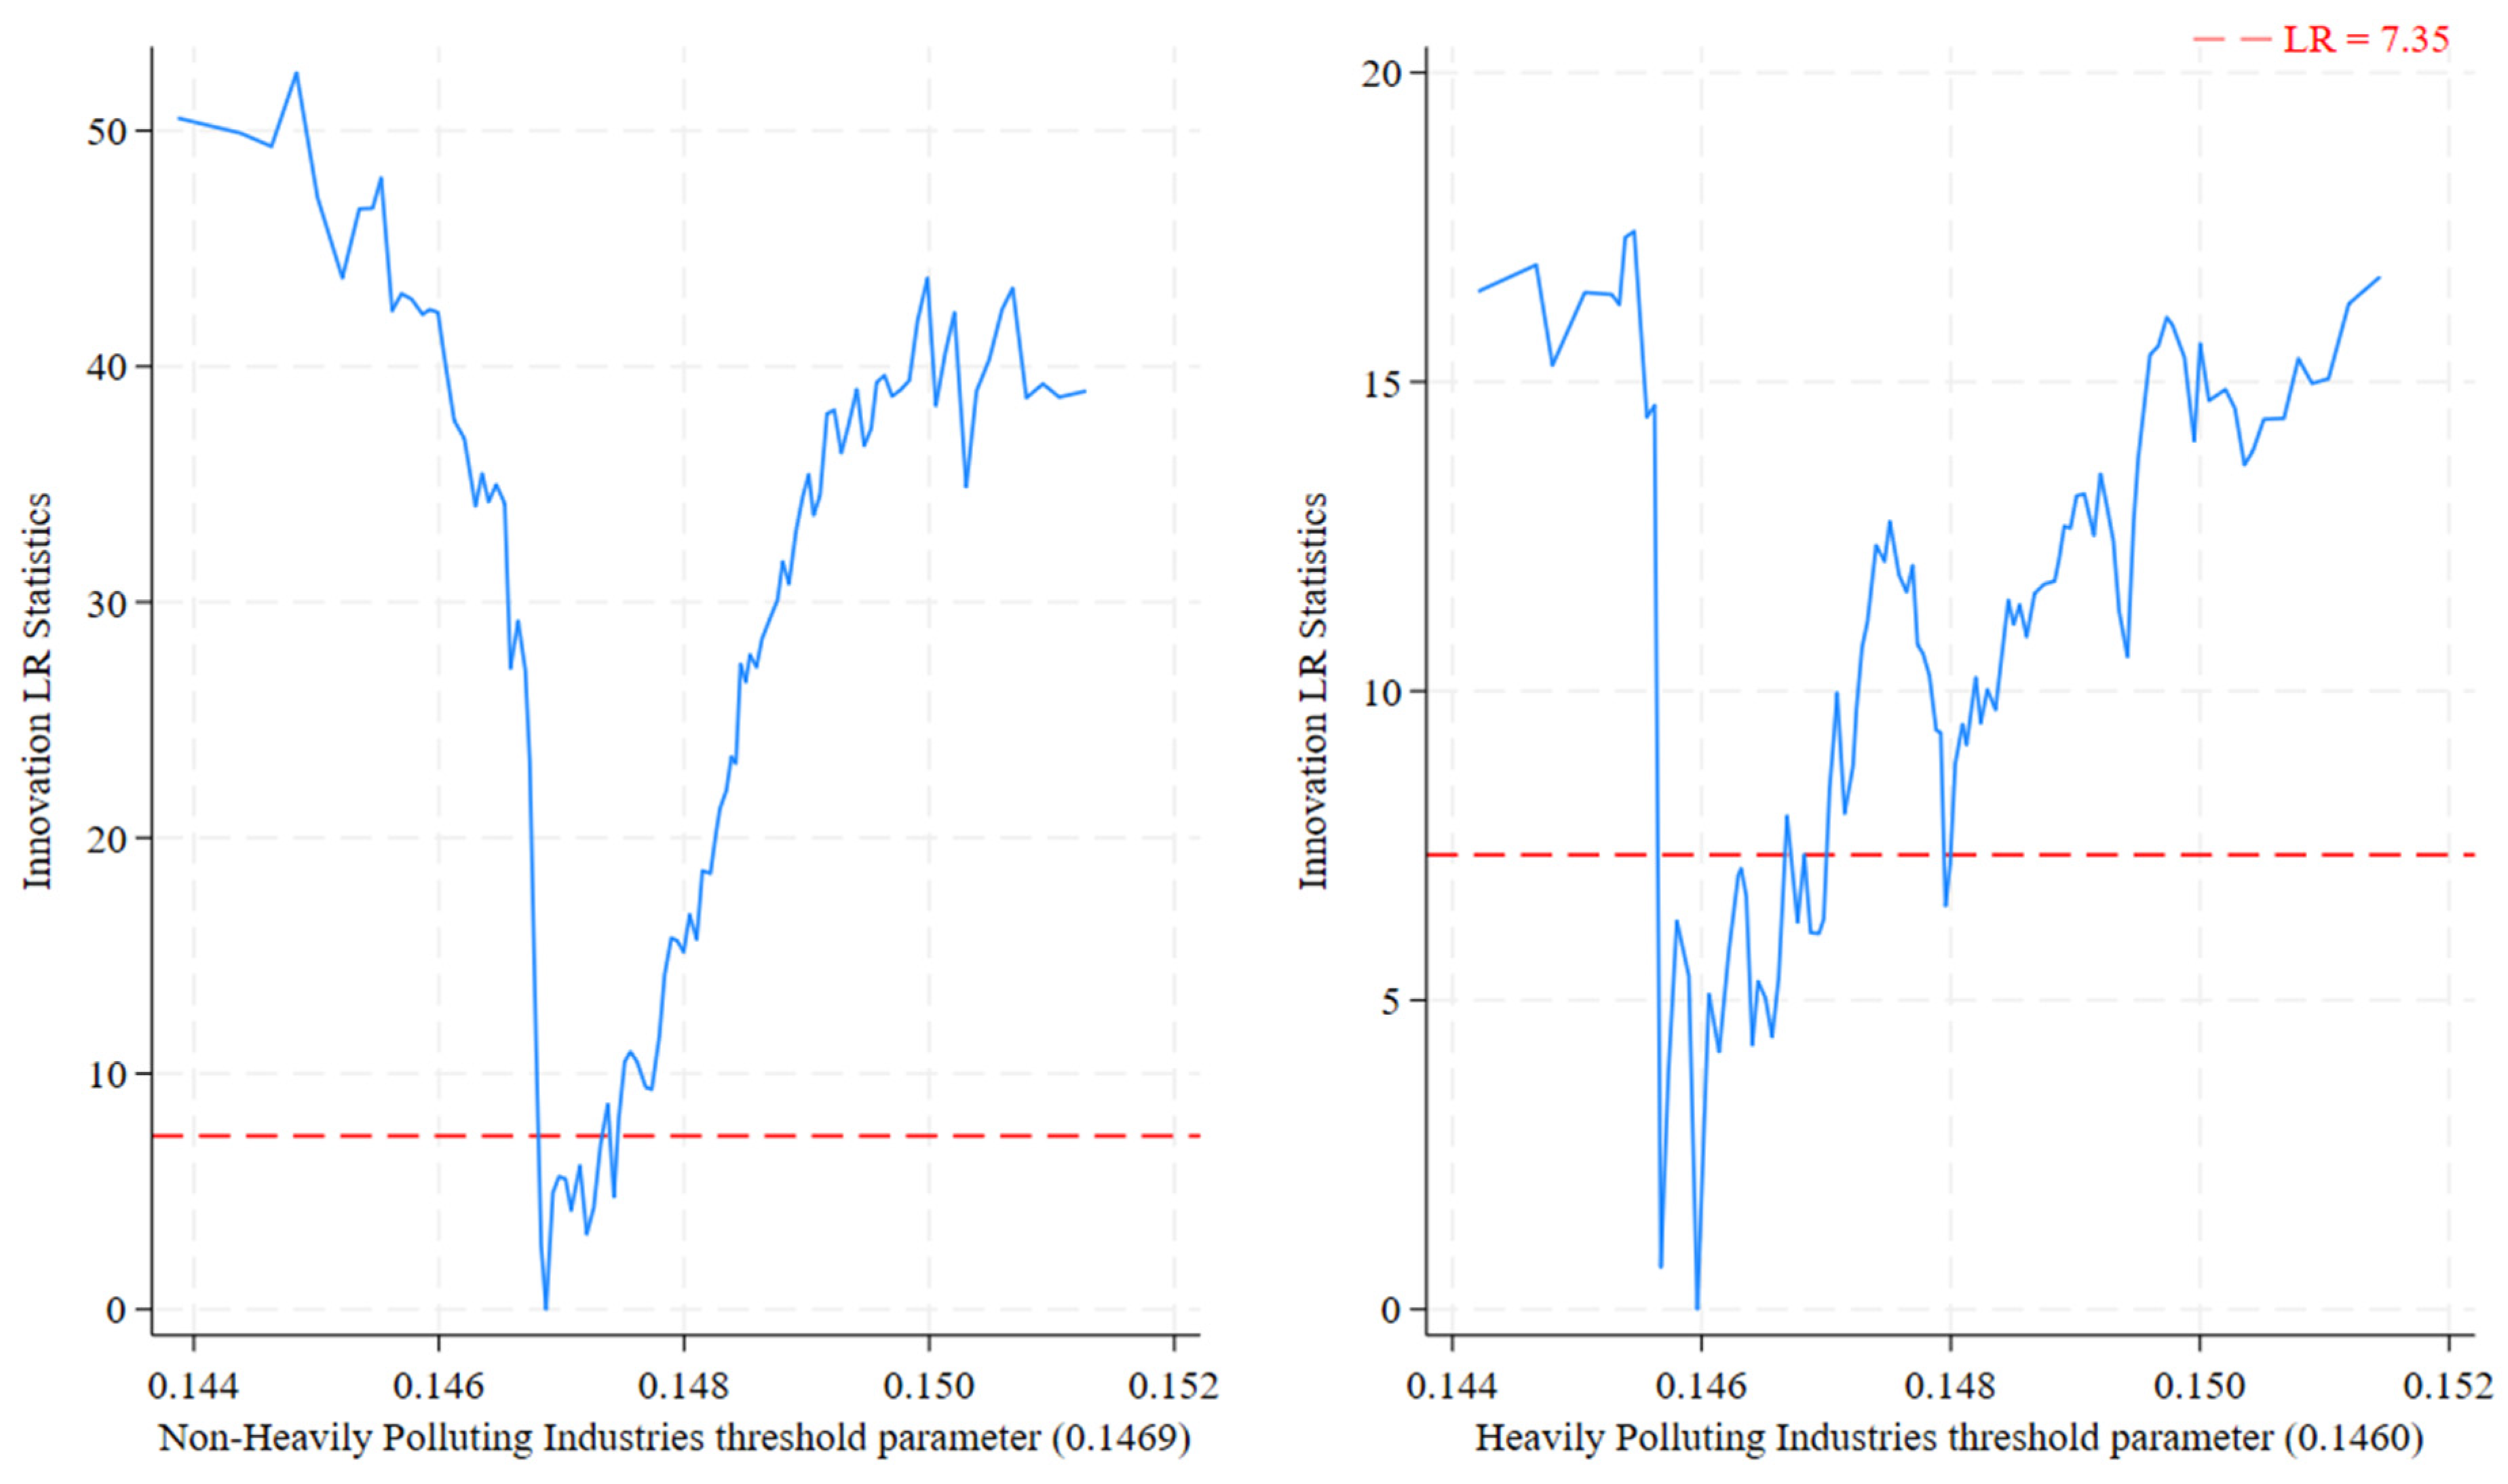
Heterogeneity analysis shows that the environmental dividend threshold effect is more significant for heavily polluting industries. Its threshold (0.1461, 0.1481) is lower than non-heavily polluting industries (0.1462, 0.1493). This reflects their urgency for pollution control. The threshold effect of the innovation dividend is also more reflected in heavily polluting industries. EPT is more sensitive to heavily polluting industries, with a lower threshold (0.1460) than that of non-heavily polluting industries (0.1469), and a stronger stimulating effect. However, the threshold effect of economic dividends is reflected in non-heavy pollution industries. EPT has a single threshold effect on non-heavy pollution industries, but no threshold effect on heavy pollution industries.
This study provides evidence that significantly different coefficients, significantly different threshold points, and passed statistical tests robustly support the existence of substantial, statistically significant differences in the mechanisms by which EPT affects environmental, innovation, and economic benefits between heavily polluting and non-heavily polluting industries.
Clear and economically logical potential mechanisms underlie these differences: First, pollution emission intensity constitutes the core mechanism for the environmental benefit difference. Second, sectoral disparities in technological opportunities and absorptive capacity are key to the innovation benefit difference. Third, the economic benefit difference primarily stems from the Porter effect (innovation compensation and efficiency enhancement).
This study effectively confirms the significant heterogeneity of EPT effects across different industries. Understanding these differences and their underlying mechanisms is crucial for formulating more targeted and effective environmental–economic policies.

5.3. Theoretical Contributions

This study achieves groundbreaking advances in environmental taxation theory:
Develops an analytical framework examining EPT’s nonlinear threshold effects on the triple dividend (environmental pollution reduction, innovation stimulation, economic enhancement). This model deciphers the micro-mechanisms through which EPT influences the triple dividend, transcending the traditional “cost-performance” dichotomy of the Porter Hypothesis. It incorporates novel dimensions—technological complexity and knowledge spillovers—into EPT theory.
Empirically validates the marginal abatement cost theory and environmental policy incentive theory in environmental economics, pioneering a nonlinear policy evaluation paradigm distinct from conventional linear assessment models.
Establishes an industry heterogeneity model revealing statistically distinct thresholds. China-specific classification of non-heavily/heavily polluting enterprises exhibits significant nonlinear threshold differentials. This uncovers industry-specific patterns of environmental policy efficacy, providing quantitative evidence for environmental taxation theory while advancing environmental regulation from “universal policy” toward “precision governance” frameworks.

5.4. Practical Contributions

This study’s findings will provide policymakers with three practical tools:
  • Policy Implementation: Establish a “Dynamic Threshold Adjustment Mechanism.” Increase tax intensity for high-value-added polluters to enhance emissions reduction sensitivity. Implement an “EPT-Carbon Trading” linkage mechanism for large labor-intensive polluters to achieve precise matching of policy instruments and strengthen innovation linkages. Continuously raise tax intensity for high-pollution, high-emission industries to drive dual improvements in pollution reduction and performance. Specifically, implement stepped EPT rates for heavily polluting industries above the threshold. This enables precise regulatory control, reduces enforcement costs (avoiding “one-size-fits-all” enforcement), creates channels for green supply chain certification services, and leverages policy steering effects.
  • Enterprise Management: Create a “Green Technology Investment Decision Model.” Guide industries to identify optimal technological pathways. Prioritize end-of-pipe treatment technologies for low-emission industries. Implement circular economy models for enterprises exceeding thresholds. Strategic advice for managers in heavily polluting industries is as follows: deploy abatement technologies (e.g., cleaner production equipment) proactively as EPT approaches the environmental threshold to avoid sharp cost increases from stricter regulation; increase green technology investments after exceeding the threshold; develop by-product recycling technologies; and pursue green certifications to enhance market premiums. Strategic advice for managers in non-heavily polluting industries: accelerate green technology R&D when EPT surpasses the innovation benefit threshold; establish joint ESG innovation labs with universities; patent environmental technologies; and for economic benefit strategies, develop environmental management tools to gain returns through asset-light models.
Regulatory agencies can implement the following measures to optimize EPT design: Implement differentiated threshold-based supervision: Strengthen enforcement intensity for heavily polluting industries, while focusing on innovation guidance for non-heavily polluting industries. Establish dynamic policy instruments: For heavily polluting industries, introduce stepped pollution discharge fees linked with carbon trading mechanisms. For non-heavily polluting industries, distribute innovation vouchers (redeemable for R&D subsidies when EPT exceeds thresholds). Create cross-industry collaboration mechanisms: Establish technology alliances between heavily polluting and non-polluting enterprises, permitting the purchase of innovation-driven emission reductions. Provide targeted incentives: Offer green credit and certification channels to enterprises achieving the economic threshold.

5.5. Research Limitations

The empirical analysis has limitations: Methodologically, this study employs conventional panel threshold models, where the non-adoption of dynamic threshold models may cause dynamic bias in estimation. Instrumental variables are not sought in historical and geographical conditions, and only lagged explanatory variables in the time series are used as instrumental variables, which may not completely solve the endogeneity problem. Data: Limited by listed company disclosure, emerging variables like ESG investment and digital tech penetration were not included. This may underestimate EPT’s effect. Mechanism Analysis: Tech transmission paths rely on secondary patent data. Lacks field observation of micro-behaviors like R&D personnel flow and industry–university–research collaboration. Policy Evaluation: Does not distinguish regional environmental capacity differences. May overestimate policy dividends. Industry Classification: Industries are simply classified as heavily/non-heavily polluting. Does not consider sub-industries (e.g., new vs. traditional energy) and their heterogeneous responses. Duration: The long-term persistence of EPT effects needs more than 5 years of observation. This may affect the completeness of policy impact assessment.

5.6. Future Research Directions

  • Build a dynamic threshold model. Study how EPT can enhance the efficiency of tax collection and administration.
  • Use satellite remote sensing (e.g., night light data) and IoT sensors to build real-time monitoring networks. Develop minute-level policy effect assessment systems.
  • Conduct cross-country comparative studies. Analyze optimal EPT–carbon price linkage ratios in OECD countries. Explore “Pollution Equivalent Banking” systems. Allow industries to accumulate emission reduction credits through tech upgrades. Provide a Chinese solution for the sustainable development of global climate governance.

6. Conclusions

This study shows that the environmental protection tax (EPT) generates synergistic effects of economic, environmental, and technological innovation dividends for Chinese listed companies. It partially validates the Porter Hypothesis.
  • Environmental Dividend Achieved: The EPT significantly suppresses pollution emissions. A 1-unit tax increase reduces LnTPPE by 2.5%. This verifies the tax’s precise emission reduction capability.
  • Significant Technological Innovation Dividend: The EPT forces Chinese listed companies to improve patent application and grant quality. A 1-unit tax increase raises patent technological complexity by 0.79%. It drives green innovation through increased patent complexity and cross-field technology synergy.
  • Economic Dividend Confirmed: The EPT significantly improves companies’ performance. A 1-unit tax increase raises relative corporate revenue by 38.1%.
  • Heterogeneity analysis shows significant differences in threshold effects between non-heavily polluting and heavily polluting industries.
This study confirms that China’s EPT generates a micro-level triple dividend effect alongside coexisting threshold effects for listed companies. This provides literature references for China to design and implement differentiated policies and offers a quantitative empirical case for implementing globally sustainable EPT strategies.

Author Contributions

Conceptualization, I.A.M. and C.Y.; methodology, I.A.M. and C.Y.; software, C.Y. and H.G.; validation, I.A.M.; formal analysis, H.G.; investigation, C.Y.; resources, I.A.M.; data curation, I.A.M.; writing—original draft preparation, C.Y.; writing—review and editing, I.A.M.; visualization, H.G.; supervision, I.A.M.; project administration, I.A.M.; funding acquisition, C.Y. All authors have read and agreed to the published version of the manuscript.

Funding

The article was prepared based on the results of research carried out at the expense of budgetary funds under the state assignment of the Financial University under the Government of the Russian Federation.

Institutional Review Board Statement

Not applicable.

Informed Consent Statement

Not applicable.

Data Availability Statement

The datasets generated and analyzed during the current study are available from the corresponding author on reasonable request.

Conflicts of Interest

The authors declare no conflicts of interest. The funders had no role in the design of the study; in the collection, analyses, or interpretation of data; in the writing of the manuscript; or in the decision to publish the results.

References

  1. Porter, M.E.; Linde, C.V.D. Toward a new conception of the environment-competitiveness relationship. J. Econ. Perspect. 1995, 9, 97–118. [Google Scholar] [CrossRef]
  2. Wang, L.; Pang, J. Assessing the impact of climate mitigation technology and environmental tax on renewable energy development: A dynamic threshold approach. Renew. Energy 2025, 244, 122683. [Google Scholar] [CrossRef]
  3. Chenghao, Y.; Mayburov, I.; Hongjie, G. Can Environmental Protection Tax Reform Promote Green Comprehensive Efficiency Productivity? Evidence from China’s Provincial Panel Data. J. Tax Reform 2025, 11, 149–174. [Google Scholar] [CrossRef]
  4. Bovenberg, A.L.; Goulder, L.H. Environmental taxation and regulation. In Handbook of Public Economics; Elsevier: Amsterdam, The Netherlands, 2002; Volume 3, pp. 1471–1545. [Google Scholar] [CrossRef]
  5. Kaya, F.; Mia, B.; Aktar, M.A.; Hossain, M.S.; Hassan, M.M.; Rahaman, M.A.; Voumik, L.C. Impact of environmental taxes, hydroelectricity consumption, economic globalization, and gross domestic product (GDP) on the load capacity factor in the selected European Union (EU) member countries. Reg. Sustain. 2025, 6, 100210. [Google Scholar] [CrossRef]
  6. Albrizio, S.; Kozluk, T.; Zipperer, V. Environmental policies and productivity growth: Evidence across industries and firms. J. Environ. Econ. Manag. 2017, 81, 209–226. [Google Scholar] [CrossRef]
  7. Andersson, J.J. Carbon taxes and CO2 emissions: Sweden as a case study. Am. Econ. J. Econ. Policy 2019, 11, 1–30. [Google Scholar] [CrossRef]
  8. Chenghao, Y.; Mayburov, I.A.; Ying, W. The Impact of China’s Environmental Protection Tax on Regional Economic Effects. Econ. Reg. 2024, 20, 1315–1326. [Google Scholar] [CrossRef]
  9. Deng, Y.; Dong, K.; Taghizadeh-Hesary, F.; Xue, J. How does environmental regulation affect the double dividend for energy firms? Evidence from China’s EPT policy. Econ. Anal. Policy 2023, 79, 807–820. [Google Scholar] [CrossRef]
  10. Kettner, C.; Leoni, T.; Köberl, J.; Kortschak, D.; Kirchner, M.; Sommer, M.; Kulmer, V. Modelling the economy-wide effects of unilateral CO2 pricing under different revenue recycling schemes in Austria–Searching for a triple dividend. Energy Econ. 2024, 137, 107783. [Google Scholar] [CrossRef]
  11. Pereira, A.M.; Pereira, R.M.; Rodrigues, P.G. A new carbon tax in Portugal: A missed opportunity to achieve the triple dividend? Energy Policy 2016, 93, 110–118. [Google Scholar] [CrossRef]
  12. Backhaus, J.G. The Law and Economics of Environmental Taxation: When should the ecotax kick in? Int. Rev. Law Econ. 1999, 19, 117–134. [Google Scholar] [CrossRef]
  13. Pearce, D. The role of carbon taxes in adjusting to global warming. Econ. J. 1991, 101, 938–948. [Google Scholar] [CrossRef]
  14. Bovenberg, A.L.; De Mooij, R.A. Environmental tax reform and endogenous growth. J. Public Econ. 1997, 63, 207–237. [Google Scholar] [CrossRef]
  15. Liu, Y. Whether fintech, natural resources, green finance and environmental tax affect CO2 emissions in China? A step towards green initiatives. Energy 2025, 320, 135181. [Google Scholar] [CrossRef]
  16. Ugrinov, S. The effects of environmental taxes on environmental pollution in the member states of the European Union. Econ. Syst. 2025, 101308. [Google Scholar] [CrossRef]
  17. Deng, Y.; You, D.; Wang, J. Research on the nonlinear mechanism underlying the effect of tax competition on green technology innovation-An analysis based on the dynamic spatial Durbin model and the threshold panel model. Resour. Policy 2022, 76, 102545. [Google Scholar] [CrossRef]
  18. Deng, W.; Kharuddin, S.; Ashhari, Z.M. Green finance transforms developed countries’ green growth: Mediating effect of clean technology innovation and threshold effect of environmental tax. J. Clean. Prod. 2024, 448, 141642. [Google Scholar] [CrossRef]
  19. Yang, Y.; Zhang, Y.; Zhang, Y.; Liu, T.; Xu, H. Environmental taxes promote the synergy between pollution and carbon reduction: Provincial evidence from China. J. Environ. Manag. 2024, 372, 123378. [Google Scholar] [CrossRef]
  20. Ye, D.; Tu, Y.; Xia, S. Environmental regulation and corporate exports: Quasi-experimental evidence from China’s environmental protection tax law. J. Environ. Manag. 2025, 373, 123818. [Google Scholar] [CrossRef]
  21. Du, J.; Li, Z.; Shi, G.; Wang, B. Can “environmental protection fee to tax” reduce carbon emissions? Evidence from China. Financ. Res. Lett. 2024, 62, 105184. [Google Scholar] [CrossRef]
  22. Zhang, Y.; Xia, F.; Zhang, B. Can raising environmental tax reduce industrial water pollution? Firm-level evidence from China. Environ. Impact Assess. Rev. 2023, 101, 107155. [Google Scholar] [CrossRef]
  23. Wang, Q.; Sun, X.; Xiong, H.; Wang, Q.; Zhang, B. Environmental taxes, environmental outsourcing, and pollution abatement: Evidence from Chinese industrial sewage discharge enterprises. Energy Econ. 2024, 133, 107480. [Google Scholar] [CrossRef]
  24. Huang, Y.; Liu, C.; Wang, L.; Qi, Y. The Impact of Environmental Protection Tax on Corporate ESG Performance and Corporate Green Behavior. Res. Int. Bus. Financ. 2025, 75, 102772. [Google Scholar] [CrossRef]
  25. Li, Y.; Hua, Z. Environmental protection tax law and corporate ESG performance. Financ. Res. Lett. 2024, 64, 105423. [Google Scholar] [CrossRef]
  26. Sun, Y.; Rahman, M.M.; Xinyan, X.; Siddik, A.B.; Islam, M.E. Unlocking environmental, social, and governance (ESG) performance through energy efficiency and green tax: SEM-ANN approach. Energy Strategy Rev. 2024, 53, 101408. [Google Scholar] [CrossRef]
  27. Jing, Z.; Zhang, W.; Zhao, P.; Zhao, Y. Environmental tax reform and corporate tax avoidance: A quasi-natural experiment on China’s environmental protection tax law. N. Am. J. Econ. Financ. 2025, 76, 102367. [Google Scholar] [CrossRef]
  28. Wang, X.; Wang, S.; Wu, K.; Zhai, C.; Li, Y. Environmental protection tax and enterprises’ green technology innovation: Evidence from China. Int. Rev. Econ. Financ. 2024, 96, 103617. [Google Scholar] [CrossRef]
  29. Parry, I.W. The Double Dividend: When You Get It And When You Don’t. Proceedings. Annual Conference on Taxation and Minutes of the Annual Meeting of the National Tax Association; National Tax Association: Leesburg, VA, USA, 1998; Volume 91, pp. 46–51. Available online: https://www.jstor.org/stable/41954577 (accessed on 5 May 2025).
  30. Ciaschini, M.; Pretaroli, R.; Severini, F.; Socci, C. Regional double dividend from environmental tax reform: An application for the Italian economy. Res. Econ. 2012, 66, 273–283. [Google Scholar] [CrossRef]
  31. Jaffe, A.B.; Stavins, R.N. Dynamic incentives of environmental regulations: The effects of alternative policy instruments on technology diffusion. J. Environ. Econ. Manag. 1995, 29, S43–S63. [Google Scholar] [CrossRef]
  32. Bashir, M.F.; Benjiang, M.A.; Shahbaz, M.; Shahzad, U.; Vo, X.V. Unveiling the heterogeneous impacts of environmental taxes on energy consumption and energy intensity: Empirical evidence from OECD countries. Energy 2021, 226, 120366. [Google Scholar] [CrossRef]
  33. Wang, M.Y.; Li, Y.M.; Mao, Y.H.; Zhang, H. Mechanism and policy recommendations of enterprises green technological innovation driven by market orientation. Chin. J. Environ. Manag. 2019, 11, 82–86. [Google Scholar] [CrossRef]
  34. Ahmed, K. Environmental policy stringency, related technological change and emissions inventory in 20 OECD countries. J. Environ. Manag. 2020, 274, 111209. [Google Scholar] [CrossRef] [PubMed]
  35. Martínez-Zarzoso, I.; Bengochea-Morancho, A.; Morales-Lage, R. Does environmental policy stringency foster innovation and productivity in OECD countries? Energy Policy 2019, 134, 110982. [Google Scholar] [CrossRef]
  36. Hassan, M.; Lee, J.Y.; Rouge, L.; Kouzez, M. The impact of green public finance and green taxes on environmental and non-environmental innovation. Res. Int. Bus. Financ. 2025, 76, 102868. [Google Scholar] [CrossRef]
  37. Niu, B.; Ruan, Y.; Zeng, F. Promoting remanufacturing through subsidy and environment tax: Channel co-opetition, incentive alignment and regulation optimization. Transp. Res. Part E Logist. Transp. Rev. 2022, 166, 102880. [Google Scholar] [CrossRef]
  38. Zatti, A. Environmental taxes and subsidies: Some insights from the Italian experience. Environ. Econ. 2020, 11, 39. [Google Scholar] [CrossRef]
  39. Li, Z.; Zheng, C.; Liu, A.; Yang, Y.; Yuan, X. Environmental taxes, green subsidies, and cleaner production willingness: Evidence from China’s publicly traded companies. Technol. Forecast. Soc. Change 2022, 183, 121906. [Google Scholar] [CrossRef]
  40. Jiang, Z.; Xu, C.; Zhou, J. Government environmental protection subsidies, environmental tax collection, and green innovation: Evidence from listed enterprises in China. Environ. Sci. Pollut. Res. 2023, 30, 4627–4641. [Google Scholar] [CrossRef]
  41. Tchórzewska, K.B.; Garcia-Quevedo, J.; Martinez-Ros, E. The heterogeneous effects of environmental taxation on green technologies. Res. Policy 2022, 51, 104541. [Google Scholar] [CrossRef]
  42. Bozatli, O.; Akca, H. The effects of environmental taxes, renewable energy consumption and environmental technology on the ecological footprint: Evidence from advanced panel data analysis. J. Environ. Manag. 2023, 345, 118857. [Google Scholar] [CrossRef]
  43. Fullerton, D.; Metcalf, G.E. Environmental taxes and the double-dividend hypothesis: Did you really expect something for nothing? NBER Working Paper No. w6199. Chic.-Kent Law Rev. 1997, 73, 221–256. [Google Scholar] [CrossRef]
  44. Abdullah, S.; Morley, B. Environmental taxes and economic growth: Evidence from panel causality tests. Energy Econ. 2014, 42, 27–33. [Google Scholar] [CrossRef]
  45. Hassan, M.; Oueslati, W.; Rousselière, D. Environmental taxes, reforms and economic growth: An empirical analysis of panel data. Econ. Syst. 2020, 44, 100806. [Google Scholar] [CrossRef]
  46. Jaeger, W.K. The double dividend hypothesis and environmental taxation. Encycl. Energy Nat. Resour. Environ. Econ. 2024, 1, 31–37. [Google Scholar] [CrossRef]
  47. Liu, N.; Yao, X.; Wan, F.; Han, Y. Are tax revenue recycling schemes based on industry-differentiated carbon tax conducive to realizing the “double dividend”? Energy Econ. 2023, 124, 106814. [Google Scholar] [CrossRef]
  48. Nakamya, M.; Romstad, E.; Onyinyi, B.; Katutsi, V.P.; Abigaba, M.L.; Mande, S. An environmental tax to promote and sustain biofuels and climate policy: The potential for a double dividend in agriculture-dependent economies. Appl. Energy 2025, 388, 125671. [Google Scholar] [CrossRef]
  49. Distefano, T.; D’Alessandro, S. Introduction of the carbon tax in Italy: Is there room for a quadruple-dividend effect? Energy Econ. 2023, 120, 106578. [Google Scholar] [CrossRef]
  50. Quintás, M.A.; Martínez-Senra, A.I.; Otero-Giráldez, M.S. Non-Linear effects of diesel taxes on environmental innovation: Room for higher taxes. Energy Policy 2024, 195, 114395. [Google Scholar] [CrossRef]
  51. Hansen, B.E. Threshold effects in non-dynamic panels: Estimation, testing, and inference. J. Econom. 1999, 93, 345–368. [Google Scholar] [CrossRef]
  52. Chu, L.K. Towards achieving energy transition goal: How do green financial policy, environmental tax, economic complexity, and globalization matter? Renew. Energy 2024, 222, 119933. [Google Scholar] [CrossRef]
  53. Huang, J.; Cai, X.; Huang, S.; Tian, S.; Lei, H. Technological factors and total factor productivity in China: Evidence based on a panel threshold model. China Econ. Rev. 2019, 54, 271–285. [Google Scholar] [CrossRef]
  54. Lin, B.; Li, X. The effect of carbon tax on per capita CO2 emissions. Energy Policy 2011, 39, 5137–5146. [Google Scholar] [CrossRef]
  55. Ostadzad, A.H. Innovation and carbon emissions: Fixed-effects panel threshold model estimation for renewable energy. Renew. Energy 2022, 198, 602–617. [Google Scholar] [CrossRef]
  56. Rao, M.; Vasa, L.; Xu, Y.; Chen, P. Spatial and heterogeneity analysis of environmental taxes’ impact on China’s green economy development: A sustainable development perspective. Sustainability 2023, 15, 9332. [Google Scholar] [CrossRef]
  57. Shen, Y.; Zhang, X. Study on the impact of environmental tax on industrial green transformation. Int. J. Environ. Res. Public Health 2022, 19, 16749. [Google Scholar] [CrossRef] [PubMed]
  58. Zhou, X.X.; Jia, M.Y.; Zhao, X. An empirical study and evolutionary game analysis of green finance promoting enterprise green technology innovation. China Ind. Econ. 2023, 6, 43–61. [Google Scholar] [CrossRef]
  59. Manu, E.K.; Asongu, S.A. Renewable energy, innovations and environmental sustainability in Sub-Saharan Africa: The Environmental Kuznets Curve, policy thresholds and thresholds for complementary policies. Renew. Energy 2025, 249, 123197. [Google Scholar] [CrossRef]
  60. Wang, J. Assessing environmental protection tax’s impact on firms’ green practices: The mediating effect of green innovation and the moderating effect of executive green awareness. J. Clean. Prod. 2024, 474, 143593. [Google Scholar] [CrossRef]
  61. Zhou, Y.; Su, Q. Environmental protection tax, management efficiency, and enterprise green technology innovation. Financ. Res. Lett. 2025, 75, 106860. [Google Scholar] [CrossRef]
  62. Ran, Z.; Ji, P. Environmental protection tax legislation and corporate reputation in China: A legal perspective. Financ. Res. Lett. 2025, 74, 106790. [Google Scholar] [CrossRef]
  63. Zhou, D.; Qiu, Y.; Wang, M. Does environmental regulation promote enterprise profitability? Evidence from the implementation of China’s newly revised Environmental Protection Law. Econ. Model. 2021, 102, 105585. [Google Scholar] [CrossRef]
  64. Zor, S. A neural network-based measurement of corporate environmental attention and its impact on green open innovation: Evidence from heavily polluting listed companies in China. J. Clean. Prod. 2023, 432, 139815. [Google Scholar] [CrossRef]
  65. Chu, T.; Wang, S. Environmental tax-for-fee reform and China’s urban green innovation: A local government behavior perspective. Environ. Impact Assess. Rev. 2025, 114, 107950. [Google Scholar] [CrossRef]
  66. Kesicki, F.; Strachan, N. Marginal abatement cost (MAC) curves: Confronting theory and practice. Environ. Sci. Policy 2011, 14, 1195–1204. [Google Scholar] [CrossRef]
Figure 1. Placebo test.
Sustainability 17 07038 g001
Figure 2. Triple dividend threshold effect.
Sustainability 17 07038 g002
Figure 3. The threshold of environmental dividends.
Sustainability 17 07038 g003
Figure 4. The threshold of innovation dividend.
Sustainability 17 07038 g004
Figure 5. The threshold of economic dividends.
Sustainability 17 07038 g005
Table 1. Variable definitions and measurements.
Variable TypesVariable NameSymbolExplanation and Calculation MethodsData Source
Core explained variableTotal phosphorus pollution equivalentLnTPPETotal phosphorus pollution equivalent, add 1 and take the natural logarithmPPMANDATA
Quality of authorized patentsQAPThe calculation method will be described in detail belowPPMANDATA
Total operating incomeLnTOITotal operating income, natural logarithmPPMANDATA
Core explanatory variablesAnnual actual payment of environmental protection taxLnAEPTAnnual actual EPT payment, natural logarithmPPMANDATA
Explained variableWater body comprehensive pollution equivalentLnWCPEWater body comprehensive pollution equivalent, add 1 and take the natural logarithmPPMANDATA
Quality of patent applicationPAQThe calculation method will be described in detail belowPPMANDATA
Total profitLnTPTotal profit, natural logarithmPPMANDATA
Explanatory variableAnnual payment of environmental protection tax is requiredLnREPTAnnual EPT payable, natural logarithmPPMANDATA
Threshold variablesTotal pollution equivalentLnTPEOverall pollution equivalent, add 1 and take the natural logarithmPPMANDATA
Control variableThe age of a listed companyLnAgeThe natural logarithm of the listing year plus 1PPMANDATA
Operating profit growth rateOPGROperating profit growth rate based on the previous yearPPMANDATA
Operating profit ratioOPROperating profit divided by total profitPPMANDATA
Cash ratioCash(Cash and marketable securities)/current liabilitiesCSMAR
Comprehensive tax rateCTRThe sum of taxes payable, taxes and surcharges minus tax refunds, divided by total profitPPMANDATA
R&D investment amountR&DThe natural logarithm of R&D investmentPPMANDATA
Number of employeesLnNEThe natural logarithm of the number of employees in the enterprisePPMANDATA
Financial leverageFLTotal debt to shareholders’ equity ratioPPMANDATA
ROAROARatio of net profit to total assetsCSMAR
Net intangible assetsLnNIAInitial cost—accumulated amortization—impairment provision, finally take the natural logarithmCSMAR
Financial expensesLnFEFinancial expenses take natural logarithmPPMANDATA
Shareholding ratio of top ten shareholdersSRTTSThe ratio of the total number of shares held by the top 10 shareholders to the total share capitalPPMANDATA
Net profitLnNPThe final profit of the company after deducting all costs, expenses, taxes, etc., is taken as the natural logarithmPPMANDATA
Total pollution equivalentLnTPEThe chemical oxygen demand and ammonia nitrogen emissions in industrial wastewater, sulfur dioxide and nitrogen oxide emissions in industrial waste gas are standardized and converted into a unified pollution equivalent number, and the total is added with 1 to take the logarithmPPMANDATA
Debt-to-asset ratioDARTotal liabilities to total assets ratioPPMANDATA
Table 2. Descriptive statistics.
VariableObsMeanStd. Dev.MinMax
LnTPPE43606.7770.2136.2927.185
QAP43600.9220.0920.0000.996
LnTOI436022.5251.51118.38928.83
LnAEPT436014.5191.549.96820.892
LnWCPE43600.1420.0020.1340.149
PAQ43600.9240.0890.0000.996
LnTP436019.8811.59612.80426.086
LnREPT436014.6981.53910.14321.066
LnTPE43600.1480.0020.1430.153
LnAge43602.7410.3681.9463.434
OPGR4360−0.83836.560−1909.852535.324
OPR43601.0112.452−21.704155.451
Cash43600.4780.5740.0047.609
CTR43600.2962.411−108.16159.813
R&D436019.1801.27511.12524.410
LnNE43608.4381.1953.36713.253
FL43601.5254.634−6.365270.994
ROA43600.0300.081−1.8560.759
LnNIA436019.6651.59511.6426.314
LnFE436018.1481.6129.05324.049
SRTTS436053.5313.7448.7897.93
LnNP436019.7241.57412.50625.823
DAR43600.4720.180.0470.994
Table 3. Regression results of environmental dividend effect.
VariablesBenchmark RegressionVariablesReplacing Core Explanatory VariableVariablesReplacing Explained Variable
(1)(2)(3)
LnTPPELnTPPELnWCPE
LnAEPT−0.0250 ***LnREPT−0.0251 ***LnAEPT−0.0002 **
(0.0080) (0.0080) (0.0001)
CTR0.0031 ***CTR0.0031 ***CTR0.0001 **
(0.0010) (0.0010) (0.0001)
FL0.0011 ***FL0.0011 ***FL−0.0001 ***
(0.0002) (0.0002) (0.0001)
DAR−0.1180 **DAR−0.1180 **DAR0.0002
(0.0586) (0.0586) (0.0005)
OPGR0.0001 **OPGR0.0001 **OPGR0.0001 **
(0.0001) (0.0001) (0.0001)
OPR0.0006 *OPR0.0006 *OPR−0.0001 ***
(0.0004) (0.0004) (0.0004)
LnFE0.0014LnFE0.0014LnFE0.0002
(0.0039) (0.0039) (0.0004)
Cash−0.0013Cash−0.0014Cash0.0002 *
(0.0096) (0.0096) (0.0086)
Constant7.1670 ***Constant7.1730 ***Constant0.1440 ***
(0.1380) (0.1400) (0.0013)
ID FEYESID FEYESID FEYES
Year FEYESYear FEYESYear FEYES
Industry FEYESIndustry FEYESIndustry FEYES
Observations4360Observations4360Observations4360
R-squared0.299R-squared0.299R-squared0.464
Notes: *** p < 0.01, ** p < 0.05, * p < 0.1. We report robust standard errors in parentheses and cluster robust standard errors at the individual level.
Table 4. Regression results of innovation dividend effect.
VariablesBenchmark RegressionVariablesReplacing Core Explanatory VariableVariablesReplacing Explained Variable
(4)(5)(6)
QAPQAPPAQ
LnAEPT0.0079 ***LnREPT0.0079 ***LnAEPT0.0077 **
(0.0030) (0.0030) (0.0033)
R&D0.0086 ***R&D0.0086 ***R&D−0.0035
(0.0016) (0.0016) (0.0022)
LnTPE2.2970 **LnTPE2.2970 **LnTPE−1.2540
(1.1050) (1.1050) (1.0540)
LnNIA0.0061 *LnNIA0.0061 *LnNIA0.0060 *
(0.0034) (0.0034) (0.0035)
LnAge0.0370LnAge0.0370LnAge0.0574
(0.0326) (0.0326) (0.0385)
FL−0.0003FL−0.0003FL00003
(0.0001) (0.0001) (0.0001)
LnFE−0.0009LnFE−0.0009LnFE−0.0002
(0.0012) (0.0012) (0.0021)
SRTTS0.0002SRTTS0.0002SRTTS−0.0004 *
(0.0002) (0.0002) (0.0002)
DAR0.0121DAR0.0121DAR0.0010
(0.0200) (0.0200) (0.0232)
ID FEYESID FEYESID FEYES
Year FEYESYear FEYESYear FEYES
Industry FEYESIndustry FEYESIndustry FEYES
Constant0.0892Constant0.0873Constant0.8140 ***
(0.2030) (0.2040) (0.2160)
Observations4360Observations4360Observations4360
R-squared0.579R-squared0.579R-squared0.542
Notes: *** p < 0.01, ** p < 0.05, * p < 0.1. We report robust standard errors in parentheses and cluster robust standard errors at the individual level.
Table 5. Regression results of economic dividend effect.
VariablesBenchmark RegressionVariablesReplacing Core Explanatory VariableVariablesReplacing Explained Variable
(7)(8)(9)
LnTOILnTOILnTP
LnAEPT0.3810 ***LnREPT0.3810 ***LnAEPT0.1860 ***
(0.0265) (0.0264) (0.0574)
R&D0.0277 ***R&D0.0276 ***R&D0.1250 ***
(0.0084) (0.0084) (0.0281)
LnNIA0.1600 ***LnNIA0.1600 ***LnNIA0.1310 **
(0.0355) (0.0355) (0.0527)
LnFE0.0222 ***LnFE0.0222 ***LnFE−0.0018
(0.0065) (0.0065) (0.0201)
SRTTS0.0019 *SRTTS0.0019 *SRTTS0.0056 **
(0.0010) (0.0010) (0.0027)
DAR0.3820 *DAR0.3820 *DAR0.6610 *
(0.213) (0.213) (0.366)
LnAge−0.0657LnAge−0.0668LnAge0.0108
(0.1560) (0.156) (0.4760)
FL−0.0001FL−0.0001FL−0.0433 **
(0.0006) (0.0006) (0.0174)
ROA0.2670ROA0.2680ROA0.1590
(0.4210) (0.4210) (0.4120)
LnTPE1.7010LnTPE1.7190LnTPE15.1800
(3.4600) (3.4560) (12.4000)
ID FEYESID FEYESID FEYES
Year FEYESYear FEYESYear FEYES
Industry FEYESIndustry FEYESIndustry FEYES
Constant12.5500 ***Constant12.4800 ***Constant9.4340 ***
(1.0500) (1.0500) (2.5580)
Observations4360Observations4360Observations4360
R-squared0.982R-squared0.982R-squared0.790
Notes: *** p < 0.01, ** p < 0.05, * p < 0.1. We report robust standard errors in parentheses and cluster robust standard errors at the individual level.
Table 6. Robustness tests for triple dividend effects.
Variables(10)Variables(11)Variables(12)
LnTPPEQAPLnTOI
LnAEPT−0.0241 ***LnAEPT0.0077 **LnAEPT0.3290 ***
(0.0081) (0.0031) (0.0213)
ID FEYESID FEYESID FEYES
Year FEYESYear FEYESYear FEYES
Industry FEYESIndustry FEYESIndustry FEYES
Constant7.2210 ***Constant0.0765Constant9.4480 ***
(0.1740) (0.2000) (0.9130)
Observations4360Observations4360Observations4360
R-squared0.299R-squared0.579R-squared0.987
Notes: *** p < 0.01, ** p < 0.05, We report robust standard errors in parentheses and cluster robust standard errors at the individual level.
Table 7. Threshold test results and threshold values.
Threshold VariableCategoryF-Statisticp-Value10%5%1%
Environmental Dividend (LnTPE)Single threshold884.750.000034.587338.944044.1797
Double threshold278.220.000012.954615.775719.3122
Triple threshold118.880.5033150.8915159.6774177.4139
Innovation Dividend (LnTPE)Single threshold65.660.000022.617424.947031.0908
Double threshold11.890.190014.807717.205022.0554
Triple threshold5.770.690014.438017.120524.1672
Economic Dividend (LnTPE)Single threshold54.780.016741.894545.605257.1272
Double threshold30.100.016721.126525.006132.5627
Triple threshold11.400.336716.277118.982427.8074
Table 8. Threshold results.
Threshold VariableCategoryThresholdF-Statisticp-Value10%5%1%
Environmental Dividend (LnTPE)Double threshold0.1461883.680.000031.984237.510140.7290
0.1481278.710.000014.275416.501622.3186
Innovation Dividend (LnTPE)Single threshold0.146965.660.000021.647124.614129.6358
Economic Dividend (LnTPE)Double threshold0.148254.780.016739.549944.980256.7865
0.149330.100.020021.829323.969833.6916
Table 9. Regression results of threshold model.
Variables(13)Variables(14)Variables(15)
LnTPPEQAPLnTOI
γ i ≤ 0.1461−0.0386 *** σ i ≤ 0.14690.0069 ** θ i ≤ 0.14820.3700 ***
(0.0076) (0.0029) (0.0260)
0.1461 < γ i ≤0.1481−0.0289 *** σ i > 0.14690.0081 ***0.1482 < θ i ≤ 0.14930.3740 ***
(0.0076) (0.0029) (0.0261)
γ i > 0.1481−0.0202 *** θ i > 0.14930.3800 ***
(0.0075) (0.0265)
Constant7.153 ***Constant0.461 ***Constant13.300 ***
(0.1410) (0.0780) (0.9660)
Observations4360Observations4360Observations4360
Number of id872Number of id872Number of id872
R-squared0.228R-squared0.048R-squared0.513
Notes: Robust standard errors in parentheses, *** p < 0.01, ** p < 0.05.
Table 10. Threshold effect robustness test.
Variables(16)Variables(17)Variables(18)
LnTPPEQAPLnTOI
γ i ≤ 0.1461−0.0384 *** σ i ≤ 0.14690.0070 ** θ i ≤ 0.14820.3700 ***
(0.0076) (0.0029) (0.0259)
0.1461 < γ i ≤ 0.1481−0.0289 *** σ i > 0.14690.0082 ***0.1482 > θ i ≤ 0.14930.3740 ***
(0.0076) (0.0029) (0.0261)
γ i > 0.1481−0.0203 *** θ i > 0.14930.3800 ***
(0.0075) (0.0264)
Constant7.1580 ***Constant0.4590 ***Constant13.2200 ***
(0.1420) (0.0782) (0.9660)
Observations4360Observations4360Observations4360
Number of id872Number of id872Number of id872
R-squared0.228R-squared0.048R-squared0.513
Notes: Robust standard errors in parentheses, *** p < 0.01, ** p < 0.05.
Table 11. Endogenous treatment of threshold effect.
Variables(19)Variables(20)Variables(21)
LnTPPEQAPLnTOI
γ i ≤ 0.1461−0.0388 *** σ i ≤ 0.14690.0064 ** θ i ≤ 0.14820.3180 ***
(0.0076) (0.0029) (0.0209)
0.1461 < γ i ≤ 0.1481−0.0291 *** σ i > 0.14690.0076 ***0.1482 < θ i ≤ 0.14930.3210 ***
(0.0075) (0.0029) (0.0209)
γ i > 0.1481−0.0204 *** θ i > 0.14930.3250 ***
(0.0075) (0.0211)
Constant7.1410 ***Constant0.4380 ***Constant10.6200 ***
(0.1750) (0.0784) (0.8170)
Observations4360Observations4360Observations4360
Number of id872Number of id872Number of id872
R-squared0.228R-squared0.048R-squared0.649
Notes: Robust standard errors in parentheses, *** p < 0.01, ** p < 0.05.
Table 12. Test results of threshold effect of environmental dividend heterogeneity in non-heavily polluting and heavily polluting industries.
Environmental Dividend Double ThresholdNon-Heavily Polluting Industries
ThresholdF-Statisticp-Value10%5%1%
0.1462621.930.000033.891337.773743.1968
0.1493164.220.000012.498614.607518.0003
Heavily Polluting Industries
ThresholdF-Statisticp-Value10%5%1%
0.1461285.090.000012.901714.919720.7654
0.148166.790.00009.592312.063518.3548
Table 13. Regression results of the threshold effect of environmental dividend heterogeneity in non-heavily polluting and heavily polluting industries.
VariablesNon-Heavily Polluting IndustriesVariablesHeavily Polluting Industries
(22)(23)
LnTPPELnTPPE
γ i ≤ 0.1462−0.0337 *** γ i ≤ 0.1461−0.0539 ***
(0.0091) (0.0156)
0.1462 < γ i ≤ 0.1493−0.0218 **0.1461 < γ i ≤ 0.1481−0.0454 ***
(0.0090) (0.0156)
γ i > 0.1493−0.0128 γ i > 0.1481−0.0359 **
(0.0090) (0.0155)
Constant6.9560 ***Constant7.5590 ***
(0.1710) (0.2740)
Observations3005Observations1295
Number of id601Number of id259
R-squared0.226R-squared0.229
Notes: Robust standard errors in parentheses, *** p < 0.01, ** p < 0.05.
Table 14. Test results of threshold effect of innovation dividend heterogeneity in non-heavily polluting and heavily polluting industries.
Non-Heavily Polluting Industries
Innovation Dividend Single Threshold EffectThresholdF-Statisticp-Value10%5%1%
0.146958.060.000018.329620.242425.2858
Heavily Polluting Industries
ThresholdF-Statisticp-Value10%5%1%
0.146018.330.033314.822117.008822.9545
Table 15. Regression results of threshold effect of innovation dividend heterogeneity in non-heavily polluting and heavily polluting industries.
VariablesNon-Heavily Polluting IndustriesVariablesHeavily Polluting Industries
(24)(25)
QAPQAP
σ i ≤ 0.14690.0062 * σ i ≤ 0.14600.0074
(0.0035) (0.0061)
σ i > 0.14690.0076 ** σ i > 0.14600.0089 *
(0.0035) (0.0060)
Constant0.5150 ***Constant0.3660 **
(0.0868) (0.1720)
Observations3005Observations1295
Number of id601Number of id259
R-squared0.049R-squared0.049
Notes: Robust standard errors in parentheses, *** p < 0.01, ** p < 0.05, * p < 0.1.
Table 16. Test results of threshold effect of economic dividend heterogeneity in non-heavily polluting and heavily polluting industries.
Non-Heavily Polluting Industries
Economic Dividend Double Threshold EffectThresholdF-Statisticp-Value10%5%1%
0.148136.960.060031.128037.982742.1181
NO14.540.206717.447321.670926.4534
Heavily Polluting Industries
ThresholdF-Statisticp-Value10%5%1%
NO24.420.153326.375431.643436.2200
NO7.640.726717.737220.178824.1648
Table 17. Regression results of the threshold effect of economic dividend heterogeneity in non-heavily polluting and heavily polluting industries.
VariablesNon-Heavily Polluting IndustriesVariablesHeavily Polluting Industries
(26)(27)
LnTOILnTOI
θ i ≤ 0.14810.3620 *** θ i ≤ NO0.3350 ***
(0.0297) (0.0306)
0.1481 < θ i ≤ NO0.3660 ***NO < θ i ≤ NO0.3410 ***
(0.0298) (0.0306)
θ i > NO0.3720 *** θ i > NO0.3480 ***
(0.0303) (0.0310)
Constant13.5900 ***Constant13.4800 ***
(1.2320) (1.0290)
Observations3005Observations1295
Number of id601Number of id259
R-squared0.473R-squared0.631
Notes: Robust standard errors in parentheses, *** p < 0.01.
Disclaimer/Publisher’s Note: The statements, opinions and data contained in all publications are solely those of the individual author(s) and contributor(s) and not of MDPI and/or the editor(s). MDPI and/or the editor(s) disclaim responsibility for any injury to people or property resulting from any ideas, methods, instructions or products referred to in the content.

