1. Introduction
Amid the intensifying global climate crisis and the deepening of sustainable development strategies, the production of green products by manufacturers has become a key driver of coordinated economic and ecological progress. Many countries have actively enacted policies to promote green technology innovation, establish carbon pricing mechanisms, and incentivize corporate participation in circular economy practices. For example, during the 75th United Nations General Assembly in September 2020, Chinese authorities formally announced the following climate targets: China strives to achieve carbon peaking by 2030 and carbon neutrality by 2060 [
1].
With the incentives of national policies, many companies, such as Yili Group and Mercedes-Benz, are shifting toward low-carbon production, adopting low-carbon technologies, and developing products that meet consumers’ growing preferences for environmentally friendly options. While green technology innovation demonstrates significant potential in reducing carbon emissions across a product’s lifecycle from manufacturing to usage, its successful implementation requires robust technological capabilities and substantial capital investment. Thus, manufacturers need to be careful about whether to incorporate green technologies into their core development strategies. The existing literature has extensively examined green investment strategies in logistics management [
2,
3], supply chain operations [
4], and supply chain network design [
5,
6]. Liu and Ma (2022) demonstrated that the reliability assessment of the supply chain and the analysis of the green logistics innovation strategy significantly improved the environmental pollution of the logistics industry [
2]. Huang et al. (2020) found that firms implementing the carbon tax policy are more inclined to invest in relatively efficient green technology [
3]. In addition, the dual-channel sales mode has been widely adopted by manufacturers in practice, as seen in companies such as Gree, Huawei, and Lenovo. This sales structure also significantly influences green investment strategies. On the one hand, the manufacturer plays a leading role in adopting green technologies and determines whether products possess environmentally friendly attributes. On the other hand, the e-retailer serves as direct links to consumers, effectively communicating the value of green products and shaping green purchasing behavior. In a dual-channel supply chain, the demand responses to green products differ between online and offline channels, thereby affecting the manufacturer incentives for green investment. Therefore, studying green investment strategies in this context is essential for aligning the behaviors of supply chain members and promoting sustainable transformation. Motivated by these studies and practices, this work investigates the applicability of green investment strategies in a dual-channel supply chain comprising a manufacturer and an e-retailer, with particular emphasis on channel competition and environmental considerations.
With the rapid development of internet technology and e-commerce, online sales have experienced significant growth. An increasing number of manufacturers, such as HP, Nike, and Huawei, have established direct sales channels alongside traditional reselling channels. However, conflicts arise between direct sales and reselling channels, potentially leading to manufacturer malpractices such as information fraud and misreporting. In particular, compared to reselling channels, consumers may place greater trust in the environmental friendliness of products sold through direct sales channels.
Blockchain, as a disruptive and innovative technology, can ensure that information about product quality during the production process is transparent, tamper-proof, and verifiable by all stakeholders in the supply chain. Its core attributes, i.e., decentralized recordkeeping and immutable data, enable trustworthy information sharing, which has transformative potential not only in supply chains but also in other fields such as the art industry, where authenticity and provenance of artworks are critical. By enhancing consumer trust and reducing information asymmetry, blockchain improves purchasing confidence and supports sustainable consumption behavior. Therefore, blockchain technology has garnered significant attention from both academia and industry due to its intrinsic characteristics, e.g., decentralization and traceability. Several studies have explored low-carbon supply chain considering blockchain technology [
1,
4,
7,
8]. Zhu et al. (2024) considered two competing focal firms with different brand positions, one of which engages in carbon emission reduction research and development and offers low-carbon products [
7]. Chen et al. (2023) investigated a three-stage fresh agricultural product supply chain and analyzed the impacts of key factors such as the blockchain technology application cost and the green trust level on the optimal decisions and profits [
1]. Tian and Bai (2025) compared blockchain adoption modes led by the government, manufacturer, and retailer, analyzing their effects on sustainability, profitability, and social welfare to inform optimal adoption decisions [
8]. Gu et al. (2025) examined the conditions for blockchain implementation in a two-tier supply chain with a dominant manufacturer and a retailer, emphasizing the roles of consumer preferences for low-carbon products, competitive dynamics, and implementation costs [
4].
While prior studies demonstrate that green investments enhance the eco-friendliness of the manufacturing process and the advancement of the sustainability of green supply chains, and that blockchain improves supply chain traceability [
4,
8], few address how these strategies interact when implemented by different supply chain members with conflicting interests. Specifically, the strategic interplay between manufacturers’ green investment and e-retailers’ blockchain adoption remains underexplored, particularly under hierarchical power structures where channel leaders and followers possess asymmetric decision-making authority. Distinct from prior studies, this work aims to construct Stackelberg game models to analyze the strategic choices regarding the manufacturer’s green investment and the e-retailer’s adoption of blockchain technology (i.e., the strategic interactions between the manufacturer and the retailer), and endeavors to explore the pricing and green level decisions of the manufacturer and the pricing decision of the e-retailer under a dual-channel structure, so as to broaden the scope of research in this field and provide decision support for business firms.
The current work will answer the following significant and practical questions:
- (1)
How do market distribution, consumers’ low-carbon preferences, and the competition intensity between the e-retailer and the manufacturer influence the decisions of supply chain participants?
- (2)
How can the manufacturer determine its pricing and green level decisions, and how can the e-retailer set its pricing decision?
- (3)
Under what market conditions is it optimal for the manufacturer to invest in low-carbon production and for the e-retailer to implement blockchain technology?
In order to answer these questions, this work constructs a two-tier supply chain dominated by a manufacturer, followed by an e-retailer. The manufacturer distributes products both through the e-retailer and its own direct sales channel. For notational convenience, the manufacturer’s direct sales channel will hereafter be referred to as the online channel. In this study, the low-carbon attribute is modeled through the manufacturer’s green level decision, which represents the extent to which carbon emissions are reduced during production via green technologies or environmentally friendly materials. A higher green level reflects a more substantial reduction in carbon emissions, aligning with the low-carbon supply chain objectives. Three strategy combinations, i.e., NN, LN, and LB, are considered to explore the conditions under which green investment and blockchain technology adoption are beneficial.
The contributions of this study are twofold.
- (1)
This work comprehensively considers that the demand in different channels is influenced by factors such as retail price, market share, green trust level, competition intensity between the e-retailer and the manufacturer, and consumers’ low-carbon preference, and investigates the pricing and green level decisions under the strategy combinations NN, LN, and LB, which enriches the theoretical framework of low-carbon supply chain operations and management.
- (2)
This study compares and analyzes the decision-making outcomes of the supply chain before and after the application of green investment and blockchain technologies. It identifies the conditions under which the manufacturer adopts a green investment strategy and the e-retailer implements blockchain technology, thereby offering insights for addressing relevant practical problems.
The remainder of the paper is organized as follows.
Section 2 reviews the related works.
Section 3 describes the research problem.
Section 4 derives the equilibrium decisions under the strategy combinations NN, LN, and LB.
Section 5 compares the game equilibrium results. Numerical analyses are conducted in
Section 6. Conclusions and managerial implications are provided in
Section 7. All the proofs of propositions and corollaries are provided in the
Appendix A.
2. Literature Review
Relevant works contain three streams: low-carbon supply chain, blockchain technology, and dual-channel supply chain. These streams are reviewed separately in the following.
2.1. Green Supply Chain
The studies on green supply chain contain various aspects, such as green procurement, green logistics, low-carbon products, and more. This work specifically focuses on green investment strategies, and thus reviews the literature related to low-carbon supply chains.
A low-carbon supply chain is critical to the advancement of business operations, especially as globalization escalates environmental issues and consumers increase environmental awareness [
9]. Thus, this supply chain has widely attracted attention in academia. Some works focused on operation decisions within decentralized low-carbon supply chains. He et al. (2024) incorporated consumer eco-awareness into carbon emission decision models, studying upstream emission reduction decisions [
10]. Liu et al. (2023) proposed game models with live-streaming sales mode, finding that the consumer low-carbon awareness can increase product green [
11]. Zhang et al. (2024) demonstrated that the carbon emission decision is dependent on the carbon emission cost sharing rate [
12]. For the above supply chain, Yang et al. (2025) investigated collaborative innovation from perspectives of contracts and regulations [
13]. Gu et al. (2025) proposed decision models considering blockchain, finding that both consumer low-carbon preferences and product competition affect blockchain adoptions [
4].
Some works considered behavior preferences in low-carbon supply chains. Tang et al. (2023) demonstrated that the retailer fairness concern and carbon emission cost affect the financing equilibrium decision [
14]. Song et al. (2024) further studied the synergy impacts of the fairness concern and the low-carbon preference on performances of low-carbon supply chains [
15]. Li et al. (2024) studied how Nash bargaining fairness concern influences the carbon emission reduction [
16]. Furthermore, some works studied the coordination for a low-carbon supply chain. Ren and Hu (2024) studied the impacts of wholesale price constraints and government subsidies on the low-carbon supply chain coordination [
17]. Wang et al. (2024) used a Lagrange-Stackelberg optimization approach to investment Pareto-efficient coordination [
18]. Pu et al. (2024) incorporated dual credit policy into an automatic supply chain, investigating low-carbon strategies and coordination strategies [
19]. The above related works investigated the green supply chain decisions from various perspectives, but rarely from the blockchain perspective. Blockchain technology can help consumers obtain product information and trace product production. Especially for a green supply chain, the introduction of this technology makes it more attractive to green preference consumers. Thus, it is necessary to study the impact of blockchain on the green supply chain. Lastly, Gu et al. (2025) examined the blockchain adoption of the manufacturer in a low-carbon supply chain and primarily focused on competition between low-carbon and ordinary products 4. However, they did not regard green investment as an important strategy and ignored the widely used dual-channel sales mode in practice. Thus, this work fills these gaps by incorporating both green investment and dual-channel structure into blockchain framework.
2.2. Blockchain Technology
Blockchain technology is used to disclose and trace product information. This technology significantly affects supply chain decisions. Thus, some works focused on blockchain adoption for supply chains. For an e-commence supply chain, Li et al. (2024) examined the impacts of the blockchain technology on privacy protection and sales mode selection [
20]. Pu et al. (2024) further studied how blockchain adoption influences hybrid strategies [
21]. Hou et al. (2024) studied the encroachment strategy and blockchain adoption for a manufacturer in a platform supply chain [
22]. Moreover, some works found that blockchain adoption for a supply chain is also affected by consumer behavior preference, incorporating this preference into strategy models. Zhuo et al. (2025) incorporated consumer traceability awareness into a blockchain adoption model for a supply chain, studying the relationship between this consumer behavior preference and blockchain adoption [
23]. Liao et al. (2025) developed a game model with consumer privacy concerns, and found that blockchain adoption and coordination for a green supply chain are affected by this behavior preference [
24].
In a semiconductor chip supply chain, Cao et al. (2025) demonstrated that blockchain introduction is dependent on the information disclosure [
25]. From the perspective of a green supply chain, Babaei et al. (2025) investigated tracing strategies and blockchain adoption, and found that the tracing cost of the green product is more sensitive to block numbers [
26]. Moreover, Dou et al. (2024) proposed an analytical model to investigate blockchain adoptions of both a manufacturer and a retailer [
27]. Different from the above related works, Karakas et al. (2024) discussed how blockchain adoption influences the supply chain logistics management through reviewing the relevant literature [
28]. For a dual-channel supply chain consisting of an offline and an online retailer, Lu et al. (2024) proposed mathematical models, examining the blockchain introduction of an e-retailer, and finding that the blockchain introduction benefits the online retailer under a certain condition [
29]. Although some works examined the green supply chain decisions with blockchain, these studies did not examine how blockchain affects the dual-channel sale mode. Lu et al. (2024) investigated the blockchain adoption of an e-retailer under the dual-channel sale mode, but they considered the online and offline stores of the e-retailer rather than the direct sales and wholesale sales channels of a manufacturer [
29]. In fact, this type of sales mode is widely implemented by manufacturers in practice, such as Gree, Lenovo, Apple, and other groups. Accordingly, studying the impact of blockchain on the green supply chain with the manufacturer considering direct sales and wholesale sales channels is both timely and practically meaningful.
2.3. Dual-Channel Supply Chain
Dual-channel sale modes are extensively used to incentivise demand increase for businesses. Operational strategies in a dual-channel supply system are essential for effective supply chain performance. In dual-channel supply chain with a platform, some works focused on sales mode choices. Li et al. (2024) examined the selection of the platform sales mode in green supply chains [
30]. Matsui (2024) studied the two competing supplier selections between agency selling and wholesale contracts provided by a platform [
31]. Different from the above works, related studies considered product quality information disclosure. Zhang et al. (2024) studied the selection between price signal and blockchain adoption to address quality information asymmetry in dual-channel supply chains [
32]. Huang et al. (2025) examined disclosure strategies of product quality information in a dual-purpose platform [
33]. In addition, Yang et al. (2024) proposed pricing strategy models with cross-channel data resources, obtaining optimal online and offline prices [
34]. Zhang et al. (2024) further developed dynamic game models, studying digital application investment and coordination strategies [
35].
Some works studied the coordination of dual-channel supply chains through different contracts. In a dual-channel supply chain, Gu et al. (2023) studied the coordination with offline in-sale service [
36]. Nematollahi et al. (2024) investigated coordination and competition based on the demand with the multi-factor [
37]. Moreover, Zhang et al. (2025) developed new robust decision models considering forward and reverse logistics, demonstrating that this proposed model balances robustness and cost-effectiveness [
38]. Modak et al. (2024) used the demand function without fake sustainable organic certificates to denote blockchain adoption, studying how this technology influences fresh agricultural supply chains [
39]. In previous works on dual-channel supplier chain, only Zhang et al. (2024) and Modak et al. (2024) investigated blockchain adoption, but did not consider low-carbon products [
32,
39]. The study of low-carbon product supply chains is of significant practical relevance as it responds to both global carbon reduction policies and the growing trend of green consumption. It also helps enterprises optimize their operational strategies while meeting environmental regulations, thereby achieving a balance between economic performance and environmental sustainability.
2.4. Research Contribution
The existing literature examined the operational strategies of dual-channel supply chains from various perspectives. However, limited attention was focused on the synergistic impacts of low-carbon technology and blockchain introduction on this supply chain.
Table 1 outlines the contributions of the related studies and highlights the distinctions between this work and prior research. Tang et al. (2023) investigated carbon emission decision for dual-channel supply chains with retailer behavior preferences and failed to consider the effects of blockchain introduction [
14]. Although Lu et al. (2024) incorporated blockchain technology into the dual-channel supply chain, and assumed the dual-channel to be a combination of the online and offline retailers, but they did not consider the low-carbon product [
29]. Furthermore, Liao et al. (2025) and Babaei et al. (2025) investigated the blockchain introduction of a supply chain with green products [
24,
26]. Their focus was limited to the operational decisions within single-channel supply chains. To address the aforementioned gaps, this work contributes to the prior research in the following three ways. (1) Both low-carbon and blockchain technologies are incorporated into a dual-channel supply chain and the joint impacts of both on pricing strategies are investigated. (2) Three situations are discussed, focusing on whether the manufacturer adopted green investments and whether the retailer implemented a blockchain. (3) The theoretical results of the optimal decisions are obtained and the optimal decisions among the three situations are compared and discussed. The joint effects of important parameters on the equilibrium results are analyzed.
3. Problem Description
This paper investigates a two-player game between a manufacturer, acting as the Stackelberg leader, and an e-retailer as the follower. The manufacturer produces a product, wholesales it to the e-retailer, and simultaneously sells it to consumers through its online channel at a retail price. The e-retailer decides its selling price. The manufacturer determines whether to undertake green investment. Consumers may choose to purchase either from the e-retailer or from the online channel.
The manufacturer has direct control over both the production and sales of its products, which enables more transparent communication of green production standards and certifications. As a result, consumers are more likely to trust the green attributes of products sold through the manufacturer’s online channel. In contrast, the e-retailer, functioning as an intermediary, faces more complex information transmission processes, which may lead to information loss or distortion and thus lower consumer trust in the green attributes of products sold via the retail channel. Consequently, the e-retailer may consider adopting blockchain technology to enhance transparency and credibility. The implementation of blockchain technology ensures that consumers have full confidence in the information regarding the low-carbon product [
4].
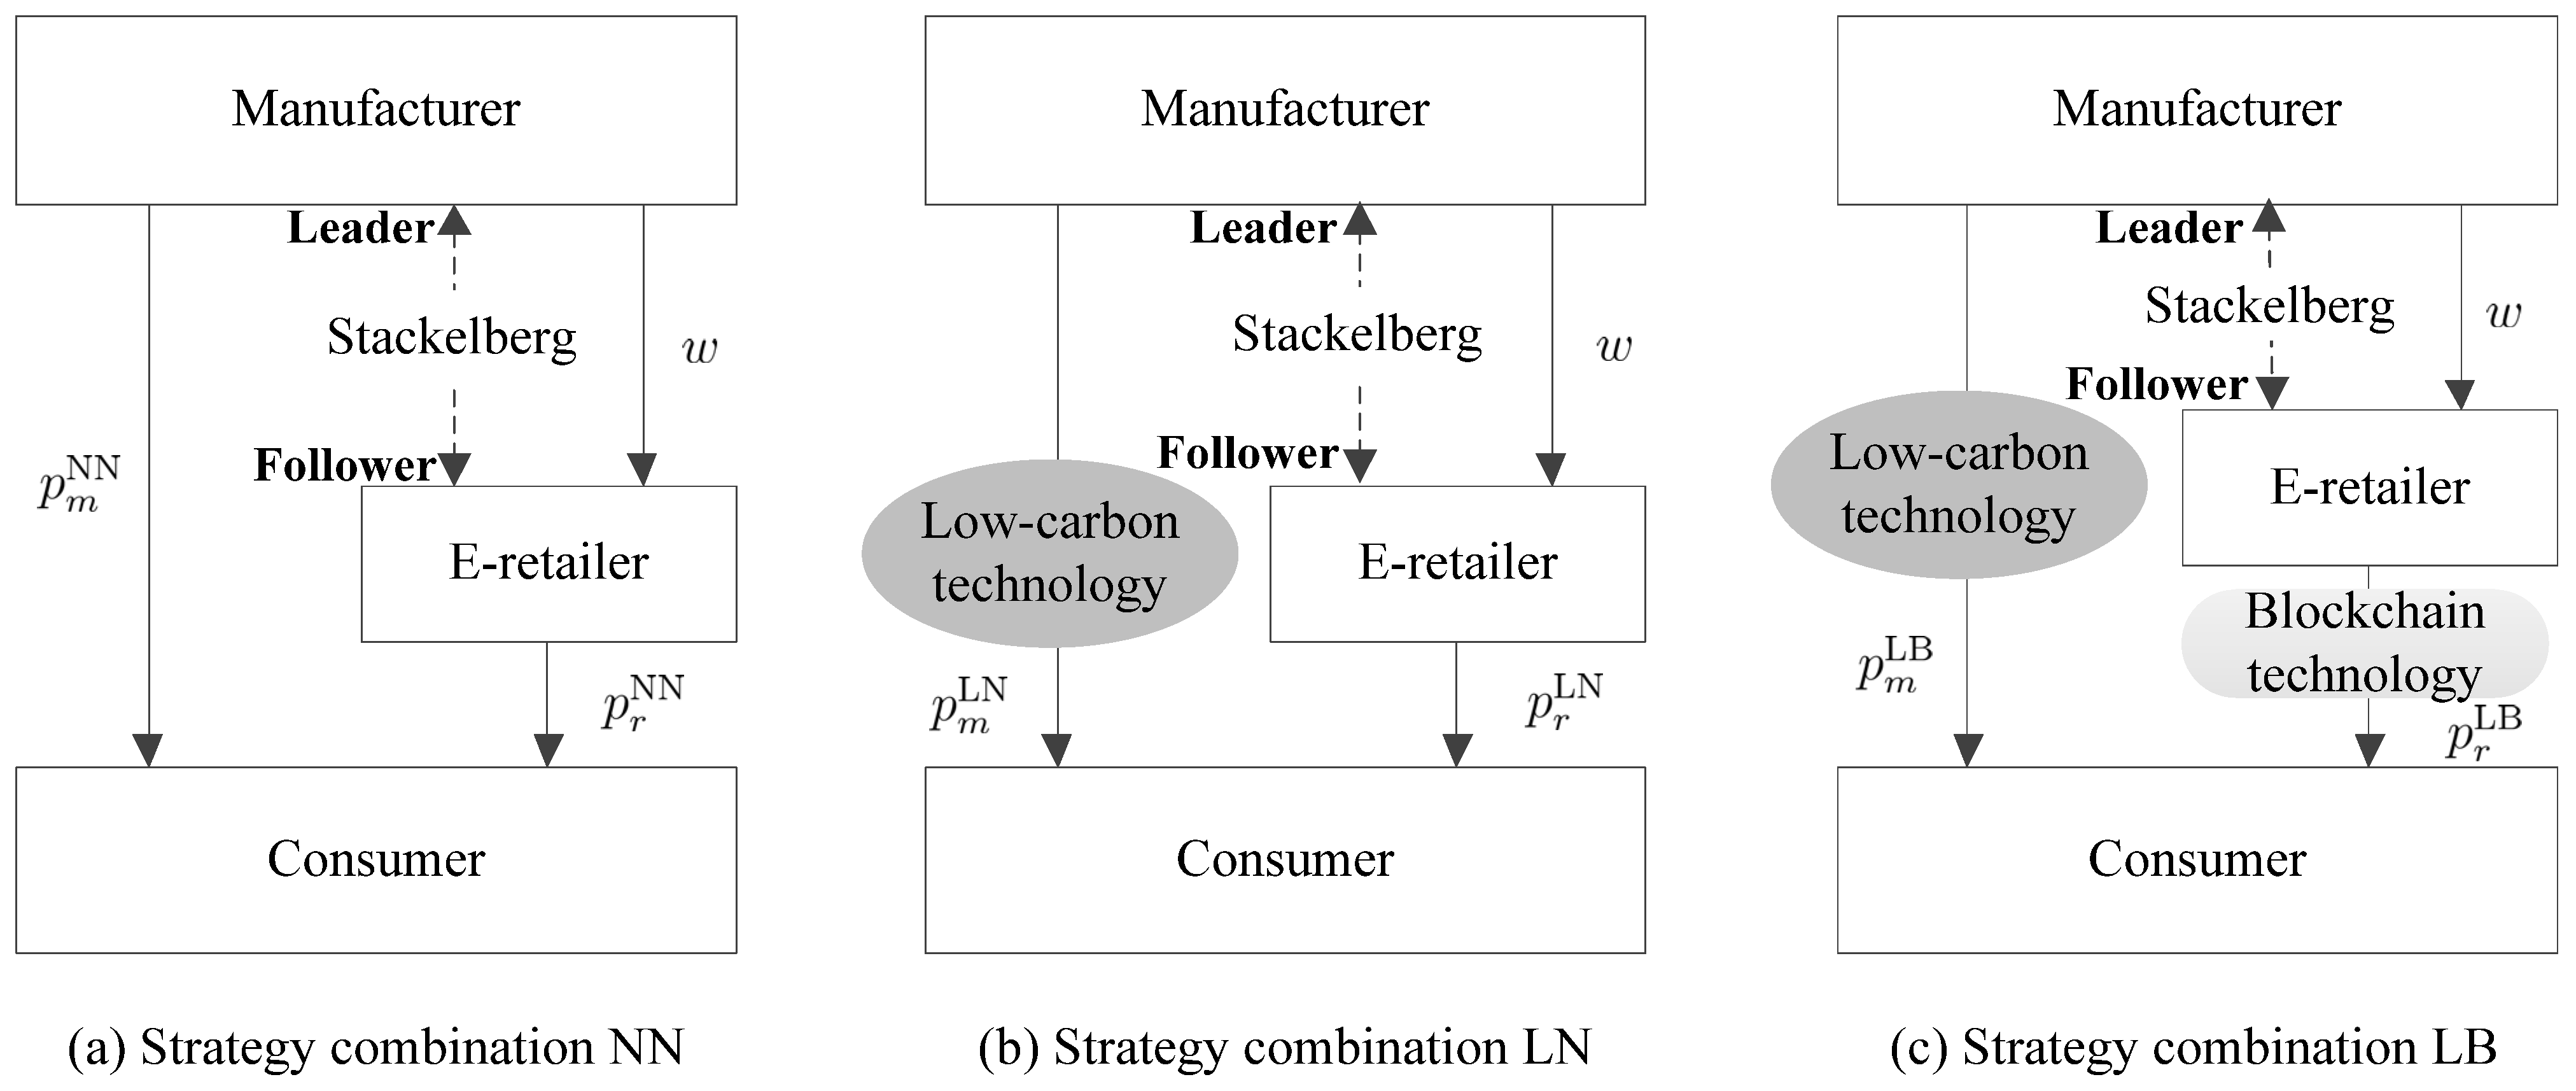
Furthermore, consider the following three strategy combinations between the manufacturer and the e-retailer: (1) neither the manufacturer nor the e-retailer adopts any technology, denoted as NN; (2) the manufacturer adopts low-carbon technology, while the e-retailer does not use blockchain technology, denoted as LN; (3) the manufacturer adopts low-carbon technology, and the e-retailer introduces blockchain technology, denoted as LB. Specifically, the supply chain structures and the above strategy combinations are shown in
Figure 1.
The profit maximization models under the strategy combinations NN, LN, and LB are developed to determine the manufacturer’s pricing and green level decisions, along with the e-retailer’s pricing decision. Furthermore, these strategy combinations are comparatively analyzed to examine the impacts of key factors such as the blockchain cost, market share, consumer green trust coefficient, consumers’ low-carbon preference, and competition intensity of price on supply chain members’ strategies, and to derive managerial insights for sustainable operations. The related parameters are summarized in
Table 2.
In the notations, the subscript for , is used to indicate the manufacturer and the e-retailer and also represent the direct sales channel and retail channel, respectively. Furthermore, the superscript represents the strategy combination, for .
4. Model Formulation and Equilibrium Decisions
This section begins by stating the key assumptions underlying the model. (1) The supply chain consists of a manufacturer and an e-retailer, where the manufacturer sells products both through a direct online channel and via the e-retailer. (2) Consumers are heterogeneous in their preferences and show varying degrees of sensitivity to price, product greenness, and blockchain-based information transparency. (3) The manufacturer can choose whether to invest in low-carbon technologies, which affects the product’s green level and production cost. (4) The e-retailer decides whether to adopt blockchain technology to enhance consumer trust in product information. (5) Demand in each channel depends on retail prices, product green level (if any), blockchain adoption, and channel market share. (6) The manufacturer acts as the Stackelberg leader and moves first, making decisions on direct sales price and green level (if any), followed by the e-retailer who sets the retail price. These assumptions form the foundation of the strategic interactions modeled under the NN, LN, and LB strategy combinations.
4.1. The Strategy Combination NN
The strategy combination NN is first considered as the benchmark case, where the manufacturer does not engage in green investment, i.e., does not adopt low-carbon technology, and the e-retailer does not implement blockchain technology. The results under the other two strategy combinations are compared against this baseline to examine the impacts of green investment and blockchain adoption. The strategy combination NN as a benchmark is first considered where the e-retailer does not adopt blockchain and the manufacturer does not adopt low-carbon technology. The results of the other two strategy combinations are compared with those of the benchmark. Under the strategy combination NN, the manufacturer decides firstly
, and the e-retailer then decides
. Based on the linear demand structure and the problem description in
Section 3, the demand functions for different channels under the strategy combination NN are defined in the following. The linear demand structure is consistent with prior studies such as Chen et al. (2023), Zhu et al. (2024), and Gu et al. (2025) [
1,
4,
7], and thus provides a rational and well-established basis for analysis.
where
,
. The market is monopolized by the direct sales channel if
, and by the retail channel if
. When
approaches 0, the intensity of competition among the channels becomes negligible; conversely, as
approaches 1, inter-channel competition escalates to a highly aggressive level.
Therefore, the profit functions of supply chain members can be described as
Based on the profit expressions in (3) and (4), the Stackelberg game model under the NN strategy configuration is formulated as shown in (5).
The above optimization model (5) is resolved using a backward induction approach, the equilibrium decisions under the strategy combination NN are then obtained and are stated in Proposition 1.
Proposition 1. When the e-retailer does not adopt blockchain and the manufacturer does not adopt low-carbon technology, the two supply chain members equilibrium decisions are and .
Corollary 1. Under the strategy combination NN, the impacts of the market share of the direct sales channel on the equilibrium decisions: (1) ; (2) .
Corollary 1 shows that the direct sales and retail prices rise with an increase in the market share of the direct sales channel. A higher implies that the manufacturer has more potential consumers. When is higher, the manufacturer tends to adopt a high direct selling price to maximize profits. However, with a smaller market share, the e-retailer faces a greater risk of incurring losses, prompting the e-retailer to set high retail prices as a precautionary measure.
4.2. The Strategy Combination LN
This study defines the green level of the product as a proxy for its carbon reduction performance, which is determined by the manufacturer’s investment in low-carbon technologies. This green level not only increases production costs but also enhances the product’s environmental value, thereby influencing consumer demand and willingness to pay. Under the strategy combination LN, the e-retailer does not adopt blockchain and the manufacturer adopts low-carbon technology. The decision process under the LN strategy begins with the manufacturer determining the direct sales price
and the green level of low-carbon products
. Subsequently, the e-retailer sets the retail price
. Given the linear demand framework and the contextual setup in
Section 3, the corresponding demand functions for each channel under strategy LN are specified below.
where
is consumers’ low-carbon preference,
(
) is consumer green trust coefficient. A larger
indicates the more demand the low-carbon products can attract. A larger
indicates that consumers trust the e-retailer’s products more. To avoid trivial or degenerate results and to ensure that the profit function remains concave in the decision variables, this work assumes that
, which guarantees the existence of a unique and interior optimal solution.
Accordingly, the profit functions of the manufacturer and the e-retailer under the LN strategy combination can be formulated as follows. This functional form reflects that as the manufacturer increases the green level, the incremental cost rises at an increasing rate, consistent with findings in related studies such as Liu and Ma (2022) and Huang et al. (2020) [
2,
33].
Utilizing the profit functions defined in (8) and (9), the Stackelberg game model corresponding to the LN strategy combination is presented in (10).
The above optimization model (10) is resolved using a backward induction approach, the equilibrium decisions under the strategy combination LN are then obtained and are stated in Proposition 2.
Proposition 2. When the e-retailer does not adopt blockchain and the manufacturer adopts low-carbon technology, the two supply chain members equilibrium decisions are , , and .
Corollary 2. Under the strategy combination LN, the impacts of the market share of the direct sales channel on the equilibrium decisions: (1) ; (2) ; (3) if , and otherwise.
From Corollary 2, the direct sales price and the green level both increase as the market share of the direct sales channel increases. In addition, the relationship between the retail price and is dependent on . As increases, the retail price decreases if is smaller than the threshold, and increases if is larger than this threshold. When the manufacturer has a larger market share in the direct sales channel, a higher green level of products can enhance brand image and meet consumer demand of environmental sustainability, improving market competitiveness. However, a higher level of products leads to an increase in investment cost, and thus, the manufacturer tends to choose high prices in the direct sales channel. The e-retailer uses price strategies different from that of the manufacture to compete for dominance when market share is limited. The e-retailer uses a low-price strategy to attract more consumers with a lower preference for green products and uses a high-price strategy to attain greater profitability when consumers are loyal supporters of green products.
Corollary 3. Under the strategy combination LN, the impacts of the consumers’ low-carbon preference on the equilibrium decisions: (1) ; (2) ; (3) .
From Corollary 3, the direct sales price, product green level and retail price all increase as increases. For consumers with high low-carbon preferences, the manufacturer increases the product greenness to meet consumer demand, enhances product appeal, and increases sales and market share, strengthening brand image. A high product greenness requires a higher cost investment, leading to a higher direct sales price. Thus, the e-retailer adopts a high-price strategy in line with the manufacturer.
4.3. The Strategy Combination LB
Under the strategy combination LB, the e-retailer adopts blockchain and the manufacturer adopts low-carbon technology. In the LB strategy scenario, the e-retailer implements blockchain technology to disclose low-carbon product information on the retail channel. This technology ensures real-time interaction, transparency, immutability, and open access to information, thereby enhancing the accuracy with which consumers obtain low-carbon product details. As a result, consumer trust in the green level of products within the retail channel is fully established, reflected by
. In this setting, the manufacturer first determines the direct sales price
and the green level
, followed by the e-retailer setting the retail price
. Therefore, the demand functions for different channels under the strategy combination LB are defined in the following.
Therefore, the profit functions for both the manufacturer and the e-retailer under the LB strategy combination can be expressed as follows.
In (14), the blockchain cost
is assumed to be a fixed cost incurred by the e-retailer upon choosing to implement blockchain technology. This reflects the nature of blockchain adoption as an infrastructure-level investment, which includes costs related to system development, maintenance, and verification, and does not vary with the number of units sold. Such a fixed-cost formulation is consistent with prior studies [
1,
4,
8], where blockchain is treated as a technological commitment rather than a per-unit cost. This assumption simplifies the analysis while capturing the strategic trade-off associated with technology adoption.
Based on the profit functions provided in (13) and (14), the Stackelberg game model under the LB strategy combination is formulated in (15).
The above optimization model (15) is resolved using a backward induction approach, the equilibrium decisions under the strategy combination LB are then obtained and are stated in Proposition 3.
Proposition 3. When the e-retailer adopts blockchain and the manufacturer adopts low-carbon technology, the two supply chain members equilibrium decisions are , , and .
Corollary 4. Under the strategy combination LB, the impacts of the market share of the direct sales channel on the equilibrium decisions are as follows: (1) ; (2) ; (3) if , and otherwise.
Corollary 4 shows that under the strategy combination LB, the direct sales price and the green level both increase as increases. The relationship between the retail price and is determined by consumer low-carbon preference. As increases, the retail price decreases if is smaller than the threshold, and increases otherwise. Blockchain adoption of the e-retailer enhances the transparency of product information. In a large market, the manufacturer enhances the greenness of products to leverage this transparency, thereby attracting more consumers and strengthening brand value. A higher product greenness leads to a high manufacturing cost. Thus, the manufacturer uses a high-price strategy on the direct sales channel to cover the additional costs and maintain profit margins. Moreover, blockchain adoption requires more costs of the e-retailer. Thus, the e-retailer with small market shares uses a low-price strategy to incentivize potential consumers with low-carbon preferences. However, consumers with a high low-carbon preference are likely to exhibit a greater willingness to pay a premium for high product greenness. Thus, the e-retailer uses premium pricing strategy to appeal to consumers with strong preferences for low-carbon products, covering blockchain adoption costs.
Corollary 5. Under the strategy combination LB, the impacts of the consumers’ low-carbon preference on the equilibrium decisions are (1) ; (2) ; (3) .
Corollary 5 shows that under the strategy combination LB, the prices and green level all increase, as increases. A high induces the manufacturer to improve the product environmental friendliness to draw in a larger consumer base. The high cost of increasing greenness of products leads to a high direct sales price. In addition, the e-retailer enhances prices to recover additional costs of blockchain adoption.
5. Equilibrium Analyses and Comparisons
In this section, to examine the effects of the blockchain and low-carbon technology on the optimal decisions, the equilibrium decisions for the two members under different strategy combinations are compared and analyzed.
Proposition 4. The equilibrium price decisions under the strategy combinations NN and LN satisfy
- (1)
;
- (2)
.
From Proposition 4, both the direct sales price and the retail price under strategy LN are higher than those under strategy NN. This outcome reflects not only increased production and procurement costs due to the manufacturer’s adoption of low-carbon technology, but also the strategic motivations of both supply chain members. The manufacturer adopts low-carbon technology as a proactive strategy to differentiate its products in a market with rising environmental awareness, to enhance brand image, and to comply with long-term sustainability goals. The added environmental value justifies a higher price in the direct channel, allowing the manufacturer to recover green investment costs while appealing to eco-conscious consumers. Simultaneously, the e-retailer faces higher wholesale prices but benefits from increased consumer willingness to pay for green products. To sustain profitability and align with the perceived value of green products, the e-retailer sets a higher retail price. Thus, the pricing decisions under LN are driven by both cost pass-through and the shared incentive to signal product sustainability and capture value from green market segments.
Proposition 5. The equilibrium pricing decisions under strategy combinations NN and LB satisfy
- (1)
;
- (2)
.
From Proposition 5, both the direct sales price and the retail price under the strategy combination LB are higher than those under the strategy combination NN. The manufacturer adopts low-carbon technology not only to meet regulatory or environmental targets but also as a proactive differentiation strategy to appeal to consumers with strong sustainability preferences, enhance brand reputation, and capture premium market segments. The e-retailer, in turn, implements blockchain technology to strengthen consumer trust in the authenticity of green claims by enhancing transparency and traceability. Blockchain adoption reduces information asymmetry and increases consumers’ perceived value of low-carbon products, leading to stronger purchase intent and greater price acceptance. Together, these strategic moves create a synergistic effect, i.e., allowing both parties to charge higher prices and extract greater value from environmentally conscious consumers. Thus, the pricing decisions under strategy LB stem from both cost recovery and deliberate efforts to reinforce competitive positioning through sustainable and trustworthy supply chain practices.
Proposition 6. The equilibrium decisions under the strategy combinations LN and LB satisfy
- (1)
if , and
otherwise;
- (2)
if , and otherwise;
- (3)
if , and otherwise.
From Proposition 6, the equilibrium prices and the green level decisions under the strategy combination LB are not always higher than those under the strategy combination LN. This variation highlights the strategic motivations and conditional incentives driving technology adoption. When the wholesale price exceeds the threshold, the manufacturer benefits more from selling through the e-retailer, which encourages it to raise the product’s green level to meet the demand for sustainable products. In this case, the e-retailer’s adoption of blockchain strengthens consumer trust, thus incentivizing the manufacturer to set higher prices, reflecting enhanced product value. Conversely, when the wholesale price is low, the manufacturer’s margin from e-retailer sales shrinks, diminishing its incentive to maintain a high green level. If consumer preference for low-carbon products is weak, the manufacturer may strategically reduce green investment to lower production costs. Similarly, the e-retailer balances the benefits of blockchain-enabled transparency with its increased operational costs. It raises prices only when the enhanced green attributes justify consumer willingness to pay. Therefore, the adoption of blockchain motivates green investment and premium pricing only under favorable market and cost conditions, reflecting the nuanced strategic interplay between investment incentives, consumer behavior, and channel economics.
6. Numerical Studies
Numerical analyses are performed to investigate the effects of , , , and on the supply chain members’ profits, offering managerial insights into strategic decisions. Data from a fashion product retailer in Shenyang, China, is used to demonstrate the applicability of the proposed models. However, due to business confidentiality, the true market data are not used, but instead, reasonable values are assigned to the associated parameters for the computational experiments. The parameter values used in the numerical analysis are summarized as follows. The market potential represents the maximum potential demand under ideal conditions, and the market share of the direct sales channel . The competition intensity of price reflects moderate substitutability between the two channels. The wholesale price . The blockchain cost . The green trust coefficient of consumer , and the low-carbon preference of consumer . All parameters are dimensionless or normalized for the purpose of comparative and sensitivity analysis. Unless otherwise specified, the parameter values used in the experiments are set as the default for the analysis.
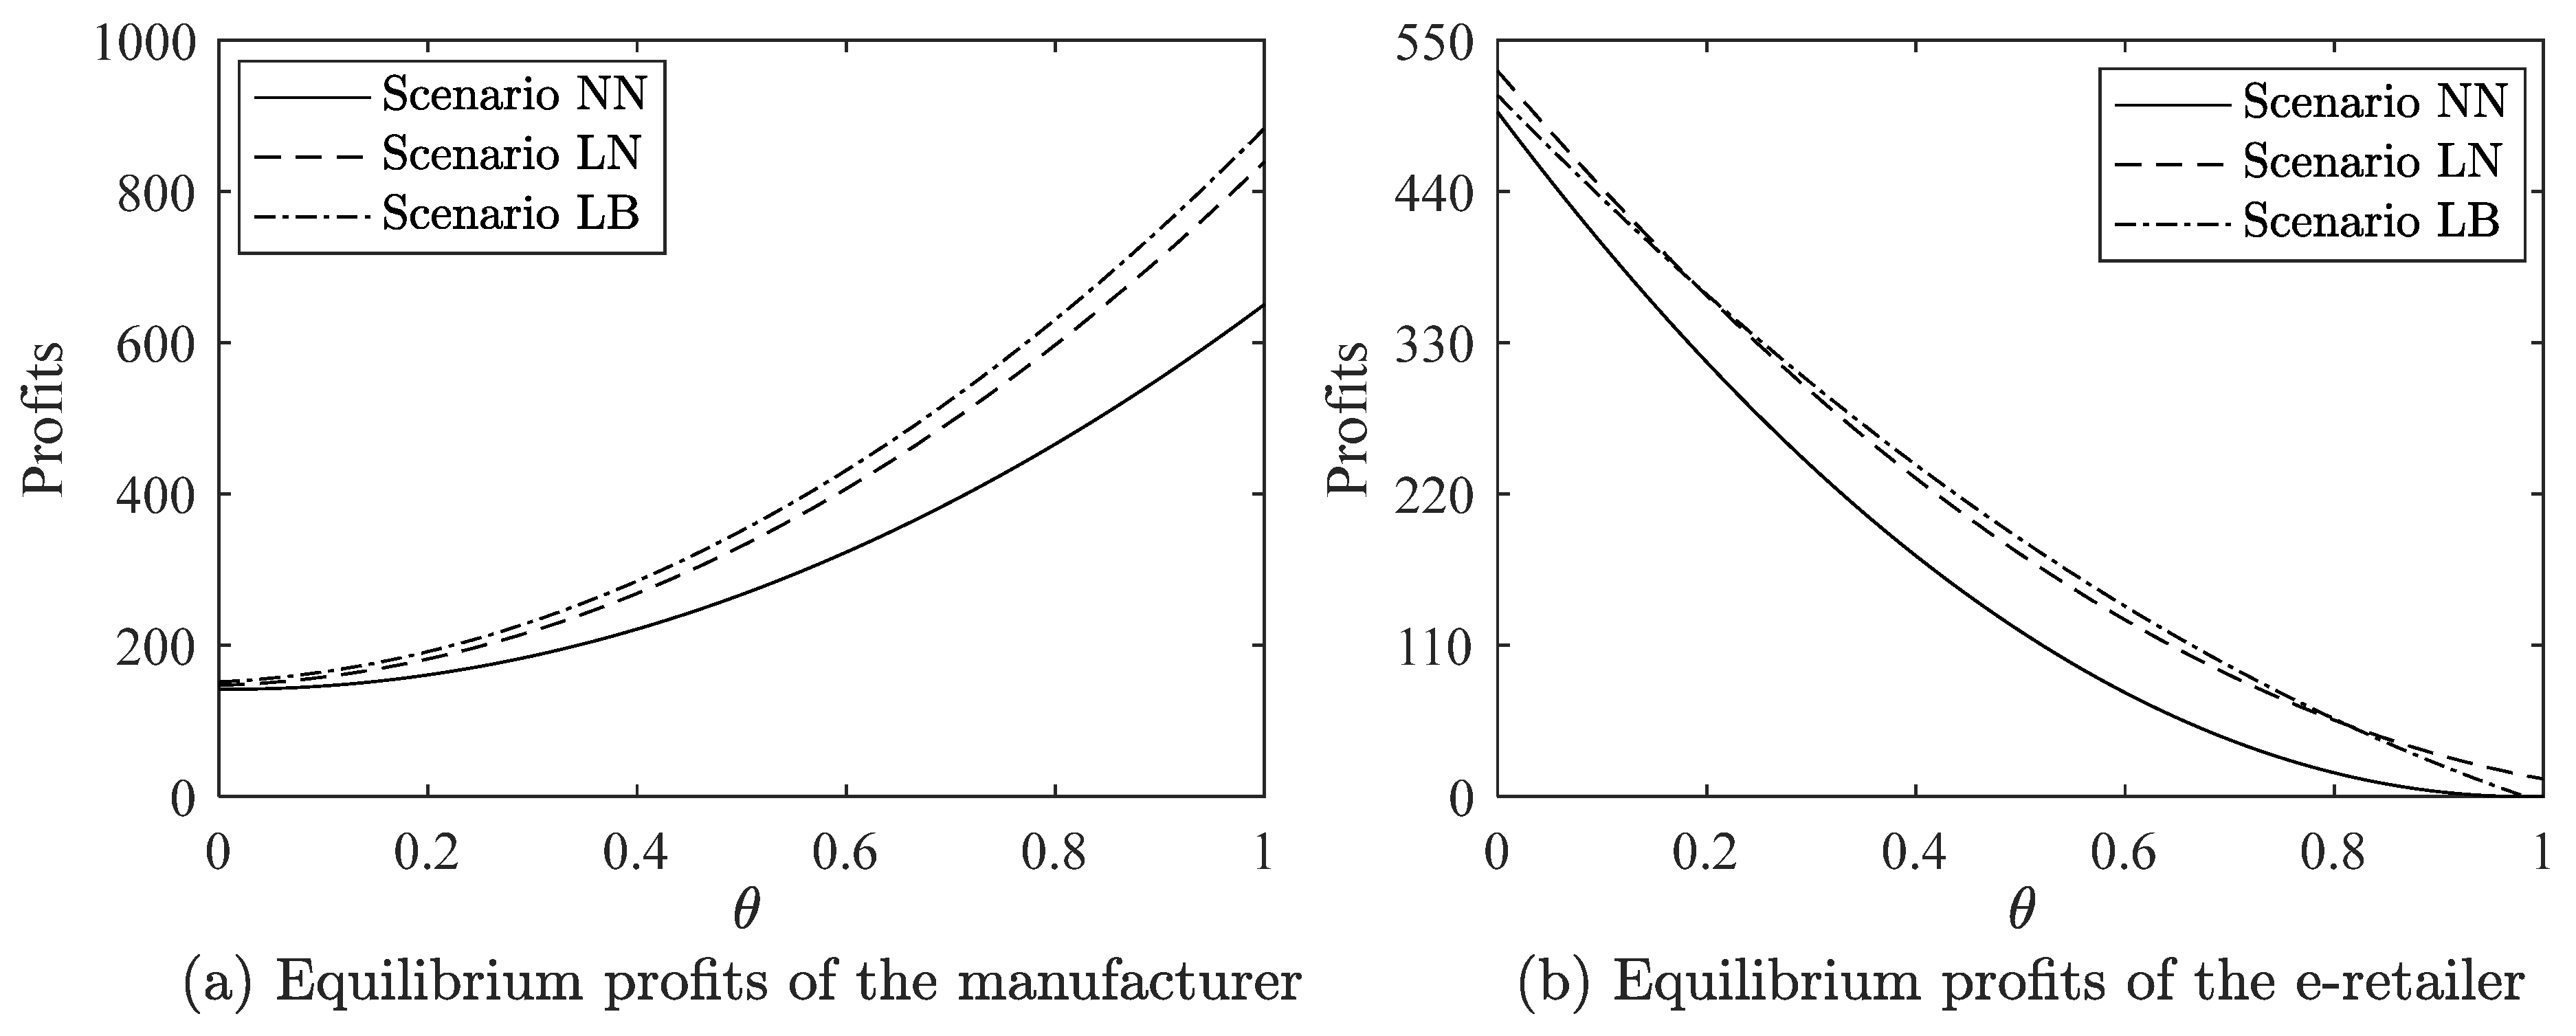
6.1. The Effects of on the Equilibrium Profits
The effects of
on the supply chain members’ profits under the strategy combinations NN, LN, and LB are examined when the value of
varies from 0 to 1 in increments of 0.01. The results are plotted in
Figure 2. A larger value of
means that more consumers prefer the manufacturer’s online channel. As shown in
Figure 2, the profits of the manufacturer and the e-retailer are always lowest under the NN strategy combination. The manufacturer’s profit is positively correlated with the value of
, whereas the e-retailer’s profit exhibits a negative correlation with
.
As shown in
Figure 2a, the manufacturer’s profit under the strategy combination LB is higher than that under the strategy combination LN, regardless of its market share.
Figure 2b illustrates that when the manufacturer adopts the green investment strategy, the e-retailer can achieve the highest profit without adopting blockchain technology if its market share is relatively high (e.g.,
). However, as the e-retailer’s market share decreases, adopting blockchain technology becomes an effective strategy to attract consumers. When e-retailer’s market share is extremely low (e.g.,
), it abandons blockchain technology to control operational costs. In addition, as can be seen from
Figure 2, when
is in the interval [0.19, 0.81], the strategy combination LB can achieve a win-win for both the manufacturer and the e-retailer.
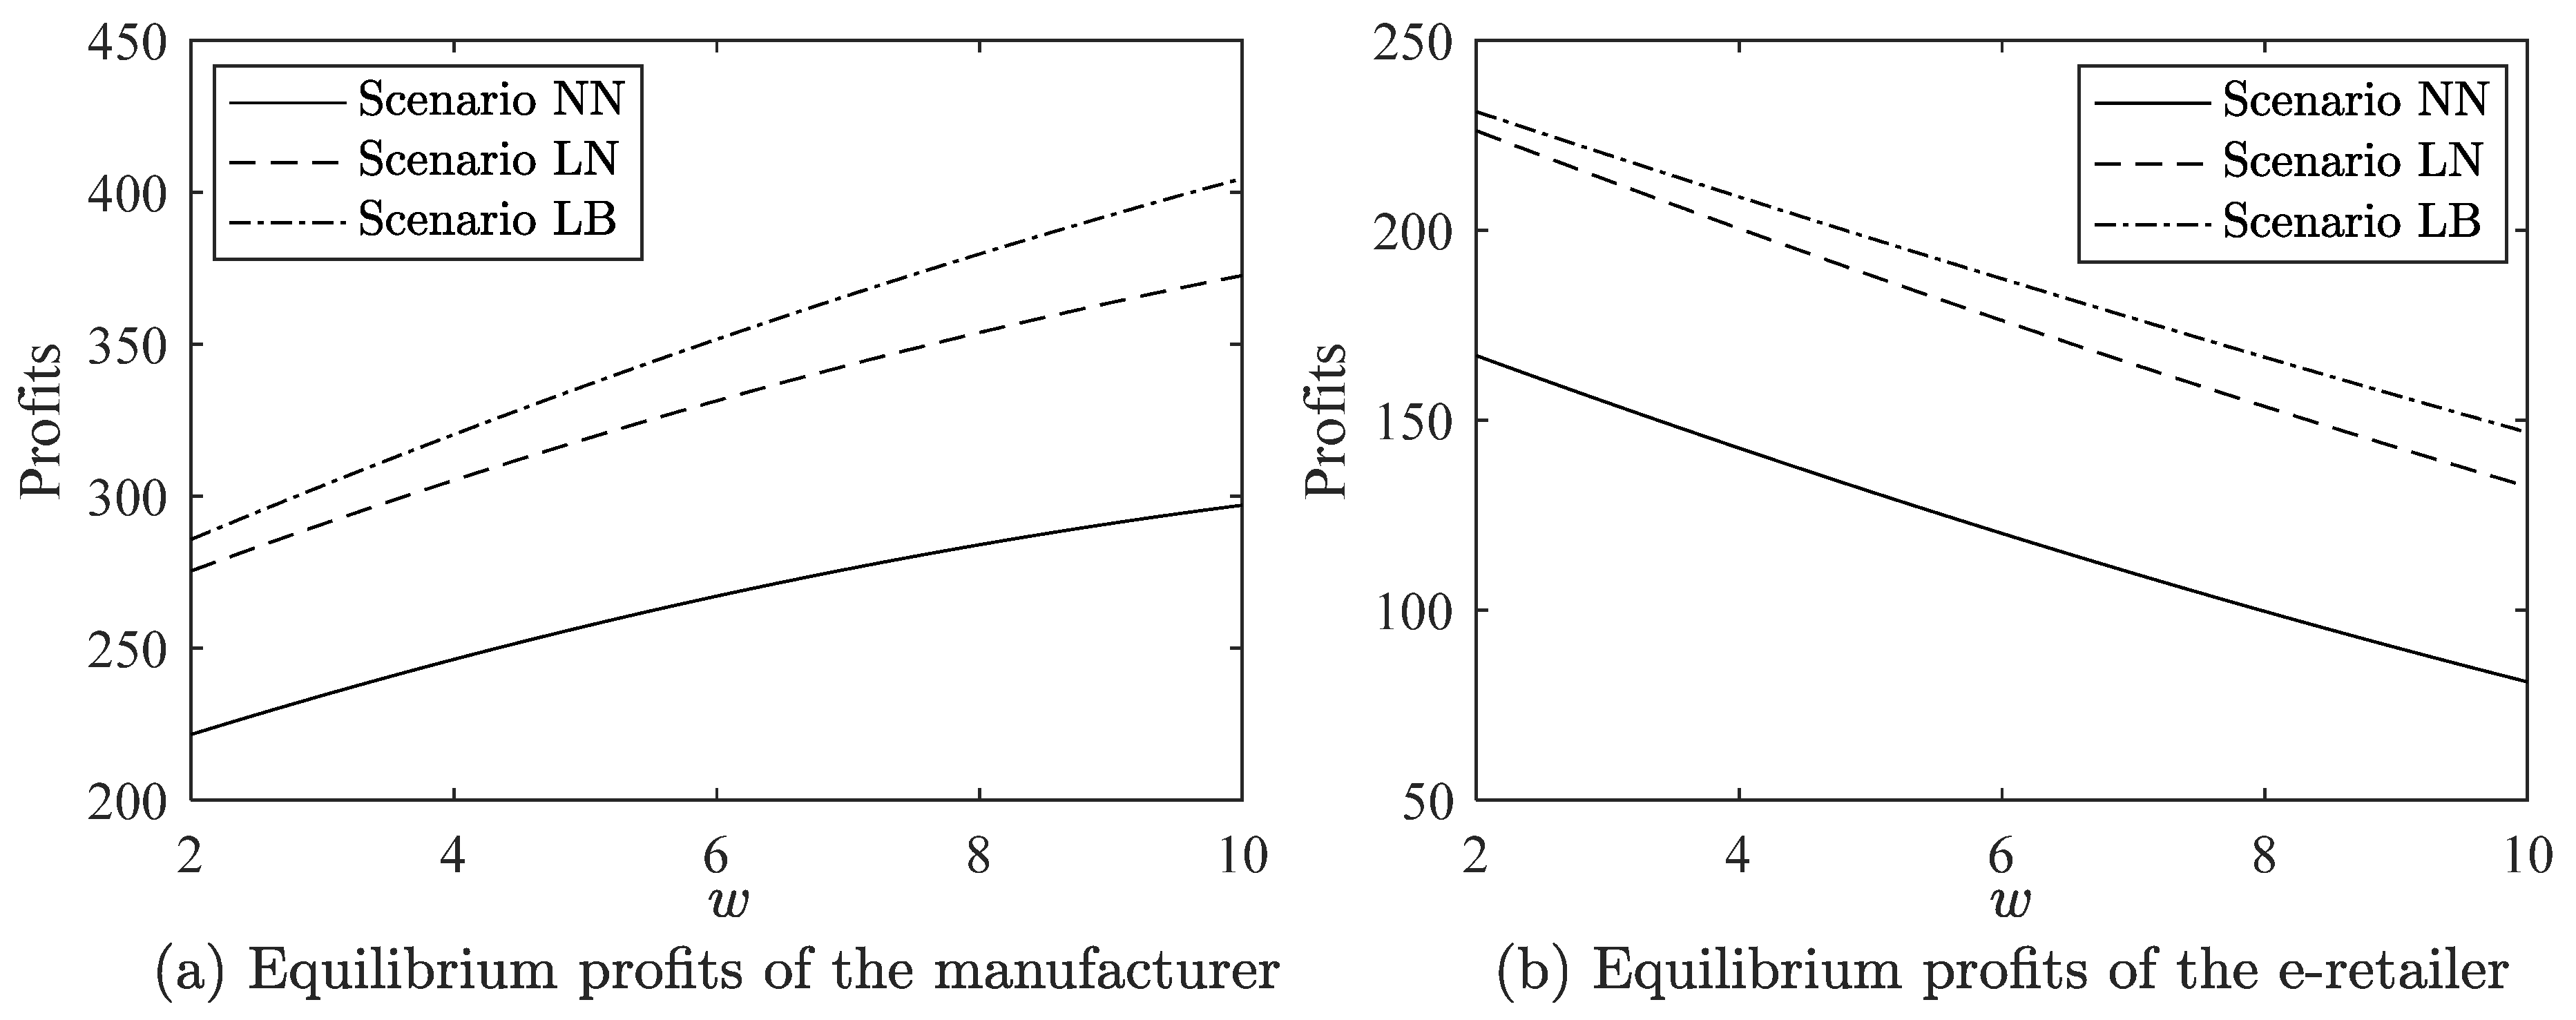
6.2. The Effects of on the Equilibrium Profits
To examine the effects of
on the supply chain members’ profits under the strategy combinations NN, LN, and LB,
is set to vary from 2 to 10 in increments of 0.01. The results are plotted in
Figure 3. The results in
Figure 3 show that the manufacturer’s profit increases as the wholesale price increases, while the e-retailer’s profit shows the opposite trend, indicating that a higher wholesale price compresses the e-retailer’s profit margin. In addition, it is always optimal for the manufacturer to implement green investment strategy and for the e-retailer to adopt blockchain technology, regardless of changes in the wholesale price. The results show that supply chain collaborative innovation (the combination of green investment strategy and blockchain technology) can, to a certain extent, mitigate gaming antagonisms triggered by wholesale price changes and improve supply chain member’s profitability.
6.3. The Effects of on the Equilibrium Profits
The effects of
on the profits for the manufacturer and e-retailer under the strategy combinations NN, LN, and LB are explored by setting
to vary from 0 to 1 in increments of 0.01. The results are plotted in
Figure 4. A higher value of
indicates greater consumer trust in green attributes of products sold by the e-retailer. Therefore, even if the e-retailer does not adopt blockchain technology, its profit increases with the value of
, and the manufacturer’s profit increases accordingly. When the manufacturer invests in green production and the e-retailer adopts blockchain technology, the consumer trust level regarding the e-retailer’s product greenness has no impact on the supply chain members’ profitability. In addition, as illustrated in
Figure 4, the strategy combination LB is optimal for both parties when
is below 0.59. In particular, the e-retailer should abandon blockchain technology when
becomes higher.
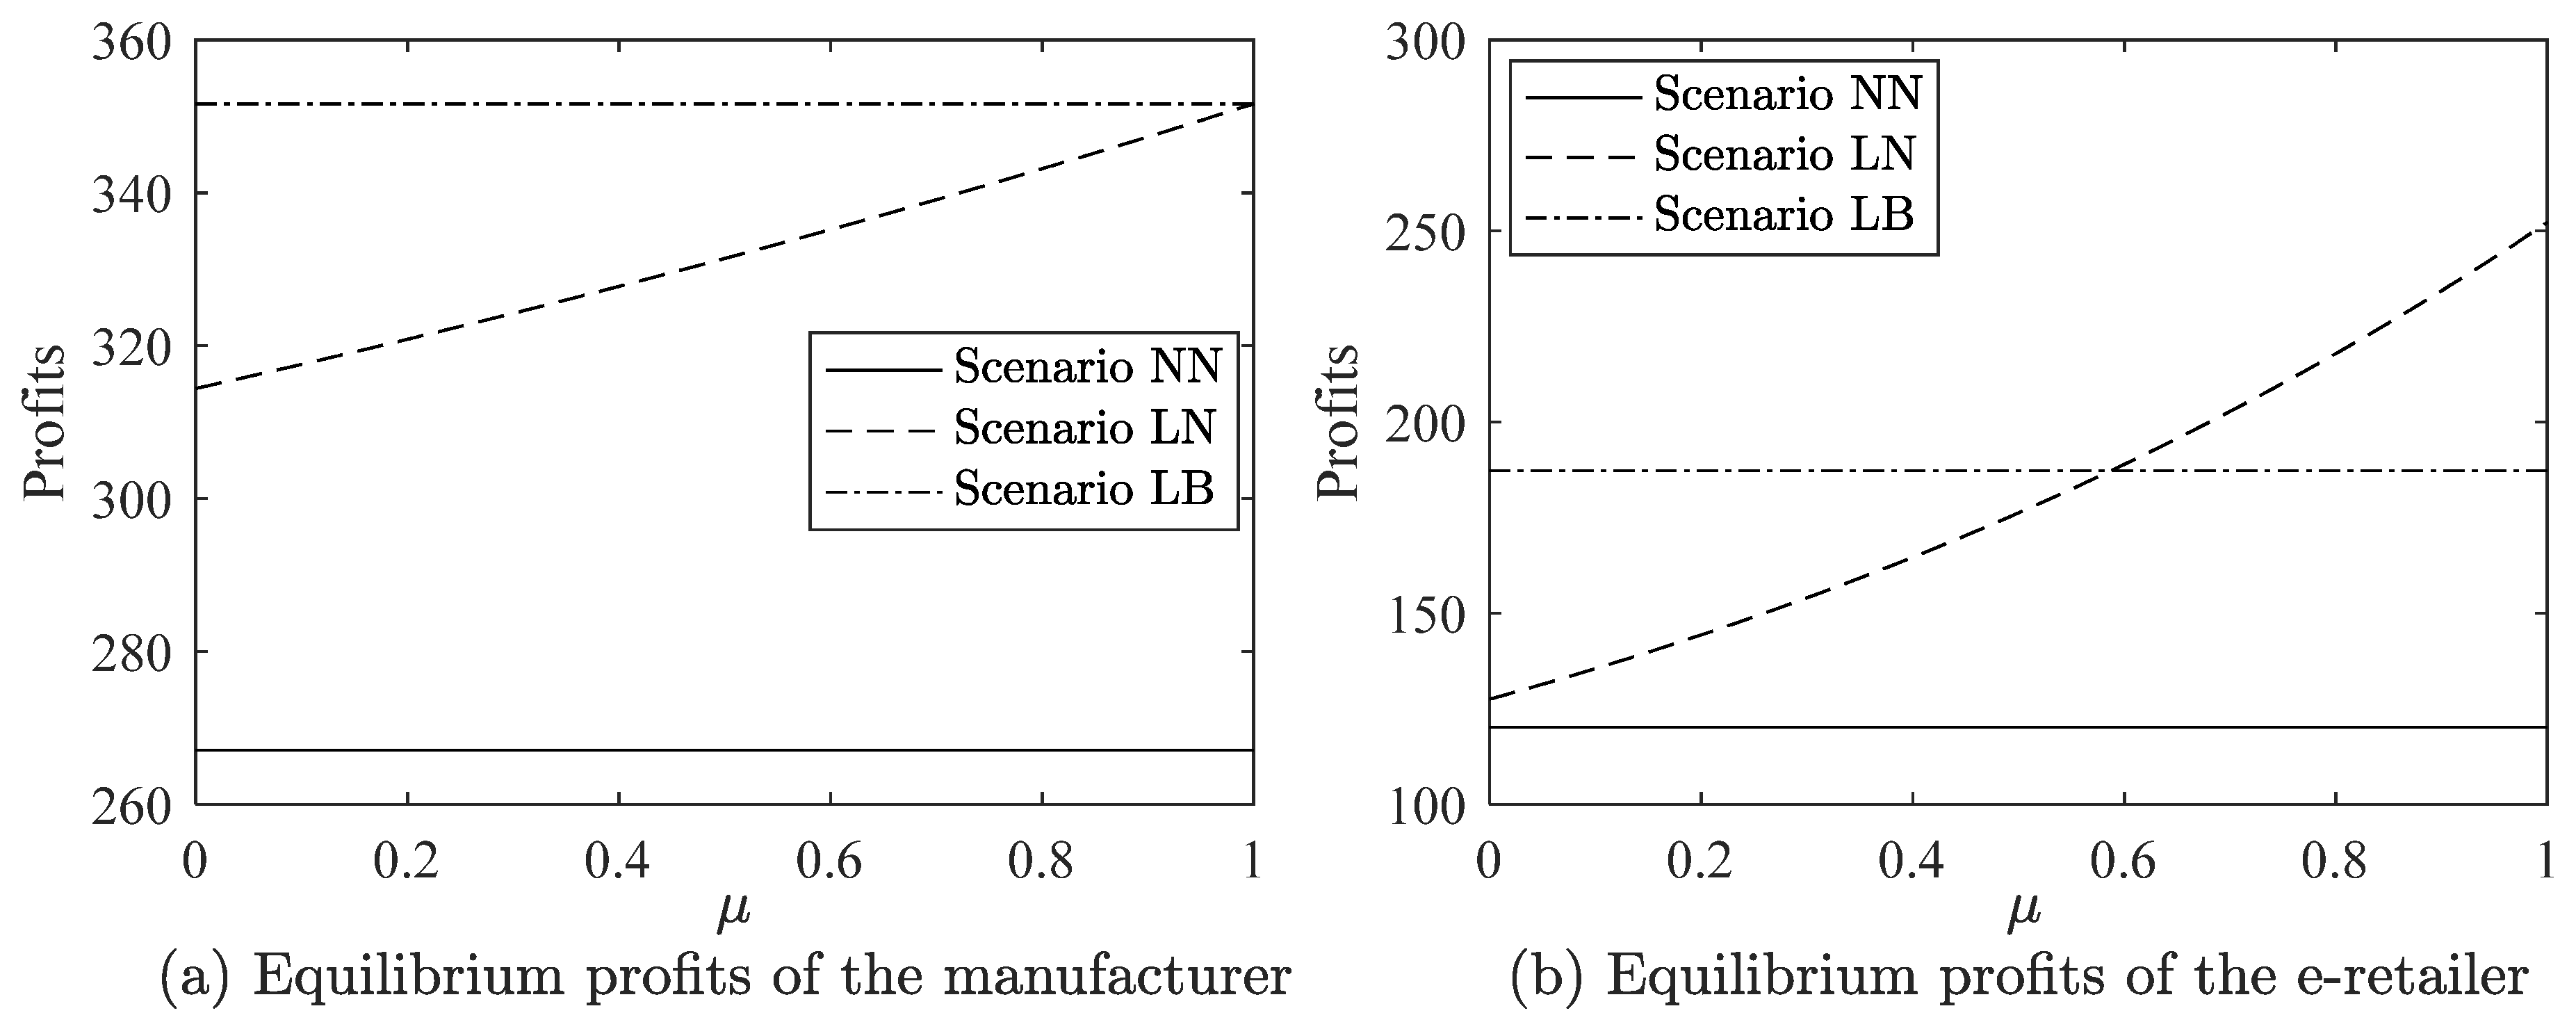
6.4. The Effects of on the Equilibrium Profits
The effects of
on the supply chain members’ profits under the strategy combinations NN, LN, and LB are examined when the value of
varies from 0 to 1 in increments of 0.01. The results are shown in
Figure 5. The larger the value of
, the higher the degree of consumers’ low-carbon preference. As shown in
Figure 5, when the value of
is small (e.g.,
), the strategy combination NN is optimal for the supply chain members. As
increases, the manufacturer becomes more motivated to invest in green production, thereby achieving higher profit. When the consumers’ low-carbon preference is at a low to medium level, the e-retailer can still achieve the highest profit without adopting blockchain technology. However, when this preference becomes strong, adopting blockchain technology is not only the best choice for the e-retailer, but also beneficial for the manufacturer. When
exceeds a certain threshold (0.57), the strategy combination LB leads to a win–win outcome for both manufacturer and e-retailer.
7. Conclusions
This study investigates the feasibility of the supplier investing in green investment strategies and the retailer investing in blockchain technology. To analyze the strategic interactions, Stackelberg game models are developed under the strategy combinations NN, LN, and LB. Existing research primarily examines the adoption of blockchain technology from the perspective of blockchain operation and construction costs, as well as firm-specific characteristics [
4,
7]. Gu et al. (2025) focused on manufacturers undergoing a low-carbon transition, producing both low-carbon and ordinary products, arguing that blockchain implementation benefits both manufacturers and retailers when the associated cost remains below a certain threshold [
4]. Zhu et al. (2024) considered two categories of firms, superior brand firms and inferior brand firms [
7]. They found that blockchain adoption benefits superior brand firms when research and development (R&D) difficulty is low and consumer trust in low-carbon products is high, or when R&D difficulty is high but consumers’ low carbon preferences and brand awareness are high. For inferior brands, blockchain enhances profits when R&D difficulty is low with high consumer trust, or when R&D difficulty is high but brand awareness is weak. In contrast to these studies, this work is among the first to investigate the interaction between blockchain technology and low-carbon transition strategies. This work finds that neither green investment nor blockchain adoption is universally optimal for supply chain members. Instead, their effectiveness is jointly influenced by consumers’ low-carbon preferences, consumer trust in the green attributes of products, and the market shares of supply chain members. Specifically, this work presents two key findings that differ from the existing literature. First, the strategy combination LB yields optimal profits for both supply chain members when consumer trust in green attributes is below or slightly above a moderate level. Second, when the manufacturer adopts a green investment strategy, the e-retailer should refrain from implementing blockchain technology if its market share is either very high or very low. In this section, research findings, managerial insights, and future research are summarized.
7.1. Research Findings
The main findings of this work are summarized in the following.
- (1)
When the manufacturer adopts the green investment strategy, the e-retailer achieves maximum profit without using blockchain technology if it holds a substantial or very low market share. Conversely, the e-retailer obtains the highest profit with blockchain technology if it has a moderate market share.
- (2)
The wholesale price has no effect on the optimal strategy combination.
- (3)
Under the strategy combination LN, the greater the consumers’ trust in the green attributes of products sold through the e-retailer, the more beneficial it is for the supply chain members. The strategy combination LB yields optimal profits for both supply chain members when the consumer green trust coefficient is below or slightly above the moderate level. The e-retailer obtains the highest profit without blockchain technology if the consumer green trust coefficient is high.
- (4)
When consumers’ low-carbon preference is weak, the supply chain members obtain the highest profit with the strategy combination NN. As this preference strengthens, the manufacturer obtains higher profit if it conducts the green investment. When the consumers’ low-carbon preference is at a low to medium level, the e-retailer can still obtain the highest profit without adopting blockchain technology when the manufacturer conducts the green investment. When consumers exhibit a high level of low-carbon preference, the strategy combination LB leads to the highest profits for both parties.
- (5)
Under the strategy combinations LN and LB, the selling prices and the product green levels increase as consumers’ low-carbon preference increases. When the wholesale price is high, the selling prices and product green levels under strategy combination LB are higher than those under strategy combination LN. Among all strategy combinations, the selling prices under strategy NN are the lowest.
7.2. Managerial Insights
Managerial insights are summarized as follows.
- (1)
The manufacturer should adopt the green investment strategy, and the e-retailer should adopt the blockchain technology if the consumer green trust coefficient is below, moderate, or slightly above the moderate level, if the market share of a channel is neither extremely high nor low, or if consumers exhibit a high level of low-carbon preference.
- (2)
When consumer low-carbon preference is weak, the strategy combination NN is optimal for the supply chain members.
- (3)
Under the technology combination LN, the e-retailer should take measures such as providing third-party certifications and offering detailed product environmental information to increase the consumers’ green trust, thus increasing its own and the manufacturer’s profits.
- (4)
When the manufacturer conducts a green investment strategy, the e-retailer should refrain from using blockchain technology if its market share is either very high or very low, if consumers highly trust the green attributes of products sold through the e-retailer, or if the consumers’ low-carbon preference is at a low to medium level.
- (5)
When the manufacturer conducts green investment, the supply chain members should take measures to strengthen consumer low-carbon preference.
7.3. Future Research
Future research may explore carbon emissions policies such as limited total carbon emissions, carbon taxation, and cap-and-trade, while integrating all three dimensions of sustainability (economic, environmental, and social) into supply chain management. It is also worthwhile to explore the design of uncertain supply chain networks, and to explore appropriate approaches for coping with uncertainties. Effective inventory management is a challenging future task and deserves further investigation. Another promising research direction is to discuss whether the supply chain members should provide carbon credit to consumers. In addition, it is valuable to discuss the impact of consumers’ fairness concerns on the decisions of supply chain participants. In particular, applying the developed strategies to real-world problems is a valuable research direction.


