Abstract
Between February 2024 and February 2025, 27public buildings, selected to be representative of the region, located in the Silesia region of Poland and comprising schools, offices, and cultural facilities, were equipped with advanced measuring systems that allowed the measurement of energy consumption for the purposes of heating and the powering of electrical devices. Thermal and energy data were logged in one minute intervals. After the measurement campaign, the buildings were subjected to multi-variant analysis for the possibility of generating sufficient energy on-site to cover the energy needs of the buildings. Four different photovoltaic panel technologies and three different heat sources were modeled for each building, using the real measurement data. The effects of energy storage were also evaluated. It was determined that despite the diversity of the buildings, and despite the assumption of no further thermal modernization in the buildings other than on the side of the supply, the results are generally favorable.
1. Introduction
1.1. Aims of the Study
The Silesian Voivodship of Poland consists of 167 urban and urban rural municipalities where numerous public utility buildings are located. According to Statistics Poland Local Data, public buildings in the region account for a total usable area of 1,445,944 , dominated by schools and research institutions (26,754 ), followed by sports related buildings (26,000 ), healthcare facilities (9888 ), and other buildings. Due to Poland’s location in the moderate climate zone, energy consumption in buildings is significant, both in terms of heating and the rising demand for artificial cooling. In general, buildings are considered to consume 40% of the worlds energy, resulting in a significant impact of this sector on climate change. The continued use of solid fuels for building heating is further a source of pollution by the release of particulate matter. This presents a significant potential related to the possible lessening of environmental impact along the lines of lowering the energy consumption and modernizing the energy sources. The LIFE, “Silesia, Blue Sky Restored”, aims for, among other goals, the development of know-how, tools, methods, and demonstration activities that can strengthen the implementation of the Air Protection Program and the European Green Deal [1] not only in the Silesian Voivodeship but also in neighboring cross-border regions and across Poland.
The decarbonization of the building sector is a central pillar of the European Green Deal and the Fit for 55 package, both of which set ambitious targets for achieving climate neutrality by 2050 and reducing greenhouse gas emissions by at least 55% by 2030 compared to 1990 levels [2]. The Fit for 55 initiative includes revisions to the Energy Performance of Buildings Directive (EPBD) [3], aiming to accelerate renovations, promote nearly zero-energy buildings, and increase the use of renewable energy in the built environment. The LIFE project directly supports the implementation of EU climate policy by contributing to evidence-based decision-making and monitoring progress toward climate objectives.
Public-use buildings have been one of the focuses of the project, with over 150 buildings surveyed and 27 buildings selected for detailed energy monitoring and possible implementation of technological solutions aiming at increased sustainability.
The aim of this study is the assessment of the possibility of decreasing energy-related emissions in the region by lessening the energy consumption of public buildings. The selection of 27 buildings is considered to be representative of administrative, cultural, and educational buildings in the region. Though such considerations are always building-specific, this wide selection facilitates some generalized conclusions and, therefore, the study could have local policy-related implications. The study assumes the worst-case scenario as far as the building energy consumption is concerned—that is, no further thermal modernization of the building—and tackles the problem purely from the energy supply side. Installation of photovoltaic panels, as a local renewable energy source, has achieved great popularity in Poland in recent years [4]; however, this has also been criticized due to its negative impact on the energy grid [5]. Therefore, the assessment has to take into account not just yearly, but instantaneous energy flows. Therefore, the parameters that have been selected as metrics for the study are the ratios of self-sufficiency and self-consumption.
1.2. Supply-Side Assessment
The lessening of a buildings environmental impact can be assessed from the demand side and the supply side. Building energy demand can be lessened by thermal modernization, such as improved insulation and modernizing of the HVAC systems. The environmental impact of the energy supply can be in turn lessened by implementation of renewable energy sources. In this paper, the supply side is considered and analyzed; specifically, the implementation of photovoltaic panels and heat pumps in conjunction with battery storage. The aim of the work is to ascertain whether the selected buildings can achieve a high level of self-consumption, making them functionally independent from the electric grid.
The combination of heat pumps and photovoltaics with battery storage has been discussed by various authors. Williams et al. [6] in 2012 assessed the feasibility of a system utilizing PV panels, a heat pump, and battery storage via simulation. They were able to show, via a simulation, that the implementation of such a system, together with a water-based thermal energy storage can satisfy the heat demand of a four-person household, with up to 65% self-consumption of the PV-generated energy. Niederhauser et al. [7] evaluated a system based on the concept of maximum self -consumption. Nicoletti et al. [8] in 2025 evaluated operating strategies for such systems working in conjunction with boilers. A detailed review on works on the topic was provided by Nazari et al. [9]. An assessment of literature shows that a large portion of the current body of work use simulated building data and consider the aim to be the lowering the amount of energy supplied by the grid.
The assessment of cooperation of the renewable sources of heat and renewable sources of power needs to be calculated in a manner accounting for instantaneous imbalances. In other words, the calculation needs to be performed with a dense time resolution, and as such, it is desirable to have a database of frequent measurements. A complex building energy monitoring system had to, therefore, be constructed. Such systems are currently mostly of interest in the field of “smart-buildings”, “the Internet of Things”, and general process automation such as in the works of Stavropoulos et al., Peng et al., and Wei et al. [10,11,12]. Implementations vary, with some authors showing the viability of low-cost solutions, such as in the study by Khwanrit et al. [13]. The use of building energy monitoring data for component modeling has also been proposed by some authors, for example, Manfren et al. [14], who used digital twins to model heat pumps and radiator valves.
It should be noted, that no previous case study in the given field found by the authors addressed multiple cases with the use of real, measured building data.
1.3. Outline of the Multi-Case Study
Within the LIFE project, buildings were outfitted with complex energy monitoring systems. The 27 buildings outfitted with the measurement system present a wide array of public use building, such as government offices, culture centers, libraries, and schools. Locations range from urban centers to rural locations, and the date of construction ranges from the 19th century to 2013. As such, the selection is considerably diverse and it is understood that each building will present its own unique sense of needs and opportunities. Before the start of the measurement campaign, the buildings were surveyed. The survey data includes such details as the floor space, dimensions, energy consumption in the previous year based on billing and meter readouts, the presence of insulation, fuel source, and the presence of air conditioning and ventilation systems. The most important survey data is shown in Table 1.

Table 1.
Building survey data.
The buildings are all located within the confines of the Silesian Voivodship of Poland, placing them firmly in the moderate climate zone. The Polish Committee for Normalization has divided Poland into two climate zones in summertime and five climate zones in winter [15]. The buildings in question lie in zone II (summer), corresponding to a maximum design temperature of 30 °C, and in zone III (winter) corresponding to a minimum design reference temperature of −20 °C. The yearly average temperature for the area according to the norm is 7.6 °C. Insolation in Poland varies between 949 and 1168 . The photovoltaic electricity potential for the area, according to World Bank data is between 1022 and 1095 kWh per kW (peak) installed [16] as shown in Figure 1.
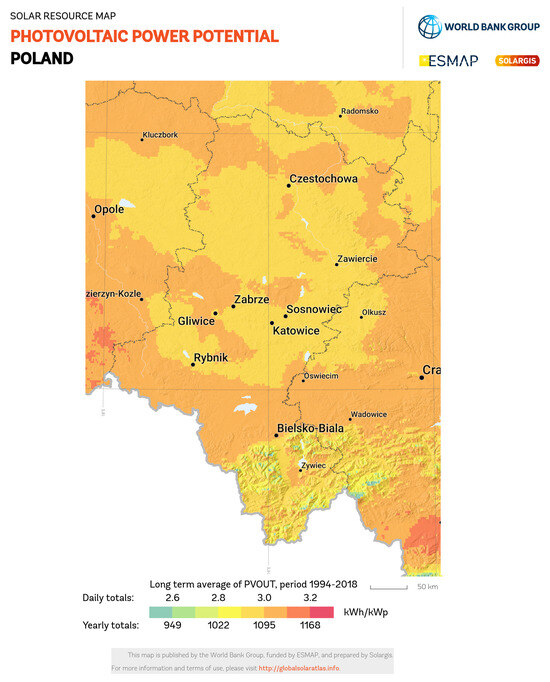
Figure 1.
Solar electricity potential for the Silesia Region, according to SOLARGIS data [16].
The buildings in the study date from a wide range of periods, and some of them had historically undergone various types of modernization, including thermo-modernization. The challenging climate conditions are, therefore, somewhat offset by the fact that most of the buildings are insulated. This information, together with the information on building energy consumption per unit area and unit volume, is outlined in Table 2.
Table 2.
Additional building data, time of build, insulation, and specific energy consumption.
Measurements were taken over the course of one year, from February 2024 to February 2025. The data was logged in one-minute intervals. This included the information on the instantaneous energy consumption for heating, air conditioning, general electricity consumption, and domestic hot water preparation. The sensor selection was tailored to each building based on the gathered survey data. It should be noted that the buildings were also outfitted with measurement sensors not pertinent to this particular study, such as door-opening counters, internal concentration sensors, etc.
In addition, publicly available weather data was also used. This was from the Polish Weather Service and the EU PVGIS system [17].
2. Energy Modernization Scheme
Gathered measurement data was used to evaluate possible modernization schemes and their effects. For the purposes of this study, only a modernization from the supply side is considered. This includes the following:
- Installation of photovoltaic panels on the building rooftops, four PV panels technologies being considered;
- Installation of biomass fired boilers;
- Installation of heat pumps, either air or ground source;
- Energy storage in the form of hot water tanks;
- Electrical energy storage in the form of an idealized battery.
The modernization schemes are multi-variant.
The overall work flow adopted for the calculation was as follows: First, the yearly energy usage data for each building was compiled, together with the corresponding weather data. Second, the energy generation in a possible solar panel arrangement, using the selected variant was calculated based on the building and weather data. Third, based on the measured usage, the energy consumption of a renewable source of heat was modeled, according to the building and weather data. At this step, the size of the sensible heat energy storage (water tank) was selected. Fourth, the effect of implementing an electrical energy storage system was calculated, using the previously calculated data on energy use. The size of the electrical energy storage was varied in a set range. The calculation and modeling procedures are described in detail in the next section. The overall workflow is illustrated in Figure 2.
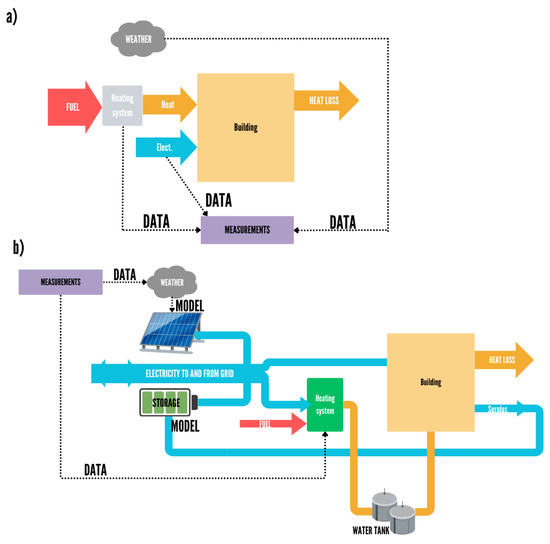
Figure 2.
Measurement gathering and calculation workflow, (a) the measurement of a given building, (b) the calculation scheme for a modernized building.
2.1. Energy Generation
The proposed source of renewable energy are photovoltaic panels. The possibility of using four variants of photovoltaic panels according to the technologies of the cells they contain was provided for, in a generalized way, without indicating a specific manufacturer. These are as follows:
- Monocrystalline;
- HIT (hetero connector with an internal thin layer);
- Polycrystalline;
- CIGS (copper-ind-gal-selenium).
The instantaneous power of the photovoltaic system is determined on the basis of sunlight and other weather data.
where is the installation power in W, is the solar irradiance in , is the panel surface, the number of panels in a given part of the installation, and is the temporary efficiency of the panel. The values of G come from the PVGIS [17] system for the selected location. This tool requires information about the angle of inclination of the panel to the horizontal plane and the azimuth to which it is directed. For flat roofs, the optimum angle and azimuth indicated by PVGIS are assumed. In the case of buildings with sloping roofs and containing sloping roof fragments, these data were estimated on the basis of photos of buildings and satellite photos, as well as survey data. The number of panels results from the roof surface of the building, where the surface of one panel is identical to the surface of the panels examined by Paudyal et al. [18] (, , , for monocrystalline, HIT, polycrystalline, and CIGS panels, respectively). Full coverage of pitched roofs (panels laid on the roof surface) and half-covering of flat roofs are assumed. This is an important simplifying assumption based on the presence of other installations on the roofs and the fact that the panels set at an angle to the surface must be spaced apart. The efficiency of the panel is a function of its temperature [19]:
where is the nominal efficiency value of the panel, is the temperature coefficient, is the reference temperature of the cells, and is the instantaneous temperature. The instantaneous temperature can be estimated using the Skoplaki et al. [20] correlation. It takes the form of:
where is the current outdoor temperature and is the wind speed in m/s. Snowfall was also taken into account in the calculations. In the event of precipitation according to the data gathered from the Polish Weather Service (IMGW), it is assumed that the power of photovoltaic panels is 0. The parameters of the panels used in the calculation (after [18]) are included in Table 3.
Table 3.
Assumed parameters of photovoltaic panels [18].
2.2. Energy Consumption
For the purposes of the calculations, the energy demand of the building are separated into several categories, as follows:
- Electricity consumption for utility purposes (e.g., lighting, computers, etc.);
- Electricity consumption for air conditioning;
- Electricity consumption for domestic hot water (DHW) preparation;
- Heat consumption for heating;
- Heat consumption for domestic hot water (DHW) preparation. *
All of these items were measured separately, except for the heat consumption for DHW purposes. In the current configuration, the buildings in question use DHW prepared either by the use of their central heating systems or separate electric and gas-fired water heaters. It is assumed that after modernization, the DHW supply will be carried out by the heat pumps. All 27 buildings surveyed were outfitted with hydronic central heating systems.
2.2.1. Electricity Consumption
Electricity consumption was directly measured, with a 1 min interval resampled to hourly data for the purposes this study. It is assumed that the buildings will have to cope with the exact same time-profile of electricity consumption, with the exception of the electricity consumption for DHW preparation (small, local water heaters). As this was separately measured, its subtraction does not present a problem. A list of all the electrical energy meters is shown in Table 4.
Table 4.
Table of electric energy meters.
The meters signified as “main” were installed at the points of interconnection with the grid. The meters with no signifier were used to monitor the energy consumption for reasons not pertinent to this study. DHW signifies domestic hot water. As only the energy consumption was measured, power measurements were obtained by differentiating the results with respect to time, which might lead to errors. The shifting of the time interval from the one minute of the original measurements to one hour, however, partially mitigates this issue. To obtain the values of power consumed for purposes other than DHW preparation and air conditioning, those measurements can be subtracted from the “main”.
It was noted that the electrical power for such purposes in each building varies stochastically, though clearly repeatable week-by-week patterns emerge. Such patterns, with the exception of building 8 (due to its relatively high power consumption demanding a different scale) are shown for illustration purposes in Figure 3.
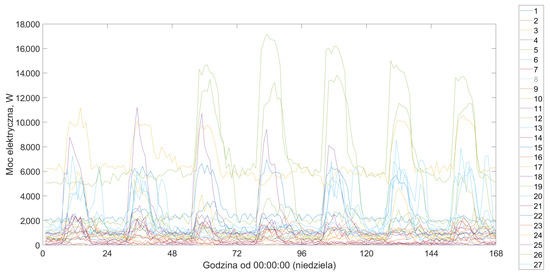
Figure 3.
Example weekly patterns of electrical power consumption in buildings.
2.2.2. Domestic Hot Water
The power used for domestic hot water preparation is aggregated for each building, and in subsequent calculations (outlining the modernization scenarios) is added to the heat demand to be fulfilled by renewable sources. This is due to the low energy effectiveness of traditional, resistive hot water heaters. It can be classed according to source: electric hot water heaters, district heat via separate piping, gas hot water heaters, or from the central heating boiler. The electrical hot water heaters correspond to DHW measurements in Table 4. For central heating-supplied hot water, which was not measured separately, the magnitude of energy consumption can be surmised from the measurements of the central heating system taken in the summer months (note, that in the modernization scenario this energy will be once again supplied by the central heating system and its subtraction is not necessary). For other sources, separate meters were installed. These are listed in Table 5.
Table 5.
List of separate DHW sensors.
As with the electricity consumption, similar weekly profiles can be drawn for DHW from different sources. These have been shown for illustration in Figure 4, Figure 5 and Figure 6.
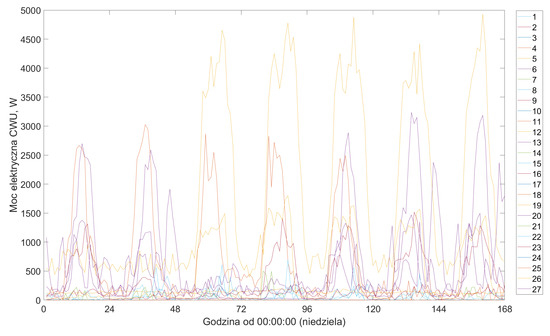
Figure 4.
Weekly profile of power consumed by electric hot water heaters.
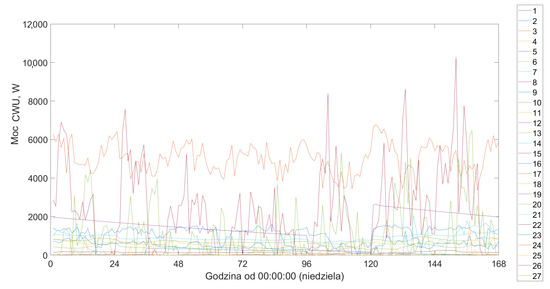
Figure 5.
Weekly profile of power consumed by non-electric hot water sources.
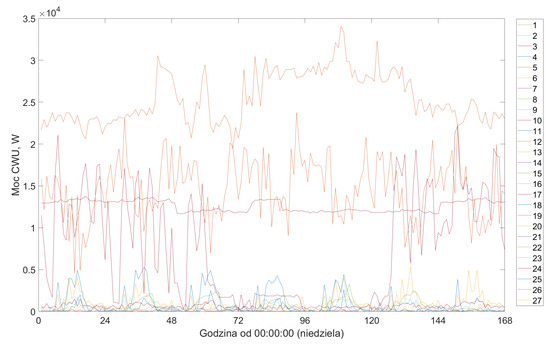
Figure 6.
Weekly profile of power supplied by the central heating systems for DHW purposes.
2.2.3. Energy Consumption for Heating
The instantaneous power of the existing heating installations was determined from the measurements as:
where [kg/s] is the measured flow, , [kJ/kg] is the enthalpy of the circulating water determined from the measured temperatures using CoolProp [21] libraries. For the purposes of further analysis, the yearly data, originally sampled with the interval of 1 min was resampled with an interval of one hour. It is assumed, that the new heating source, that being the heat pump or biomass boiler, will have to cope with the exact same load.
2.3. Instantaneous Energy Balance for the Buildings After Proposed Modernization
The basic equation for the calculations is the energy balance equation. It is solved for the heat required to heat the building and prepare domestic hot water (DHW) and for electricity, for utility, heating, and air conditioning needs. Therefore, the energy balance for heat can be presented as follows:
where represents the heat delivered (by the heating device), is the heating expenditure, and is for the preparation of domestic hot water. These values are the heat outputs, expressed in kW, and are appropriate for a given time . Internal heat generation is omitted. The instantaneous heating power values are calculated on the basis of the temperature difference between the set internal temperature and the external temperature using an empirical function, whereby the functional relationship between the set temperature difference and the thermal power is determined on the basis of the previously collected monitoring data, as described in Section 2.2 Such an approach has a physical justification, as heat losses, both heat transfer through the partitions outside to the ground and losses from ventilation are functions of the temperature difference. The consumption for the purposes of domestic hot water is also calculated using the model of the database of monitoring data collected so far, though it is only a function of time (day of the week and hour), which is described in Section 2.2.2. “Domestic Hot Water”. The instantaneous energy consumption for heating purposes must be covered by the heat source. In the case of buildings connected to the heating network, we assume that the network has zero emissions after 2050 [22], so the installation of new heat sources is not assumed. In the case of buildings not connected to the network, it is assumed that the heat sources may be an air or a ground heat pump or a biomass boiler. The electrical power of the heat pump can be calculated as:
where is the coefficient of performance of the heat pump. This is calculated on an instantaneous basis as a function of the prevailing conditions and load of the pump in relation to its nominal power, according to the methods indicated by Marsik et al. [23] and Qiana et al. [24] for air and ground pumps, respectively. The maximum heat output per year is taken as the nominal power of the pump, without indicating a specific model of the device, which is an important simplifying assumption. The biomass boiler was treated only as an additional heat source.
wherein the indices “hp”and “bb” denote a heat pump and a biomass boiler, respectively. The power of the biomass boiler is selected iteratively. If there is an annual surplus of electricity produced in the calculation results, the boiler is not considered. However, if there is an annual shortage, the boiler power is gradually increased until it is eliminated.
In addition, the possibility of installing a buffer tank was adopted, storing the heat produced by the heat pump in the event of overproduction of electricity during the heating season. This is a method of short-term energy storage. The size of the tank is selected iteratively to reduce overproduction and shortages in daily terms—the overproduction of electricity from the PV installation occurring in the heating season is not sold to the network but used in the heat pump for the purpose of heating the tank. It is assumed that the storage medium is water. “Charging” the tank causes the temperature of the medium to increase and its discharge to decrease according to the energy balance equation:
where U is the internal energy, and indexes 1 and 2 denote the start and end of the charge/discharge, respectively. The internal energy can be written as:
where V is the volume, is the density of the water, and is its heat capacity. The volume of the tank is selected iteratively to minimize overproduction of electricity.
Finally, in the case of electricity, the balance equation takes the form of:
where instantaneous power, N, is expressed in kilowatts and the indices refers to the following: network—network; gen—local generation from RES; hp—heat pump; us—energy consumption for utility purposes; and ac—energy consumption for air conditioning purposes. The power drawn from the network is the output value. The generation from RES sources depends on the adopted technology and is calculated using meteorological data and data from the PVGIS [17] system.
2.4. Computational Variants
Each building undergoes the calculation under 16 computational variants to encompass the possible variations stated in the model description. The variants are shown in Table 6. Note that for buildings with district heating connection no other heat sources are considered. Thus, in their case only four distinct variants exist.
Table 6.
Computational modeling variants.
2.5. Electrical Energy Storage Implementation
Energy storage calculations were performed with a high degree of abstraction. A dynamic energy storage model was constructed in ’Simulink’, using the yearly profiles of energy consumption and the production for a modernized building as its input data. The maximum storage capacity, maximum charge, and discharge power are assumed as model parameters. The model does not take the battery type or its electrical parameters into consideration. The output data are the yearly values of energy consumed and sold to the grid. The system is illustrated in Figure 7. As can be seen, the model only utilizes the instantaneous values of electrical power and its integrals—energy—and as such can be considered to be highly simplified.
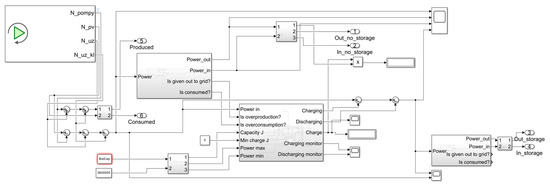
Figure 7.
The Simulink system used for battery energy storage calculation.
3. Results and Discussion
3.1. Self-Consumption
Due to the strain that the unpredictability of renewable energy sources places on the grid, it is of interest to analyze the self-consumption of the system within the measurement period (February 2024 to February 2025) based on instantaneous power flows. The self-consumption is defined as the amount of power produced that is locally consumed. The base self-consumption fraction is shown in Figure 8. The effect of battery capacity on the self-consumption fraction is shown in Table 7. It can be seen that for some of the buildings, namely Bojszowy, Chorzów, Katowice, and Świerklany, the fraction is above 50% even without the implementation of battery storage. All of those are effectively office buildings (though Chorzów houses offices of a cultural institution). Schools, in turn, are all below 50% and do not make it to the top of the list even at increased storage capacities. The implementation of battery storage has a significant effect at even low battery capacities, though the relation between self-consumption and storage capacity tends to reach a plateau. This is illustrated for an example building in Figure 9.
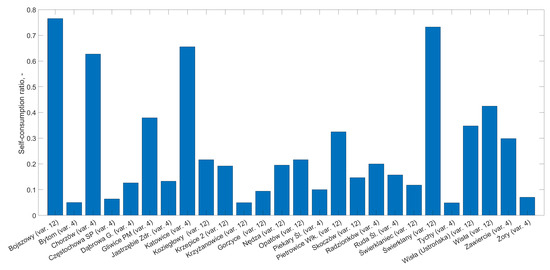
Figure 8.
Self-consumption fraction with no electrical energy storage considered. Best modernization variant shown for each building.
Table 7.
Self-consumption percentage as a function of battery capacity.
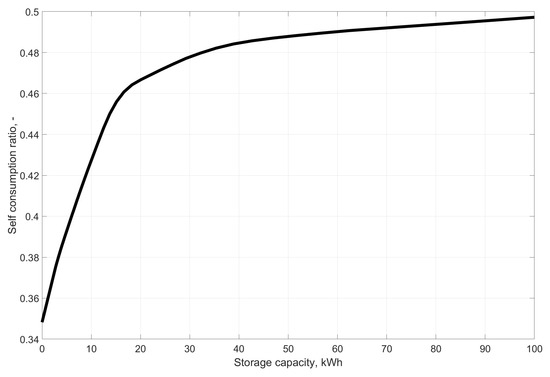
Figure 9.
Effect of storage capacity on self-consumption for an example building (Wisła, var. 12).
3.2. Self-Sufficiency
For the purposes of this analysis, self-sufficiency is defined as the ratio of power locally produced and consumed (at the same instance in time, with no grid exchange) to the power consumed. Of the 27 buildings surveyed, 10 show a potential of reaching over 50% self-sufficiency even without any electrical energy storage capacity. The results for the best variant in this regard, without storage, are shown in Figure 10. The implementation of electrical energy storage improves the results, and values of the self-sufficiency percentage for different storage sizes are shown in Table 8. An example chart of the relation between electrical energy storage size and self-sufficiency is shown in Figure 11. What is surprising, is that four buildings, Koziegłowy, Opatów, Piekary Śląskie, and Tychy, show a potential for full self-sufficiency with no electrical energy input from the grid within the course of the measurement period (February 2024 to February 2025). The buildings in Częstochowa, Tychy, Krzyżanowice, and Gorzyce, which were the poorest performers in terms of self-consumption, reach high values of self-sufficiency, pointing to the possibility of the PV capacity being excessive.
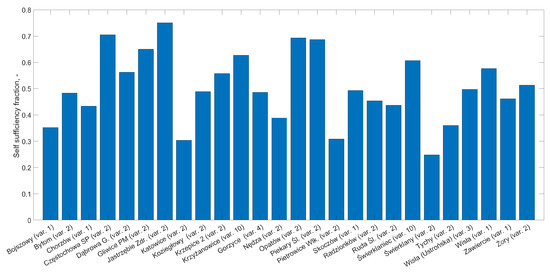
Figure 10.
Self-sufficiency fraction for the best variant in each building without electrical energy storage.
Table 8.
Self-sufficiency percentage as a function of battery capacity.
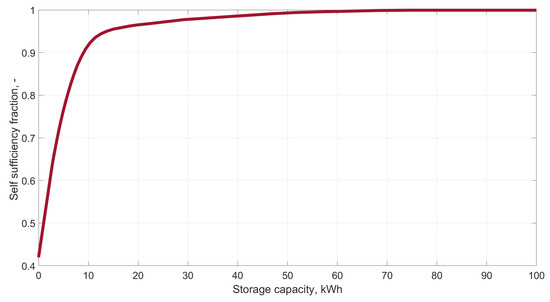
Figure 11.
The dependence of self-sufficiency on storage capacity, for building 21 (Świerklany).
Note, however, that the data shown consider only the best variants as far as electrical self-sufficiency is concerned. Thus, the high values are arrived at by the virtue of the building either having a district heating connection or the implementation of biomass boilers. Thus, it is also of interest to present results compiled only for variants 9–16 and without the buildings with a district heating system connection. Such results are displayed in Table 9. The values are now lower, however, still substantial. Of the 15 buildings considered in Table 9, 8 can reach over 50% self-sufficiency with a storage capacity of 20 kWh. With 50 kWh, three buildings are over 80% self-sufficient. What is of interest, is that this amounts to the smaller buildings (Krzyżanowice, Gliwice, Świerklaniec), though no overall trend is found in this regard.
Table 9.
Self-sufficiency percentage as a function of battery capacity. Results excluding buildings with a district heating connection and variants with biomass boilers.
4. Conclusions
In this paper, a multiple-case study was conducted, where 27 real buildings were subject to analysis based on detailed energy measurements taken over the course of one year. The measurements, together with the buildings’ geographical and architectural data, have allowed modeling how said buildings’ energy needs could be fulfilled with the installation of local, renewable energy sources. A total of 16 modernization variants have been considered for each building and for each of the variants, an analysis of the effect of implementation of energy storage has been carried out. It needs to be noted that the analysis only covers the measurement year and does not cover the issue of year-to-year variations.
It has been found that for the selection of public-use buildings, several show good markers for the implementation of systems consisting of a photovoltaic array, electrical energy storage, and, in cases not outfitted with a district heating connection, heat pumps with thermal energy storage. Even a moderate energy storage capacity has been shown to enable a drastic cut in power both supplied to the grid and consumed from the grid. It has been shown that with a large enough storage capacity, some of the buildings could possibly function without a grid connection within the confines of the measurement period.
It has to be noted that the buildings subject to measurements and modeling presented a diverse array of public-use buildings of different sizes, uses, with varying types of insulation of diverse construction types. Despite this fact, no overarching trends were found tied to the chosen metrics of self-consumption and self-sufficiency. That is to say, the feasibility of achieving higher metrics has not been found to be tied to any of the building characteristics but rather, the matter is highly building-specific and individualized. What was observed was that smaller buildings were easier to make self-sufficient; however, this should only be noted as a minor observation and not a major conclusion. In the same fashion, self-consumption was more difficult to achieve in school buildings.
Despite the assumption of no further changes to the building envelope and limiting the PV area to the rooftops only, and, further, despite the difficult local climate conditions, the results show themselves to be generally favorable—especially after implementation of a moderate storage capacity system. If the buildings are assumed representative of public-use buildings of the region, this presents a possible avenue for local policymakers in terms of implementation of the New Green Deal and Fit for 55 initiatives. In terms of buildings outfitted with district heat, this, however, rests largely on the fulfillment of the requirements by the heat supplier.
Author Contributions
Conceptualization, A.S.; Methodology, B.R., A.S. and I.S.; Software, B.R.; Formal analysis, I.S.; Investigation, B.R., A.S. and I.S.; Resources, A.S.; Data curation, B.R.; Writing—original draft, B.R.; Writing—review & editing, A.S. and I.S.; Supervision, A.S.; Project administration, A.S. All authors have read and agreed to the published version of the manuscript.
Funding
This work was funded by the “Life, Silesia Blue Sky Restored” project, LIFE20 IPE/PL/000007-LIFE-IP AQP-SILESIAN-SKY, financed jointly by the Life funds of the European Commission, the National Fund for Environmental Protection and Water Management (Republic of Poland), and partners of the project, including the Silesian Voivodship.
Institutional Review Board Statement
Not applicable.
Informed Consent Statement
Not applicable.
Data Availability Statement
The original contributions presented in this study are included in the article. Further inquiries can be directed to the corresponding authors.
Conflicts of Interest
The authors declare no conflicts of interest.
Nomenclature
| Latin letters | |
| N | power, |
| G | solar irradiance, |
| A | area, |
| n | quantity, - |
| t | temperature, °C |
| w | velocity, |
| L | length, m |
| Q | heat, |
| H,h | enthalpy, , |
| V | volume, |
| U,u | internal energy, |
| Greek letters | |
| efficiency, - | |
| time, s | |
| density. | |
| Subscripts | |
| el | electrical |
| pv | photovoltaic |
| i | index |
| st | reference |
| out | outflowing |
| nom | nominal |
| main | main |
| dhw | domestic hot water |
| ac | air conditioning |
| hp | heat pump |
| bb | biomass boiler |
| tw | water tank |
| ch | central heating |
| us | useful |
| gen | generated |
| Abbreviations | |
| HVAC | heating, ventilation, air conditioning |
| EPDB | Energy Performance of Buildings Directive |
| PV | photovoltaic |
| CIGS | copper-ind-gal-selenium |
| HIT | hetero-connector with internal thin layer |
| DHW | domestic hot water |
References
- Stefanis, C.; Stavropoulos, A.; Stavropoulou, E.; Tsigalou, C.; Constantinidis, T.C.; Bezirtzoglou, E. A spotlight on environmental sustainability in view of the European Green Deal. Sustainability 2024, 16, 4654. [Google Scholar] [CrossRef]
- Schlacke, S.; Wentzien, H.; Thierjung, E.M.; Köster, M. Implementing the EU Climate Law via the ‘Fit for 55’ package. Oxf. Open Energy 2022, 1, oiab002. [Google Scholar] [CrossRef]
- European Parliament and Council of the European Union. Directive (EU) 2024/1275 of the European Parliament and of the Council of 24 April 2024 on the Energy Performance of Buildings (Recast). Official Journal of the European Union (OJ L), 2024. Entered into Force 28 May 2024; Provisions Apply from 30 May 2026. Available online: https://eur-lex.europa.eu/eli/dir/2024/1275/oj/eng (accessed on 10 May 2025).
- Tomczyk, D.; Łapniewska, Z. Solar panels on every rooftop? Photovoltaics boom in Poland and the role of the European Union funds. Energy Res. Soc. Sci. 2025, 125, 104107. [Google Scholar] [CrossRef]
- Majcher, J.; Pronobis, M.; Sołtys, J.; Strupczewski, A.; Rasolomampionona, D.D. The Unobvious Meanders of the Green Energy Transformation and its (Un) Predictable Consequences, or the Utopia of the “Net Zero” Policy. In Proceedings of the 2024 International Conference on Applied and Theoretical Electricity (ICATE), Craiova, Romania, 24–26 October 2024; pp. 1–10. [Google Scholar]
- Williams, C.J.; Binder, J.O.; Kelm, T. Demand side management through heat pumps, thermal storage and battery storage to increase local self-consumption and grid compatibility of PV systems. In Proceedings of the 2012 3rd IEEE PES Innovative Smart Grid Technologies Europe (ISGT Europe), Berlin, Germany, 14–17 October 2012; pp. 1–6. [Google Scholar]
- Niederhäuser, E.L.; Huguelet, N.; Rouge, M.; Guiol, P.; Orlando, D. Novel approach for heating/cooling systems for buildings based on photovoltaic-heat pump: Concept and evaluation. Energy Procedia 2015, 70, 480–485. [Google Scholar]
- Nicoletti, F.; Ramundo, G.; Arcuri, N. Optimal operating strategy of hybrid heat pump- boiler systems with photovoltaics and battery storage. Energy Convers. Manag. 2025, 323, 119233. [Google Scholar] [CrossRef]
- Nazari, M.A.; Rungamornrat, J.; Prokop, L.; Blazek, V.; Misak, S.; Al-Bahrani, M.; Ahmadi, M.H. An updated review on integration of solar photovoltaic modules and heat pumps towards decarbonization of buildings. Energy Sustain. Dev. 2023, 72, 230–242. [Google Scholar] [CrossRef]
- Stavropoulos, T.G.; Koutitas, G.; Vrakas, D.; Kontopoulos, E.; Vlahavas, I. A smart university platform for building energy monitoring and savings. J. Ambient Intell. Smart Environ. 2016, 8, 301–323. [Google Scholar] [CrossRef]
- Peng, C.; Qian, K. Development and Application of a ZigBee-Based Building Energy Monitoring and Control System. Sci. World J. 2014, 2014, 528410. [Google Scholar] [CrossRef] [PubMed]
- Wei, C.; Li, Y. Design of energy consumption monitoring and energy-saving management system of intelligent building based on the Internet of things. In Proceedings of the 2011 International Conference on Electronics, Communications and Control (ICECC), Ningbo, China, 9–11 September 2011; pp. 3650–3652. [Google Scholar]
- Khwanrit, R.; Kittipiyakul, S.; Kudtonagngam, J.; Fujita, H. Accuracy comparison of present low-cost current sensors for building energy monitoring. In Proceedings of the 2018 International Conference on Embedded Systems and Intelligent Technology & International Conference on Information and Communication Technology for Embedded Systems (ICESIT-ICICTES), Khon Kaen, Thailand, 7–9 May 2018; pp. 1–6. [Google Scholar]
- Manfren, M.; James, P.A.; Aragon, V.; Tronchin, L. Lean and interpretable digital twins for building energy monitoring—A case study with Smart Thermostatic Radiator Valves and Gas Absorption Heat Pumps. Energy AI 2023, 14, 100304. [Google Scholar] [CrossRef]
- PN-EN 12831; Charakterystyka Energetyczna Budynków—Metoda Obliczania Projektowego Obci Azenia Cieplnego—Czesc 1: Obciazenie Cieplne. Polski Komitet Normalizacyjny: Warszawa, Poland, 2017.
- Solargis, S.R.O. Solargis: Data, Software and Services for Solar Projects. 2025. Available online: https://solargis.com (accessed on 18 June 2025).
- EU. PVGIS (Photovoltaic Geographical Information System). Last Update: 1/03/2022. 2023. Available online: https://re.jrc.ec.europa.eu/pvg_tools/en/ (accessed on 18 June 2025).
- Paudyal, B.R.; Imenes, A.G. Investigation of temperature coefficients of PV modules through field measured data. Sol. Energy 2021, 224, 425–439. [Google Scholar] [CrossRef]
- Evans, D. Simplified method for predicting photovoltaic array output. Sol. Energy 1981, 27, 555–560. [Google Scholar] [CrossRef]
- Skoplaki, E.; Boudouvis, A.; Palyvos, J. A simple correlation for the operating temperature of photovoltaic modules of arbitrary mounting. Sol. Energy Mater. Sol. Cells 2008, 92, 1393–1402. [Google Scholar] [CrossRef]
- Bell, I.H.; Wronski, J.; Quoilin, S.; Lemort, V. Pure and Pseudo-pure Fluid Thermophysical Property Evaluation and the Open-Source Thermophysical Property Library CoolProp. Ind. Eng. Chem. Res. 2014, 53, 2498–2508. [Google Scholar] [CrossRef] [PubMed]
- Regulation (EU) 2021/1119 of the European Parliament and of the Council of 30 June 2021 establishing the framework for achieving climate neutrality and amending Regulations (EC) No 401/2009 and (EU) 2018/1999 (‘European Climate Law’). Off. J. Eur. Union 2021, 50, 243.
- Marsik, T.; Stevens, V.; Garber-Slaght, R.; Dennehy, C.; Strunk, R.T.; Mitchell, A. Empirical Study of the Effect of Thermal Loading on the Heating Efficiency of Variable-Speed Air Source Heat Pumps. Sustainability 2023, 15, 1880. [Google Scholar] [CrossRef]
- Qian, H.; Wang, Y. Modeling the interactions between the performance of ground source heat pumps and soil temperature variations. Energy Sustain. Dev. 2014, 23, 115–121. [Google Scholar] [CrossRef]
Disclaimer/Publisher’s Note: The statements, opinions and data contained in all publications are solely those of the individual author(s) and contributor(s) and not of MDPI and/or the editor(s). MDPI and/or the editor(s) disclaim responsibility for any injury to people or property resulting from any ideas, methods, instructions or products referred to in the content. |
© 2025 by the authors. Licensee MDPI, Basel, Switzerland. This article is an open access article distributed under the terms and conditions of the Creative Commons Attribution (CC BY) license (https://creativecommons.org/licenses/by/4.0/).