Abstract
This study investigates the resilience of service supply chains and its role in promoting sustainable regional development in China. Based on data from 31 provinces between 2017 and 2023, we develop a multidimensional evaluation framework grounded in the structure, relationship, and subject model. Using entropy weighting, fuzzy-set qualitative comparative analysis, necessary condition analysis, and OLS regression, we identify three dominant configurations: cost-adaptive, cost-growth, and technology-driven. Among them, the cost-adaptive path remains statistically significant when tested against updated 2023 data. The findings reveal persistent regional disparities and demonstrate how context-specific strategies can shape service resilience under institutional and market variations. This study contributes to supply chain sustainability research by integrating recent empirical evidence with configurational analysis, offering practical policy insights for balancing efficiency, adaptability, and inclusive development.
1. Introduction
The growing complexity of global service economies has heightened the importance of building resilient supply chains. Unlike manufacturing systems, service supply chains rely on real-time interactions, intangible outputs, and minimal inventory buffers, making them particularly vulnerable to disruption [1,2]. Events such as the COVID-19 pandemic, geopolitical instability, and technological shifts have exposed the fragility of these systems and underscored the need for resilience-oriented strategies [3,4].
Resilience in this context refers to the ability of supply chains to absorb shocks, adapt to changes, and maintain continuity [5]. While resilience research has gained momentum, most studies are rooted in manufacturing contexts or firm-level perspectives [6]. Comparatively few have addressed how resilience evolves in service ecosystems, particularly in geographically diverse and institutionally asymmetric economies [7].
China offers a relevant context, as its service sector now accounts for over 50% of the national GDP [8]. However, service supply chains remain uneven across provinces. While eastern regions benefit from advanced infrastructure and innovation, central and western areas face structural and market constraints [9,10]. This spatial disparity presents an opportunity to examine how region-specific conditions shape diverse resilience pathways.
Despite increasing attention to service supply chain resilience (SSCR), key gaps remain. Many studies isolate individual drivers, rather than exploring configurational patterns [11]. Regional heterogeneity is seldom analyzed systematically [12], and few assessments consider the combined effects of structural, relational, and behavioral dimensions [13,14].
This study addresses these gaps by constructing a multidimensional evaluation framework for SSCR across 31 Chinese provinces. Anchored in the structure–relationship–subject (SRS) model, the framework incorporates cost control, efficiency optimization, and market adaptation dimensions. Using a mixed-method approach that combines entropy-based weighting, fuzzy-set qualitative comparative analysis (fsQCA), necessary condition analysis (NCA), and OLS validation with updated 2023 data, the study identifies both the conditions and configurations that lead to high resilience.
The study seeks to answer the following questions:
- How can service supply chain resilience be measured across regions using a multidimensional framework?
- What condition combinations drive high resilience in different provincial contexts?
- How do these configurations vary over time and inform sustainable policy design?
2. Literature Review and Framework Development
2.1. Literature Review
Resilience has emerged as a vital construct in supply chain management, particularly in response to the growing volatility and complexity of global service economies. Defined as the ability of supply chains to resist, absorb, and recover from disruptions [14,15], resilience has traditionally been studied in manufacturing contexts. However, service supply chains (SSCs) exhibit distinct features such as intangibility, simultaneity, and dependency on relational coordination, which render them especially vulnerable to external shocks [4]. These characteristics call for alternative conceptualizations and analytical approaches when examining resilience in service systems.
To clarify the contextual distinctiveness of SSCs, Table 1 outlines the fundamental differences between manufacturing and service supply chains. This comparison not only highlights the operational and structural divergence between the two systems but also provides theoretical justification for adopting a service-specific resilience framework in this study.

Table 1.
Key differences between manufacturing and service supply chains.
Unlike prior studies that merely list structural differences between service and manufacturing chains, this study explicitly integrates such distinctions into the theoretical backbone of the SRS framework. The core rationale is that service supply chains’ unique reliance on real-time interactions, relational coordination, and cognitive agility necessitates a redefinition of resilience not as inventory buffering but as systemic responsiveness, adaptive co-production, and digital orchestration.
To advance theoretical clarity, it is essential to trace how the concept of service supply chain resilience (SSCR) has evolved over time. Table 2 provides a synthesis of representative definitions proposed by influential scholars, reflecting a shift in emphasis from static resistance and recovery toward dynamic adaptation, collaboration, and behavioral agility. This progression underscores that resilience is increasingly viewed as a systemic capability embedded in complex, interactive environments.
Table 2.
Definition of supply chain resilience by different scholars.
These evolving definitions suggest that SSCR is best understood as a multi-dimensional construct. Building on this foundation, a growing stream of literature emphasizes that resilience is not the outcome of a single factor but the result of interactions among multiple conditions. Structural factors include infrastructure and institutional capacity that support operational stability [33]. Relational dimensions involve inter-organizational collaboration, trust, and responsive communication [34]. Behavioral elements refer to the internal agility, learning ability, and innovation capabilities of firms within the supply chain [13,35]. Despite these developments, few studies have systematically integrated these dimensions into a cohesive framework that reflects the complexity of service supply chains.
Collectively, the extant literature highlights the growing significance of service supply chain resilience amid global volatility and institutional asymmetry. While previous studies have identified key structural and relational drivers, they tend to adopt fragmented perspectives that isolate individual factors and often neglect the role of behavioral adaptability. Furthermore, resilience research has largely focused on firm-level or national analyses, with a limited exploration of meso-level dynamics, particularly how economic structure, coordination mechanisms, and institutional support interact across regions. Theoretical integration across structural, relational, and behavioral domains remains insufficient, as does attention to the configurational nature of resilience across spatial contexts. This study addresses these gaps by applying a multidimensional and configurational approach, grounded in the structure, relationship, and subject (SRS) framework, to evaluate how diverse combinations of resilience conditions contribute to service supply chain resilience at the regional level. In doing so, it bridges the fields of supply chain management and regional development, offering a context-sensitive perspective on sustainability-oriented resilience.
2.2. Structure–Relationship–Subject Framework
The SRS framework conceptualizes service supply chain resilience as a multidimensional construct encompassing structural, relational, and subjective dimensions. Structural resilience refers to the system’s capacity for cost efficiency, loss absorption, and infrastructural robustness, including institutional support mechanisms that buffer against shocks. Relational resilience emphasizes inter-organizational coordination, trust, and response speed, which facilitate adaptive collaboration across actors [35,36]. Subjective resilience, often overlooked in quantitative frameworks, captures the behavioral and cognitive capacities of actors such as flexibility, innovation, and learning to proactively respond to uncertainty.
While each dimension contributes distinctively to resilience, their effects are inherently interdependent. For example, strong relational ties may partially compensate for structural deficiencies, and behavioral adaptability can accelerate recovery in resource-constrained settings. Therefore, a comprehensive evaluation of resilience must account for the interplay among these three dimensions, especially when assessing regional variations in service systems. This framework provides the foundation for the study’s indicator design and configuration analysis (Figure 1).
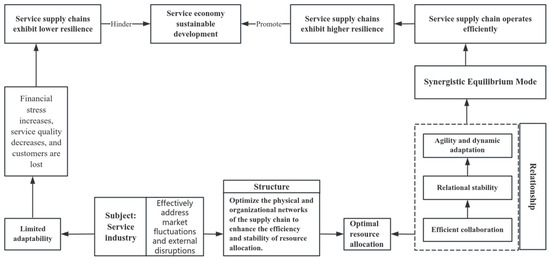
Figure 1.
Research framework.
2.2.1. Structural Dimension: Cost Control
The structural dimension of service supply chain resilience refers to the foundational institutional and infrastructural conditions that enable a system to maintain operational continuity under disruption. These structural elements provide the “hard environment” upon which adaptive and relational mechanisms can function effectively [33]. In the context of regional service economies, such as those across China’s provinces, structural resilience is reflected in cost stability, resource control, and institutional responsiveness.
This study conceptualizes structural resilience through three primary aspects. First, cost efficiency is critical for ensuring that service supply chains can absorb fluctuations without passing disproportionate burdens onto end users or partners. Second, risk control mechanisms, including loss recovery and pre-disruption planning, enhance a region’s capacity to mitigate external shocks. Third, adaptive institutional capacity encompasses fiscal flexibility, regulatory responsiveness, and logistical infrastructure, which collectively underpin a region’s ability to maintain service continuity in uncertain environments [37,38].
By capturing these components, the structural dimension offers insight into how resilient infrastructure and policy environments condition the response capacity of service supply systems, particularly in regions characterized by uneven economic development.
2.2.2. Relational Dimension: Efficiency Optimization
The relational dimension of service supply chain resilience emphasizes the role of inter-organizational linkages in facilitating rapid and effective responses to external disruptions. Unlike manufacturing supply chains, which may rely on inventory buffers or physical redundancies, service supply chains are often dependent on real-time collaboration, information sharing, and mutual commitment among actors [34,39]. In this context, relational resilience is defined by the quality and density of communication networks, contractual stability, and the degree of trust that enables coordinated action under uncertainty.
This dimension comprises three core elements. First, collaborative coordination mechanisms such as joint planning, flexible delivery arrangements, and crisis response protocols are essential for maintaining service flow during disruptions. Second, information integration ensures transparency and speed in decision-making across the chain. This capacity is further enhanced via digital connectivity and data interoperability. Third, relational trust builds social capital among supply chain partners, reduces opportunistic behavior, and enables risk-sharing during periods of stress [35,40].
Together, these relational factors determine the resilience capacity embedded in network structures. In spatially uneven contexts such as China’s provincial economies, differences in relational embeddedness significantly influence the ability of service supply chains to respond collectively and recover efficiently.
2.2.3. Subject Dimension: Market Adaptation
The subject dimension centers on the behavioral and strategic capabilities of actors within the service supply chain, particularly their ability to anticipate, absorb, and adapt to disruptions. In service-based systems, where outputs are co-produced and highly time-sensitive, organizational agility becomes a critical component of resilience. This dimension reflects the “soft infrastructure” of the supply chain, encompassing leadership adaptability, internal learning, and dynamic decision-making [13,36].
Three aspects define this dimension. First, technological agility refers to the ability to adopt and integrate digital tools for service delivery, monitoring, and adaptation. Cloud computing, real-time analytics, and AI-based diagnostics can enhance responsiveness. Second, strategic flexibility includes the readiness to revise operational plans, reallocate resources, and pivot service offerings in response to demand volatility. Third, innovative learning captures an organization’s capacity to extract lessons from past disruptions and institutionalize them into resilient routines [35].
These behavioral capabilities play a critical role in shaping resilience outcomes, particularly when structural or relational supports are limited. In less-developed regions, strong subject-level adaptability may compensate for external constraints, enabling local service systems to recover effectively despite systemic vulnerabilities.
2.2.4. Summary of Dimensions and Theoretical Foundations
To consolidate the theoretical model and prepare for empirical analysis, this section summarizes the three dimensions of service supply chain resilience: structural, relational, and subject-based. Each dimension is associated with specific constructs, theoretical foundations, and representative literature. These dimensions do not operate in isolation. Instead, they function as interdependent subsystems that jointly shape the resilience capacity of regional service economies. The structural dimension reflects institutional and infrastructural readiness. The relational dimension emphasizes coordination and trust among supply chain actors. The subject dimension captures the adaptive and behavioral capabilities of organizations embedded within the service chain.
Table 3 presents a synthesized mapping that links each dimension with its key constructs and corresponding theoretical foundations. This framework serves as the basis for selecting indicators and developing the measurement model, which is described in the next chapter.
Table 3.
Conceptual dimensions and key theories.
By consolidating these dimensions and constructs, the study develops a theoretically grounded and empirically operable framework for examining resilience across service supply chains in regionally diverse contexts. This foundation supports the operationalization of variables, as discussed in the methodology section that follows.
3. Service Supply Chain Resilience Measurement System
3.1. Data Collection and Period Selection
This study draws on provincial-level panel data from 2017 to 2023, covering 31 regions across mainland China. Data from 2017 to 2021 were used to construct the primary indicators for structural, relational, and behavioral resilience. These five years of data provided a stable empirical basis for evaluating each province’s performance in service supply chain resilience and for conducting the main configurational analysis using 2021 as the focal year. The 2022 data were employed to validate the robustness of the identified configurations under slightly changed external conditions. In addition, the 2023 data were used to test the temporal applicability of the causal pathways, assessing whether the core configurations maintained explanatory power over time.
To enable empirical assessment, the three theoretical dimensions—structural, relational, and subject-based resilience—were further specified by operationalizing and quantifying their underlying constructs into measurable indicators. Each indicator was selected based on its theoretical relevance to one of the three dimensions defined in the SRS framework: structural (cost control), relational (efficiency optimization), and subject-based (market adaptation). These indicators constitute a structured evaluation system, as presented in Table 4, and serve as inputs for subsequent weighting, calibration, and configurational analysis. All data were obtained from authoritative national yearbooks and official reports published by relevant government agencies. In cases of missing provincial data, the nearest available proxy or interpolation method was applied to ensure consistency and comparability across regions and years.
Table 4.
Selection and measurement of conditional variables.
3.2. Index System Construction
Based on the SRS framework, this study constructs a multidimensional evaluation index system comprising three primary dimensions: structural, relational, and subject-based resilience. Each dimension consists of a set of indicators selected for their conceptual alignment, empirical relevance, and data availability across all 31 Chinese provinces from 2017 to 2021. These indicators were introduced and theoretically justified in Section 2.2. To ensure methodological consistency, each variable was directionally coded according to its expected effect on resilience and directly processed using the entropy weight method (Table 5).
Table 5.
Indicator weights in the SSCR evaluation framework.
Given that the original dataset exhibited moderate variance across indicators and a relatively uniform dispersion across provinces, there was a potential concern that the entropy weighting method might yield overly uniform weights, thereby underemphasizing theoretically critical dimensions. To address this issue, a robustness check was performed using principal component analysis (PCA) on Z-score standardized data. The proxy weights derived from the first principal component revealed structural differentiation and partially converged with the entropy-based weights, especially for key indicators such as cost adaptation and turnaround speed, thereby reinforcing the validity of the original index construction.
However, notable discrepancies were also observed. For example, technological innovation and development flexibility received higher weights under the entropy method, whereas PCA placed greater emphasis on cost-related indicators. These differences reflect the distinct methodological orientations of the two approaches: entropy weighting captures informational dispersion across regions, while PCA prioritizes underlying variance structures. Given the objective nature of the entropy method and its suitability for measuring cross-regional heterogeneity, it is retained as the primary weighting strategy in this study, with PCA results serving as a robustness check.
4. Analysis of Measurement Results of Service Supply Chain Resilience
4.1. Development Level of Resilience
To gain a comprehensive understanding of the resilience of China’s service supply chain across regions and time periods, this section will quantitatively analyze the resilience for each province from 2017 to 2021. Using the entropy weight method on relevant data, this study reveals significant disparities in resilience development among provinces. The following analysis will further clarify how these differences appear in regional supply chain resilience and provide empirical evidence for the diversity of supply chain development throughout China.
From Table 6, it can be seen that the province with the highest average value of service supply chain resilience comprehensive water in China from 2017 to 2021 is Beijing (1.28), and the lowest province is Tibet (0.33). Among them, the comprehensive level of Beijing is 3.88 times that of Tibet, which shows that the gap between the comprehensive levels of service supply chain resilience in different provinces is more obvious. The highest comprehensive water average value in the eastern region is Beijing (1.28), and the lowest province is Jilin (0.39); the highest comprehensive water average value in the central region is Shanxi (0.66), and the lowest province is Jiangxi (0.39); the highest comprehensive water average value in the western region is Inner Mongolia (0.50), and the lowest province is Tibet (0.33). It can be seen that there are also differences in the comprehensive level of service supply chain resilience in different provinces in the same region.
Table 6.
Service supply chain resilience level index of all provinces in China.
From a national perspective, the level of resilience in China’s service supply chain exhibited an overall trend of fluctuating increase from 2017 to 2021. At the regional level, the development of resilience in the service supply chain followed a distribution pattern of “east > central > west”, with the comprehensive level in the eastern region surpassing that at the national level, while lagging behind in both central and western regions. The significant disparity in regional development can be attributed to factors such as socio-economic foundations and geographical conditions. The eastern region boasts higher levels of economic development compared to its counterparts in central and western regions, along with more advanced infrastructure and abundant resources, which provide favorable conditions for fostering resilience in the service supply chain.
4.2. Resilience by Dimension
Service supply chain resilience is multi-faceted, encompassing efficiency optimization, cost control, and market adaptation. A deeper comparative analysis across these dimensions reveals distinct regional patterns and provides nuanced insights into resilience strategies within China’s heterogeneous economic landscape.
4.2.1. Comparative Overview of Dimensions
From 2017 to 2021, substantial disparities in resilience dimensions emerged across Chinese provinces. Shanghai excelled notably in efficiency optimization, achieving the highest average score nationwide. Beijing led distinctly in cost control and market adaptation, signifying robust infrastructural and institutional frameworks coupled with strong adaptive capacities. Conversely, Tibet consistently ranked lowest across all dimensions, reflecting structural deficiencies and limited market dynamics inherent to underdeveloped regions.
Spatially, resilience exhibited a clear gradient of “east > central > west.” The eastern provinces generally maintained higher resilience scores across all dimensions, driven by developed infrastructure, concentrated industrial clusters, and advanced service management practices. Central and western provinces demonstrated constrained resilience due to limited economic diversity, weaker institutional support, and infrastructural inadequacies.
4.2.2. Typological Clusters by Dimension Strength
Provincial performances across dimensions suggest the emergence of three distinct resilience clusters:
- Efficiency-Driven Cluster (Shanghai, Guangdong): Provinces in this category capitalize on sophisticated industrial networks, high-speed resource reallocation capabilities, and advanced digital infrastructure. These attributes allow for rapid responsiveness and optimized turnaround times, which are crucial for maintaining service continuity during disruptions. These strengths are underpinned by long-standing regional advantages, including concentrated policy attention, better access to technological ecosystems, and sustained investment in public service coordination mechanisms. As a result, these provinces exhibit not only operational agility but also deeper systemic readiness for external shocks.
- Cost Control-Oriented Cluster (Beijing, Jiangsu): Provinces excelling in cost control exhibit superior infrastructural investments, rigorous financial management frameworks, and robust institutional environments. These factors collectively enhance their ability to absorb shocks without a substantial escalation in operational costs. Their resilience reflects mature administrative systems and stable economic environments, where fiscal discipline and institutional responsiveness form a solid foundation for managing volatility and maintaining service continuity.
- Market Adaptation Cluster (Sichuan, Anhui): Provinces within this cluster demonstrate resilience primarily through strategic agility and innovation responsiveness, compensating for relatively weaker structural and relational dimensions. This flexibility allows them to swiftly adapt to market volatility and shifting consumer demands, underscoring the importance of adaptive capabilities in resilience strategies. Rather than relying on advanced infrastructure or external support, these regions draw strength from localized experimentation, proactive enterprise behavior, and growing integration with emerging service platforms. Their resilience emerges through continuous learning and adaptive adjustment under constrained conditions.
4.2.3. Integrative Analysis and Strategic Implications
This dimensional analysis emphasizes that service supply chain resilience is not a singular construct but a composite of interdependent dimensions. Provinces can strategically leverage their strengths in one dimension to compensate for weaknesses in others. For instance, Sichuan’s strength in market adaptation partially offsets its infrastructural deficits, while Beijing’s robust cost control mechanisms mitigate potential inefficiencies in resource coordination.
These insights reinforce the significance of adopting a configurational perspective to understand resilience comprehensively. Policymakers and managers should thus tailor resilience strategies to regional characteristics—capitalizing on dimension-specific strengths while systematically addressing structural and relational weaknesses. The following sections of this study apply fuzzy-set qualitative comparative analysis (fsQCA) to further explore these configurational dynamics and derive empirically informed pathways for enhancing regional resilience.
5. Improving Service Supply Chain Resilience and Pathways
5.1. Measurement and Calibration
Building on the previous analysis of the service supply chain resilience measurement results, this study further explores the matching relationship between the resilience development of the service supply chain and the dynamics of the overall environment. By aligning the resilience development of the service supply chain with the current environmental changes, the study aims to identify the optimal development path under existing environmental conditions. This process not only helps reveal the adaptive changes of the service supply chain in different scenarios but also provides theoretical support for further analysis and optimization of its resilience [61].
To quantify and analyze this matching relationship, the study adopts fuzzy-set qualitative comparative analysis (fsQCA), combining empirical data with a theoretical framework to explore the complex interaction mechanisms between service supply chain resilience and the regional environment. To assign membership degrees to both outcome and condition variables, the study employs the direct calibration method and transforms raw values into fuzzy scores ranging from 0 to 1. Calibration anchor points are set at the 0.95, 0.50, and 0.05 quantiles, representing full membership, crossover, and full non-membership, respectively.
These thresholds are widely adopted in fsQCA literature and ensure a clear distinction between full inclusion, full exclusion, and ambiguity zones [62,63]. The selected quantiles also align with the empirical distribution of the dataset, where extreme values are rare but theoretically meaningful. The calibration information for all variables is detailed in Table 7.
Table 7.
Calibration of conditions and results.
5.2. Necessity Analysis
The necessity test is crucial in identifying whether a certain condition is essential for the outcome to occur, providing insights into the minimum requirements for achieving service supply chain resilience. In this study, we conducted necessary condition analysis (NCA) for each variable using two estimation methods: ceiling regression (CR) and ceiling envelopment (CE). The effect size (d) was utilized to assess the significance of both the outcome and condition variables. The d value typically ranges from 0 to 1, where 0 ≤ d < 0.1 indicates a minimal impact, 0.1 ≤ d < 0.3 denotes a moderate impact, and 0.3 ≤ d < 0.5 signifies a substantial impact [63]. Furthermore, it is important to note that the reference significance result of the NCA analysis should have a p-value greater than 0.5.
Based on the effect size (d) results (Table 8), the significance of resource coherence and technological innovation under both methods reaches more than 90%, but the effect size d value is basically in the low-level influence interval. Although the industrial growth in efficiency optimization can have a high impact on the resilience development of the service supply chain, the significance under both methods is 0, which cannot prove its necessity under the NCA method. The remaining conditional variables also have the above characteristics more or less, so the conditional variables selected this time cannot independently constitute the necessary conditions for the development level of service supply chain resilience.
Table 8.
Analysis of necessary conditions.
5.3. Configuration Analysis
Building on the necessity analysis, this section applies fuzzy-set qualitative comparative analysis (fsQCA) to identify sufficient combinations of conditions that lead to high service supply chain resilience. Compared to variable-oriented techniques such as regression analysis, fsQCA was prioritized in this study because it better captures the configurational and conjunctural nature of service supply chain resilience. Resilience is not the result of any single factor but emerges from complex combinations of structural, relational, and behavioral conditions, which may vary across regional contexts. The asymmetric logic of fsQCA is particularly suited to this objective, as it allows for multiple, equally effective causal pathways and accommodates heterogeneity across cases. This approach aligns with the study’s goal of identifying distinct regional typologies, rather than estimating average effects.
Although the previous section has analyzed the necessary conditions for result occurrence, it is imperative to assess the adequacy of these results in determining the configuration path generated via the coordinated linkage of multiple factors.
Through the analysis conducted using fsQCA software (version 4.1), it was discovered that these diverse configurations represent different strategic approaches to achieve the same outcome, resulting in high levels of service supply chain resilience. In this experiment, the original consistency threshold and PRI consistency threshold were both set to 0.80, while the case frequency threshold was set to 1 [64]. By operating the configuration model, six conditional configurations with high levels of service supply chain resilience were identified. These findings offer a comprehensive perspective for exploring how to establish service supply chain resilience that aligns with the development of China’s service economy.
The analysis of the resilience configuration in high-level service supply chains reveals its inseparability from the rapid growth of China’s service economy (Table 9). The resulting configurations can be categorized into three types, namely A-B configuration, C-E configuration, and D-F configuration, representing “cost-adaptive,” “cost-growth,” and “technically-sustainable” types, respectively. It should be noted that these configurations are not mutually exclusive but, rather, highly correlated and mutually influential [65]. In the practical management of service supply chain resilience, different configuration characteristics may integrate and intertwine with each other, giving rise to a more complex and diversified modern mode of supply chain resilience. Therefore, functional departments within the relevant sectors of the service supply chain need to flexibly employ various strategies and methods based on their own business characteristics and market environment in order to establish their own high-level service supply chain resilience configurations.
Table 9.
Configuration to achieve a high level of service supply chain resilience.
5.3.1. “Cost-Adaptive” Type
This configuration is primarily relevant to the eastern region of China, particularly the northern and coastal provinces. Despite significant geographical variation, the eastern region consistently surpasses other areas in terms of time efficiency, cost control, and market responsiveness, as revealed by prior evaluations of service supply chain resilience across multiple dimensions. Its proximity to major consumer markets allows for easier access, shorter delivery cycles, and better alignment with shifting demand patterns.
Moreover, the region hosts several mature industrial and service clusters supported by advanced digital infrastructure, multimodal transport systems, and policy-driven coordination platforms. These agglomeration effects not only facilitate upstream–downstream collaboration but also foster rapid adjustments to cost or demand shocks. These features collectively enable the adoption of a “cost-adaptive” strategy that strengthens supply chain resilience in the face of volatility.
Interestingly, some provinces within this configuration—such as Jiangsu and Guangdong—exhibit relatively high levels of cost deviation. However, this should not be construed as inefficiency. In regions with robust institutional capacity, short-term cost increases often stem from deliberate resource mobilization strategies during periods of disruption, including emergency contracting, temporary platform expansion, and expedited service delivery [41]. These deviations are typically underpinned by strong fiscal reserves and administrative agility, enabling both governments and enterprises to absorb additional expenditures without jeopardizing service continuity.
This interpretation aligns with recent empirical research, which shows that well-managed slack resources can significantly enhance supply chain resilience by facilitating rapid and adaptive responses to uncertainty [20]. Within this context, cost deviation should be viewed not as a symptom of failure but as a functional buffer that reinforces operational flexibility and systemic robustness.
Nonetheless, it is important to recognize that an overemphasis on cost control—especially if decoupled from service quality and innovation—may erode long-term resilience. Strategic trade-offs must, therefore, be carefully calibrated to ensure that cost management efforts do not undermine service integrity or adaptive capacity over time.
5.3.2. “Cost-Growth” Type
This configuration primarily applies to the northern and southern regions of western China. These areas face persistent geographical challenges and lack robust transportation, digital, and service-sector infrastructure, which collectively limit supply chain connectivity and elevate operational costs. Their distance from China’s major consumer markets also results in higher service delivery expenses and delayed feedback cycles, further straining service responsiveness.
Moreover, the relatively sparse population and fragmented industrial base restrict the scale economies typically required for service supply chain resilience. While these regions may exhibit pockets of industrial expansion, the absence of institutional density and integrated service platforms constrains the development of more adaptive or cost-efficient models.
As a result, the only viable pathway for many western provinces appears to be the “cost-growth” configuration, which relies on high levels of public and private investment to improve resilience—through upgraded logistics, infrastructure renewal, technological inputs, and skill development. However, as implied by its name, this strategy is capital-intensive and yields diminishing returns in competitive markets, where high service costs may erode price advantages.
From a theoretical perspective, this outcome reflects the structural disadvantages of peripheral regions described in core–periphery models. While core regions possess the institutional and infrastructural resources to support multi-dimensional resilience with moderate cost, peripheral zones must trade off between survival and scalability. The “cost-growth” path thus emerges not from optimal efficiency but as a constrained adaptation under limited systemic support. It underscores how spatial inequality shapes not only the availability but also the cost and viability of different resilience configurations in service supply chains.
5.3.3. “Technologically-Sustainable” Type
This configuration is primarily associated with the central region of China, which exhibits moderate economic development but high innovation orientation. The region benefits from a relatively strong base of universities, digital service firms, and skilled professionals, fostering the integration of intelligent technologies—such as AI-powered service platforms, real-time coordination systems, and cloud-based management tools—into the service supply chain. These enable faster client responsiveness, more efficient service allocation, and improved capacity to absorb demand fluctuations, all of which contribute to resilient outcomes.
However, compared to eastern core regions, the central region still faces structural disadvantages in service accessibility and delivery efficiency. The relative scarcity of high-volume consumer hubs and limited national-level platform integration create frictions in service transmission and constrain economies of scale. To mitigate these challenges, local enterprises increasingly adopt digital optimization strategies, such as predictive scheduling, service modularization, and co-platform collaborations to reduce bottlenecks and enhance adaptability.
From a theoretical perspective, the central region exemplifies the position of a “semi-peripheral zone” within the core–periphery framework. While it does not fully benefit from the systemic advantages of eastern core regions, it remains significantly more institutionally equipped than western peripheries. This enables selective activation of technology-driven resilience, contingent on both internal innovation and contextual adaptation.
In this view, the technologically sustainable path is not solely the result of technological input but emerges from the interaction between digital capacity, institutional flexibility, and regional coordination mechanisms. It represents a pragmatic model of resilience in transitional zones, where service supply chains evolve through adaptive digitalization, rather than structural dominance.
5.4. Robustness Test
The configuration of service supply chain resilience may be sensitive to variations in sample size, parameter calibration, and consistency thresholds. To evaluate the robustness of the proposed configurations, the study applies the fsQCA model to 2022 data as a validation sample. First, when the minimum frequency threshold is raised from 1 to 2 cases [20], the resulting simple and intermediate solutions show negligible changes, and the composition of core conditions remains stable. Second, increasing the PRI consistency threshold from 0.80 to 0.85 yields similar outcomes with only minor adjustments in peripheral conditions [66]. These results suggest that the identified configurations are both reliable and replicable across datasets. The robustness of the model supports its practical applicability and enhances its value as a policy and management tool.
6. Discussion
6.1. Pathway Discussion
To evaluate the robustness and temporal validity of the configurational paths identified through fsQCA using 2021 data, this study conducts a follow-up empirical test with updated 2023 provincial data. Specifically, ordinary least squares (OLS) regression is employed to examine whether provinces that met each path’s configuration continue to exhibit significantly higher levels of service-sector resilience. By recoding each path into a binary variable that indicates whether a province satisfies all defined conditions, OLS provides a complementary lens to evaluate the average linear impact of path inclusion. This approach allows for a direct test of whether the fsQCA-derived configurations remain empirically relevant over time. To further illustrate the comparative performance of “In Path” and “Not in Path” provinces, boxplot visualizations are used to highlight differences in resilience score distributions. The following sections present both the statistical validation results and visual evidence based on the 2023 dataset.
This integration of configurational and variable-based methods reflects an effort to bridge theoretical sufficiency with empirical regularity. While fsQCA reveals how combinations of conditions are sufficient for high resilience in specific contexts, OLS examines whether these combinations maintain predictive validity across time and under evolving structural dynamics. This step is essential for evaluating not just whether configurations can lead to high resilience but also whether they consistently do so under changing economic conditions.
The OLS validation results (Table 10) indicate that, among the three configurational paths derived from the initial fsQCA analysis, only the cost-adaptive path demonstrates a statistically significant association with service-sector resilience (β = 4.329, p < 0.001, R2 = 0.448). This configuration, comprising high cost deviation, robust industrial growth, and strong development flexibility, reflects a province’s capacity to absorb external shocks while maintaining performance through adaptive economic and institutional mechanisms.
Table 10.
OLS summary table for path validation.
In contrast, neither the cost-growth path nor the tech-sustain path reaches statistical significance (p = 0.240 and p = 0.439, respectively). A plausible explanation for the lack of significance in the cost-growth path is that it reflects a pattern of inertial expansion. Although characterized by high growth, the combination of low cost pressure and limited adaptive flexibility may not yield sufficient resilience under volatile conditions. As for the tech-sustain path, its lack of statistical power may result from two primary factors. First, relatively few provinces simultaneously meet the stringent thresholds for cost deviation, resource coherence, and technological innovation, reducing the path’s empirical prevalence. Second, this configuration may primarily influence long-term structural resilience, which is not fully captured through the short-term service-sector metrics employed in this study.
These findings reaffirm the core principle of configurational theory, namely causal asymmetry, which holds that theoretically valid combinations may not uniformly translate into statistically significant effects across all empirical contexts. More importantly, the divergence in significance levels across paths highlights the necessity of interpreting path effectiveness with attention to contextual prevalence, temporal dynamics, and sample-specific characteristics. Future research could explore the conditional validity and long-term implications of these configurations by applying them across different time periods or within specific regional clusters.
To further examine the empirical differentiation between provinces that meet the cost-adaptive path criteria and those that do not, a boxplot was generated to visualize the distribution of service value-added scores across the two groups (Figure 2). This graphical representation complements the regression findings by offering a non-parametric comparison of central tendency and dispersion, thereby illustrating the practical implications of path inclusion more intuitively.
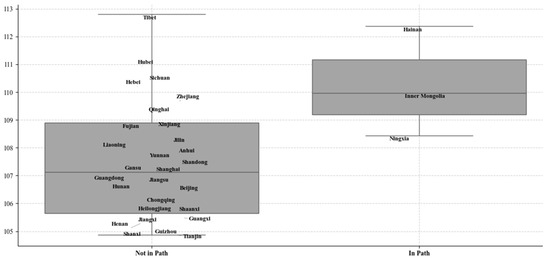
Figure 2.
Impact of cost-adaptive path on service-sector performance. Note: Gray lines represent boxplot whiskers indicating the data range.
An intriguing divergence emerges when comparing the spatial patterns of configurational paths identified in 2021 with the regression outcomes based on 2023 data. The fsQCA results from 2021 highlighted a cluster of resilient provinces primarily located in the northeastern and central regions of China—areas historically characterized by stable industrial systems and policy-driven adaptability. These provinces, despite facing cost volatility, exhibited strong recovery potential through structural stability and institutional responsiveness, thus aligning with the logic of the cost-adaptive path.
However, the 2023 OLS results present a markedly different spatial configuration. While Section 4.2 outlined the spatial clustering of resilience strengths by dimension, the 2023 OLS results reveal how these clusters have evolved into different statistical patterns. Provinces that now score higher in service-sector resilience and show stronger statistical alignment with the path variables are predominantly found in the more economically dynamic southeastern coastal regions. This shift may be attributed to two key factors. First, the temporal gap reflects a transformation in the underlying drivers of resilience: while structural cost adaptation was critical in the post-pandemic rebound of 2021, by 2023, resilience was increasingly shaped by digital integration, innovation capacity, and consumption upgrading—features more prevalent in the southeastern provinces. Second, the methodological difference between fsQCA and OLS must be acknowledged. While fsQCA identifies sufficiency-based configurations without requiring uniform statistical weight across all cases, OLS emphasizes average linear effects across the sample. Thus, provinces that once met all path conditions in 2021 may no longer exhibit consistent outcome dominance in 2023, and new provinces may emerge as stronger statistical contributors due to evolving regional strategies.
This temporal and spatial divergence underscores the need to interpret path effectiveness not as static truths but as context-contingent patterns that evolve with macroeconomic conditions and regional development trajectories. It also highlights the complementary value of using both configurational and regression-based methods to capture different dimensions of causal complexity. While fsQCA reveals conjunctural and asymmetric causal paths tailored to specific regional contexts, OLS provides a symmetric and generalizable assessment of their empirical validity. The fact that only one configuration—the cost-adaptive path—maintains statistical significance in the 2023 regression model reinforces the importance of assessing not just theoretical sufficiency but empirical stability. Together, these approaches offer a dual perspective that is essential for understanding how service supply chain resilience emerges and transforms within dynamic, uneven, and evolving policy landscapes.
6.2. Mechanism Discussion
The only validated configuration in this study, the cost-adaptive pathway, features the core presence of high cost deviation (1+) and rapid industrial growth (1+), the marginal presence of development flexibility (1), and the core absence of technological innovation (0+). At first glance, the inclusion of high cost deviation as a core condition in a resilient configuration appears counterintuitive. However, when situated within the structure–relationship–subject (SRS) framework and interpreted through institutional theory and configurational logic, this pattern reveals a mechanism of resilience through structural overload tolerance, economic compensation, and behavioral calibration.
From the structure dimension, the presence of high cost deviation reflects not dysfunction but absorptive elasticity, a system’s ability to reallocate and reconfigure fiscal flows in response to shocks. This aligns with the theory of structural overload tolerance in institutional economics, which holds that systems may endure and even thrive under conditions of frequent perturbation by developing internal buffering protocols and redundancy mechanisms. Rather than being destabilized by fiscal fluctuation, such systems transform volatility into an operational norm, with institutionalized improvisation becoming a resilience-enabling trait.
The co-presence of rapid industrial growth (1+) as a second core condition provides compensatory stabilization. Economic expansion offsets the risks introduced via fiscal variation, forming a self-reinforcing structural dynamic. This suggests that resilience may not emerge from cost minimization or efficiency optimization alone, but from the interaction of fiscal flexibility and macroeconomic momentum. As such, this finding supports the notion of productive disequilibrium, in which growth under uncertainty becomes a generative force, rather than a destabilizing one.
Crucially, the core absence of technological innovation (0+) challenges a foundational assumption in the supply chain resilience literature that digital capability is universally necessary for adaptive performance. In this configuration, technological absence does not hinder resilience but, rather, highlights the context-dependent irrelevance of innovation. This directly illustrates the principle of causal asymmetry in fsQCA. The presence or absence of a condition, such as technology, is neither universally sufficient nor necessary. Outcomes depend on how it interacts with other elements in a configuration. In structurally mature and economically inertial regions, technological advancement becomes sufficiently irrelevant. Its absence does not prevent high resilience due to the robustness of structural alternatives. This challenges universalist digital prescriptions and emphasizes the limitations of linear, input–output models of resilience.
Although not core, the subject dimension, represented by development flexibility, adds an agentic layer to this mechanism. Local actors, while structurally constrained, exercise adaptive discretion in reallocating resources or modifying service delivery priorities. This aligns with the theory of structurally conditioned agency, in which behavior is shaped by context yet retains transformative potential. Similarly, relational routines, though not formally coded in the model, likely undergird inter-organizational adjustments, service reprioritization, and trust-based coordination in high-deviation contexts, consistent with the relationship dimension of the SRS framework.
In sum, the validated configuration reveals a multidimensional mechanism of resilience through structural tolerance, economic reinforcement, and context-calibrated adaptation. Under the SRS lens, structure leads, but subject and relationship dynamics coalesce to stabilize the system in the absence of technological interventions. This underscores the configurational logic of fsQCA and advocates for a nuanced understanding of resilience as emergent from systemic interactions, not dictated by any singular causal imperative.
6.3. Development Discussion
As the preceding sections have demonstrated, resilience in service supply chains emerges from complex configurations of structural, relational, and subject-based conditions, rather than from any single dominant factor. While the cost-adaptive configuration proved to be the most robust pathway in 2021, its effectiveness must be interpreted within the specific institutional and post-pandemic context in which it occurred. Given the configurational and context-dependent nature of resilience, such pathways should not be treated as static equilibria. Instead, they represent transitional mechanisms that evolve in response to changing regional dynamics. The remainder of this section explores how the cost-adaptive configuration developed over time and across space, and proposes a conceptual model to interpret the bifurcation of regional resilience strategies.
To empirically examine how the cost-adaptive configuration evolved spatially in subsequent years, we compared the provincial significance patterns of this path between 2021 and 2023. The analysis indicates a notable geographical shift: provinces aligned with the cost-adaptive configuration transitioned from primarily eastern and coastal regions in 2021 toward central and western provinces, such as Inner Mongolia, Hainan, and Ningxia, in 2023. Although this analysis was limited specifically to the cost-adaptive path due to the statistical insignificance of other configurations in 2023, the regional shift observed still highlights important developmental dynamics. This spatial redistribution may signal not merely a diffusion of the mechanism but also its functional reconfiguration across varying institutional contexts. It further suggests divergent resilience strategies—some regions may use cost adaptation as a transitional platform for upgrading, while others remain constrained by structural rigidity. These patterns reinforce the need to conceptualize resilience configurations as evolving and context-contingent, rather than universally replicable.
Inspired by the theoretical perspective of regional development path divergence and grounded in the causal asymmetry logic of fsQCA, we introduce a “T-shaped” evolution model (Figure 3) to provide an intuitive framework for interpreting the bifurcation of regional resilience strategies. This model was constructed through a comparative analysis of provincial-level configurational alignments between 2021 and 2023, using fsQCA results to trace shifts in dominant resilience types over time. The “T” shape serves as a simplified yet analytically meaningful abstraction of these spatial transitions. Its horizontal axis represents the potential for institutional and technological upgrading, particularly in semi-peripheral regions with moderate reform capacity and emerging innovation ecosystems. In contrast, the vertical axis captures a fallback into cost-growth strategies in regions where adaptive flexibility has stagnated or technological investments have failed to deliver resilience dividends. As supported by the literature on service supply chain divergence and regional resilience differentiation [67,68,69], the model reflects both structural inertia and behavioral asymmetries. Grounded in the interactions discussed in Section 6.1 and Section 6.2, this visualization translates empirical complexity into a developmental logic that highlights the uneven and path-dependent nature of resilience formation under varied regional conditions.
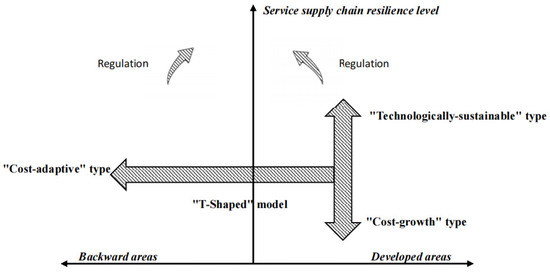
Figure 3.
Focalization of service supply chain resilience.
The horizontal transition—from a cost-adaptive to a technologically-sustainable configuration—appears to represent an upgrade-oriented trajectory. This pattern tends to emerge in central or semi-peripheral provinces where institutional capacity and digital infrastructure are gradually improving. In such contexts, resilience may evolve from a reliance on cost flexibility toward a more integrated strategy that incorporates technological capabilities and platform-based coordination. This shift could reflect a strategic advancement, whereby resilience is not only maintained through buffering mechanisms but also enhanced through digital intelligence, service innovation, and adaptive learning.
In contrast, the vertical transition—from cost-adaptive to cost-growth configurations—is more commonly observed in regions where adaptive capacities appear to have stagnated, or where fiscal volatility intensifies in the absence of institutional or behavioral upgrading. Rather than pursuing innovation-driven strategies, these provinces often resort to resource-intensification approaches, such as increased public investment, extended project cycles, and rigid administrative compensation. While such measures may temporarily sustain resilience indicators, they tend to yield diminishing returns, reduced systemic efficiency, and potential vulnerability under prolonged external pressure.
While the cost-growth configuration emerged as the only statistically validated pathway in 2023, this should not be interpreted as evidence that all regions necessarily evolve in this direction. Rather, it reflects the empirical difficulty of sustaining horizontal transitions toward technology-driven resilience, particularly in contexts where digital infrastructure remains underdeveloped or institutional support is fragmented. In such cases, the fallback into cost-based strategies may result less from deliberate policy choices and more from the structural limitations that hinder innovation-led upgrading. This suggests that the vertical trajectory may represent a reactive adaptation under constraint, rather than a sustainable developmental pathway.
From a policy standpoint, this bifurcation carries two critical implications. First, institutional regulation should be strategically applied to facilitate horizontal transitions—through targeted technology subsidies, platform integration initiatives, and the strengthening of regional innovation capacities—particularly in semi-developed areas. Second, early warning mechanisms must be established to detect vertical regressions, especially in regions exhibiting pronounced cost deviation without corresponding improvements in efficiency or behavioral adaptation. Without timely regulatory correction, such provinces risk falling into high-cost, low-return trajectories that erode the long-term foundations of resilience.
In sum, the evolution of service supply chain resilience between 2021 and 2023 reflects a non-linear, path-dependent transformation shaped by both regional endowments and policy scaffolding. The cost-adaptive configuration should not be viewed as a developmental endpoint, but rather as a hinge mechanism—a transitional platform from which regions may either advance toward sustainable, technology-integrated resilience or regress into unsustainable fiscal expansion. Recognizing this bifurcation is essential for designing differentiated and forward-looking resilience strategies within China’s evolving service economy.
7. Conclusions
7.1. Theoretical and Methodological Contributions
This study explores the formation mechanisms of service supply chain resilience (SSCR) in the context of China’s regionally heterogeneous development. By constructing a multidimensional evaluation framework based on the structure–relationship–subject (SRS) model, the research integrates structural, relational, and behavioral indicators to measure resilience across 31 provinces. Using a mixed-method strategy that combines entropy weighting, fuzzy-set qualitative comparative analysis (fsQCA), necessary condition analysis (NCA), and OLS validation, the study identifies multiple sufficient configurations that lead to high resilience performance.
The configurational results reveal that no single condition guarantees resilience. Instead, three distinct pathways emerge: cost-adaptive, cost-growth, and tech-sustain. Among them, only the cost-adaptive configuration demonstrates statistical significance in the OLS validation, suggesting that resilience is most robust when regions combine cost efficiency with industrial flexibility and institutional adaptability. Robustness tests using 2022 and 2023 data confirm the temporal stability and policy relevance of these configurations.
Theoretically, this research contributes by conceptualizing resilience as a conjunctural and context-sensitive outcome, challenging linear or single-factor explanations. Methodologically, it offers a replicable framework for analyzing complex regional systems through fsQCA and longitudinal validation. Practically, it provides targeted insights for resilience-building strategies, especially in less-developed regions constrained due to their institutional and financial capacity.
7.2. Policy and Managerial Implications
Beyond its academic contributions, the findings hold significant implications for regional policy design and enterprise-level strategy. While only the cost-adaptive path demonstrated statistical significance in the OLS validation, all three configurations identified through fsQCA reflect meaningful causal structures that support differentiated resilience-building strategies based on contextual conditions.
For provinces aligned with the cost-adaptive path—typically economically advanced regions—policymakers should focus on maintaining institutional flexibility and fiscal responsiveness to enable agile resource reallocation. Efficiency safeguards and cross-sector coordination mechanisms are essential to sustaining adaptive capacity under volatility. The statistical robustness of this path suggests it may serve as the most scalable and transferable model for other regions, provided institutional readiness exists.
For regions following the cost-growth path, often located in structurally disadvantaged or inland areas, continued public investment remains vital. However, this approach must be complemented by capacity-building initiatives aimed at improving financial governance and coordination efficiency. While this configuration did not yield statistically significant results in OLS, its sufficiency in the fsQCA model indicates that it may be a viable transitional strategy for underdeveloped regions with limited industrial flexibility. In such contexts, the emphasis should be placed on gradually transforming investment-heavy structures into more efficiency-oriented systems.
For central provinces exhibiting the technologically sustainable path, policy priorities should include accelerating digital infrastructure deployment, fostering inter-regional platform collaborations, and providing service-sector innovation incentives. Although this path lacks robust linear correlation with overall resilience scores in the OLS results, it offers a specialized solution for regions with intermediate development levels and strong innovation potential. Policymakers should recognize that technology-led resilience may require longer gestation periods and enabling ecosystems to become fully effective.
From a managerial standpoint, service firms must align their resilience strategies with the dominant configuration of their local environment—whether emphasizing cost management, digital integration, or adaptive learning. Recognizing these spatially embedded patterns is essential for aligning firm-level risk management with broader regional dynamics.
Author Contributions
Conceptualization, Z.C.; data curation, Z.C.; formal analysis, Z.C.; writing—original draft preparation, Z.C.; writing—review and editing, M.I.S.; supervision, M.I.S. All authors contributed to the study conception and design. All authors have read and agreed to the published version of the manuscript.
Funding
This research received no external funding.
Institutional Review Board Statement
Not applicable.
Informed Consent Statement
Not applicable.
Data Availability Statement
The data supporting the findings of this study are available upon request from the corresponding author, subject to privacy and ethical restrictions. Due to these restrictions, the data cannot be publicly accessed.
Conflicts of Interest
We have no conflicts of interest to report.
References
- Ivanov, D.; Dolgui, A.; Blackhurst, J.V.; Boylan, J.E.; Sethi, S.P. Toward Supply Chain Viability Theory: From Lessons Learned through COVID-19 Pandemic to Viable Ecosystems. Int. J. Prod. Res. 2023, 61, 2402–2415. [Google Scholar] [CrossRef]
- Atkins, R.; Gianiodis, P. An Investigation at the Intersection of the Sharing Economy and Supply Chain Management: A Strategic Perspective. Int. J. Logist. Res. Appl. 2022, 25, 1425–1443. [Google Scholar] [CrossRef]
- Stentoft, J.; Mikkelsen, O.S. Towards Supply Chain Resilience: A Structured Process Approach. Oper. Manag. Res. 2024, 17, 1421–1443. [Google Scholar] [CrossRef]
- Roscoe, S.; Aktas, E.; Petersen, K.J.; Skipworth, H.D.; Handfield, R.B.; Habib, F. Redesigning Global Supply Chains during Compounding Geopolitical Disruptions: The Role of Supply Chain Logics. Int. J. Oper. Prod. Manag. 2022, 42, 1407–1434. [Google Scholar] [CrossRef]
- Singh, R.K.; Modgil, S. Adapting to Disruption: The Impact of Agility, Absorptive Capacity and Ambidexterity on Supply Chain Resilience. Int. J. Product. Perform. Manag. 2024, 74, 637–658. [Google Scholar] [CrossRef]
- Zhang, Z.; Jin, J.; Li, S.; Zhang, Y. Digital Transformation of Incumbent Firms from the Perspective of Portfolios of Innovation. Technol. Soc. 2023, 72, 102149. [Google Scholar] [CrossRef]
- Atieh Ali, A.A.; Sharabati, A.A.; Allahham, M.; Alhawamdeh, H.; Tarhini, A. The Relationship between Supply Chain Resilience and Digital Supply Chain and the Impact on Sustainability: Supply Chain Dynamism as a Moderator. Sustainability 2024, 16, 3082. [Google Scholar] [CrossRef]
- Dong, H.H.; Yong, C.C.; Yong, S.L. The Determinants of China’s Services Trade. Chin. Econ. 2023, 56, 182–193. [Google Scholar] [CrossRef]
- Alexandro, R.; Basrowi, B. The Influence of Macroeconomic Infrastructure on Supply Chain Smoothness and National Competitiveness and Its Implications on a Country’s Economic Growth: Evidence from BRICS Countries. Uncert. Supply Chain Manag. 2024, 12, 167–180. [Google Scholar] [CrossRef]
- Ye, F.; Ke, M.; Ouyang, Y.; Li, Y.; Li, L.; Zhan, Y.; Zhang, M. Impact of Digital Technology Usage on Firm Resilience: A Dynamic Capability Perspective. Supply Chain Manag. Int. J. 2024, 29, 162–175. [Google Scholar] [CrossRef]
- Apasrawirote, D.; Yawised, K. The Emerging of Business Resilience Plans (BRPs) in Dealing with Business Turbulence. Manag. Res. Rev. 2024, 47, 141–161. [Google Scholar] [CrossRef]
- Cheng, T.; Zhao, Y.; Zhao, C. What Determines the Economic Resilience of Chinese Cities amid Pandemic Crisis: An Economic Operating State Perspective. Int. J. Disaster Risk Reduct. 2024, 104, 104389. [Google Scholar] [CrossRef]
- Suali, A.S.; Srai, J.S.; Tsolakis, N. The Role of Digital Platforms in E-Commerce Food Supply Chain Resilience under Exogenous Disruptions. Supply Chain Manag. Int. J. 2024, 29, 573–601. [Google Scholar] [CrossRef]
- Ivanov, D. Two Views of Supply Chain Resilience. Int. J. Prod. Res. 2024, 62, 4031–4045. [Google Scholar] [CrossRef]
- Pettit, T.J.; Croxton, K.L.; Fiksel, J. Ensuring Supply Chain Resilience: Development and Implementation of an Assessment Tool. J. Bus. Logist. 2013, 34, 46–76. [Google Scholar] [CrossRef]
- Atadoga, A.; Osasona, F.; Amoo, O.O.; Farayola, O.A.; Ayinla, B.S.; Abrahams, T.O. The Role of IT in Enhancing Supply Chain Resilience: A Global Review. Int. J. Manag. Entrepren. Res. 2024, 6, 336–351. [Google Scholar] [CrossRef]
- Amico, A.; Verginer, L.; Casiraghi, G.; Vaccario, G.; Schweitzer, F. Adapting to Disruptions: Managing Supply Chain Resilience through Product Rerouting. Sci. Adv. 2024, 10, eadj1194. [Google Scholar] [CrossRef]
- Huang, A.; Farboudi Jahromi, M. Resilience Building in Service Firms during and Post COVID-19. Serv. Ind. J. 2021, 41, 138–167. [Google Scholar] [CrossRef]
- Fornasiero, R.; Tolio, T.A.M. Digital Supply Chains for Ecosystem Resilience: A Framework for the Italian Case. Oper. Manag. Res. 2024, 17, 1–16. [Google Scholar] [CrossRef]
- Shi, J.; Wu, S.; Cao, W. Slack Resources and Corporate Supply Chain Resilience: An Empirical Study Based on A-Share Listed Companies. In Proceedings of the 2024 2nd International Conference on Digital Economy and Management Science (CDEMS 2024), Wuhan, China, 26–28 April 2024; Atlantis Press: Paris, France, 2024; pp. 481–486. [Google Scholar] [CrossRef]
- Vrijhoef, R.; Koskela, L. The Four Roles of Supply Chain Management in Construction. Eur. J. Purch. Supply Manag. 2000, 6, 169–178. [Google Scholar] [CrossRef]
- Boddy, D.; Macbeth, D.; Wagner, B. Implementing Collaboration between Organizations: An Empirical Study of Supply Chain Partnering. J. Manag. Stud. 2000, 37, 1003–1018. [Google Scholar] [CrossRef]
- Jüttner, U.; Peck, H.; Christopher, M. Supply Chain Risk Management: Outlining an Agenda for Future Research. Int. J. Logist. Res. Appl. 2003, 6, 197–210. [Google Scholar] [CrossRef]
- Peck, H. Drivers of Supply Chain Vulnerability: An Integrated Framework. Int. J. Phys. Distrib. Logist. Manag. 2005, 35, 210–232. [Google Scholar] [CrossRef]
- Manyena, S.B. The Concept of Resilience Revisited. Disasters 2006, 30, 434–450. [Google Scholar] [CrossRef]
- Pettit, T.J. Supply Chain Resilience: Development of a Conceptual Framework, an Assessment Tool and an Implementation Process. Ph.D. Thesis, The Ohio State University, Columbus, OH, USA, 2008. [Google Scholar]
- Ponomarov, S.Y.; Holcomb, M.C. Understanding the Concept of Supply Chain Resilience. Int. J. Logist. Manag. 2009, 20, 124–143. [Google Scholar] [CrossRef]
- Ponis, S.T.; Koronis, E. Supply Chain Resilience? Definition of Concept and Its Formative Elements. J. Appl. Bus. Res. 2012, 28, 921–935. [Google Scholar] [CrossRef]
- Tukamuhabwa, B.R.; Stevenson, M.; Busby, J.; Zorzini, M. Supply Chain Resilience: Definition, Review and Theoretical Foundations for Further Study. Int. J. Prod. Res. 2015, 53, 5592–5623. [Google Scholar] [CrossRef]
- Ribeiro, J.P.; Barbosa-Povoa, A. Supply Chain Resilience: Definitions and Quantitative Modelling Approaches–A Literature Review. Comput. Ind. Eng. 2018, 115, 109–122. [Google Scholar] [CrossRef]
- Adobor, H. Supply Chain Resilience: An Adaptive Cycle Approach. Int. J. Logist. Manag. 2020, 31, 443–463. [Google Scholar] [CrossRef]
- Shishodia, A.; Sharma, R.; Rajesh, R.; Munim, Z.H. Supply Chain Resilience: A Review, Conceptual Framework and Future Research. Int. J. Logist. Manag. 2023, 34, 879–908. [Google Scholar] [CrossRef]
- Dolgui, A.; Ivanov, D.; Sokolov, B. Reconfigurable Supply Chain: The X-Network. Int. J. Prod. Res. 2020, 58, 4138–4163. [Google Scholar] [CrossRef]
- Dubey, R.; Gunasekaran, A.; Childe, S.J.; Fosso Wamba, S.; Roubaud, D.; Foropon, C. Empirical Investigation of Data Analytics Capability and Organizational Flexibility as Complements to Supply Chain Resilience. Int. J. Prod. Res. 2021, 59, 110–128. [Google Scholar] [CrossRef]
- Gattorna, J.; Ellis, D. The Impact on Supply Chain Networks of Shifting Demand and Supply Dynamics. In Global Logistics and Supply Chain Strategies for the 2020s: Vital Skills for the Next Generation; Springer: Cham, Switzerland, 2022; pp. 29–48. [Google Scholar] [CrossRef]
- Roblek, V.; Dimovski, V. Essentials of ‘the Great Reset’ through Complexity Matching. Systems 2024, 12, 182. [Google Scholar] [CrossRef]
- Zhang, D.; Turan, H.H.; Sarker, R.; Essam, D. Integrating Production, Replenishment and Fulfillment Decisions for Supply Chains: A Target-Based Robust Optimisation Approach. Int. J. Prod. Res. 2024, 62, 4494–4529. [Google Scholar] [CrossRef]
- Proselkov, Y.; Zhang, J.; Xu, L.; Hofmann, E.; Choi, T.Y.; Rogers, D.; Brintrup, A. Financial Ripple Effect in Complex Adaptive Supply Networks: An Agent-Based Model. Int. J. Prod. Res. 2024, 62, 823–845. [Google Scholar] [CrossRef]
- Scholten, K.; Schilder, S. The Role of Collaboration in Supply Chain Resilience. Supply Chain Manag. Int. J. 2015, 20, 471–484. [Google Scholar] [CrossRef]
- Chen, Y.; Chan, H.K.; Cai, Z. Towards a Theoretical Framework of Co-Development in Supply Chains: Role of Platform Affordances and Supply Chain Relationship Capital. J. Bus. Ind. Mark. 2024, 39, 1029–1045. [Google Scholar] [CrossRef]
- Tang, C.S. Perspectives in Supply Chain Risk Management. Int. J. Prod. Econ. 2006, 103, 451–488. [Google Scholar] [CrossRef]
- Banerjee, B. Cost Accounting: Theory and Practice; PHI Learning Pvt. Ltd.: New Delhi, India, 2021. [Google Scholar]
- Riduwan, S.P.; Witjaksana, B.; Tjendani, H.T. Cost and Time Analysis Using Earned Value Method in the Construction of Sports Facilities in Kecamatan Kedewan Kabupaten Bojonegoro. Asian J. Eng. Soc. Health 2023, 2, 1604–1652. [Google Scholar] [CrossRef]
- Hägele, S.; Grosse, E.H.; Ivanov, D. Supply Chain Resilience: A Tertiary Study. Int. J. Integr. Supply Manag. 2023, 16, 52–81. [Google Scholar] [CrossRef]
- Ali, M.H.; Suleiman, N.; Khalid, N.; Tan, K.H.; Tseng, M.-L.; Kumar, M. Supply Chain Resilience Reactive Strategies for Food SMEs in Coping to COVID-19 Crisis. Trends Food Sci. Technol. 2021, 109, 94–102. [Google Scholar] [CrossRef] [PubMed]
- Yaroson, E.V.; Breen, L.; Hou, J.; Sowter, J. Advancing the Understanding of Pharmaceutical Supply Chain Resilience Using Complex Adaptive System (CAS) Theory. Supply Chain Manag. Int. J. 2021, 26, 323–340. [Google Scholar] [CrossRef]
- Zhang, Y.; Dilanchiev, A. Economic Recovery, Industrial Structure and Natural Resource Utilization Efficiency in China: Effect on Green Economic Recovery. Resour. Policy 2022, 79, 102958. [Google Scholar] [CrossRef]
- Zhu, L.; Luo, J.; Dong, Q.; Zhao, Y.; Wang, Y.; Wang, Y. Green Technology Innovation Efficiency of Energy-Intensive Industries in China from the Perspective of Shared Resources: Dynamic Change and Improvement Path. Technol. Forecast. Soc. Change 2021, 170, 120890. [Google Scholar] [CrossRef]
- Pedersen, T.; Scedrova, A.; Grecu, A. The Effects of IT Investments and Skilled Labor on Firms’ Value Added. Technovation 2022, 116, 102479. [Google Scholar] [CrossRef]
- Flyvbjerg, B.; Bester, D.W. The Cost-Benefit Fallacy: Why Cost-Benefit Analysis Is Broken and How to Fix It. J. Benefit-Cost Anal. 2021, 12, 395–419. [Google Scholar] [CrossRef]
- Rahmani, A.; Mashayekh, J.; Aboojafari, R.; Bazyar, A. Determinants of Households’ Intention for Investment in Renewable Energy Projects. Renew. Energy 2023, 205, 823–837. [Google Scholar] [CrossRef]
- Enongene, B.E. Structural Transformation and Poverty Alleviation in Sub-Saharan Africa Countries: Sectoral Value-Added Analysis. J. Bus. Socio-Econ. Dev. 2024, 4, 326–339. [Google Scholar] [CrossRef]
- Zhibiao, L.; Yonghui, L. Structural Transformation, TFP and High-Quality Development. China Econ. 2022, 17, 70–82. [Google Scholar] [CrossRef]
- Margarian, A.; Hundt, C. One Economy, but Different Growth Regimes: Why Germany’s Rural East Is Still Lagging. Compet. Rev. 2023, 33, 1–21. [Google Scholar] [CrossRef]
- Husain, Z.; Dayan, B.; Chaudhry, I.S. Roles of Organizational Flexibility and Organizational Support on Service Innovation via Organizational Learning–A Moderated Mediation Model. J. Open Innov. Technol. Mark. Complex. 2024, 10, 100367. [Google Scholar] [CrossRef]
- Nair, A.J.; Manohar, S.; Mittal, A. Why Enhanced Service Productivity a Catalyst for Transformation? Optimizing Efficiency with Flexible Service Business Models. Int. J. Prod. Perform. Manag. 2025; in press. [Google Scholar] [CrossRef]
- Sichoongwe, K. Is It Time for Malawi to Change Its Economic Growth Engine? Evidence from New Structural Economics. J. Manag. Small Medium Enterp. 2023, 15, 83–494. [Google Scholar] [CrossRef]
- Haouas, A.; Lin, J.Y. The Failure of Algeria’s Industrialization Strategy, 1967–1989: A New Structural Economics Perspective. Rev. Hist. Ind.-Ind. Hist. Rev. 2024, 33, 11–40. [Google Scholar] [CrossRef]
- Chen, M.; Chen, Y.; Liu, H.; Xu, H. Influence of Information Technology Capability on Service Innovation in Manufacturing Firms. Ind. Manag. Data Syst. 2021, 121, 173–191. [Google Scholar] [CrossRef]
- Li, J.; Chen, L.; Chen, Y.; He, J. Digital Economy, Technological Innovation, and Green Economic Efficiency—Empirical Evidence from 277 Cities in China. Manag. Decis. Econ. 2022, 43, 616–629. [Google Scholar] [CrossRef]
- Chew, X.; Tiberius, V.; Alnoor, A.; Camilleri, M.; Khaw, K.W. The Dark Side of Metaverse: A Multi-Perspective of Deviant Behaviors from PLS-SEM and fsQCA Findings. Int. J. Hum. Comput. Interact. 2025, 41, 3128–3148. [Google Scholar] [CrossRef]
- Xia, Q.; Xie, Y.; Hu, S.; Song, J. Exploring How Entrepreneurial Orientation Improves Firm Resilience in Digital Era: Findings from Sequential Mediation and FsQCA. Eur. J. Innov. Manag. 2024, 27, 96–122. [Google Scholar] [CrossRef]
- Zhang, J.; Yang, Z.; Zhang, X.; Sun, J.; He, B. Institutional Configuration Study of Urban Green Economic Efficiency–Analysis Based on fsQCA and NCA. Pol. J. Environ. Stud. 2025, 34, 1457–1467. [Google Scholar] [CrossRef]
- Kumar, S.; Sahoo, S.; Ali, F.; Cobanoglu, C. Rise of fsQCA in Tourism and Hospitality Research: A Systematic Literature Review. Int. J. Contemp. Hosp. Manag. 2024, 36, 2165–2193. [Google Scholar] [CrossRef]
- Scharfbillig, M.; Cieciuch, J.; Davidov, E. One and the Same? How Similar Are Basic Human Values and Economic Preferences. PLoS ONE 2024, 19, e0296852. [Google Scholar] [CrossRef]
- Fan, X.; Li, J.; Wang, Y. The Driving Factors of Innovation Quality of Agricultural Enterprises—A Study Based on NCA and FSQCA Methods. Sustainability 2023, 15, 1809. [Google Scholar] [CrossRef]
- Lin, Y.; Chen, A.; Zhong, S.; Giannikas, V.; Lomas, C.; Worth, T. Service Supply Chain Resilience: A Social-Ecological Perspective on Last-Mile Delivery Operations. Int. J. Oper. Prod. Manag. 2023, 43, 140–165. [Google Scholar] [CrossRef]
- Nikookar, E.; Stevenson, M.; Varsei, M. Building an Antifragile Supply Chain: A Capability Blueprint for Resilience and Post-Disruption Growth. J. Supply Chain Manag. 2024, 60, 13–31. [Google Scholar] [CrossRef]
- Leyshon, A. Economic Geography I: Uneven Development, ‘Left Behind Places’ and ‘Levelling Up’ in a Time of Crisis. Prog. Hum. Geogr. 2021, 45, 1678–1691. [Google Scholar] [CrossRef]
Disclaimer/Publisher’s Note: The statements, opinions and data contained in all publications are solely those of the individual author(s) and contributor(s) and not of MDPI and/or the editor(s). MDPI and/or the editor(s) disclaim responsibility for any injury to people or property resulting from any ideas, methods, instructions or products referred to in the content. |
© 2025 by the authors. Licensee MDPI, Basel, Switzerland. This article is an open access article distributed under the terms and conditions of the Creative Commons Attribution (CC BY) license (https://creativecommons.org/licenses/by/4.0/).