Abstract
The reduction of environmental pollutant emissions—including greenhouse gases, particulate matter, and other harmful substances—represents one of the foremost challenges in climate policy, economics, and industrial management today. Excessive emissions of CO2, NOX, and suspended particulates exert significant impacts on climate change as well as human health and welfare. Consequently, numerous studies and regulatory and technological initiatives are underway to mitigate these emissions. One critical area is intra-plant transport within manufacturing facilities, which, despite its localized scope, can substantially contribute to a company’s total emissions. This paper aims to assess the potential of computer simulation using FlexSim software as a decision-support tool for planning inter-operational transport, with a particular focus on environmental aspects. The study analyzes real operational data from a selected production plant (case study), concentrating on the optimization of the number of transport units, their routing, and the layout of workstations. It is hypothesized that reducing the number of trips, shortening transport routes, and efficiently utilizing transport resources can lead to lower emissions of carbon dioxide (CO2) and nitrogen oxides (NOX). The findings provide a basis for a broader adoption of digital tools in sustainable production planning, emphasizing the integration of environmental criteria into decision-making processes. Furthermore, the results offer a foundation for future analyses that consider the development of green transport technologies—such as electric and hydrogen-powered vehicles—in the context of their implementation in the internal logistics of manufacturing enterprises.
1. Introduction
The reduction of emissions of pollutants released into the environment represents a significant issue both in terms of theoretical analyses and practical investigations. Excessive emissions contribute to anthropogenic climate change [1,2], and for this reason, legal and organizational measures aimed at their reduction are being implemented. Research on emissions of greenhouse gases, nitrogen oxides, and other pollutants is conducted from the perspective of various economic sectors. Such studies may concern manufacturing enterprises—among others, the metallurgical, power generation, and mining industries, as well as agriculture and others [3,4,5,6,7,8,9,10,11,12,13]—as well as different modes and means of transport [14,15,16,17,18,19]. In emission analyses, a wider range of harmful substances is also recorded—including CO2, CH4, N2O, NH3, NMVOCs (Non-Methane Volatile Organic Compounds), CO, NO, and particulate matter PM2.5 and PM10—depending on the sector under investigation [7,8,9,11,13].
The growth of global trade and the intensification of resource flows may contribute to the lowering of environmental standards, which underscores the importance of promoting coordinated and sustainable development [5].
The issue of emissions of gases and particulate pollutants into the air by manufacturing enterprises (SO2, CO, NOX, PM10) pertains not only to a quantitative determination of these emissions’ concentrations but also highlights gaps in a fair and comprehensive method for assessing the environmental impact of emissions [3]. Ongoing studies focus on the dependence of emissions on season (summer, winter), reporting that NOX concentrations exceed limits in winter, whereas simulated values of SO2, CO, and PM10 remain within permissible ranges [4]. Researchers also examine the concept of “pollution havens” for CO2, SO2, and NOX, highlighting how the liberalization of trade and investment can contribute to the relocation of pollution-intensive industries across countries and sectors [5]. Recent studies have investigated the role of international trade as a driver of increasing global pollutant emissions, including both gaseous and particulate matter [5,6]. Within this research framework, major emitting countries are identified and subsequently classified into clusters based on the intensity and composition of their atmospheric emissions [5,7].
Air pollution is a matter of great concern among researchers worldwide [1,2,3,4,5,6,7,8,9,10,11,12,13,14,20]. Various methods for cost estimation and analysis are being promoted [7,8,9,10,13], and appropriate regulations are adopted, underscoring that this topic remains highly relevant for the management and reduction of harmful substance emissions into the environment. Air quality plays a crucial role in climate policy and carries significant implications for human health [9,12,13,20], as well as for food security [12].
In this study, the scope of analysis was limited to the possibilities for reducing emissions of harmful substances originating from on-site transport vehicles. However, one must also take into account other modes of transport—namely road transport [1,11,14] and air transport [2]—which likewise contribute to environmental emissions. In the scientific literature on transport, attention is drawn to the growing vehicle population [11,14] as well as to the potential for substituting conventional vehicles with electric ones [11]. Eco-driving is also advocated, as it can yield substantial reductions in both fuel consumption and pollutant emissions. When considering eco-driving, emphasis is placed on the mitigation of greenhouse gases produced by passenger cars and other vehicles [14,15,16,17,18,19]. Eco-driving offers benefits in terms of both environmental impact and fuel efficiency [15], which underscores the importance of integrating driver education on this subject. At present, vehicle-generated emissions can be monitored in real time, and a digital-twin approach enhanced with virtual reality (VR) has been proposed for on-road emissions monitoring, alongside eco-oriented route-planning strategies [16]. Traffic signals—integral to the movement of drivers and the transport of goods—often induce engine idling, and subsequent acceleration events increase CO2 emissions; accordingly, effective speed-control and driving-behavior strategies have been recommended [17].
In the context of reducing emissions of harmful substances into the environment, attention is drawn to the use of hydrogen technologies. Hydrogen fuel reduces the emission of environmental pollutants, particularly in the transport sector [19]. Hydrogen is regarded as an energy carrier, an energy-storage medium, and a fuel offering zero-emission solutions [21,22]. Green modes of transport should be adopted more widely, as they significantly curb the release of harmful substances [19,23]. Although this form of transport has grown in recent years, a lack of necessary infrastructure and high vehicle costs remain concerns [24]. The proper management of supply chains and the integration of delivery networks also emerge as strategies that can contribute to emission reductions [25,26,27,28,29].
Measurements and the monitoring of pollutants inform research and analyses aimed at proposing targeted measures to limit emissions into the environment. A review of selected research directions in emission reduction is summarized in Table 1, which covers both emissions issues in industry and in the broader transport sector.

Table 1.
Emissions of pollutants into the environment—a review of selected scientific studies.
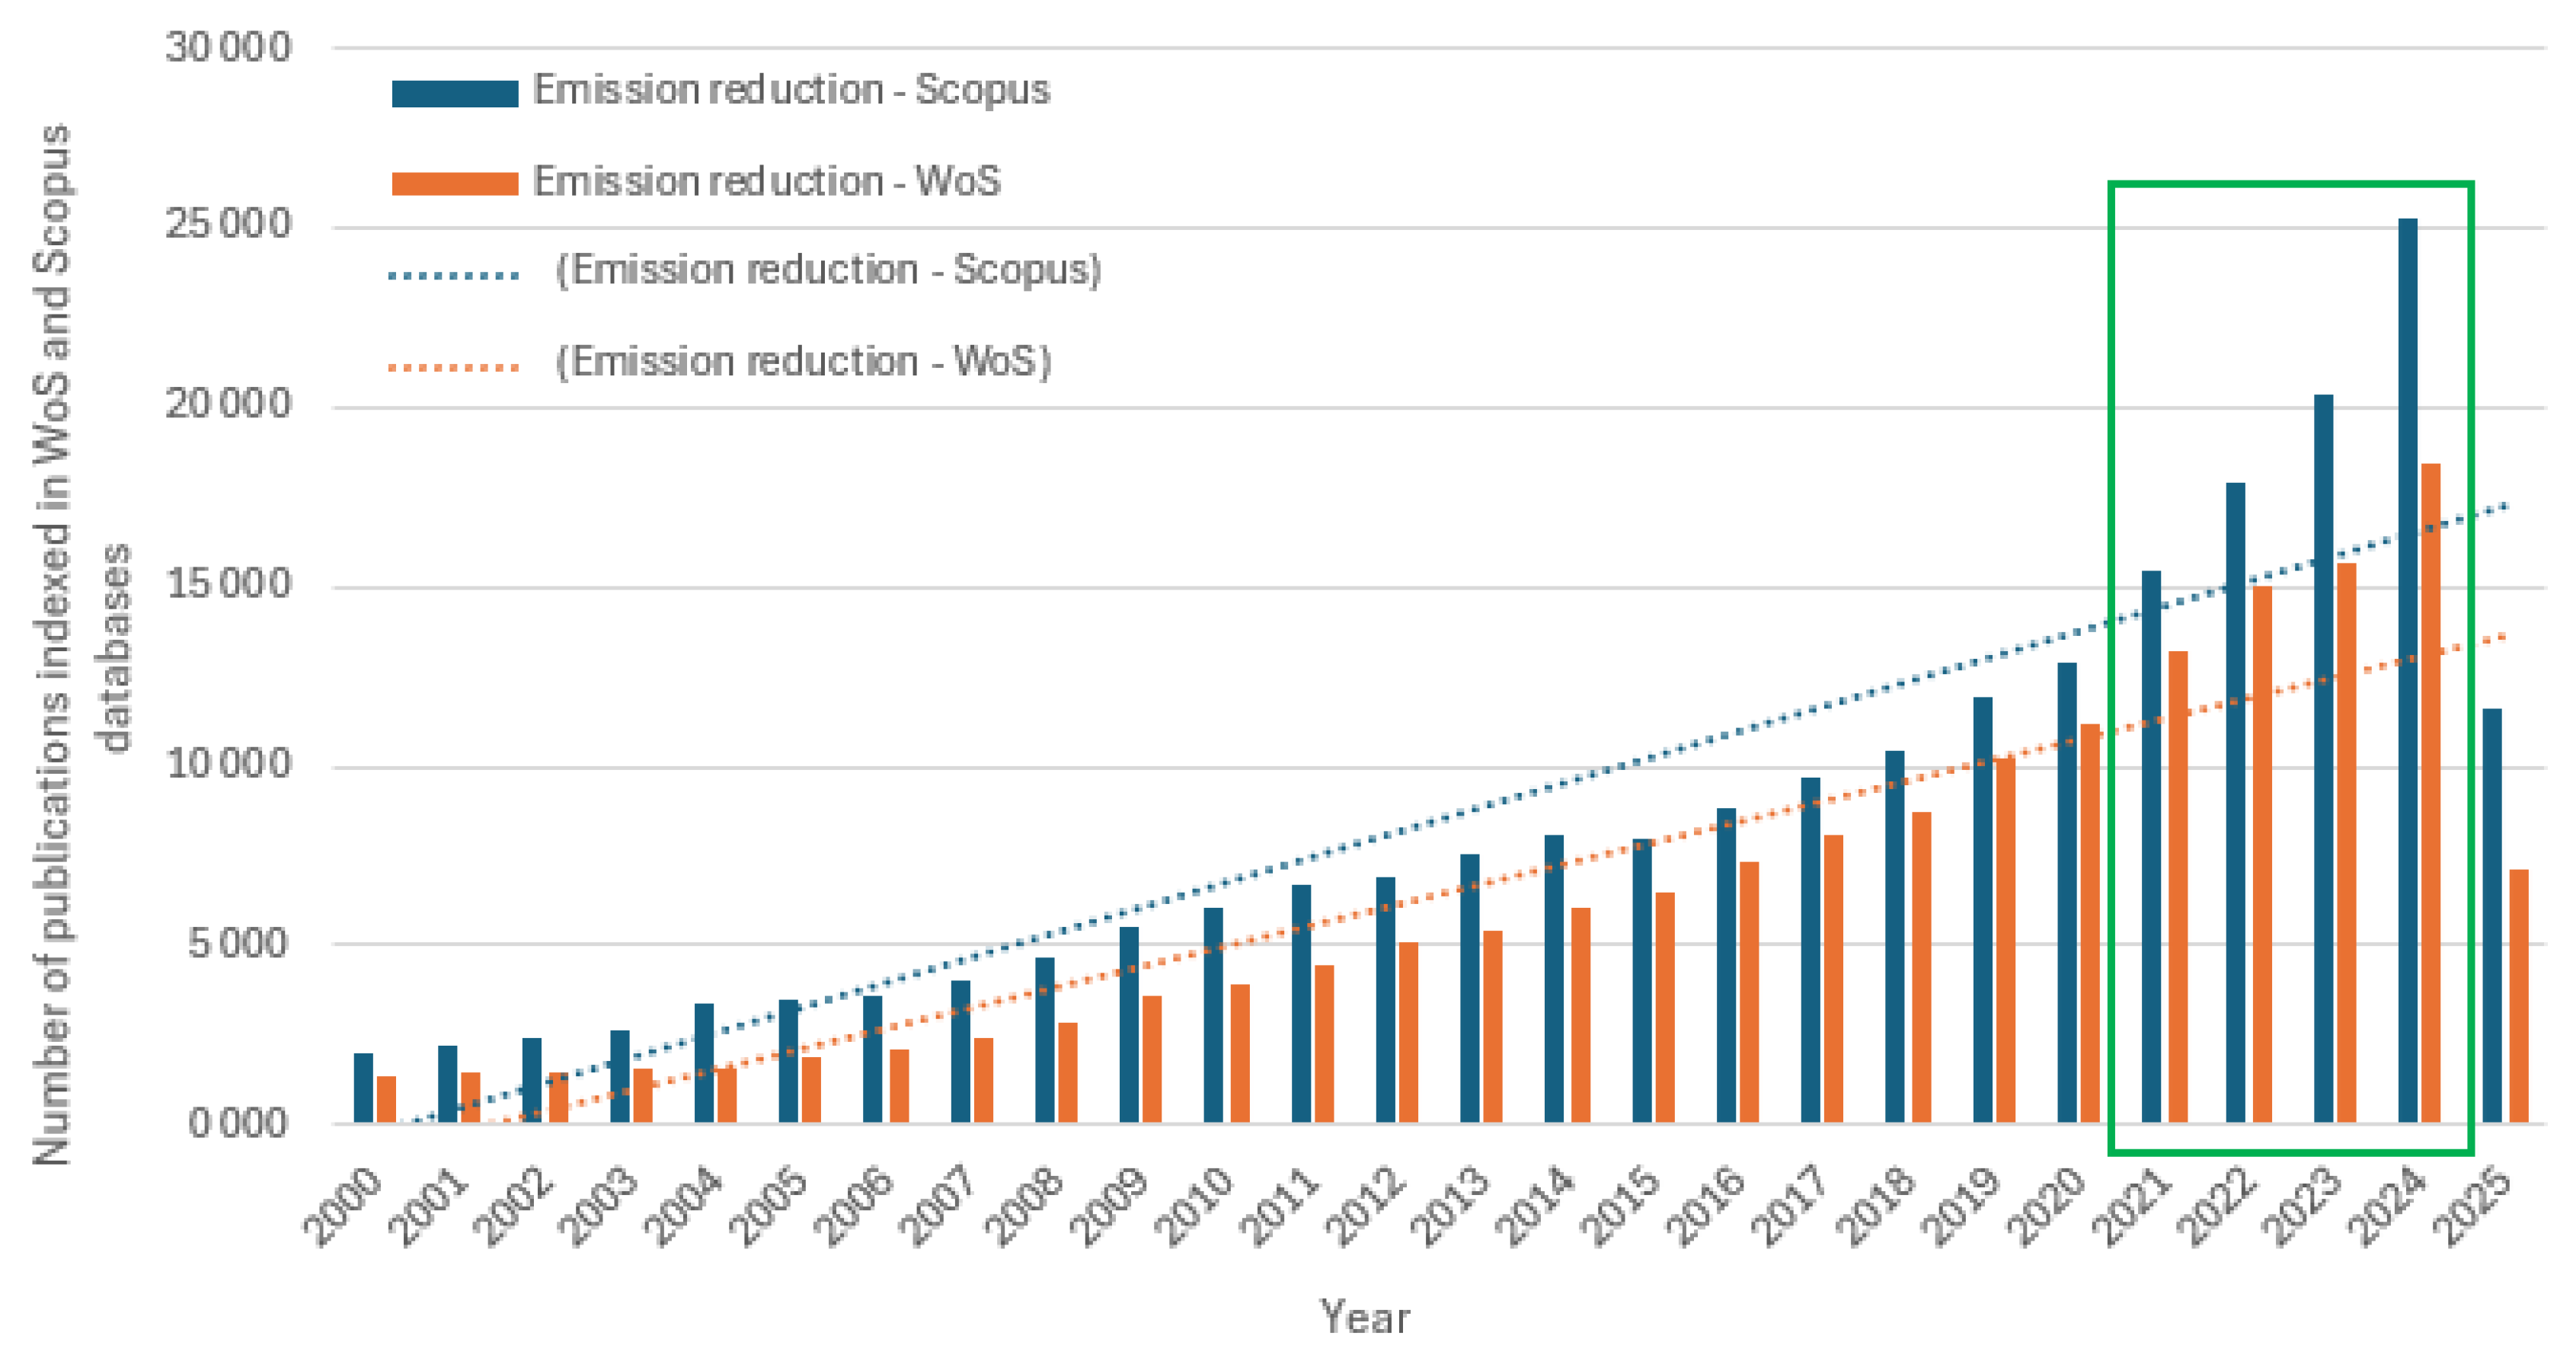
To assess the trend and the significance of this topic for researchers, a bibliometric analysis was carried out on the subject of pollutant emission reduction (CO, CO2, SO2, NOX and others) into the environment. Bibliometric analysis is a method for exploiting and analyzing scientific data [30,31,32,33,34,35], which allows one to establish trends in specific analyses and the impact within a given field; it serves as a crucial tool in scientific research. For this purpose (trend assessment), the Web of Science (WoS) and Scopus databases were explored, using “emission reduction” as the keywords. The time frame selected spanned 2002–2025, and the search was limited to the topic field. In the WoS database, the keyword “emission reduction” yields 9 615 publications, while for the broader period 2000–2025 it returns 166 739 records, underscoring the topic’s importance to many researchers—as evidenced by the rising trend (Figure 1). The greatest number of indexed publications appears in the period 2002–2024, which aligns with the WoS indexing figures (a total of 63 391 publications). This notable increase in research activity, especially in recent years, may be partly attributed to the growing emphasis on climate policy frameworks such as the European Union’s “Fit for 55” package, introduced in 2021. This legislative initiative aims to reduce net greenhouse gas emissions by at least 55% by 2030 (compared to 1990 levels), with the overarching goal of achieving climate neutrality by 2050. As a result, academic interest in emissions reduction strategies, including transport-related CO2 emissions, has intensified significantly. Most of these works fall under the categories “Environmental Science” (39,145 publications) and “Energy Fuels” (31,385 publications). In Scopus, using “emission AND reduction” in article title, abstract, and keywords, a total of 239,054 indexed scientific publications were found, predominantly in “Engineering” (80,942 publications) and “Environmental Science” (74,941 publications). The greatest number of indexed publications appears in the period 2002–2024, which aligns with the WoS indexing figures (a total of 63,391 publications). Consequently, it can be stated that emission reduction is a significant research topic for many scholars and exhibits an upward trend (Figure 1).
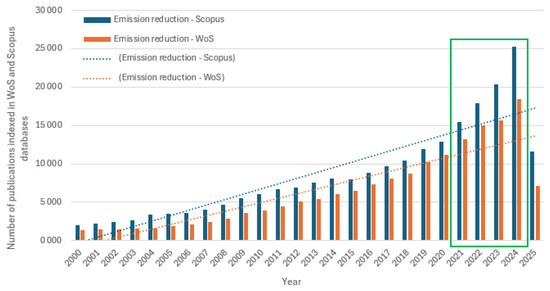
Figure 1.
A bibliometric analysis of publications indexed in the Scopus and WoS databases from 2000 to 2025—focusing on the keyword ‘emission reduction’ (analyzed years indicated in green).
Considering the topic of emission reduction, our analysis was narrowed to carbon dioxide (CO2) and nitrogen oxides (NOX). Accordingly, we examined the number of publications relating to these specific pollutants discharged into the environment. To this end, the keyword was refined to “emission reduction CO2 and NOX”.
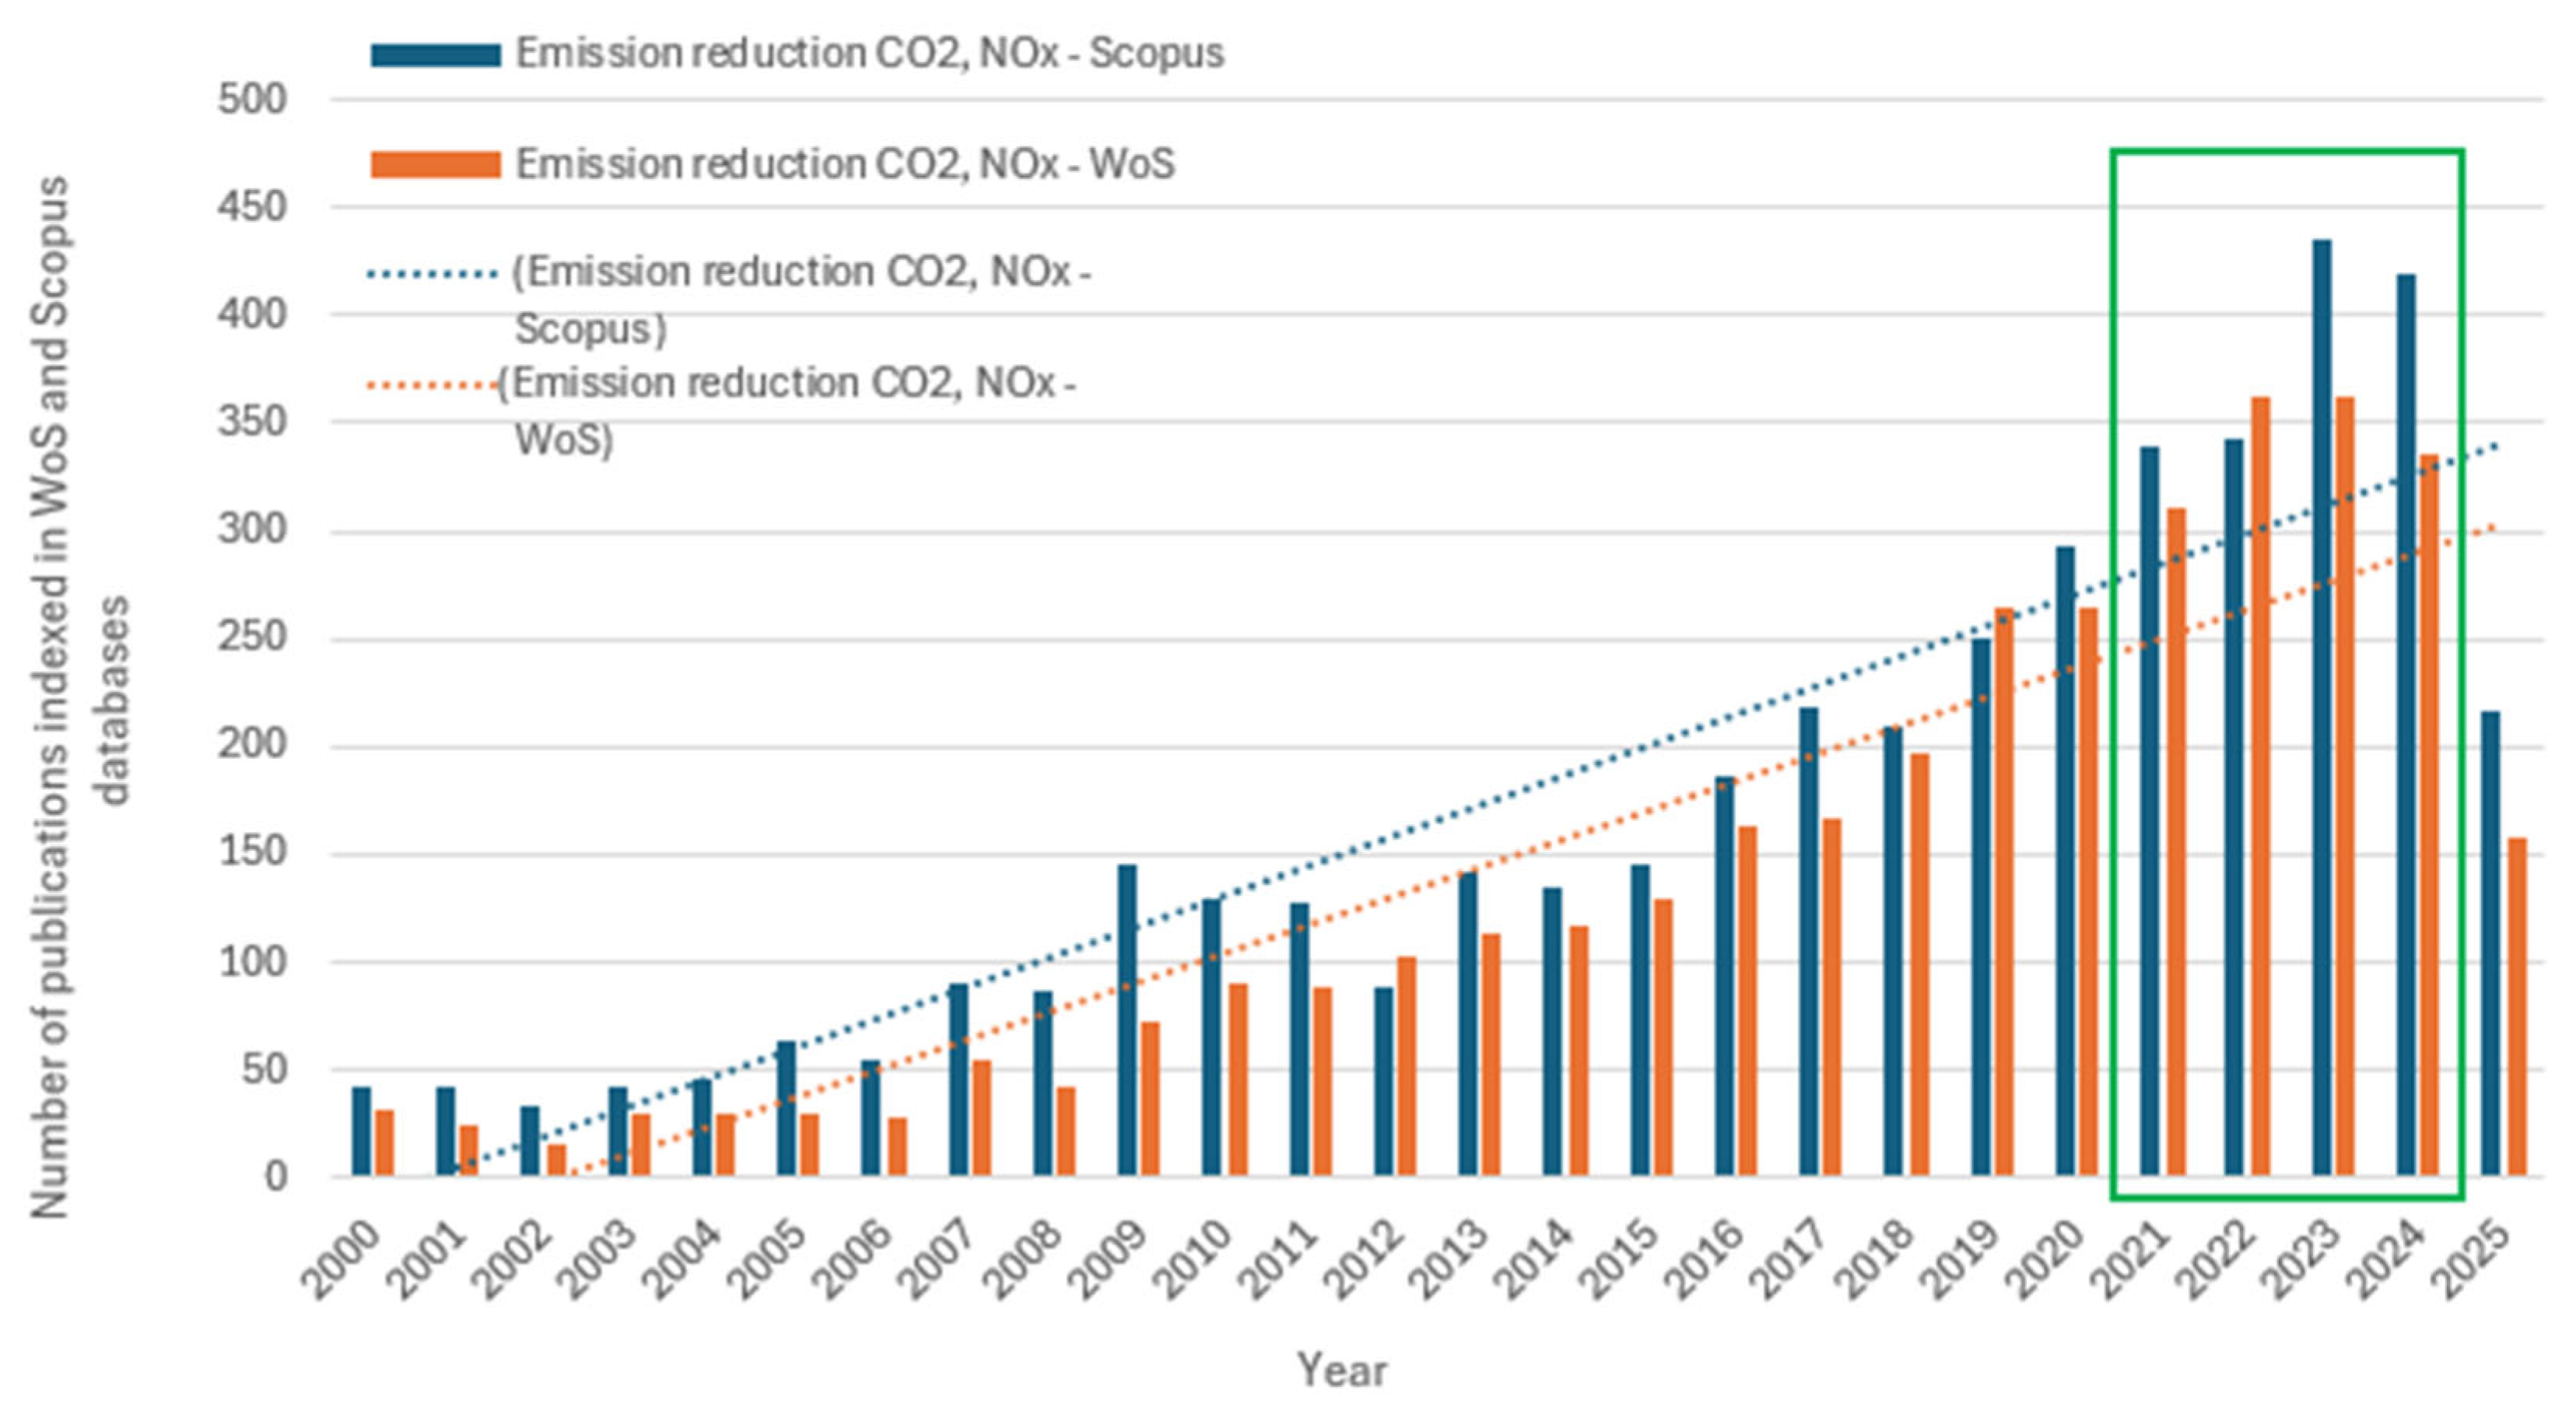
In the Web of Science (WoS) database, 3582 indexed records were retrieved (Topic = emission reduction CO2, NOX), with the highest output occurring in 2021–2024. Most of these publications are assigned to the subject areas “Energy Fuels” (1459 records) and “Environmental Sciences” (919 records).
In Scopus, using “emission AND reduction AND CO2 AND NOX” in the article title, abstract, and keywords fields, 4 491 records were identified. These chiefly belong to “Engineering” (2177 publications), “Environmental Science” (179 publications), and “Energy” (1772 publications). In both databases, the peak in indexed publications falls in the period 2022–2024 (Figure 2).
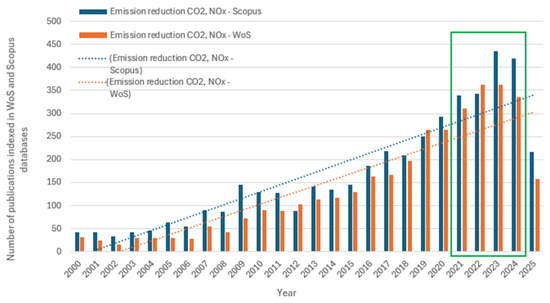
Figure 2.
A bibliometric analysis of publications indexed in the Scopus and WoS databases from 2000 to 2025 focusing on the keywords “CO2 and NOX emission reduction” (analyzed years indicated in green).
Based on the foregoing analyses, it can be concluded that the issue of emission reduction represents a key concern for many researchers, who recognize the need for rational emissions management in order to protect the climate and the environment. In light of these analyses, this study considers the potential use of computer simulation as a decision-support tool for limiting CO2 and NOX emissions.
Computer simulation is one of the tools frequently employed in production process management. Its practical application makes it possible, among other things, to conduct analyses of various production process parameters as well as of logistics processes [36]. Computer simulation thus serves as a support mechanism for enterprise management. Researchers employ a variety of simulation software packages [36,37,38] which differ in their level of complexity and in the libraries they provide. Accordingly, the aim of this work is to verify the feasibility of using computer simulation as a decision-support tool for analyses specifically targeted at reducing carbon dioxide (CO2) and nitrogen oxide (NOX) emissions.
The objective of the present article is to assess the potential of computer simulation—using the FlexSim software 22.2.1—as a decision-support tool for the analysis of intra-operational transport, with a view to reducing emissions of CO2 and NOX.
In the course of the study, real production process parameters were analyzed, focusing on the selection of an appropriate number of transport resources and the optimal layout of workstations. The goal was to minimize the distances between operations and to increase the efficiency of internal intra-operational transport.
The literature extensively describes the use of simulation tools for analyzing manufacturing process parameters [39,40,41,42,43,44,45,46,47] and for examining logistical systems [48,49,50]. Other studies [51,52,53] have characterized, through empirical research, the levels of CO2 and NOX emissions generated by intra-operational transport vehicles. However, to date no work has demonstrated the potential of computer simulation as a source of operational parameter data for internal transport systems, nor shown how such data might be applied in decision making aimed at reducing harmful emissions on the basis of real operational data.
By fulfilling the objectives of this research, the present study helps to fill this gap in knowledge, illustrating how computer simulation can support production planning and reorganization processes that take environmental considerations—including the reduction of CO2 and NOX emissions—into account.
2. Materials and Methods
In this study, we present an analysis of the real production process for steel rotating parts intended for use in the machinery industry, framed as a case study. The investigation covered a production line comprising six consecutive operations performed at individual, non-automated workstations. Although the duration of each operation was specified during the preparation of the technological documentation, the core of our analysis focused on the material flow within the production process and the organization of internal transport (Table 2).
Table 2.
Parameters of the production process.
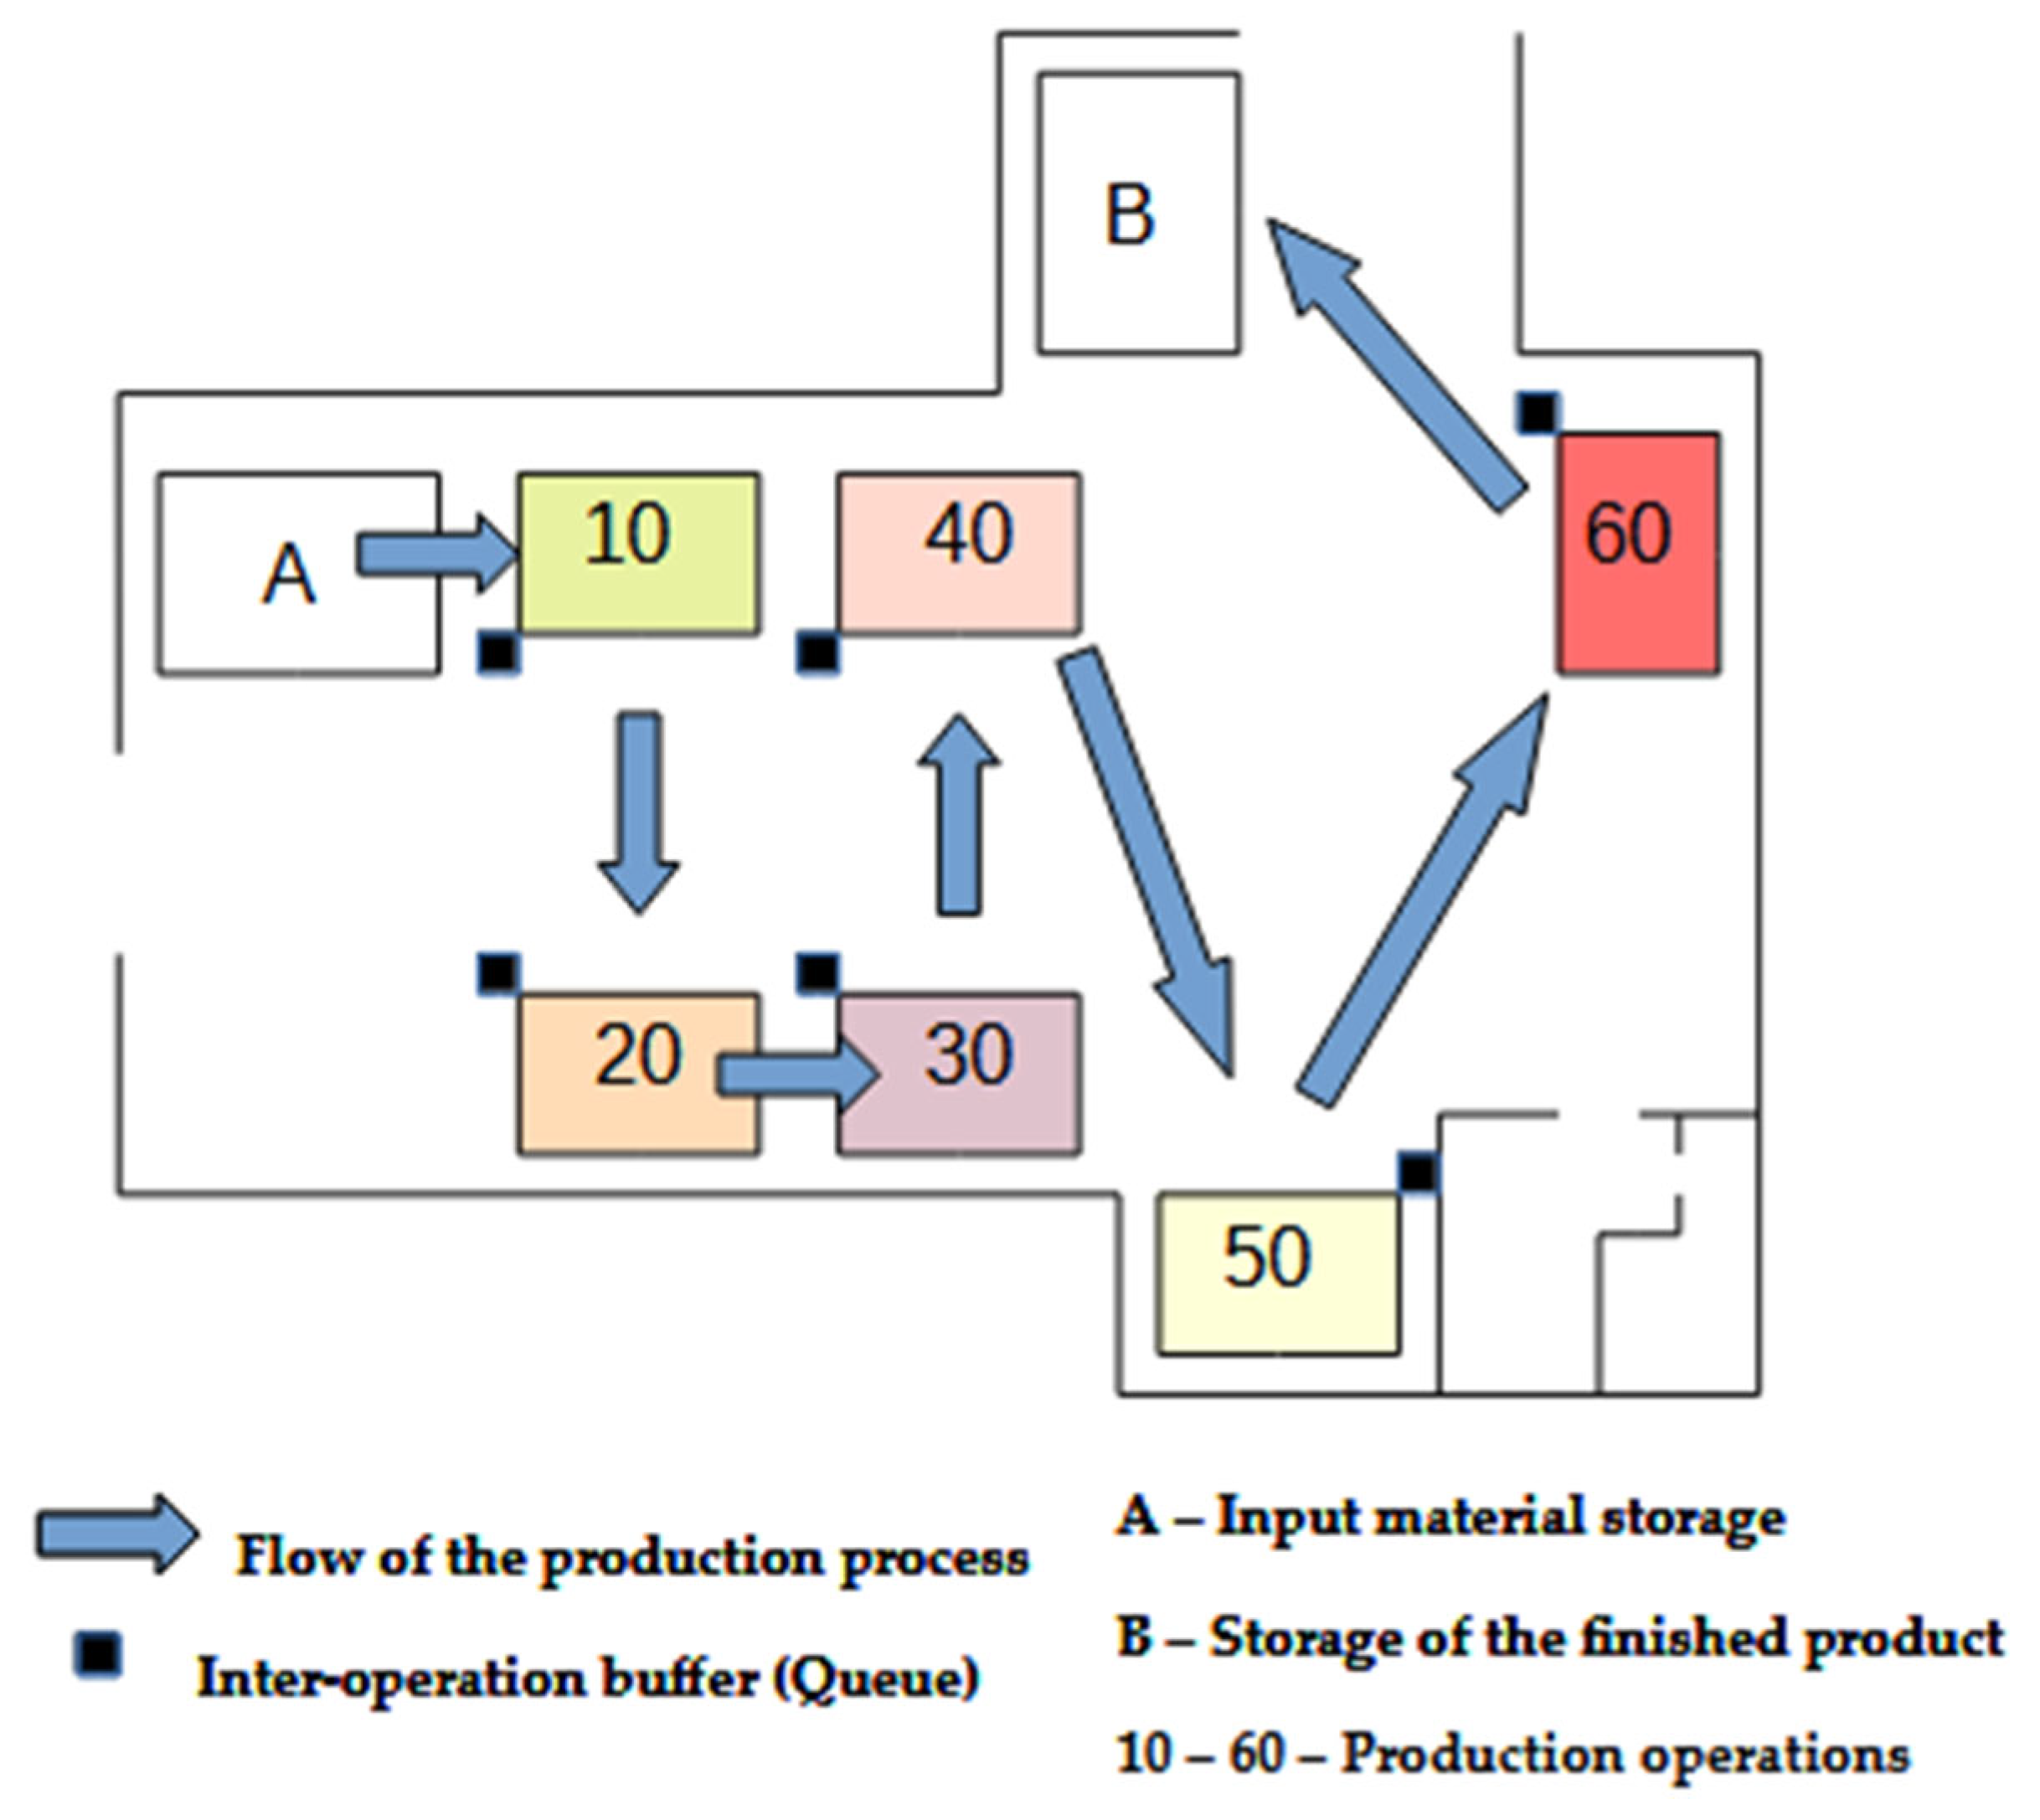
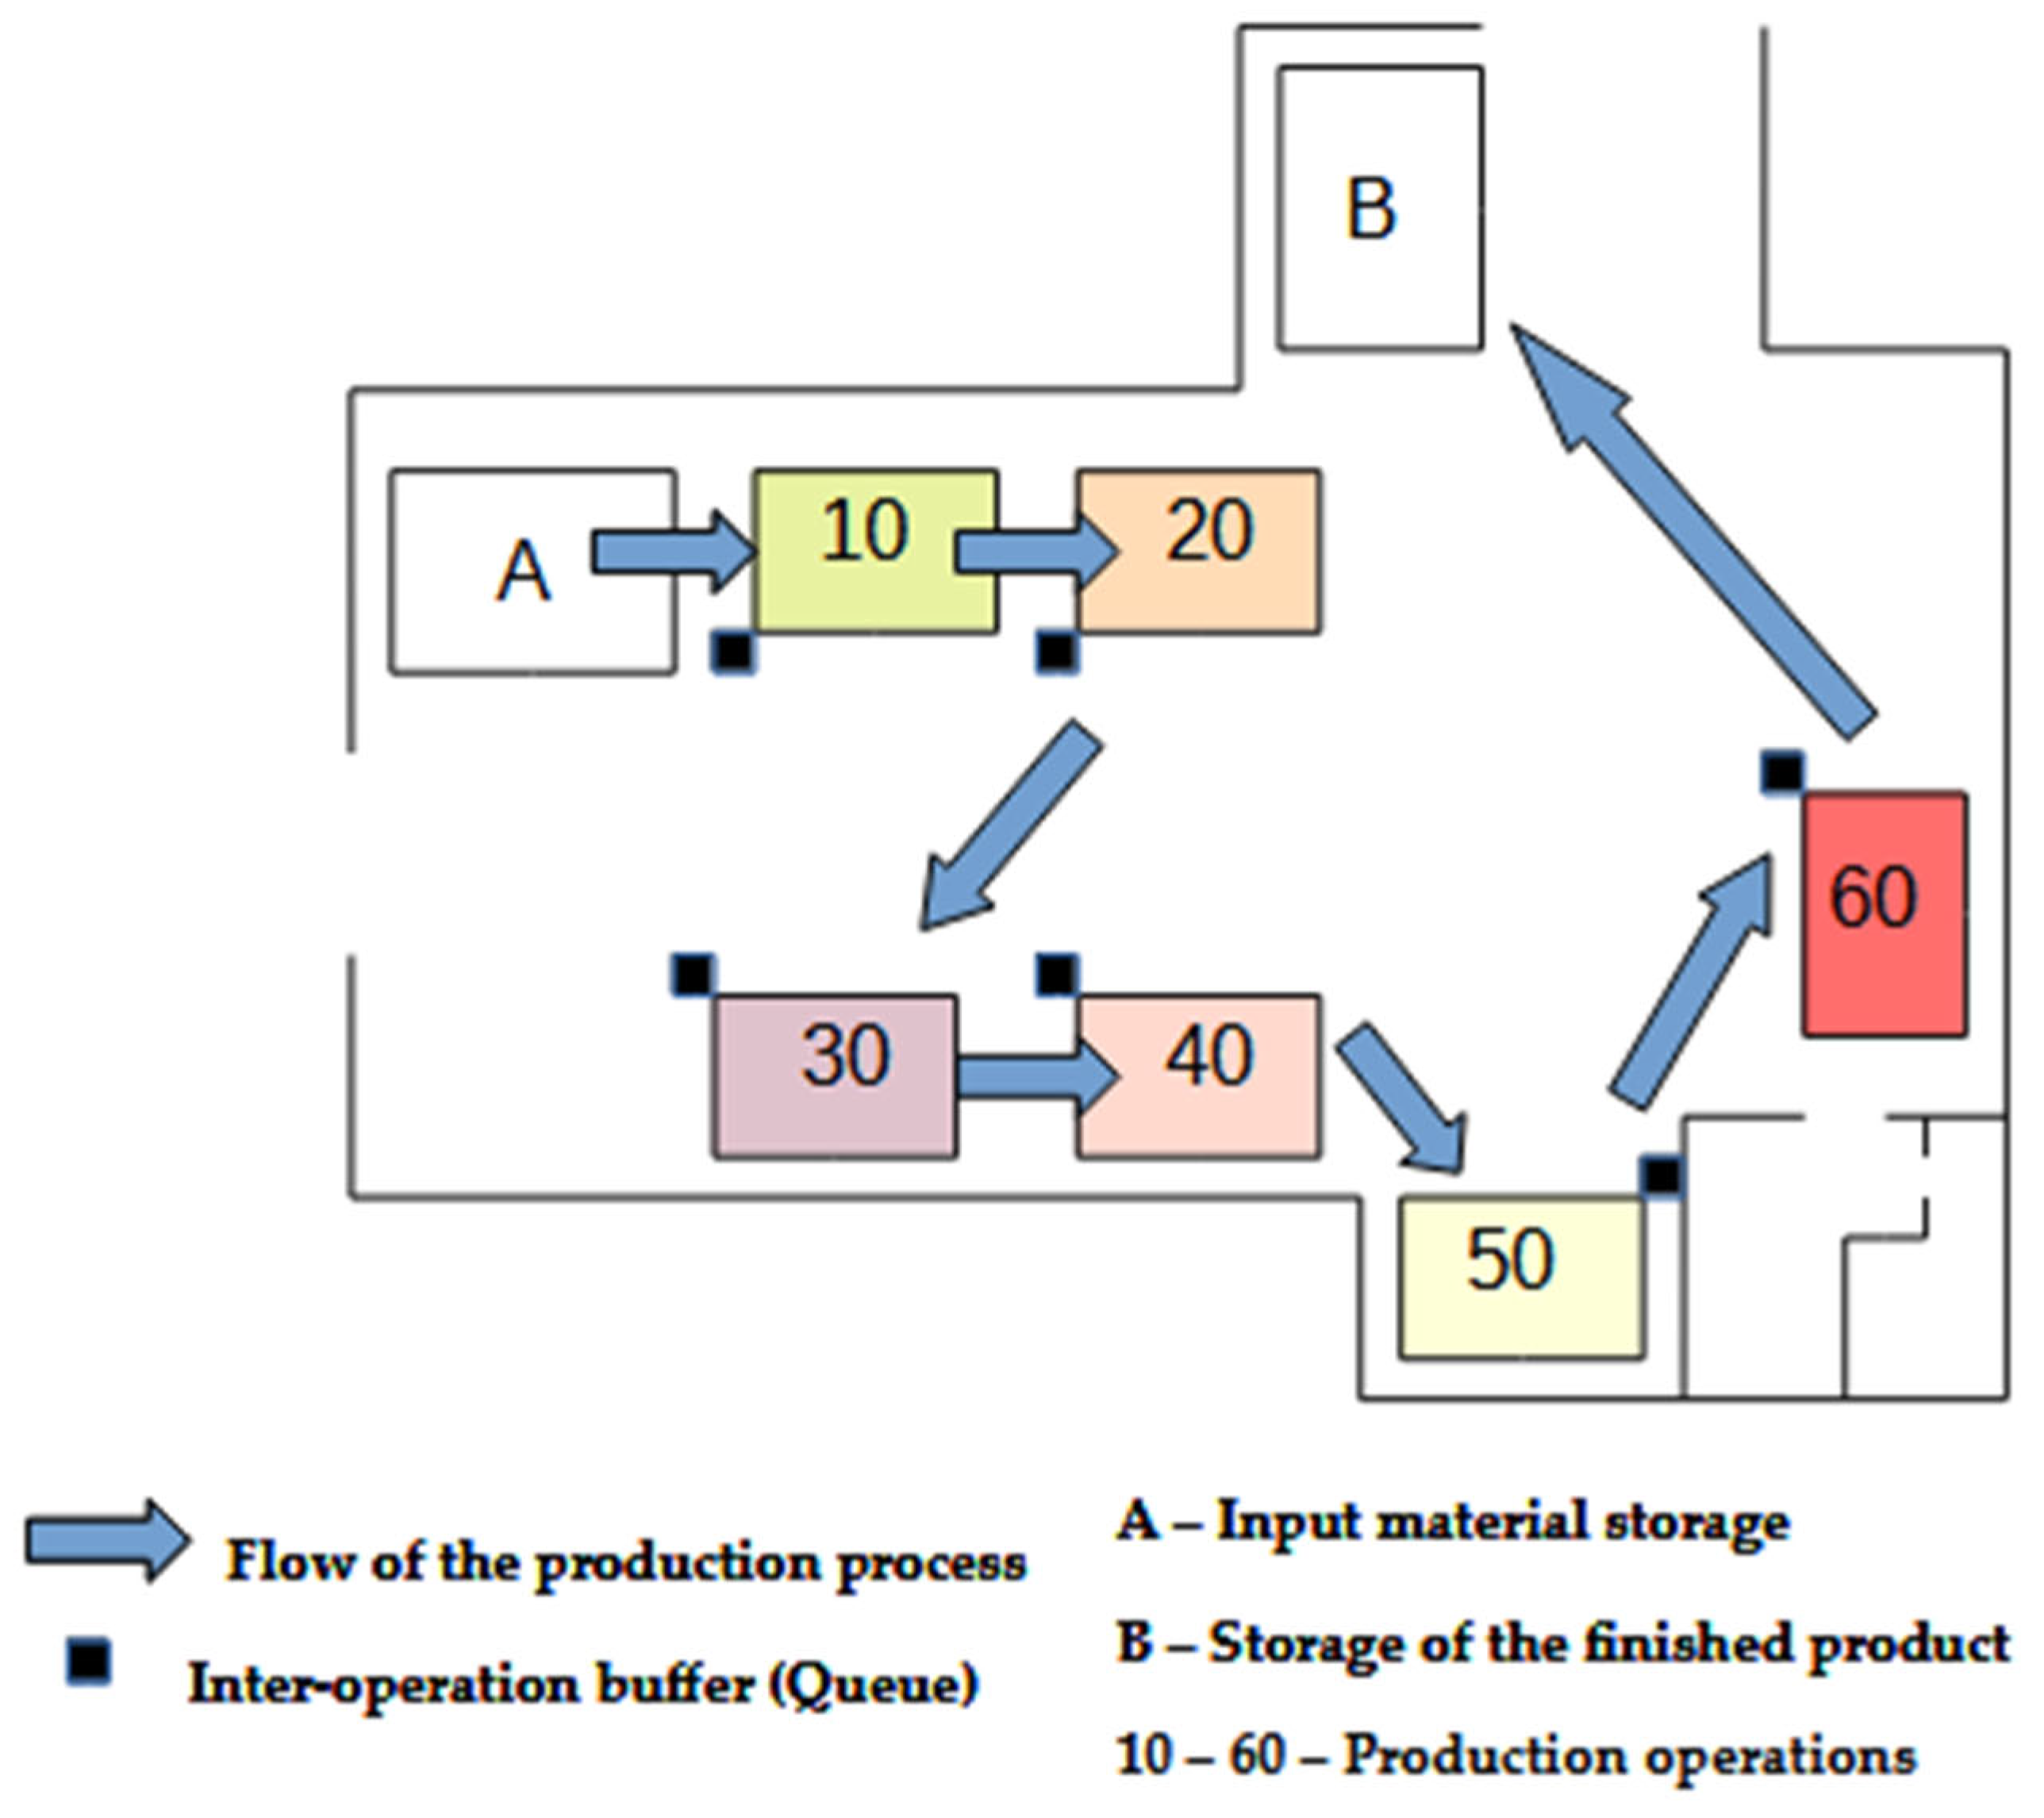
The transport of semi-finished parts during the production process was organized according to a parallel-flow principle. This means that upon the completion of each processing operation, components were immediately routed to the next workstation for the subsequent operation. After every operation, semi-finished parts were transferred from the workstation to an intermediate storage area, located between groups of workstations executing successive stages of the process (from Operation 10 to Operation 60). The production zone comprised, in addition to the active work area, a raw-material warehouse (denoted as A) and a finished-goods warehouse (denoted as B) (Figure 3).

Figure 3.
Material flow diagram in the production process.
Movement of workpieces between consecutive workstations was carried out using eight forklifts, each adapted to transport the steel components involved in the process (Table 3).
Table 3.
Types of transportation used during the production process.
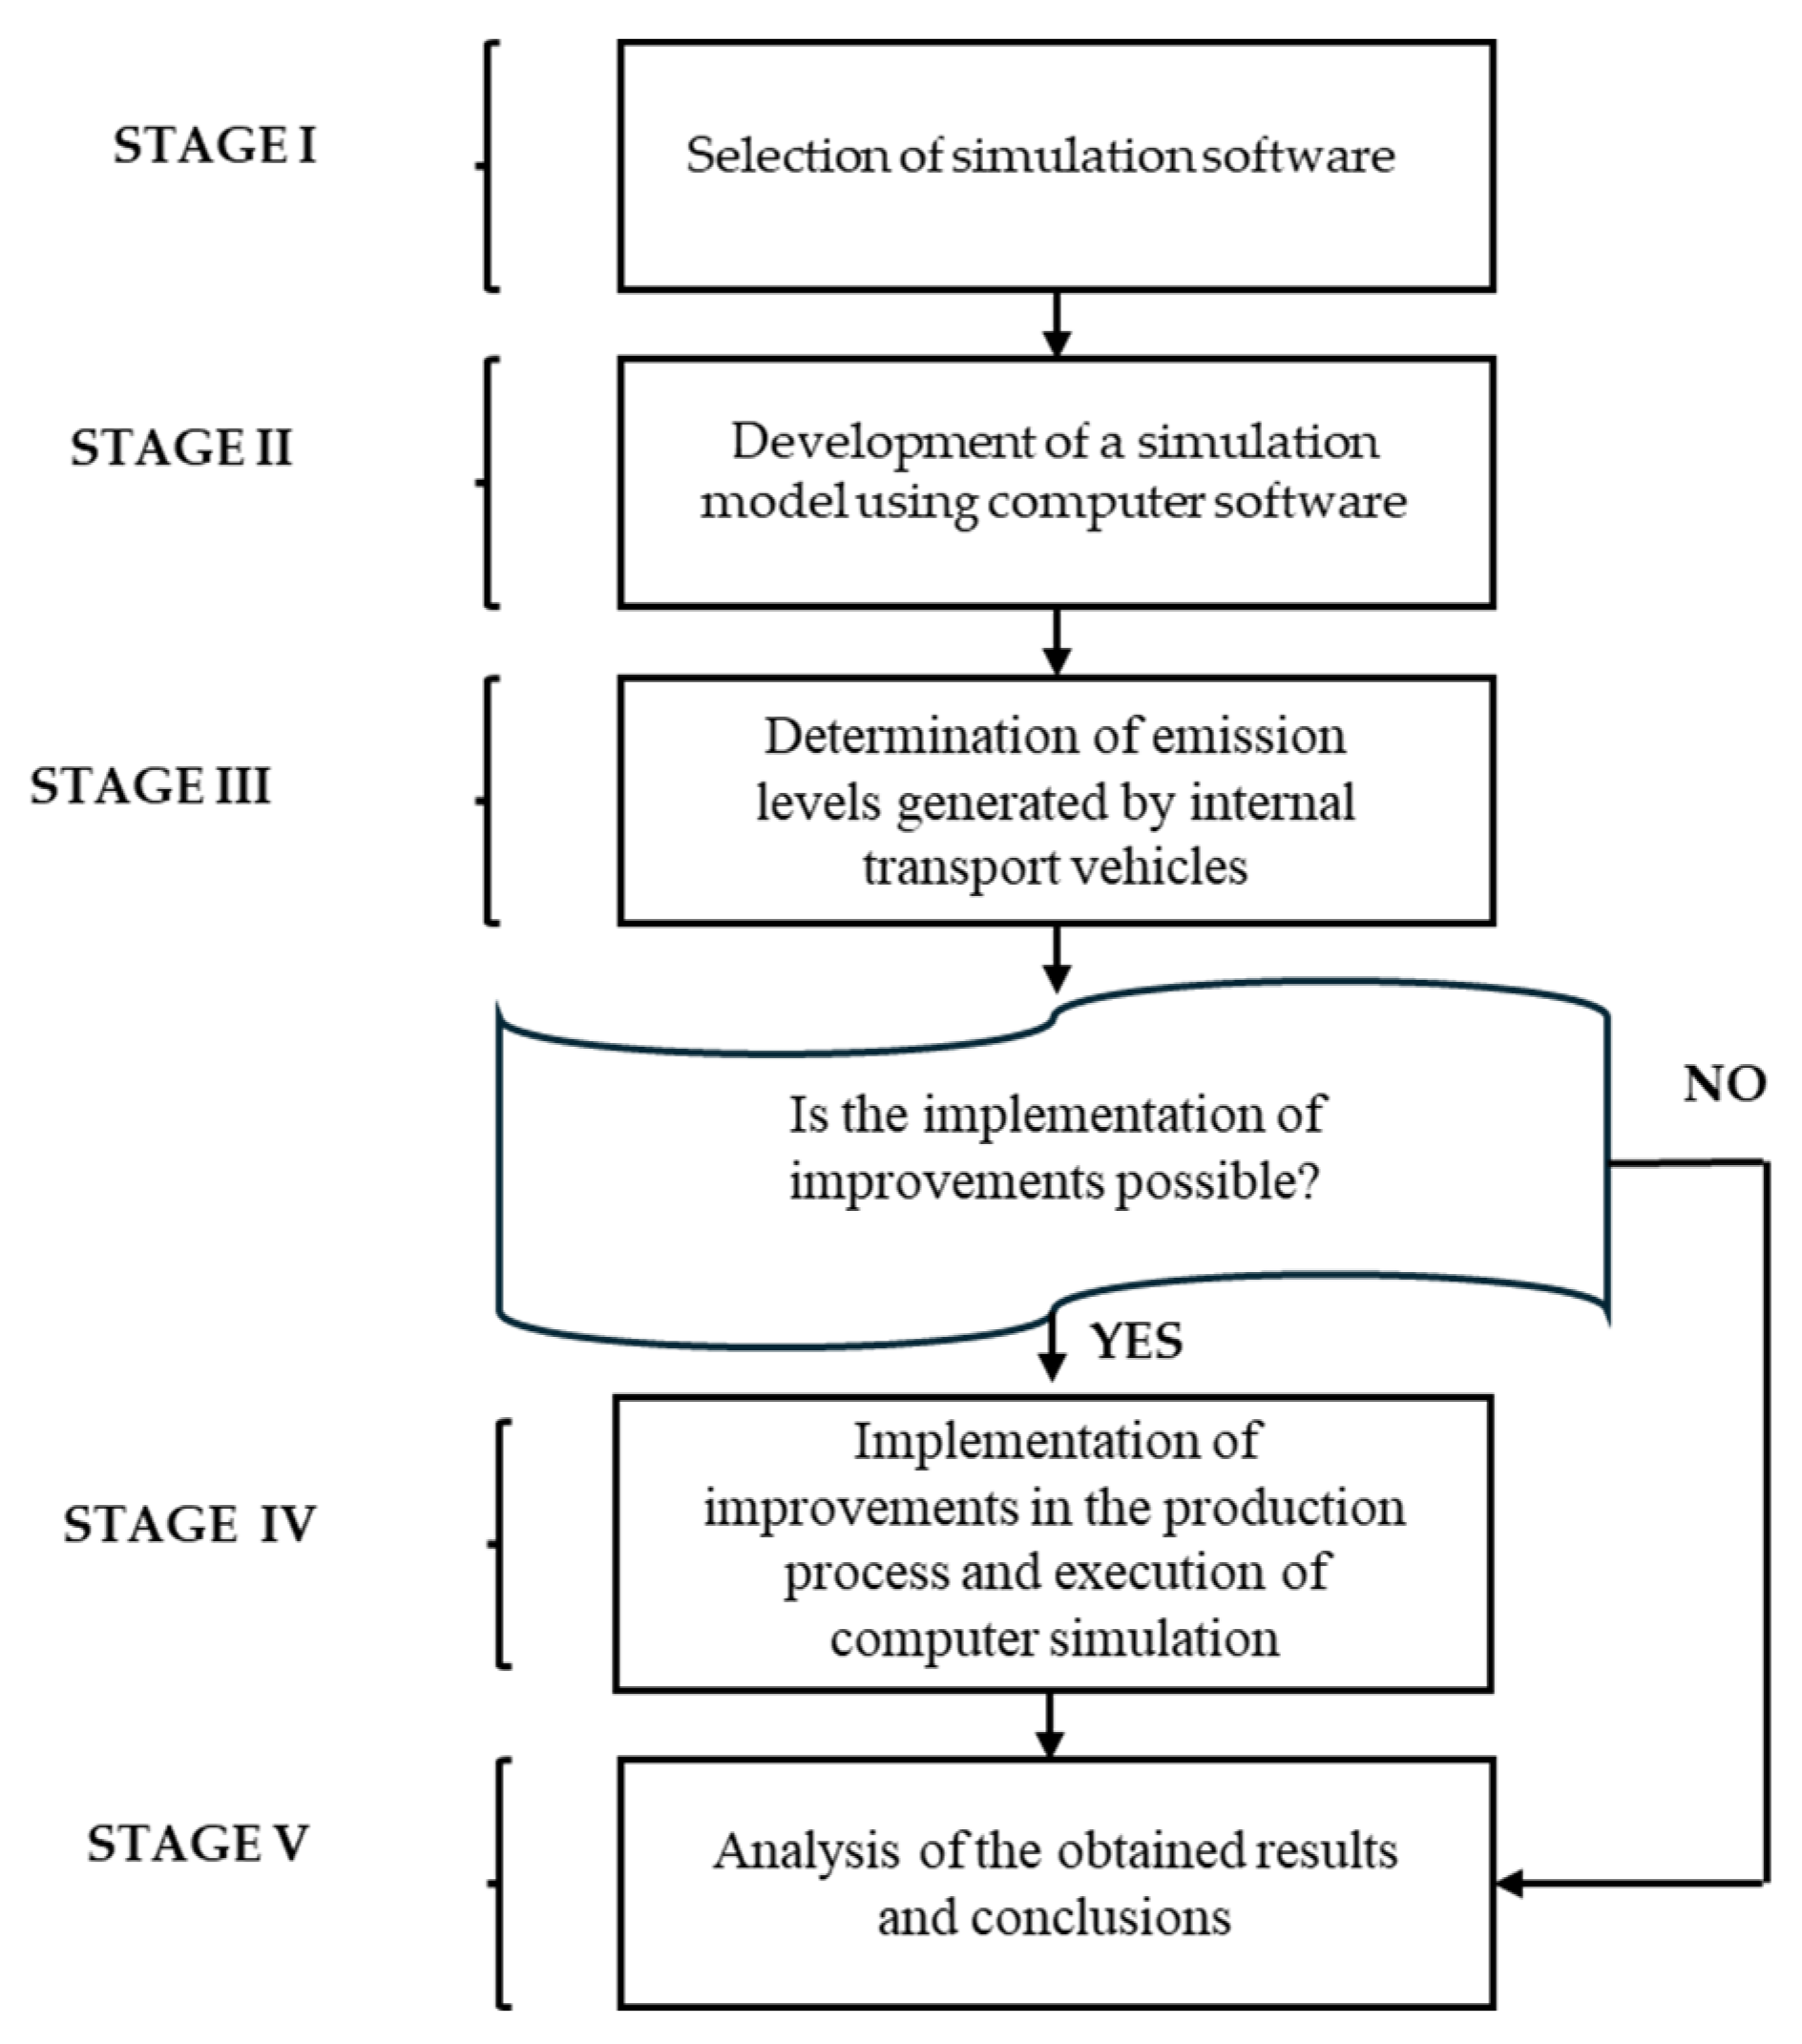
The achievement of the set objective was made possible by the development of an original five-stage methodology, as illustrated in Figure 4.
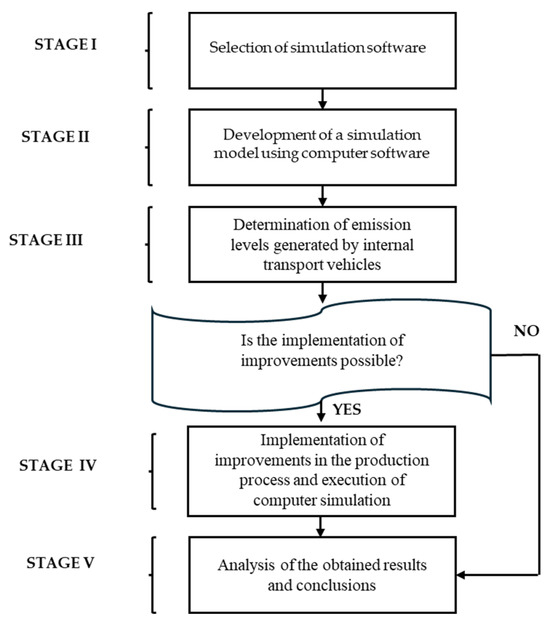
Figure 4.
Five-stage methodology of the conducted research.
The first stage involved selecting the simulation software. For this study, FlexSim software 22.2.1 was used, owing to its comprehensive capabilities for simulating production processes and analyzing logistical parameters. The choice of FlexSim was justified by its availability and by the features it offers, which enabled the achievement of the study’s objectives which were as follows:
- Ability to build model logic via programmed block-diagram schemes;
- System analysis through generated schematics, reports and spreadsheets;
- Applicability in industrial production contexts, including analysis of transport-resource utilization;
- Production-flow mapping, mapping of the process for supplying workstations with raw materials and other inputs, and an analysis of workstation and intermediate-storage workloads.
In the second stage, data were fed into the simulation software to reproduce the production process in order to (a) verify the utilization level of transport resources during logistical operations and (b) measure the distances traveled by the forklifts between the various production stations and between the raw-material and finished-goods warehouses. The results thus obtained were then used to assess potential opportunities for reducing the number of transport resources and to determine the current emission levels of carbon dioxide (CO2) and nitrogen oxides (NOX).
where
- —CO2 emissions generated by the internal transport vehicles;
- —NOX emissions generated by the internal transport vehicles;
- D—distance covered by internal transport vehicles;
- I—CO2 emission rate [g/km];
- R—NOX emission rate [g/km].
For the purposes of this study, the CO2 and NOX emission rates for the internal transport vehicles (forklifts) were taken from the measurements reported in [53] and are presented in Table 4. The emission data account for operation both with and without load, which has a tangible effect on the levels of CO2 and NOX produced.
Table 4.
The level of CO2 and NOX emissions from forklifts.
To ensure the comparability of results and to focus the analysis on the impact of organizational improvement measures, constant operating parameters for the forklifts were assumed throughout the entire simulation. This approach allowed for an illustration of the scale of CO2 and NOX emissions depending on the optimization measures implemented, such as reducing the number of transport units or shortening the distances between production workstations.
In the fourth stage of the study, actions were undertaken to reduce the number of transport units operated by forklifts and to minimize the distance required to complete internal transport tasks. The production process improvement measures were carried out in accordance with the following assumptions:
- The production process consists of n technological operations (denoted as i = 1, 2…, n).
- A transport task is required between each pair of consecutive operations.
- There are m available transport vehicles.
- Each vehicle travels a defined route of length dij [m] between operations i and j.
- Unit emissions of CO2 and NOX are known for each vehicle k, depending on the type of propulsion used.
Decision Variables:
- xijk ∈ {0, 1}—binary variable: 1 if vehicle k performs the transport between operations i and j, 0 otherwise.
- Yk ∈ {0, 1}—binary variable: 1 if vehicle k is active in the transport schedule, 0 otherwise.
Parameters
- Dij—distance between operations i and j [m].
- CO2k—CO2 emission rate per meter for vehicle k [g/m].
- NOxk—NOX emission rate per meter for vehicle k [g/m].
- Tij—number of required transport trips between operations i and j.
Objective Function
Minimize the total emissions (weighted sum of CO2 and NOX):
- Minimize Σk = 1ᵐ Σi = 1ⁿ Σj = 1ⁿ Tij · dij · xijᵏ · (α · CO2k + β · NOxk)
where
- α and β are weighting factors assigned to CO2 and NOX emissions, respectively (they can be equal or reflect environmental priorities).
Contraints
- Assignment constraint: Each transport task must be assigned to exactly one vehicle:
Σk = 1ᵐ xijᵏ = 1° for all (i,j) where Tij > 0
- 2.
- Vehicle usage limit: Restrict the maximum number of active transport vehicles:
Σk = 1ᵐ yk ≤ L° where L is the upper limit of vehicles used
- 3.
- Activation linkage: A vehicle can be assigned to a task only if it is marked as active:
xijᵏ ≤ yk° for all i, j, k
In the final stage, a comparative analysis was performed to evaluate CO2 emission levels after the introduced improvements, and to assess the impact of the type of propulsion unit used, based on the data generated by the FlexSim simulation software.
3. Results
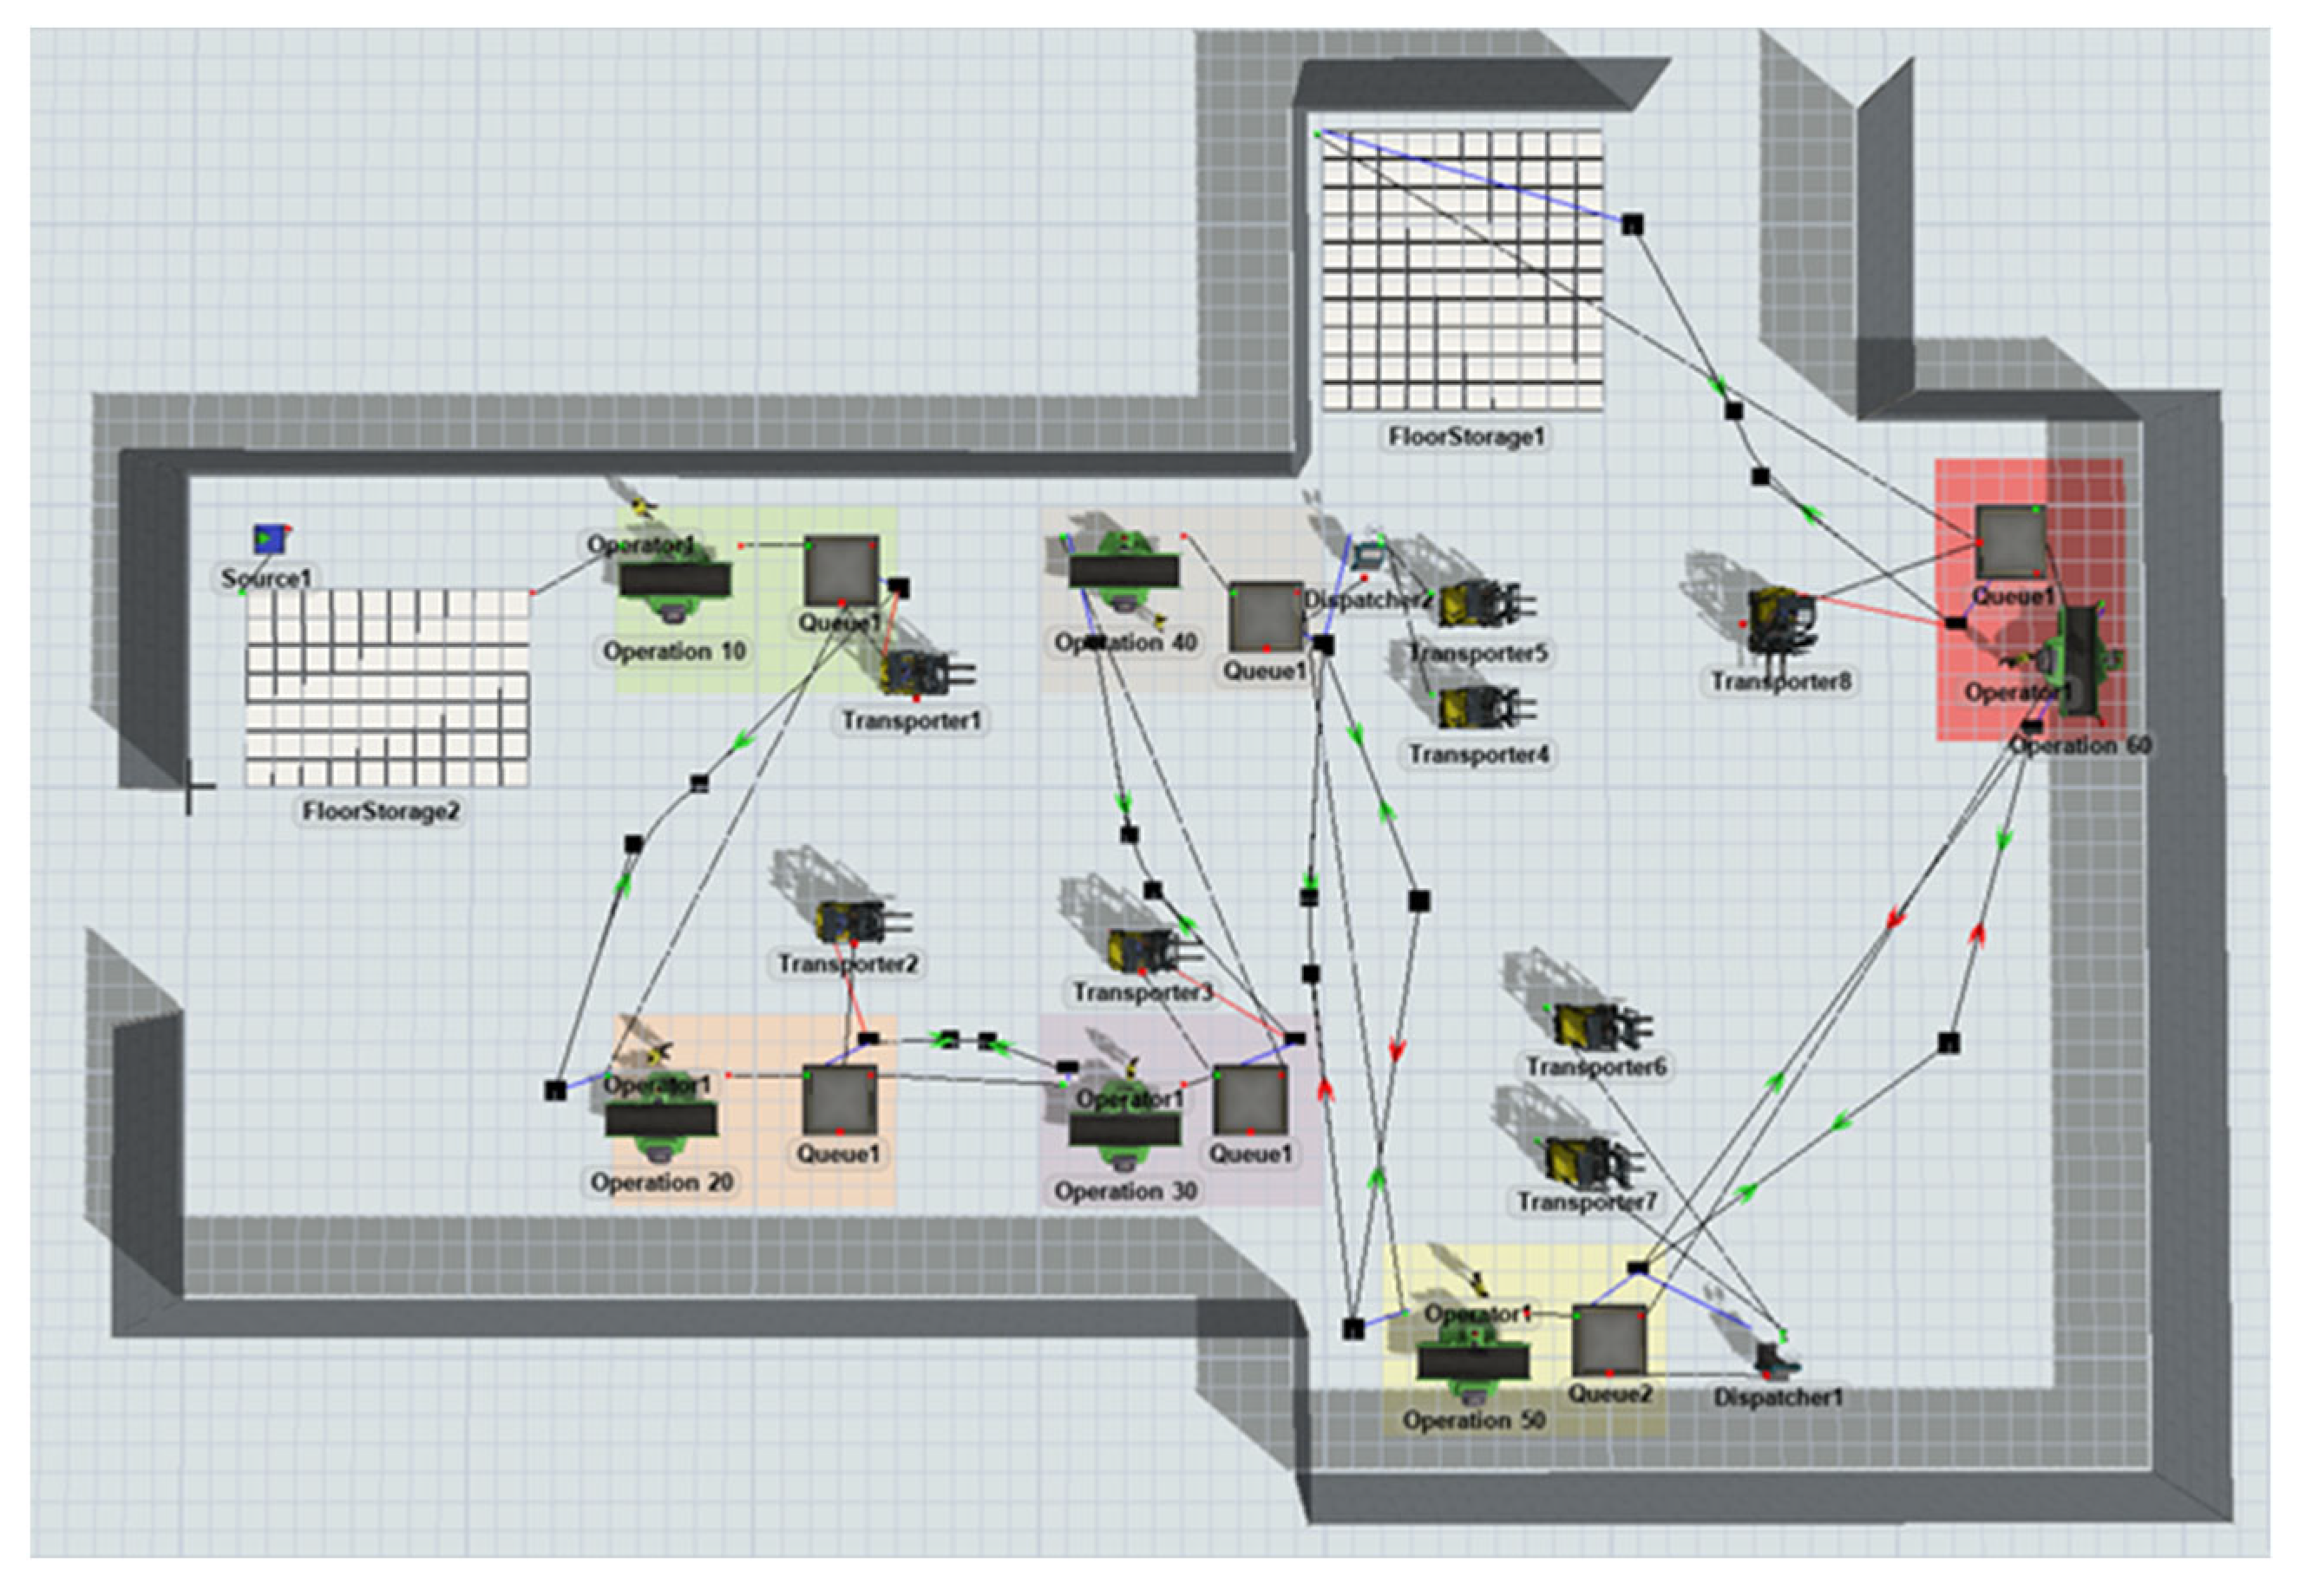
In accordance with the methodology described in Chapter 2, the first step involved developing a simulation model in the FlexSim simulation software, enabling the accurate representation of the real production process in terms of inter-operational transport and its associated parameters. The simulation model created in FlexSim included, among others: workstations, operators, intermediate storage areas (queues), raw material sources, inbound and outbound material warehouses, infrastructure elements, and transport resources. All these components were arranged on the software’s workspace in alignment with the actual layout of the production line and the paths used for inter-operational transport (Figure 5).
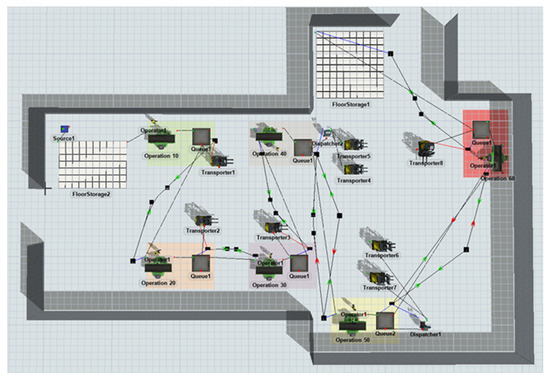
Figure 5.
Model in the FlexSim simulation software.
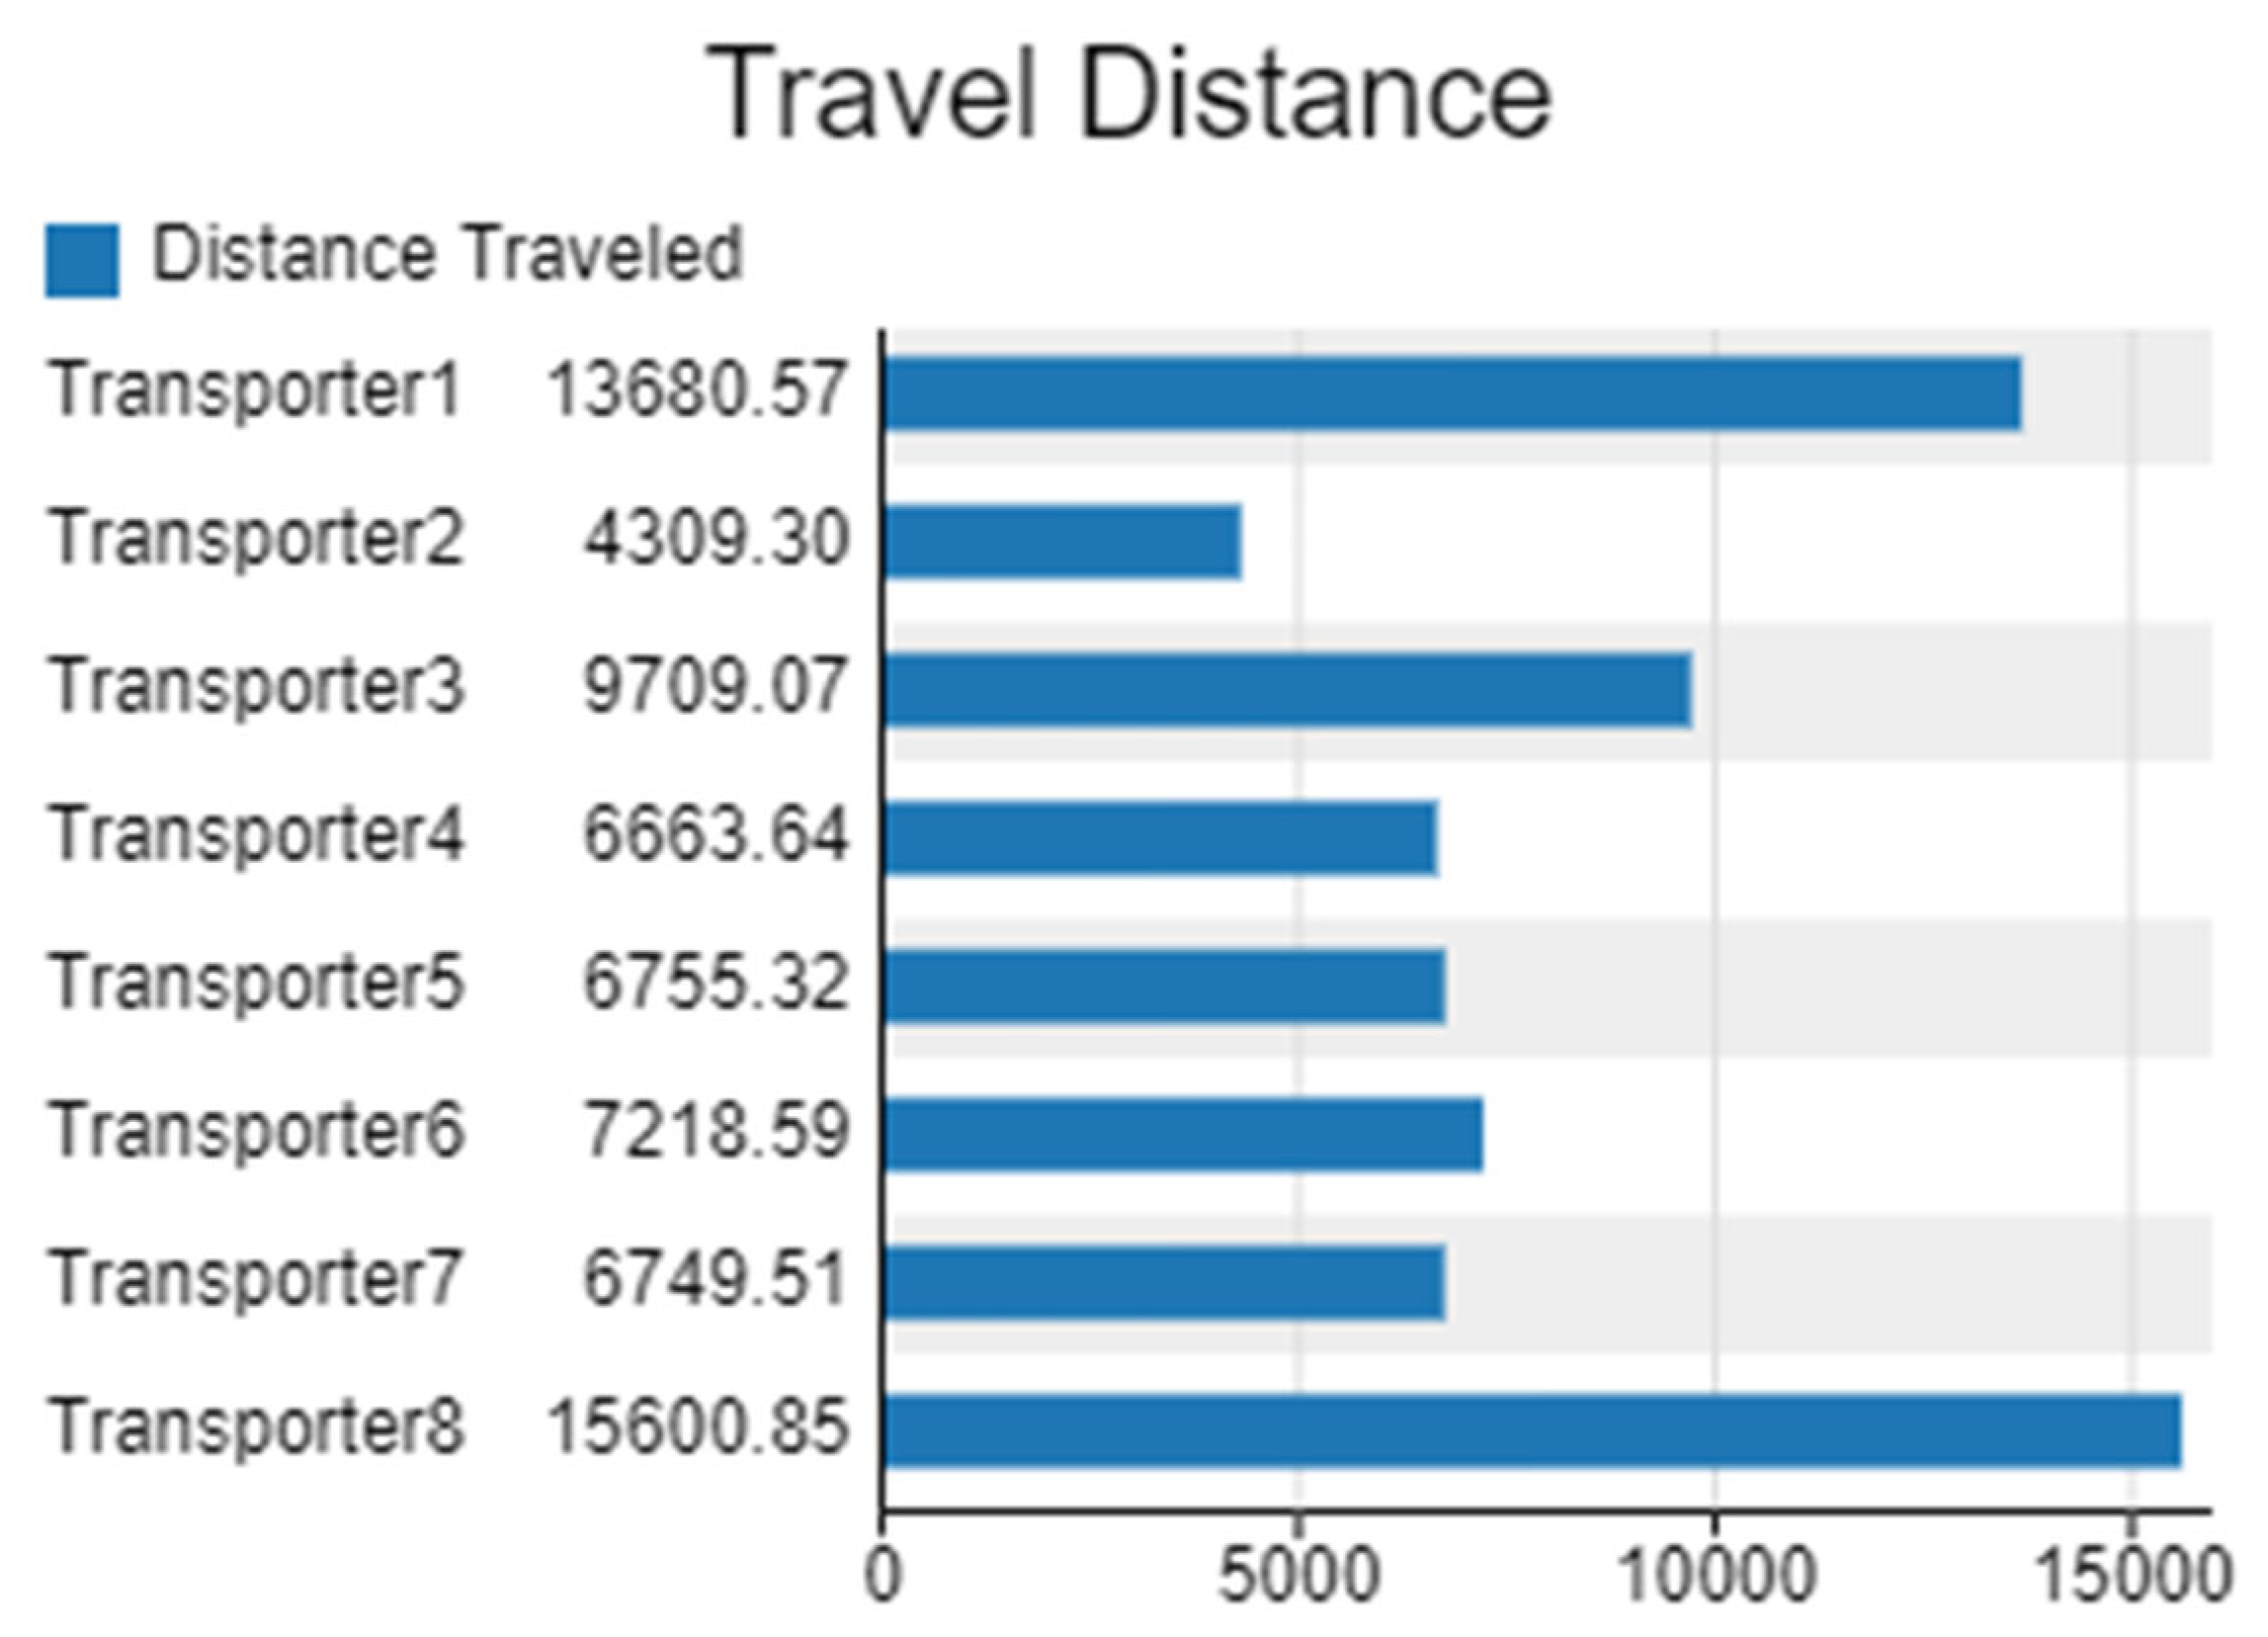
As a result of the simulation conducted, data were obtained on the total distance traveled by inter-operational transport vehicles during the production of a batch of 500 finished products (Figure 6).

Figure 6.
Distance covered by internal transport means within the production process.
The longest distance was traveled by forklift number 8 (Transporter8), which covered a total of 15,601 m, while forklift number 1 (Transporter1) traveled 13,681 m. The cumulative distance traveled by all transport vehicles amounted to 70,683 m.
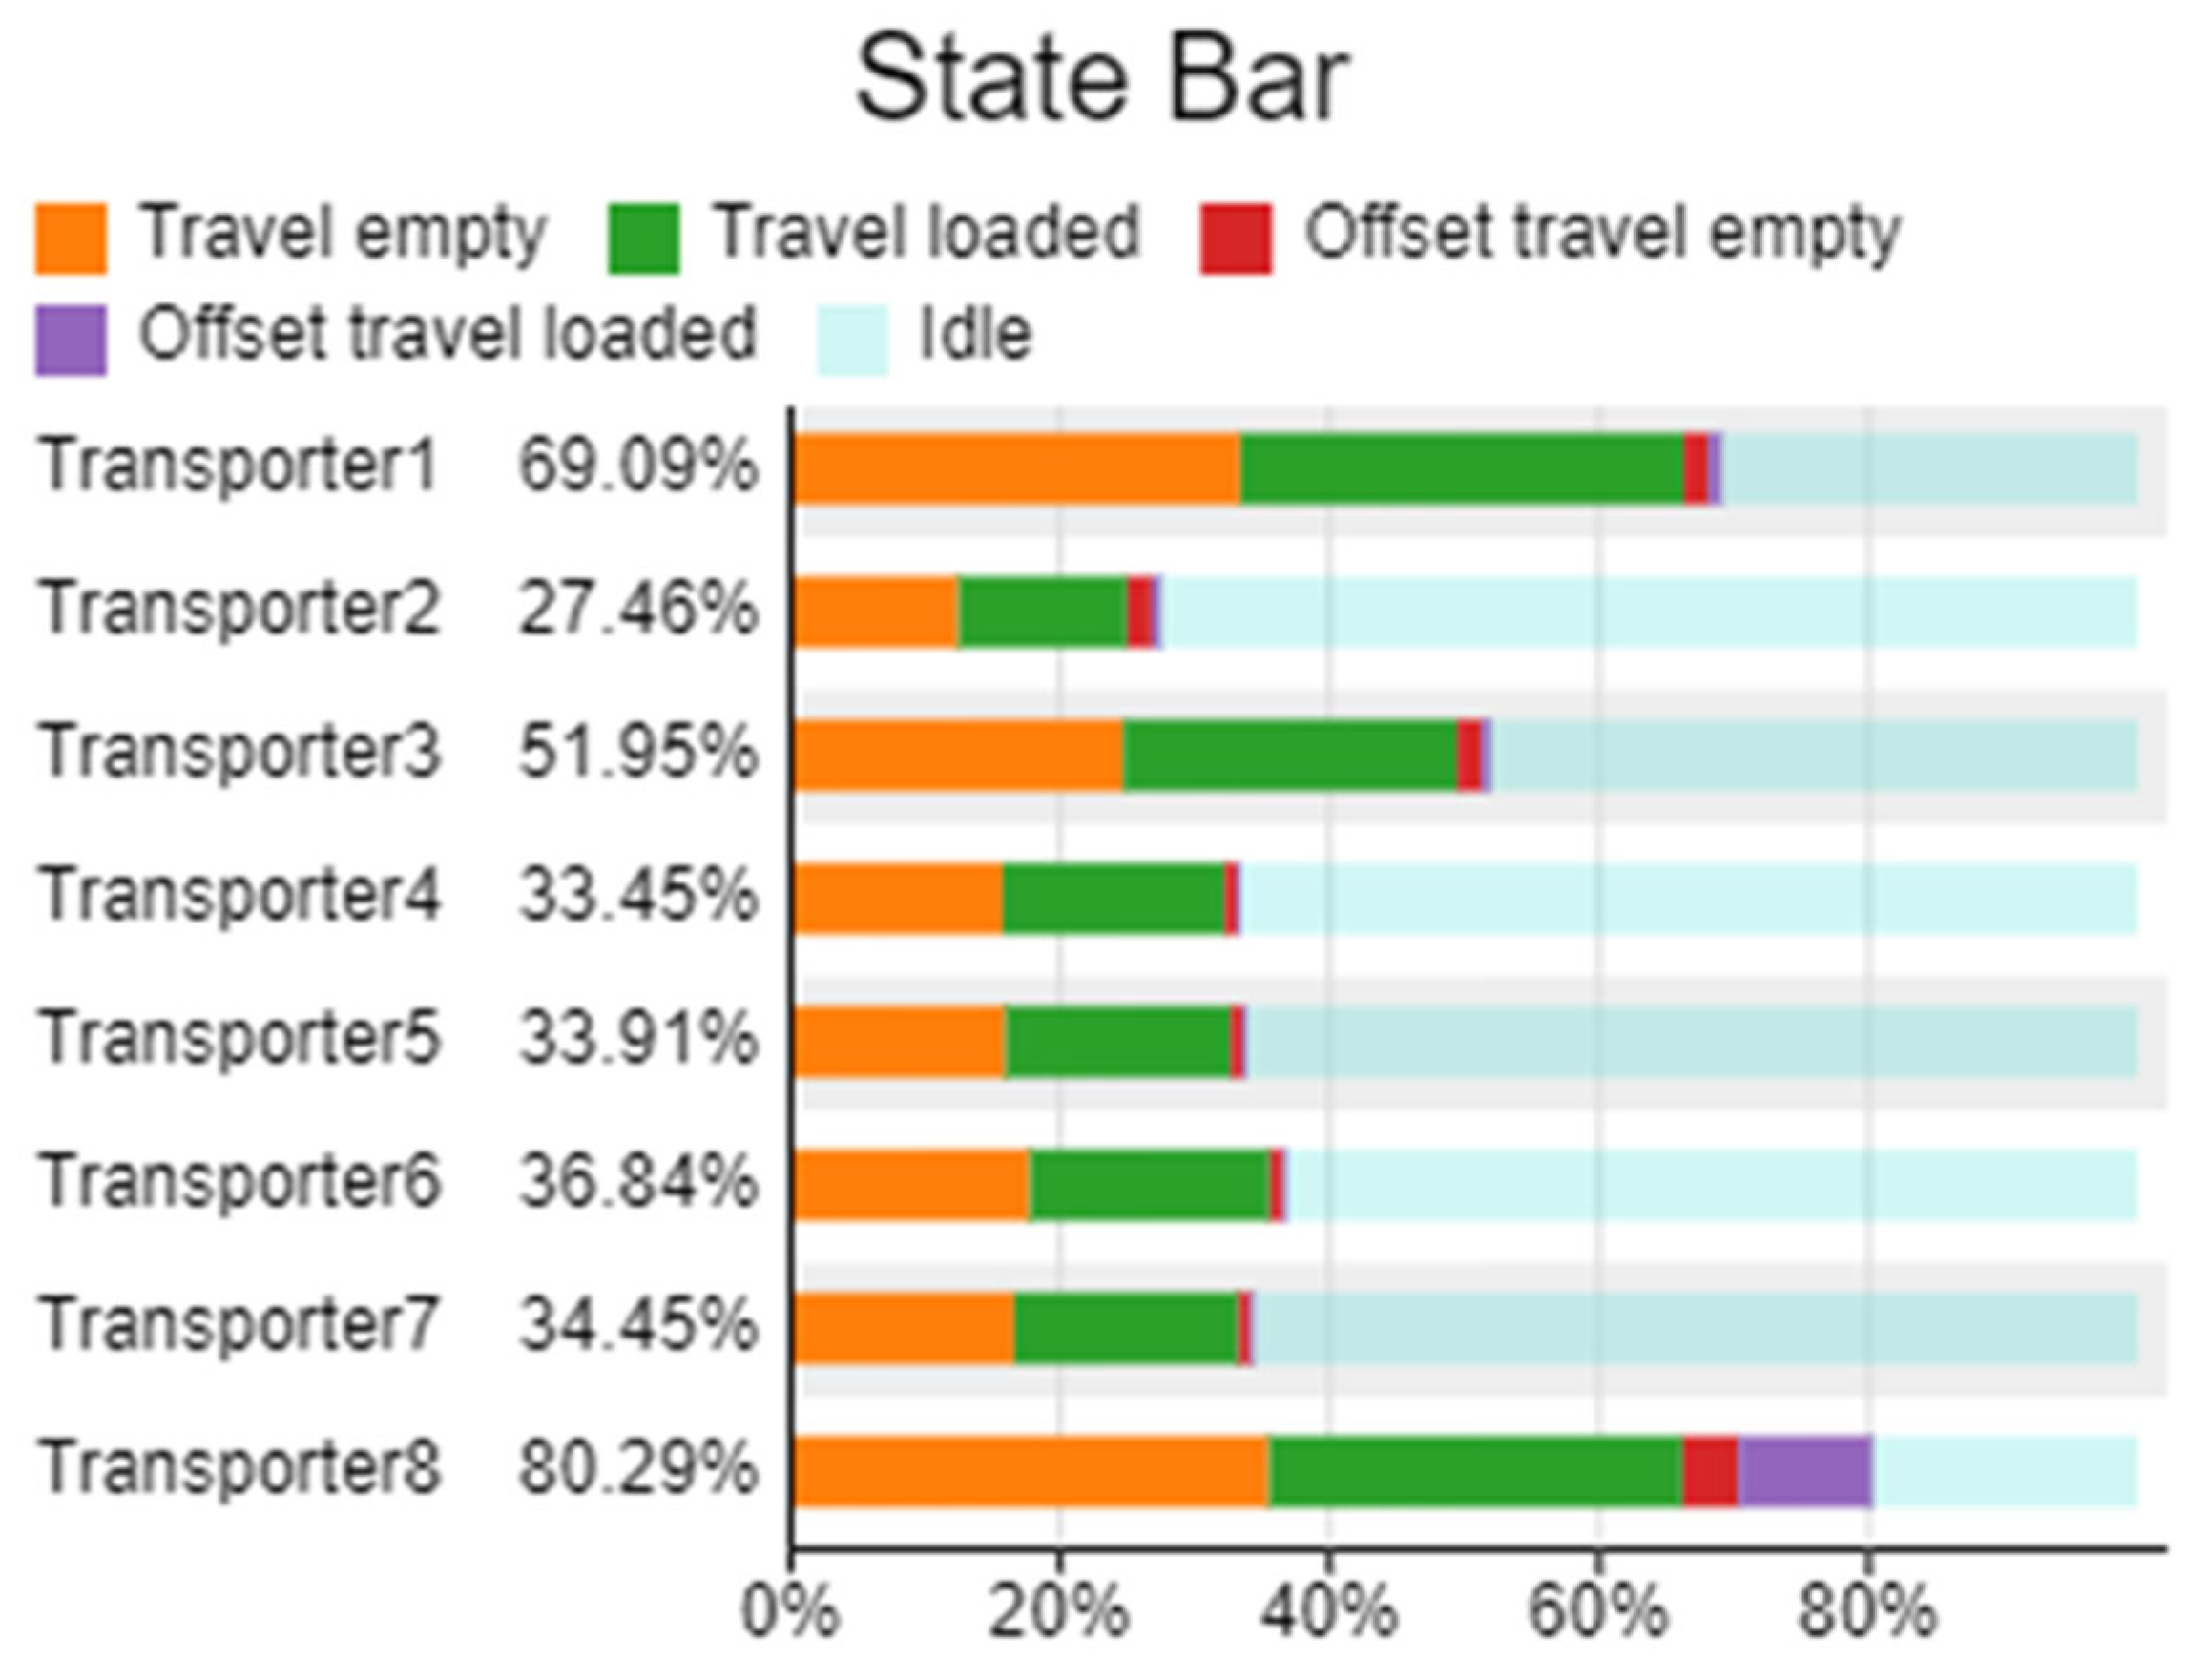
In the analysis of the logistical process parameter related to inter-operational transport, the simulation results also provided data on the utilization levels of the transport vehicles during the production process (Figure 7).
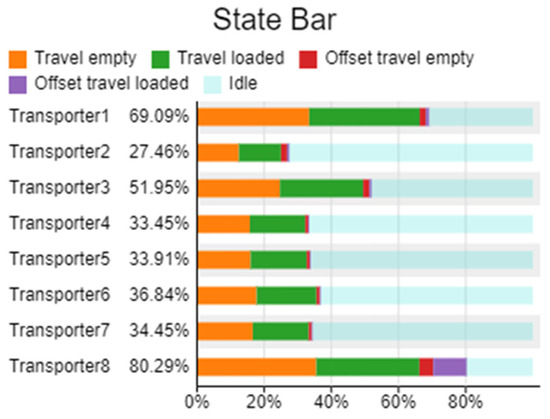
Figure 7.
Utilization level of internal transport means within the production process.
The results obtained indicate that forklifts number 1 and 8 (Transporter1 and Transporter8) demonstrated the highest utilization rates in the internal transport process, reaching utilization levels of 69.09% and 80.29%, respectively. In contrast, forklift number 2 (Transporter2), responsible for transportation between operations 20 and 30, exhibited the lowest utilization rate among all vehicles, at 27.46%.
Based on the conducted study and the adopted methodology, an analysis was carried out to determine the emission levels of carbon dioxide (CO2) and nitrogen oxides (NOX) for two types of forklift propulsion systems: LPG and diesel engines. The CO2 emission analysis showed that LPG-powered forklifts generated a total of 221,414.3 g of CO2, while diesel-powered forklifts emitted 128,670.8 g of CO2. In terms of NOX emissions, LPG forklifts produced 2200.9 g, compared to 1219.23 g generated by diesel forklifts. These results highlight a significant difference in emission levels, which may be crucial for industrial efforts to reduce environmental pollution.
The comparison of emissions between these two types of propulsion systems enables conclusions to be drawn regarding potential future directions for reducing emissions in the context of internal transport systems.
Based on the computer simulation and the findings related to CO2 and NOX emission levels, measures were taken to reduce the total distance traveled by internal transport vehicles and to decrease their number, without affecting the overall duration of the production process.
Consequently, the layout of the workstations performing operations 20, 30, and 40 was modified. This adjustment aimed to reduce the transport distances required for forklifts, as shown in Figure 8.

Figure 8.
Material flow diagram in the production process after implementation of improvements.
Due to the utilization levels of production workstations involved in transport operations, it was determined that it is feasible to perform internal transport operations between operations 40–50 and 50–60 using a single forklift, namely Transporter4 and Transporter6, respectively. This approach may lead to a reduction in carbon dioxide (CO2) and nitrogen oxide (NOX) emissions, while simultaneously lowering the overall manufacturing process costs.
To verify the effectiveness of the proposed solutions, an additional simulation was conducted to analyze the parameters generated by the production process. The results indicated that the utilization levels of transport equipment operating between operations 10–20, 20–30, 30–40, and 50–60 increased, thereby allowing for a more efficient use of forklifts despite a reduction in their total number. The highest increase in utilization was observed for Transporter3, amounting to 13.67 percentage points. In contrast, as a result of the rearrangement of the production workstations, the utilization rate of internal transport between operations 40–50 decreased by 7.83 percentage points (Figure 9).
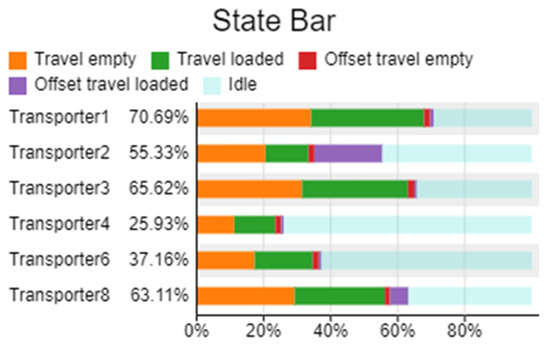
Figure 9.
Utilization level of internal transport means within the production process after implementation of improvements.
The total distance traveled by all transport vehicles was reduced from approximately 70,680.0 m to 58,582.3 m as a result of the implemented changes in the layout of production workstations and the reduction in the number of transport vehicles (Figure 10).
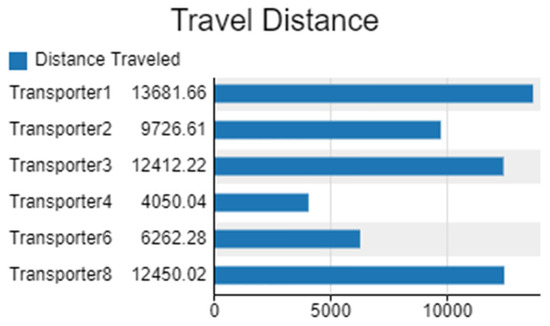
Figure 10.
Distance covered by internal transport means within the production process after implementation of improvements.
Based on the obtained simulation results, a comparative analysis was conducted regarding the levels of generated carbon dioxide (CO2) and nitrogen oxides (NOX) emissions. In the analyzed case, a reduction in CO2 emissions was observed—from 128,670.8 g (LPG-powered forklifts) and 221,414.3 g (diesel-powered) to 106,643.1 g and 183,509.5 g, respectively, following the implemented improvements (Figure 11).
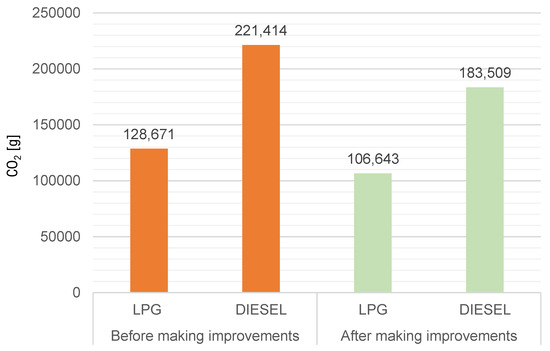
Figure 11.
CO2 Emission levels before and after the implementation of improvements.
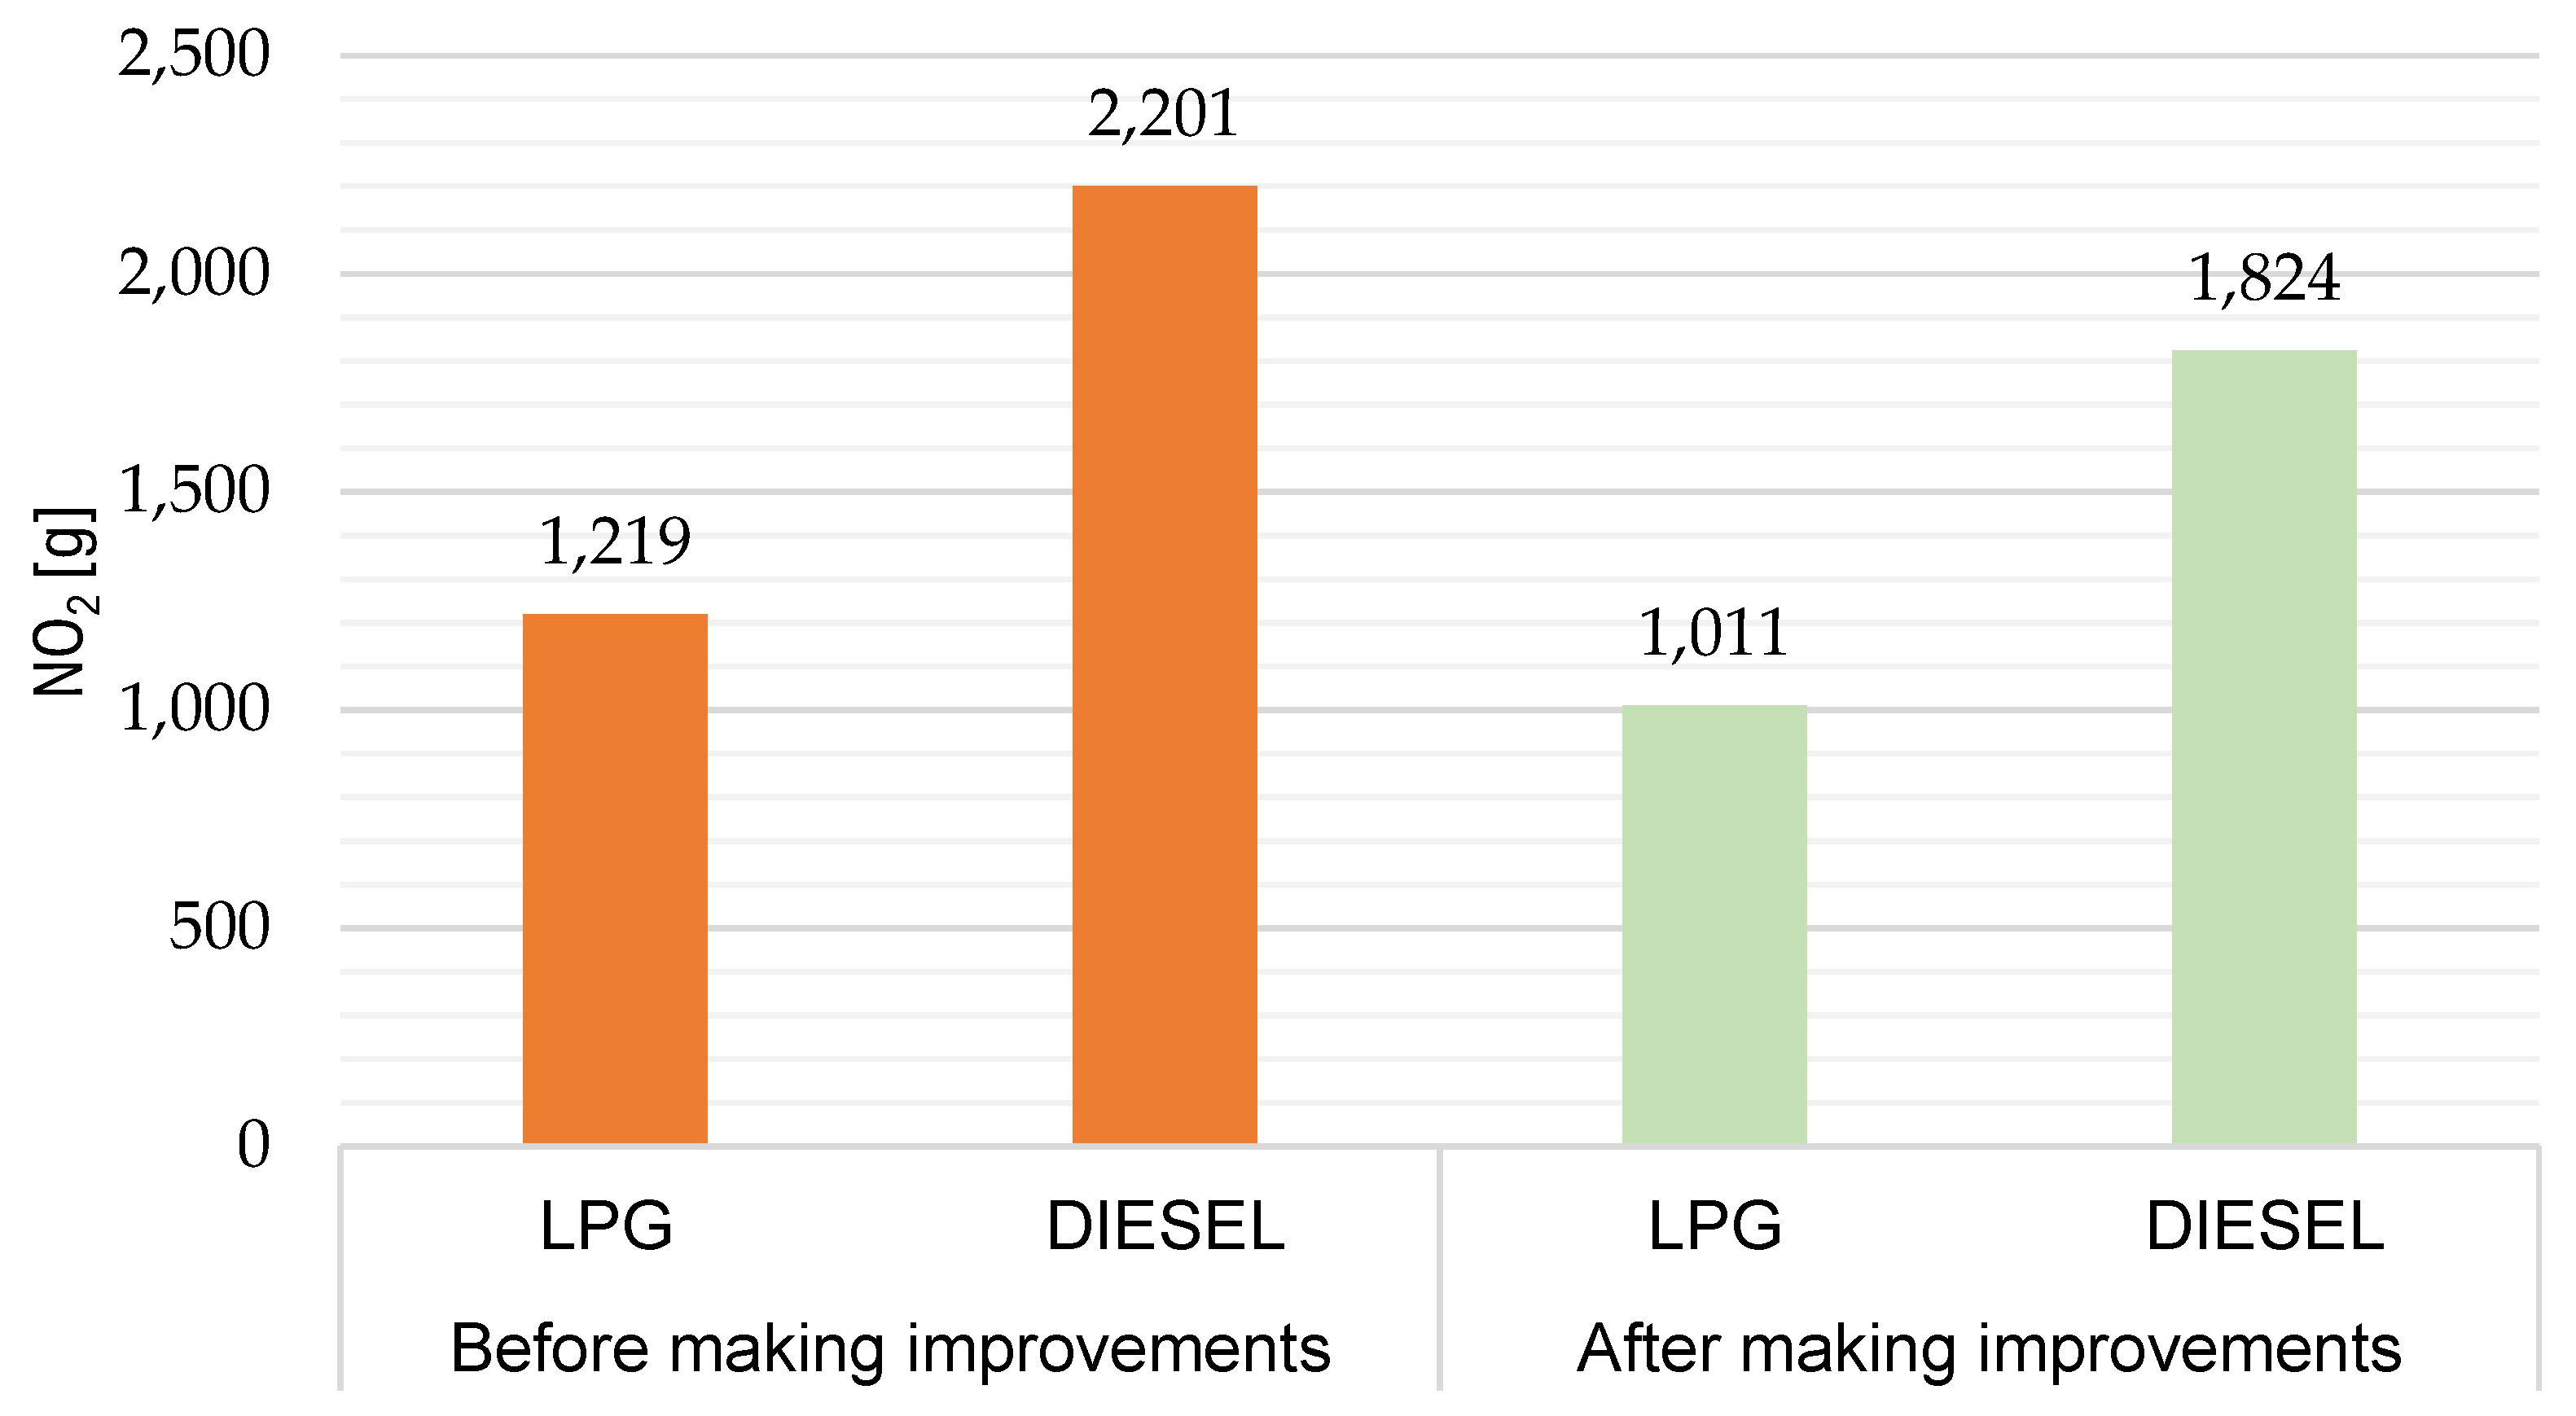
As a result of the optimization measures implemented, which included rearranging production workstations and reducing the number of internal transport means, a significant decrease in nitrogen oxides (NOx) emissions was observed. For LPG-powered forklifts, NOx emissions were reduced by 208.7 g–from 1219.2 g before the improvements to 1010.5 g after their implementation. An even greater reduction in emissions was noted for forklifts equipped with diesel engines, where the NO2 emission level decreased by approximately 376.8 g. Detailed values and a visualization of the results are presented in Figure 12.
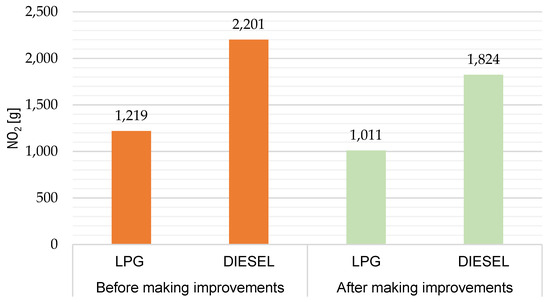
Figure 12.
NOX emission levels before and after the implementation of improvements.
4. Discussion
Based on the obtained data, it was found that computer simulation not only enables the accurate reproduction of the production process but also facilitates the identification of inefficiencies related to the improper utilization of transport resources. In particular, it was demonstrated that selected forklifts were used unevenly, indicating the potential for improvements both in the number of transport units and in their allocation to specific operations.
The introduction of changes in the layout of production workstations and the reduction in the number of forklifts allowed for a significant decrease in the total travel distance covered by internal transport means. This resulted in a noticeable reduction in emissions of both CO2 and NOX, regardless of the type of powertrain used (LPG or diesel). These findings confirm that appropriate spatial reorganization of the production process, supported by simulation analysis, can serve as an effective tool for implementing sustainable development strategies in industry.
As previously mentioned, the literature contains few studies combining the analysis of internal transport flows with environmental assessment from an operational perspective, based on real process data and measurable emission indicators. The present research fills this identified gap by demonstrating that simulation tools can be used not only to optimize costs or production time but also as a source of data enabling environmentally conscious decision-making aimed at emission reduction.
The conclusions drawn from the analyses support the validity of implementing computer simulation-based methods in production planning and organizational improvement processes, particularly in the context of increasing environmental requirements and the need to reduce the carbon footprint of industrial enterprises.
Moreover, although the study was conducted using a specific production process from the metal industry as a case study, the adopted methodology can be adapted to other industrial sectors where inter-operational transport occurs, such as the automotive, electronics, food, or pharmaceutical industries. A key condition for such generalisation is the ability to identify the material flows and operational parameters of the transport units, which can then be implemented within the simulation environment.
Future research could cover a broader range of production scenarios, including the use of alternative power sources (such as electric or hydrogen propulsion systems) and the automation of internal transport, which may constitute another important stage in the development of low-emission production systems. In particular, analyzing the efficiency of electric-powered vehicles appears justified, since the level of emissions generated by such vehicles largely depends on the source of the electricity used. When electricity comes from renewable sources, a significant reduction in the carbon footprint can be achieved; however, energy derived from fossil fuels may considerably limit the environmental benefits of electrification. Therefore, a comprehensive evaluation should include not only the technical and organisational parameters but also a complete energy balance of the solution under analysis.
It is also worth noting that although this analysis focuses primarily on CO2 and NOX emissions as key environmental indicators, a full assessment of the internal transport system’s impact should also address other aspects of sustainability. These include forklift energy consumption, maintenance costs and frequency, noise generated during operation, as well as broader life cycle emissions (e.g., vehicle manufacturing and disposal). Incorporating these additional criteria into future analyses—through multi-criteria evaluation or life cycle assessment (LCA)—would enable a more holistic understanding of the environmental and economic trade-offs associated with internal transport optimisation.
5. Conclusions
This paper presents the results of research on the possibility of reducing carbon dioxide (CO2) and nitrogen oxides (NOX) emissions through the reorganization of the internal transport process in a manufacturing plant. To this end, computer simulation was conducted using the FlexSim 22.2.1 environment, aiming to replicate real production conditions and assess the impact of organizational changes on the environmental and logistical parameters of the process.
Based on the analysis, it was found that changing the layout of workstations and reducing the number of transport units shortened the distance traveled by forklifts from 70,683 m to 58,582.3 m. This directly translated into a decrease in pollutant emissions. CO2 emissions were reduced as follows:
- For LPG forklifts—from 221,414.3 g to 183,509.5 g.
- For forklifts with diesel engines—from 128,670.8 g to 106,643.1 g.
- An even more significant reduction was observed in NOX emissions:
- For LPG forklifts—from 1219.2 g to 1010.5 g (a decrease of 208.7 g).
- For diesel forklifts—from 2200.9 g to 1824.1 g (a decrease of 376.8 g).
The computer simulation made it possible to evaluate the utilization level of inter-operational transport units and to identify areas of untapped potential. It should also be noted that, as a result of the changes in the workstation layout, the duration of the production process was reduced by 491 s, while simultaneously decreasing the number of transport units required.
In summary, the efforts to optimize the internal transport process for a single manufacturing process involving a batch of 500 finished products have confirmed the potential to reduce CO2 and NOX emissions by approximately 18 percentage points.
The conducted computer simulation enabled the evaluation of the utilization levels of inter-operational transport means and the identification of areas with untapped potential. This allowed the introduction of organizational improvements without compromising production process efficiency.
The presented research methodology, based on the analysis of real operational data, can be successfully applied to other production processes aimed at optimizing the organization of internal transport while considering environmental aspects. The high level of versatility of the proposed approach allows adaptation to diverse production scenarios and technological conditions.
It should be noted that the relative significance of CO2 and NOX emissions varies by industry; for instance, CO2 reductions are prioritized in large-scale energy and material production, while NOX emissions remain a major challenge in transport and combustion-heavy processes. Recent advances in catalytic materials for simultaneous CO2 conversion and NOX reduction further demonstrate the technological importance of addressing both pollutants simultaneously [54,55].
Author Contributions
Conceptualization, S.P.; methodology, S.P. and T.M.; software, S.P. and M.K.-C.; validation, A.F., A.S.-T.; formal analysis, A.F.; investigation, S.P. and T.M.; resources, S.P.; data curation, S.P.; writing—original draft preparation, S.P. and T.M.; writing—review and editing, A.F. and M.K.-C.; visualization, S.P., T.M. and A.S.-T. All authors have read and agreed to the published version of the manuscript.
Funding
This paper was created with the financial support of the Polish Ministry for Science and Higher Education under internal grant BK-224/RM1/2025 (11/010/BK_25/0057).
Institutional Review Board Statement
Not applicable.
Informed Consent Statement
Not applicable.
Data Availability Statement
The data presented in this study are available on request.
Conflicts of Interest
The authors declare no conflicts of interest.
References
- Yang, Z.; Tate, J.E.; Morganti, E.; Shepherd, S.P. Real-work CO2 and NOx emission from refrigerated vans. Sci. Total Environ. 2021, 763, 142974. [Google Scholar] [CrossRef] [PubMed]
- Friedlingstein, P.; Houghton, R.; Marland, G.; Hackler, J.; Boden, T.A.; Conway, T.J.; Canadell, J.G.; Raupach, M.R.; Ciais, P.; Quéré, C.L. Update on CO2 emissions. Nat. Geosci. 2010, 3, 811–812. [Google Scholar] [CrossRef]
- Sun, W.; Zhou, Y.; Lv, J.; Wu, J. Assessment of multi-air emissions: Case of particulate matter (dust), SO2, NOx, and CO2 form iron and steel industry of Chona. J. Clean. Prod. 2019, 232, 350–358. [Google Scholar] [CrossRef]
- Abdul-Wahab, S.; Fadlallah, S.; Al-Rashdi, M. Evaluation of the impact of ground-level concentrations of SO2, NOx, CO, and PM10 emitted from a steel melting plant on Muscat, Oman. Sustain. Cities Soc. 2018, 38, 675–683. [Google Scholar] [CrossRef]
- Zhang, K.; Wang, X. Pollution Haven Hypothesis of Global CO2, SO2, NOx—Evidence from 43 Economies and 56 Sectors. Int. J. Environ. Res. Public Health 2021, 18, 6552. [Google Scholar] [CrossRef]
- Liu, J.; Qu, J.; Zhao, K. Is China’s development conforms to the Environmental Kuznets Curve hypothesis and the pollution haven hypothesis? J. Clean. Prod. 2019, 234, 787–796. [Google Scholar] [CrossRef]
- Brodny, J.; Tutak, M. The Use of Artificial Neural Networks to Analyze Greenhouse Gas and Air Pollutant Emissions from the Mining and Quarrying Sector in the European Union. Energies 2020, 13, 1925. [Google Scholar] [CrossRef]
- Wang, Y.; Yuan, Z.; Yan, J.; Zhang, H.; Guan, Q.; Rao, S.; Jiang, C.; Duan, Z. Analysis of Synergistic Drivers of CO2 and NOX Emissions from Thermal Power Generating Units in Beijing–Tianjin–Hebei Region, 2010–2020. Sustainability 2024, 16, 7554. [Google Scholar] [CrossRef]
- Qin, X.; Xie, P.; Liao, C. Study on the synergistic effect of NOx and CO2 emission reduction in the industrial sector of Guangzhou. Front. Environ. Sci. 2025, 13, 1497121. [Google Scholar] [CrossRef]
- Lee, C.Y.; Zhou, P. Directional shadow price estimation of CO2, SO2 and NOx in the United States coal power industry 1990–2010. Energy Econ. 2015, 51, 493–502. [Google Scholar] [CrossRef]
- Song, X.; Hao, Y. Research on the Vehicle Emission Characteristics and Its Prevention and Control Strategy in the Central Plains Urban Agglomeration, China. Sustainability 2021, 13, 1119. [Google Scholar] [CrossRef]
- Lin, X.; Yang, R.; Zhang, W.; Zheng, N.; Zhao, Y.; Wang, G.; Li, T.; Cai, Q. An integrated view of correlated emissions of greenhouse gases and air pollutants in China. Carbon Balance Manag. 2023, 18, 9. [Google Scholar] [CrossRef] [PubMed]
- Jain, N.; Bhatia, A.; Pathak, H. Emission of Air Pollutants from Crop Residue Burning in India. Aerosol Air Qual. Res. 2014, 14, 422–430. [Google Scholar] [CrossRef]
- Huang, Y.; Ng, E.C.Y.; Zhou, J.L.; Surawski, N.C.; Chan, E.F.C.; Hong, G. Eco-driving technology for sustainable road transport: A review. Renew. Sustain. Energy Rev. 2018, 93, 596–609. [Google Scholar] [CrossRef]
- Xu, Z.; Jiang, T.; Zheng, N. Developing and analyzing eco-driving strategies for on-road emission reduction in urban transport system—A VR-enabled digital-twin approach. Chemosphere 2022, 305, 135372. [Google Scholar] [CrossRef]
- Abou-Senna, H.; Radwan, E.; Westerlund, K.; Cooper, D. Using traffic simulation model (VISSIM) with an emission model (MOVES) to predict emissions from vehicles on a limited-access highway. J. Air Waste Manag. Assoc. 2013, 63, 818–831. [Google Scholar] [CrossRef]
- Jayawardana, V.; Wu, C. Learning Eco-Driving Strategies at Signalized Intersections. In Proceedings of the 2022 European Control Conference (ECC), London, UK, 12–15 July 2022; pp. 383–390. [Google Scholar] [CrossRef]
- Mustapa, S.I.; Bekhet, H.A. Analysis of CO2 emissions reduction in the Malaysian transportation sector: An optimization approach. Energy Policy 2016, 89, 171–183. [Google Scholar] [CrossRef]
- Roy, A.; Pramanik, S. A review of hydrogen fuel patch to emission reduction in the surface transport industry. Int. J. Hydrogen Energy 2024, 49, 792–821. [Google Scholar] [CrossRef]
- Stolz, B.; Held, M.; Georges, G.; Boulouchos, K. The CO2 reduction potential of shore-side electricity in Europe. Appl. Energy 2021, 285, 116425. [Google Scholar] [CrossRef]
- Ajanovic, A.; Sayer, M.; Haas, R. The economics and environmental benignity of different colors of hydrogen. Int. J. Hydrogen Energy 2022, 47, 24136–24154. [Google Scholar] [CrossRef]
- Ishaq, H.; Dincer, I. Comparative assessment of renewable energy-based hydrogen production methods. Renew. Sustain. Energy Rev. 2021, 135, 110192. [Google Scholar] [CrossRef]
- Gallo, M.; Marinelli, M. The Use of Hydrogen for Traction in Freight Transport: Estimating the Reduction in Fuel Consumption and Emissions in a Regional Context. Energies 2023, 16, 508. [Google Scholar] [CrossRef]
- Wanniarachchi, S.; Hewage, K.; Wirasinghe, C.; Chhipi-Shrestha, G.; Karunathilake, H.; Sadiq, R. Transforming road freight transportation from fossils to hydrogen: Opportunities and challenges. Int. J. Sustain. Transp. 2022, 17, 552–572. [Google Scholar] [CrossRef]
- Pan, S.; Ballot, E.; Fontane, F. The reduction of greenhouse gas emissions from freight transport by pooling supply chins. Int. J. Prod. Econ. 2013, 143, 86–94. [Google Scholar] [CrossRef]
- Ballot, E.; Fontane, F. Reducing transportation CO2 emissions through pooling of supply networks: Perspectives from a case study in French retail chains. Prod. Plan. Control. 2010, 21, 640–650. [Google Scholar] [CrossRef]
- El Moussaoui, A.E. Impact of logistics pooling on reduction of CO2 emissions in last-mile logistics. Manag. Sustain. Arab. Rev. 2025, 4, 383–401. [Google Scholar] [CrossRef]
- Jerbi, A.; Jribi, H.; Masmoudi, F. Comparison of the Impact of Different Pooling Strategies on Supply Chains CO2 Emissions: Simulation Approach. In International Conference Design and Modeling of Mechanical Systems; Lecture Notes in Mechanical Engineering; Springer: Cham, Switzerland, 2023. [Google Scholar] [CrossRef]
- Jerbi, A.; Jribi, H.; Aljuaid, A.M.; Hachicha, W.; Masmoudi, F. Design of Supply Chain Transportation Pooling Strategy for Reducing CO2 Emissions Using a Simulation-Based Methodology: A Case Study. Sustainability 2022, 14, 2331. [Google Scholar] [CrossRef]
- Donthu, N.; Kumar, S.; Mukherjee, D.; Pandey, N.; Lim, W.C. How to conduct bibliometric analysis: An overview guidelines. J. Bus. Res. 2021, 133, 285–296. [Google Scholar] [CrossRef]
- Passas, I. Bibliometric Analysis: The Main Steps. Encyclopedia 2024, 4, 1014–1025. [Google Scholar] [CrossRef]
- Ellegaard, O.; Wallin, J.A. The bibliometric analysis of scholarly production: How great is the impact? Scientometrics 2015, 105, 1809–1831. [Google Scholar] [CrossRef]
- Zyoud, S.H. Global research trends of Middle East respiratory syndrome coronavirus: A bibliometric analysis. BMC Infect. Dis. 2016, 16, 255. [Google Scholar] [CrossRef] [PubMed]
- Cavalcante, W.Q.d.F.; Coelho, A.; Bairrada, C.M. Sustainability and Tourism Marketing: A Bibliometric Analysis of Publications between 1997 and 2020 Using VOSviewer Software. Sustainability 2021, 13, 4987. [Google Scholar] [CrossRef]
- Abdollahi, A.; Rejeb, K.; Rejeb, A.; Mostafa, M.M.; Zailani, S. Wireless Sensor Networks in Agriculture: Insights from Bibliometric Analysis. Sustainability 2021, 13, 12011. [Google Scholar] [CrossRef]
- Pawlak, S.; Małysa, T.; Fornalczyk, A. Analysis of Production Process Parameters Using Computer Simulation at the Planning Stage. Appl. Sci. 2024, 14, 10863. [Google Scholar] [CrossRef]
- Gola, A.; Wiechetek, Ł. Modelling and simulation production flow in job-shop production system with Enterprise Dynamics software. Appl. Comput. Sci. 2017, 13, 87–97. [Google Scholar] [CrossRef]
- Fedorko, G.; Molnár, V.; Strohmandl, J.; Horváthová, P.; Strnad, D.; Cech, V. Research on Using the Tecnomatix Plant Simulation for Simulation and Visualization of Traffic Processes at the Traffic Node. Appl. Sci. 2022, 12, 12131. [Google Scholar] [CrossRef]
- Barosz, P.; Gołda, G.; Kampa, A. Efficiency Analysis of Manufacturing Line with Industrial Robots and Human Operators. Appl. Sci. 2020, 10, 2862. [Google Scholar] [CrossRef]
- Wang, Y.R.; Chen, A.N. Production logistics simulation and optimization of industrial enterprise based on FlexSim. Int. J. Simul. Model. 2016, 15, 732–741. [Google Scholar] [CrossRef]
- Sarvan Kumar, U.; Shivraj Narayan, Y. Productivity improvement in a windows manufacturing layout using FlexSim simulation software. Int. J. Res. Advent. Technol. 2015, 3, 86–90. [Google Scholar]
- Huihui, S.; Xiaoxia, M.; Xiangguo, M. Simulation and optimization of warehouse operation based on FlexSim. J. Appl. Sci. Eng. Innov. 2016, 3, 125–128. [Google Scholar]
- Kim, J.W.; Park, J.S.; Kim, S.K. Application of FlexSim software for developing cyber learning factory for smart factory education and training. Multimed. Tools Appl. 2020, 79, 16281–16297. [Google Scholar] [CrossRef]
- Kikolski, M. Identification of production bottlenecks with the use of Plant Simulation Software. Econ. Manag. 2016, 8, 103–112. [Google Scholar] [CrossRef]
- Pekarcikova, M.; Trebuna, P.; Kliment, M.; Dic, M. Solution of Bottlenecks in the Logistics Flow by Applying the Kanban Module in the Tecnomatix Plant Simulation Software. Sustainability 2021, 13, 7989. [Google Scholar] [CrossRef]
- Ferro, R.; Cordeiro, G.A.; Ordóñez, R.E.C.; Beydoun, G.; Shukla, N. An Optimization Tool for Production Planning: A Case Study in a Textile Industry. Appl. Sci. 2021, 11, 8312. [Google Scholar] [CrossRef]
- Dias, A.S.M.E.; Antunes, R.M.G.; Abreu, A.; Anes, V.; Navas, H.V.G.; Morgado, T.; Calado, J.M.F. Utilization of the Arena simulation software and Lean improvements in the management of metal surface treatment processes. Procedia Comput. Sci. 2022, 204, 140–147. [Google Scholar] [CrossRef]
- Lorenc, A. Cross-Docking Layout Optimization in FlexSim Software Based on Cold Chain 4PL Company. Sustainability 2024, 16, 9620. [Google Scholar] [CrossRef]
- Félix-Cigalat, J.S.; Domingo, R. Towards a Digital Twin Warehouse through the Optimization of Internal Transport. Appl. Sci. 2023, 13, 4652. [Google Scholar] [CrossRef]
- Foit, K.; Gołda, G.; Kampa, A. Integration and Evaluation of Intra-Logistics Processes in Flexible Production Systems Based on OEE Metrics, with the Use of Computer Modelling and Simulation of AGVs. Processes 2020, 8, 1648. [Google Scholar] [CrossRef]
- Pang, K.; Zhang, K.; Ma, S. Tailpipe emission characterizations of diesel-fueled forklifts under real-world operations using a portable emission measurement system. J. Environ. Sci. 2021, 100, 34–42. [Google Scholar] [CrossRef]
- Boenzi, F.; Digiesi, S.; Facchini, F.; Mummolo, G. Electric and LPG forklifts GHG assessment in material handling activities in actual operational conditions. In Proceedings of the 2017 IEEE International Conference on Service Operations and Logistics, and Informatics (SOLI), Bari, Italy, 18–20 September 2017; pp. 127–132. [Google Scholar] [CrossRef]
- Kępa, A. Analiza emisyjności wózków widłowych. Ekon. Organ. Logistyki 2024, 9, 53–62. [Google Scholar] [CrossRef]
- Wang, Y.; Cui, M.; Zhao, X.; Lu, G. Green synthesis of SrO bridged LaFeO₃/g-C₃N₄ nanocomposites for CO₂ conversion and bisphenol A degradation with new insights into mechanism. Catal. Sci. Technol. 2021, 11, 6432–6442. [Google Scholar] [CrossRef]
- Zhu, Y.; Yao, J.; Wang, Y.; Wang, S.; Zhang, Z.; Zhang, X.; Luo, Z.; Pan, J.; Yu, X.; Zhang, Z. Multifunctional MXene-Based Composite Sponges for Effective Photothermal Conversion and Solar-Driven CO₂ Reduction. ACS Appl. Nano Mater. 2024, 7, 8158–8168. [Google Scholar] [CrossRef]


Disclaimer/Publisher’s Note: The statements, opinions and data contained in all publications are solely those of the individual author(s) and contributor(s) and not of MDPI and/or the editor(s). MDPI and/or the editor(s) disclaim responsibility for any injury to people or property resulting from any ideas, methods, instructions or products referred to in the content. |
© 2025 by the authors. Licensee MDPI, Basel, Switzerland. This article is an open access article distributed under the terms and conditions of the Creative Commons Attribution (CC BY) license (https://creativecommons.org/licenses/by/4.0/).