
Analysis of Opportunities to Reduce CO2 and NOX Emissions Through the Improvement of Internal Inter-Operational Transport

 ,
,  , , and
Abstract
1. Introduction
2. Materials and Methods
- Ability to build model logic via programmed block-diagram schemes;
- System analysis through generated schematics, reports and spreadsheets;
- Applicability in industrial production contexts, including analysis of transport-resource utilization;
- Production-flow mapping, mapping of the process for supplying workstations with raw materials and other inputs, and an analysis of workstation and intermediate-storage workloads.
- —CO2 emissions generated by the internal transport vehicles;
- —NOX emissions generated by the internal transport vehicles;
- D—distance covered by internal transport vehicles;
- I—CO2 emission rate [g/km];
- R—NOX emission rate [g/km].
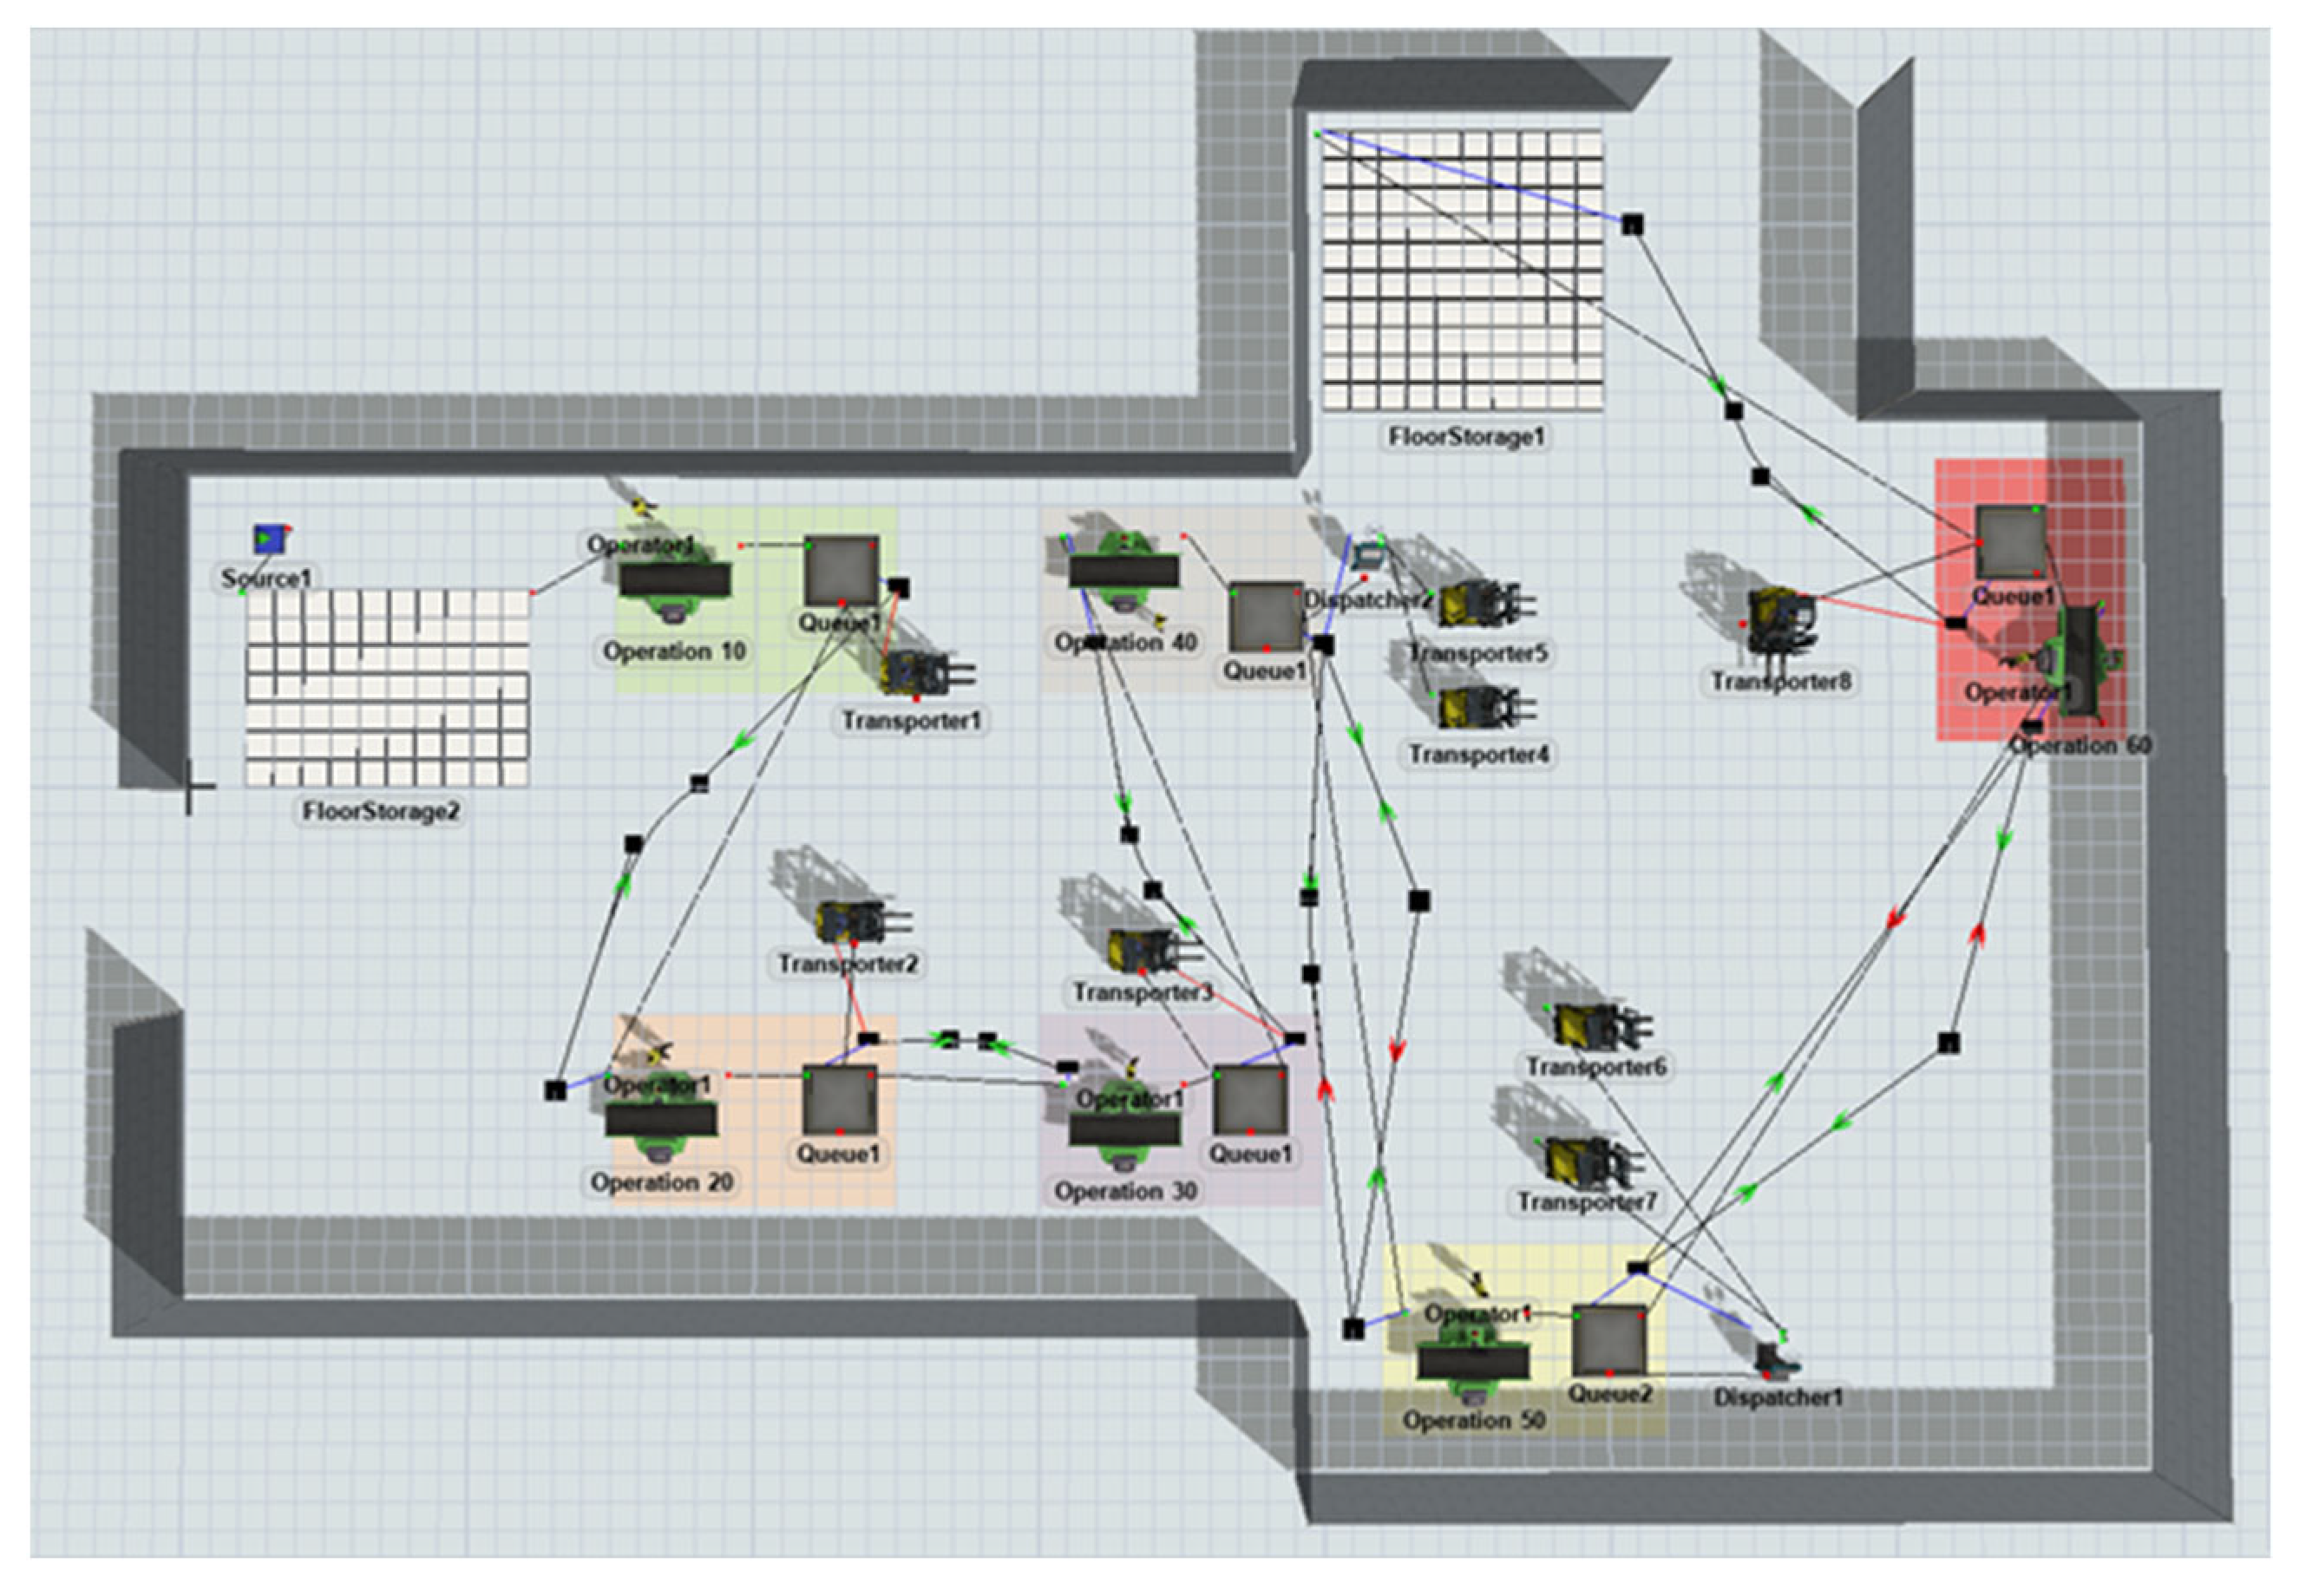
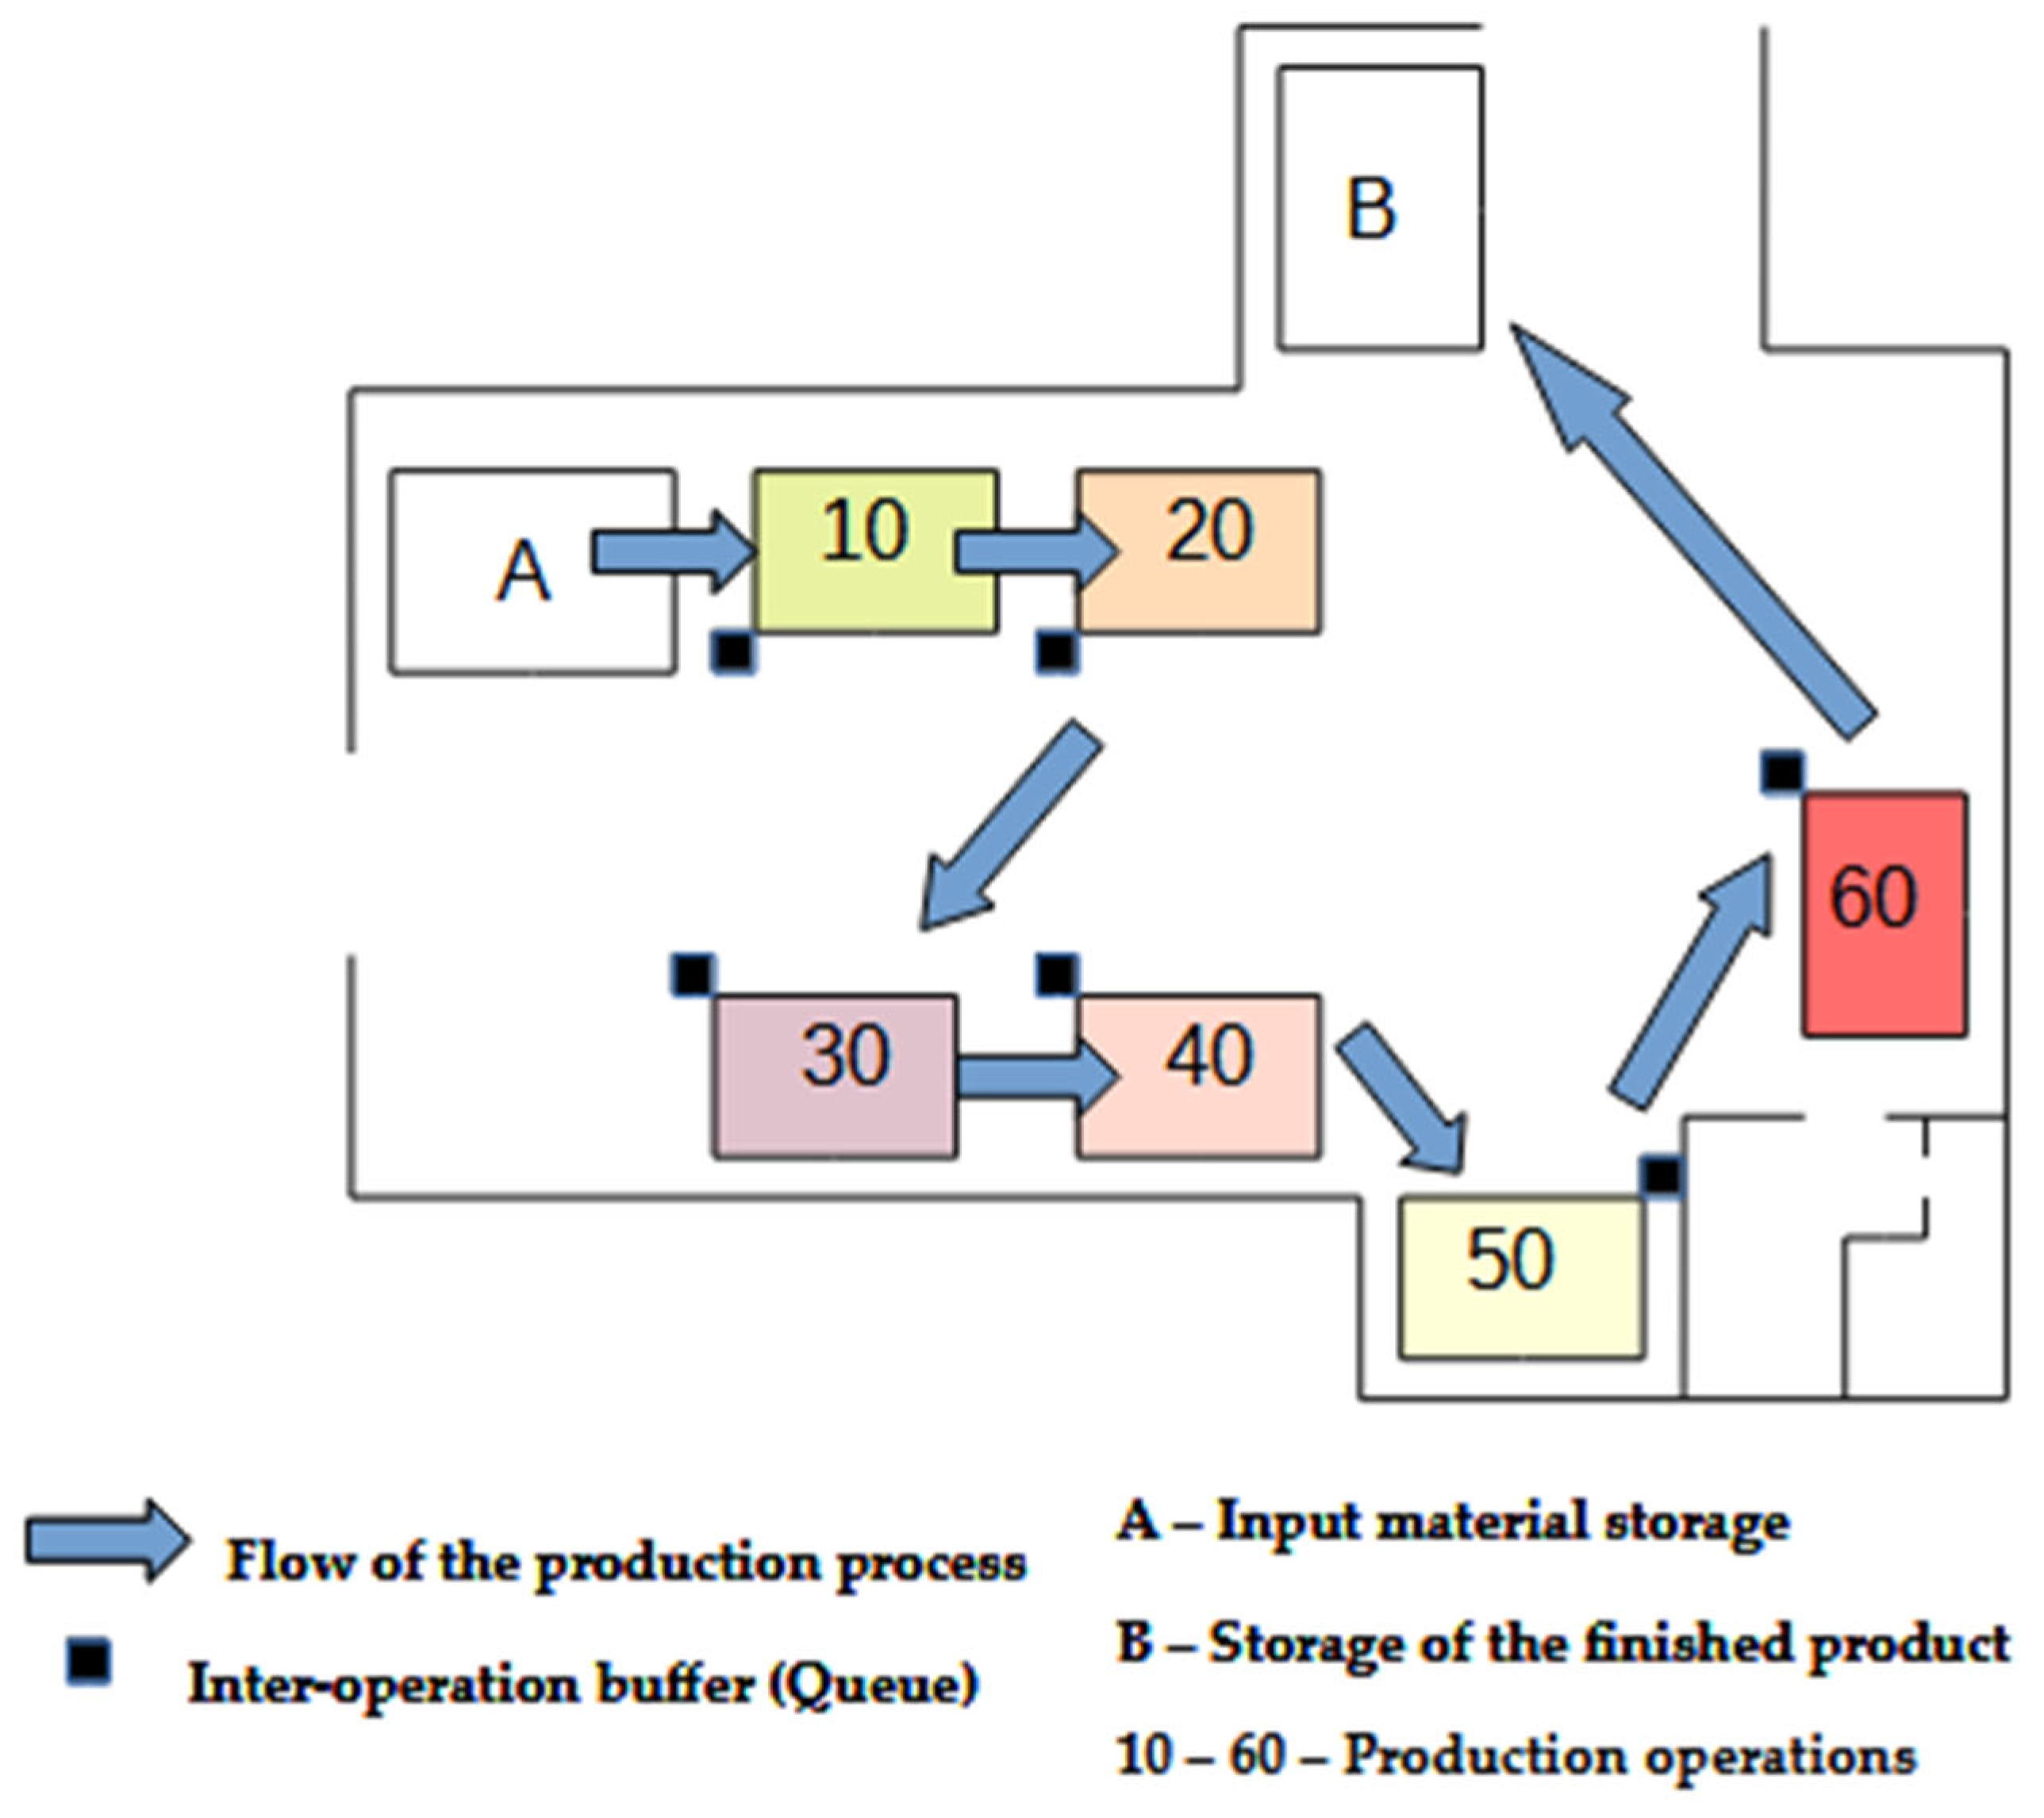
- The production process consists of n technological operations (denoted as i = 1, 2…, n).
- A transport task is required between each pair of consecutive operations.
- There are m available transport vehicles.
- Each vehicle travels a defined route of length dij [m] between operations i and j.
- Unit emissions of CO2 and NOX are known for each vehicle k, depending on the type of propulsion used.
- xijk ∈ {0, 1}—binary variable: 1 if vehicle k performs the transport between operations i and j, 0 otherwise.
- Yk ∈ {0, 1}—binary variable: 1 if vehicle k is active in the transport schedule, 0 otherwise.
- Dij—distance between operations i and j [m].
- CO2k—CO2 emission rate per meter for vehicle k [g/m].
- NOxk—NOX emission rate per meter for vehicle k [g/m].
- Tij—number of required transport trips between operations i and j.
- Minimize Σk = 1ᵐ Σi = 1ⁿ Σj = 1ⁿ Tij · dij · xijᵏ · (α · CO2k + β · NOxk)
- α and β are weighting factors assigned to CO2 and NOX emissions, respectively (they can be equal or reflect environmental priorities).
- Assignment constraint: Each transport task must be assigned to exactly one vehicle:
- 2.
- Vehicle usage limit: Restrict the maximum number of active transport vehicles:
- 3.
- Activation linkage: A vehicle can be assigned to a task only if it is marked as active:
3. Results
4. Discussion
5. Conclusions
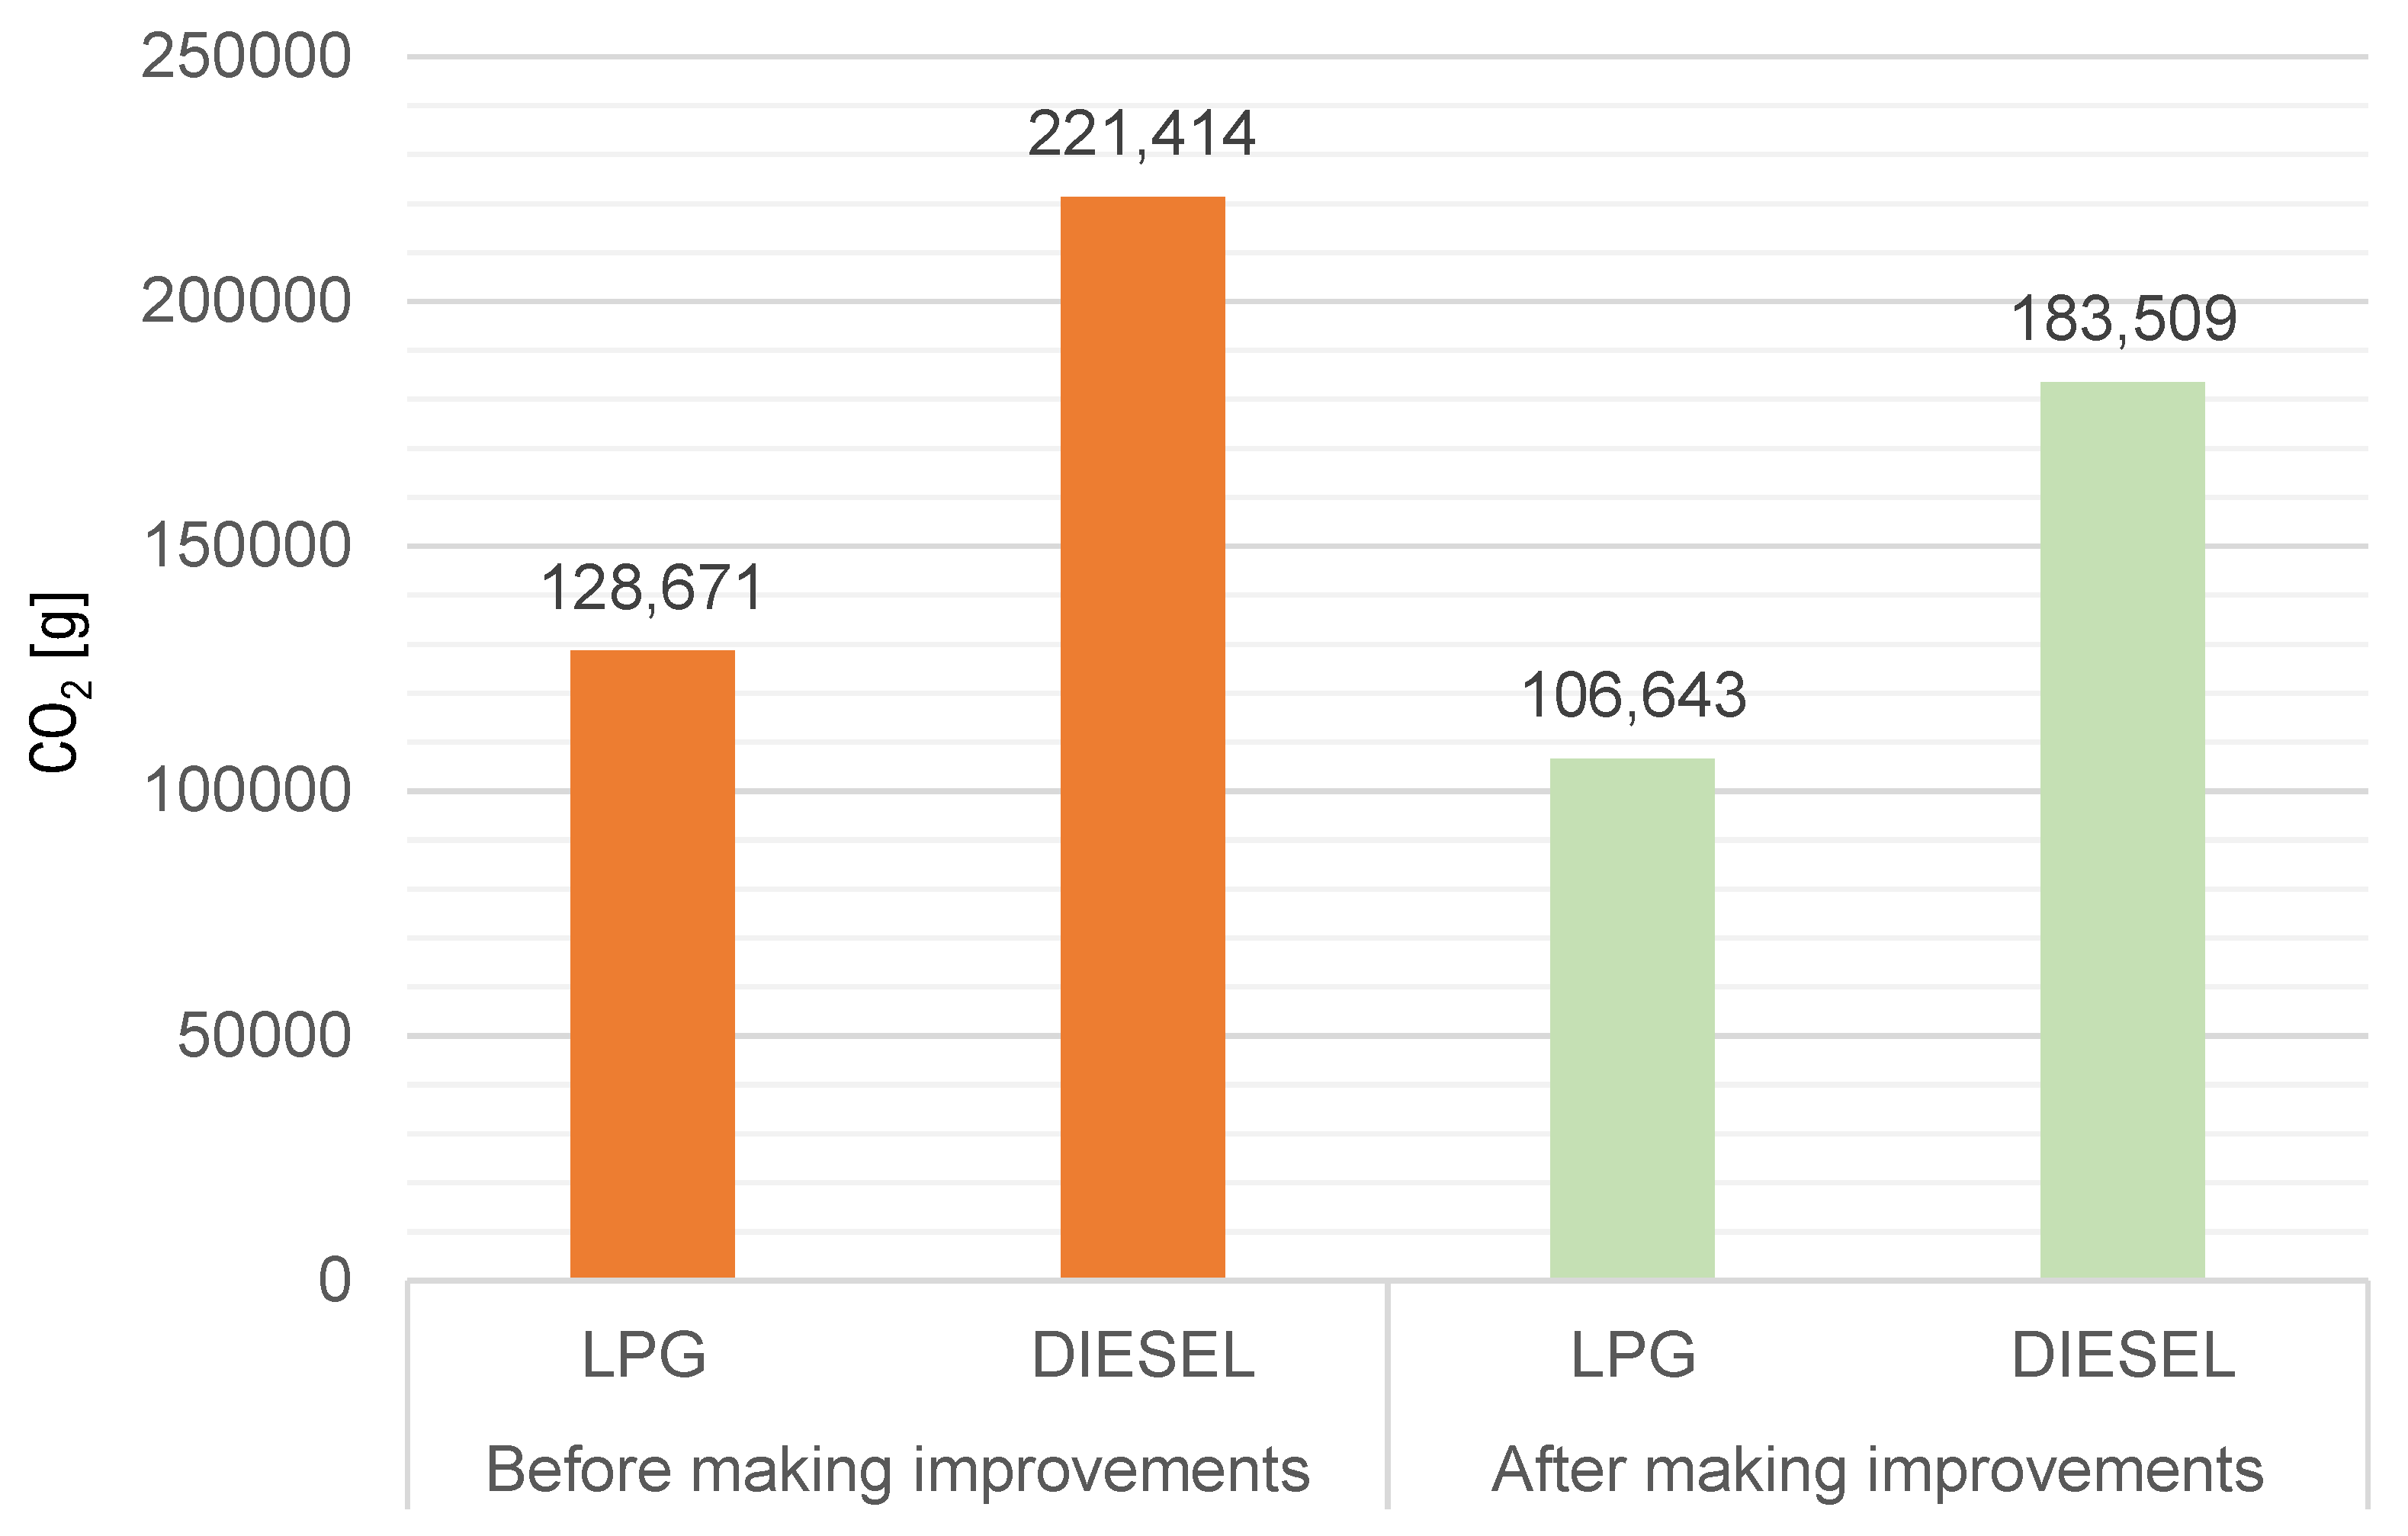
- For LPG forklifts—from 221,414.3 g to 183,509.5 g.
- For forklifts with diesel engines—from 128,670.8 g to 106,643.1 g.
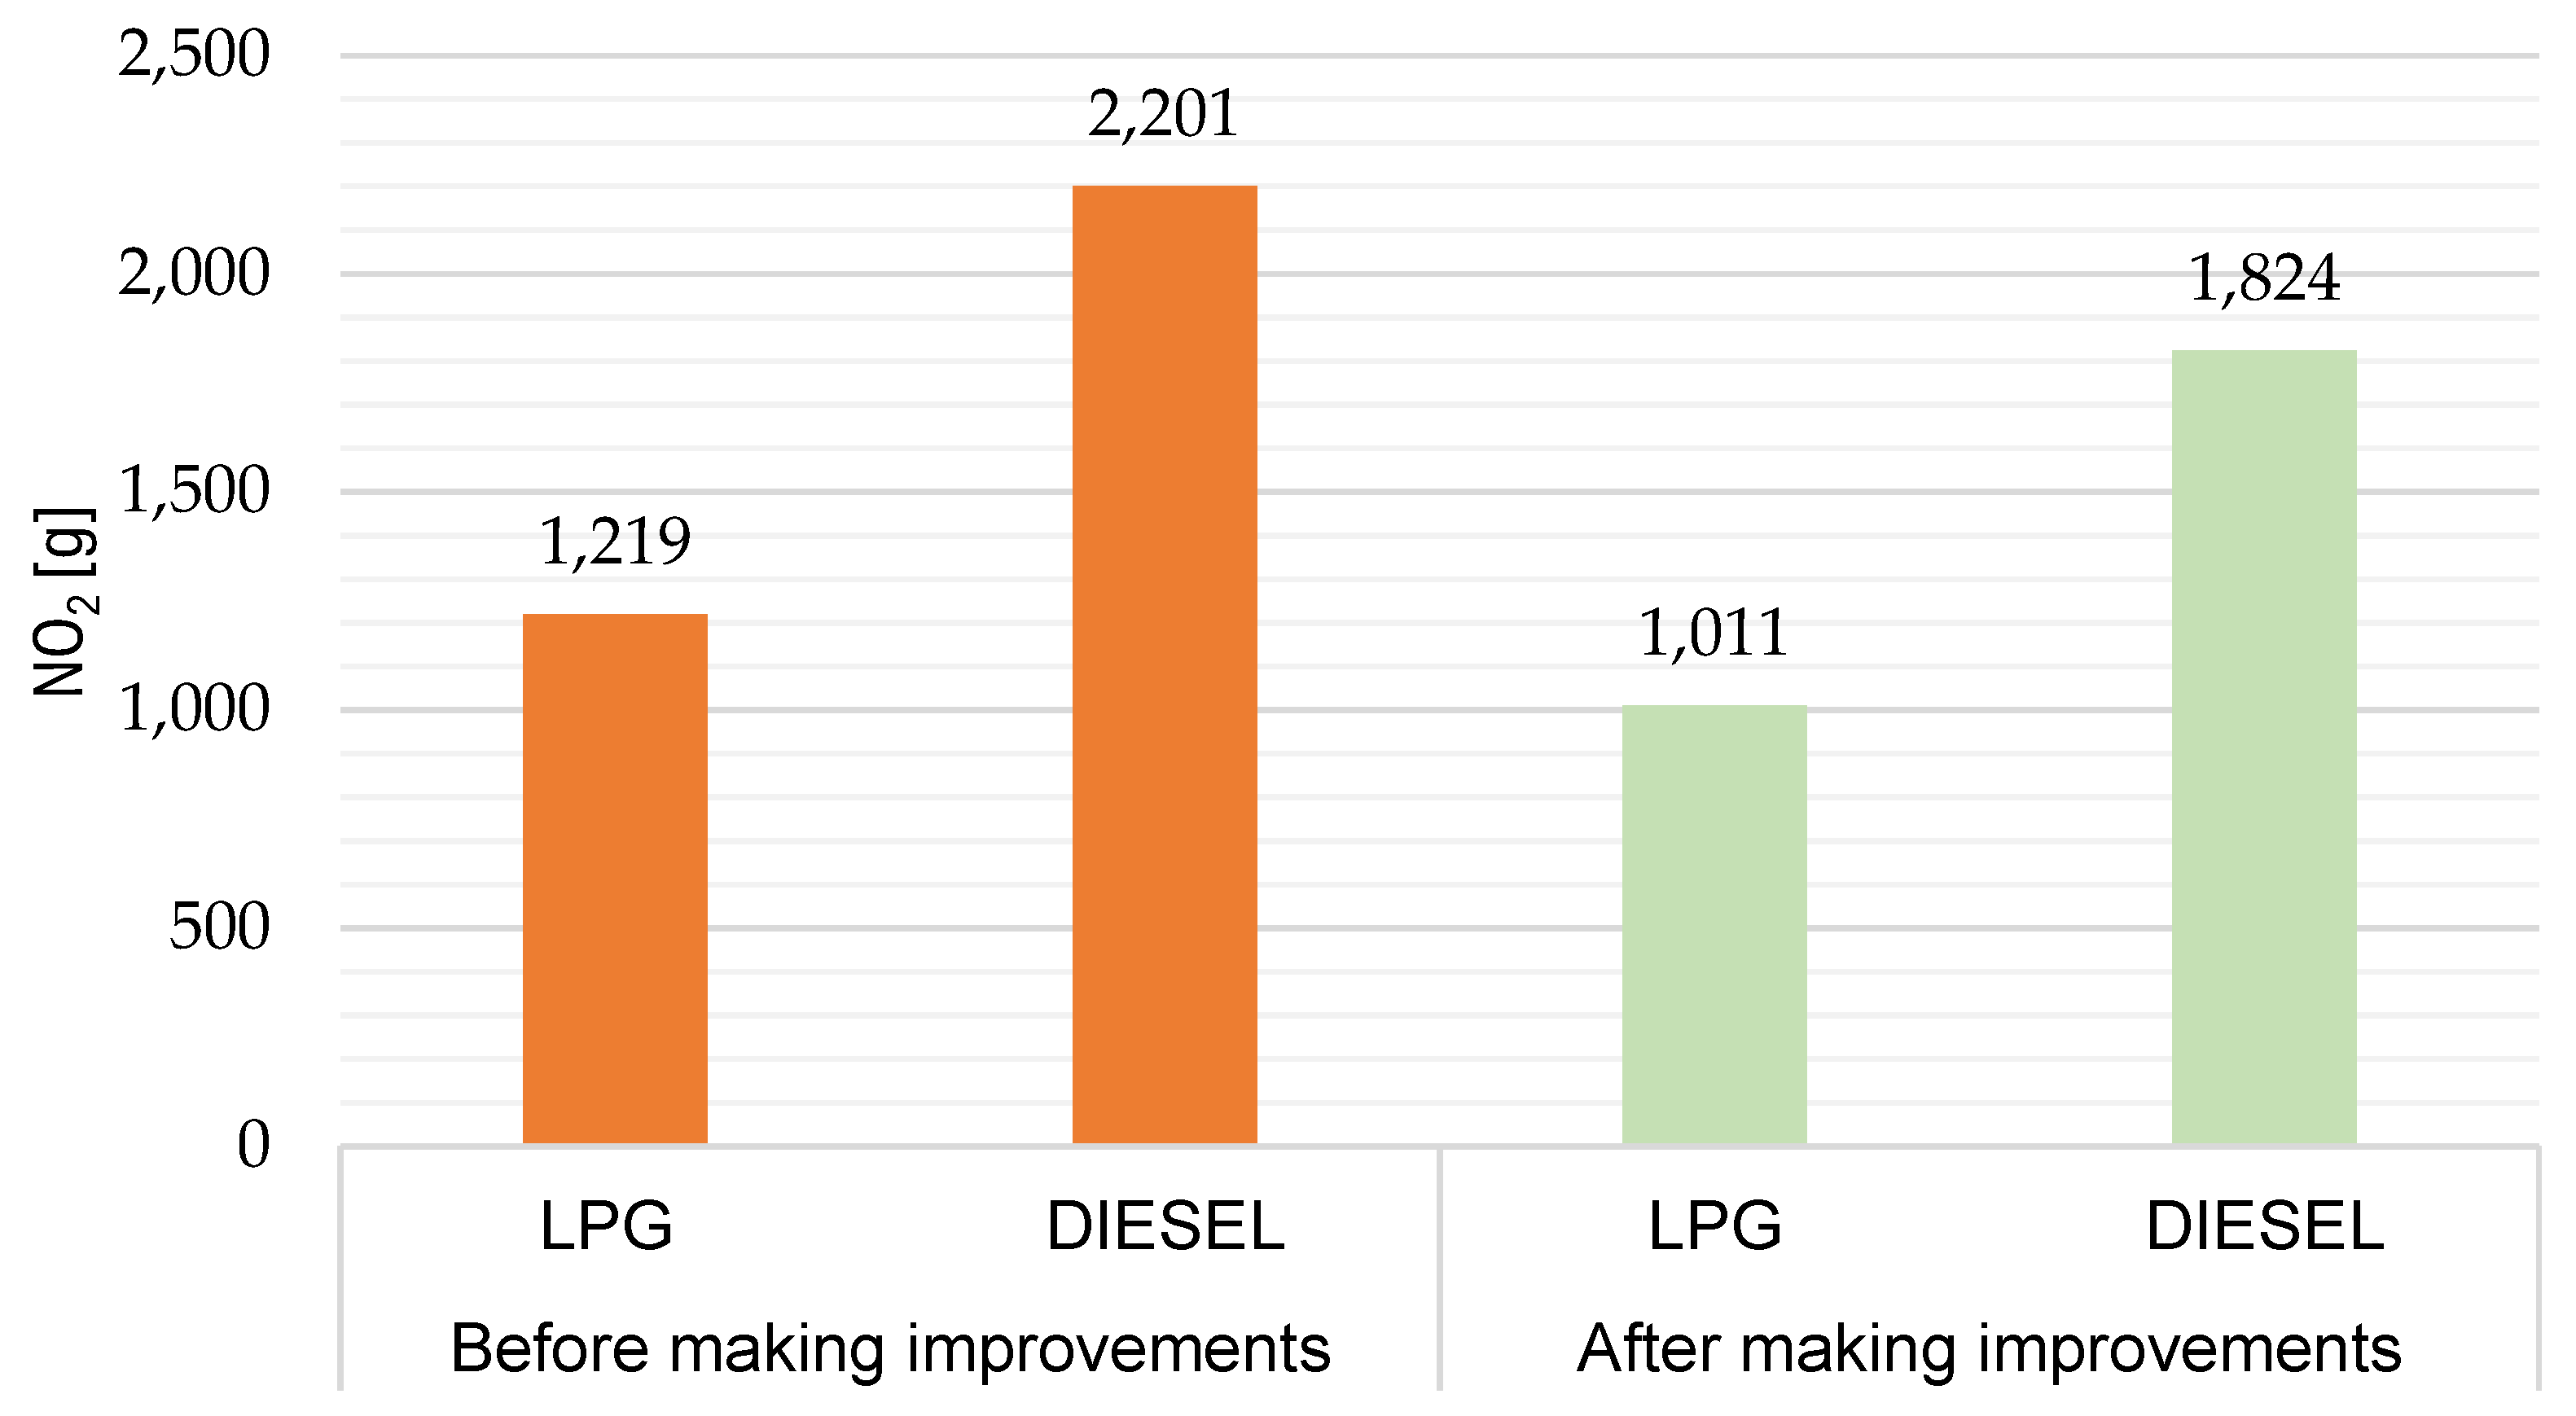
- An even more significant reduction was observed in NOX emissions:
- For LPG forklifts—from 1219.2 g to 1010.5 g (a decrease of 208.7 g).
- For diesel forklifts—from 2200.9 g to 1824.1 g (a decrease of 376.8 g).
Author Contributions
Funding
Institutional Review Board Statement
Informed Consent Statement
Data Availability Statement
Conflicts of Interest
References
- Yang, Z.; Tate, J.E.; Morganti, E.; Shepherd, S.P. Real-work CO2 and NOx emission from refrigerated vans. Sci. Total Environ. 2021, 763, 142974. [Google Scholar] [CrossRef] [PubMed]
- Friedlingstein, P.; Houghton, R.; Marland, G.; Hackler, J.; Boden, T.A.; Conway, T.J.; Canadell, J.G.; Raupach, M.R.; Ciais, P.; Quéré, C.L. Update on CO2 emissions. Nat. Geosci. 2010, 3, 811–812. [Google Scholar] [CrossRef]
- Sun, W.; Zhou, Y.; Lv, J.; Wu, J. Assessment of multi-air emissions: Case of particulate matter (dust), SO2, NOx, and CO2 form iron and steel industry of Chona. J. Clean. Prod. 2019, 232, 350–358. [Google Scholar] [CrossRef]
- Abdul-Wahab, S.; Fadlallah, S.; Al-Rashdi, M. Evaluation of the impact of ground-level concentrations of SO2, NOx, CO, and PM10 emitted from a steel melting plant on Muscat, Oman. Sustain. Cities Soc. 2018, 38, 675–683. [Google Scholar] [CrossRef]
- Zhang, K.; Wang, X. Pollution Haven Hypothesis of Global CO2, SO2, NOx—Evidence from 43 Economies and 56 Sectors. Int. J. Environ. Res. Public Health 2021, 18, 6552. [Google Scholar] [CrossRef]
- Liu, J.; Qu, J.; Zhao, K. Is China’s development conforms to the Environmental Kuznets Curve hypothesis and the pollution haven hypothesis? J. Clean. Prod. 2019, 234, 787–796. [Google Scholar] [CrossRef]
- Brodny, J.; Tutak, M. The Use of Artificial Neural Networks to Analyze Greenhouse Gas and Air Pollutant Emissions from the Mining and Quarrying Sector in the European Union. Energies 2020, 13, 1925. [Google Scholar] [CrossRef]
- Wang, Y.; Yuan, Z.; Yan, J.; Zhang, H.; Guan, Q.; Rao, S.; Jiang, C.; Duan, Z. Analysis of Synergistic Drivers of CO2 and NOX Emissions from Thermal Power Generating Units in Beijing–Tianjin–Hebei Region, 2010–2020. Sustainability 2024, 16, 7554. [Google Scholar] [CrossRef]
- Qin, X.; Xie, P.; Liao, C. Study on the synergistic effect of NOx and CO2 emission reduction in the industrial sector of Guangzhou. Front. Environ. Sci. 2025, 13, 1497121. [Google Scholar] [CrossRef]
- Lee, C.Y.; Zhou, P. Directional shadow price estimation of CO2, SO2 and NOx in the United States coal power industry 1990–2010. Energy Econ. 2015, 51, 493–502. [Google Scholar] [CrossRef]
- Song, X.; Hao, Y. Research on the Vehicle Emission Characteristics and Its Prevention and Control Strategy in the Central Plains Urban Agglomeration, China. Sustainability 2021, 13, 1119. [Google Scholar] [CrossRef]
- Lin, X.; Yang, R.; Zhang, W.; Zheng, N.; Zhao, Y.; Wang, G.; Li, T.; Cai, Q. An integrated view of correlated emissions of greenhouse gases and air pollutants in China. Carbon Balance Manag. 2023, 18, 9. [Google Scholar] [CrossRef] [PubMed]
- Jain, N.; Bhatia, A.; Pathak, H. Emission of Air Pollutants from Crop Residue Burning in India. Aerosol Air Qual. Res. 2014, 14, 422–430. [Google Scholar] [CrossRef]
- Huang, Y.; Ng, E.C.Y.; Zhou, J.L.; Surawski, N.C.; Chan, E.F.C.; Hong, G. Eco-driving technology for sustainable road transport: A review. Renew. Sustain. Energy Rev. 2018, 93, 596–609. [Google Scholar] [CrossRef]
- Xu, Z.; Jiang, T.; Zheng, N. Developing and analyzing eco-driving strategies for on-road emission reduction in urban transport system—A VR-enabled digital-twin approach. Chemosphere 2022, 305, 135372. [Google Scholar] [CrossRef]
- Abou-Senna, H.; Radwan, E.; Westerlund, K.; Cooper, D. Using traffic simulation model (VISSIM) with an emission model (MOVES) to predict emissions from vehicles on a limited-access highway. J. Air Waste Manag. Assoc. 2013, 63, 818–831. [Google Scholar] [CrossRef]
- Jayawardana, V.; Wu, C. Learning Eco-Driving Strategies at Signalized Intersections. In Proceedings of the 2022 European Control Conference (ECC), London, UK, 12–15 July 2022; pp. 383–390. [Google Scholar] [CrossRef]
- Mustapa, S.I.; Bekhet, H.A. Analysis of CO2 emissions reduction in the Malaysian transportation sector: An optimization approach. Energy Policy 2016, 89, 171–183. [Google Scholar] [CrossRef]
- Roy, A.; Pramanik, S. A review of hydrogen fuel patch to emission reduction in the surface transport industry. Int. J. Hydrogen Energy 2024, 49, 792–821. [Google Scholar] [CrossRef]
- Stolz, B.; Held, M.; Georges, G.; Boulouchos, K. The CO2 reduction potential of shore-side electricity in Europe. Appl. Energy 2021, 285, 116425. [Google Scholar] [CrossRef]
- Ajanovic, A.; Sayer, M.; Haas, R. The economics and environmental benignity of different colors of hydrogen. Int. J. Hydrogen Energy 2022, 47, 24136–24154. [Google Scholar] [CrossRef]
- Ishaq, H.; Dincer, I. Comparative assessment of renewable energy-based hydrogen production methods. Renew. Sustain. Energy Rev. 2021, 135, 110192. [Google Scholar] [CrossRef]
- Gallo, M.; Marinelli, M. The Use of Hydrogen for Traction in Freight Transport: Estimating the Reduction in Fuel Consumption and Emissions in a Regional Context. Energies 2023, 16, 508. [Google Scholar] [CrossRef]
- Wanniarachchi, S.; Hewage, K.; Wirasinghe, C.; Chhipi-Shrestha, G.; Karunathilake, H.; Sadiq, R. Transforming road freight transportation from fossils to hydrogen: Opportunities and challenges. Int. J. Sustain. Transp. 2022, 17, 552–572. [Google Scholar] [CrossRef]
- Pan, S.; Ballot, E.; Fontane, F. The reduction of greenhouse gas emissions from freight transport by pooling supply chins. Int. J. Prod. Econ. 2013, 143, 86–94. [Google Scholar] [CrossRef]
- Ballot, E.; Fontane, F. Reducing transportation CO2 emissions through pooling of supply networks: Perspectives from a case study in French retail chains. Prod. Plan. Control. 2010, 21, 640–650. [Google Scholar] [CrossRef]
- El Moussaoui, A.E. Impact of logistics pooling on reduction of CO2 emissions in last-mile logistics. Manag. Sustain. Arab. Rev. 2025, 4, 383–401. [Google Scholar] [CrossRef]
- Jerbi, A.; Jribi, H.; Masmoudi, F. Comparison of the Impact of Different Pooling Strategies on Supply Chains CO2 Emissions: Simulation Approach. In International Conference Design and Modeling of Mechanical Systems; Lecture Notes in Mechanical Engineering; Springer: Cham, Switzerland, 2023. [Google Scholar] [CrossRef]
- Jerbi, A.; Jribi, H.; Aljuaid, A.M.; Hachicha, W.; Masmoudi, F. Design of Supply Chain Transportation Pooling Strategy for Reducing CO2 Emissions Using a Simulation-Based Methodology: A Case Study. Sustainability 2022, 14, 2331. [Google Scholar] [CrossRef]
- Donthu, N.; Kumar, S.; Mukherjee, D.; Pandey, N.; Lim, W.C. How to conduct bibliometric analysis: An overview guidelines. J. Bus. Res. 2021, 133, 285–296. [Google Scholar] [CrossRef]
- Passas, I. Bibliometric Analysis: The Main Steps. Encyclopedia 2024, 4, 1014–1025. [Google Scholar] [CrossRef]
- Ellegaard, O.; Wallin, J.A. The bibliometric analysis of scholarly production: How great is the impact? Scientometrics 2015, 105, 1809–1831. [Google Scholar] [CrossRef]
- Zyoud, S.H. Global research trends of Middle East respiratory syndrome coronavirus: A bibliometric analysis. BMC Infect. Dis. 2016, 16, 255. [Google Scholar] [CrossRef] [PubMed]
- Cavalcante, W.Q.d.F.; Coelho, A.; Bairrada, C.M. Sustainability and Tourism Marketing: A Bibliometric Analysis of Publications between 1997 and 2020 Using VOSviewer Software. Sustainability 2021, 13, 4987. [Google Scholar] [CrossRef]
- Abdollahi, A.; Rejeb, K.; Rejeb, A.; Mostafa, M.M.; Zailani, S. Wireless Sensor Networks in Agriculture: Insights from Bibliometric Analysis. Sustainability 2021, 13, 12011. [Google Scholar] [CrossRef]
- Pawlak, S.; Małysa, T.; Fornalczyk, A. Analysis of Production Process Parameters Using Computer Simulation at the Planning Stage. Appl. Sci. 2024, 14, 10863. [Google Scholar] [CrossRef]
- Gola, A.; Wiechetek, Ł. Modelling and simulation production flow in job-shop production system with Enterprise Dynamics software. Appl. Comput. Sci. 2017, 13, 87–97. [Google Scholar] [CrossRef]
- Fedorko, G.; Molnár, V.; Strohmandl, J.; Horváthová, P.; Strnad, D.; Cech, V. Research on Using the Tecnomatix Plant Simulation for Simulation and Visualization of Traffic Processes at the Traffic Node. Appl. Sci. 2022, 12, 12131. [Google Scholar] [CrossRef]
- Barosz, P.; Gołda, G.; Kampa, A. Efficiency Analysis of Manufacturing Line with Industrial Robots and Human Operators. Appl. Sci. 2020, 10, 2862. [Google Scholar] [CrossRef]
- Wang, Y.R.; Chen, A.N. Production logistics simulation and optimization of industrial enterprise based on FlexSim. Int. J. Simul. Model. 2016, 15, 732–741. [Google Scholar] [CrossRef]
- Sarvan Kumar, U.; Shivraj Narayan, Y. Productivity improvement in a windows manufacturing layout using FlexSim simulation software. Int. J. Res. Advent. Technol. 2015, 3, 86–90. [Google Scholar]
- Huihui, S.; Xiaoxia, M.; Xiangguo, M. Simulation and optimization of warehouse operation based on FlexSim. J. Appl. Sci. Eng. Innov. 2016, 3, 125–128. [Google Scholar]
- Kim, J.W.; Park, J.S.; Kim, S.K. Application of FlexSim software for developing cyber learning factory for smart factory education and training. Multimed. Tools Appl. 2020, 79, 16281–16297. [Google Scholar] [CrossRef]
- Kikolski, M. Identification of production bottlenecks with the use of Plant Simulation Software. Econ. Manag. 2016, 8, 103–112. [Google Scholar] [CrossRef]
- Pekarcikova, M.; Trebuna, P.; Kliment, M.; Dic, M. Solution of Bottlenecks in the Logistics Flow by Applying the Kanban Module in the Tecnomatix Plant Simulation Software. Sustainability 2021, 13, 7989. [Google Scholar] [CrossRef]
- Ferro, R.; Cordeiro, G.A.; Ordóñez, R.E.C.; Beydoun, G.; Shukla, N. An Optimization Tool for Production Planning: A Case Study in a Textile Industry. Appl. Sci. 2021, 11, 8312. [Google Scholar] [CrossRef]
- Dias, A.S.M.E.; Antunes, R.M.G.; Abreu, A.; Anes, V.; Navas, H.V.G.; Morgado, T.; Calado, J.M.F. Utilization of the Arena simulation software and Lean improvements in the management of metal surface treatment processes. Procedia Comput. Sci. 2022, 204, 140–147. [Google Scholar] [CrossRef]
- Lorenc, A. Cross-Docking Layout Optimization in FlexSim Software Based on Cold Chain 4PL Company. Sustainability 2024, 16, 9620. [Google Scholar] [CrossRef]
- Félix-Cigalat, J.S.; Domingo, R. Towards a Digital Twin Warehouse through the Optimization of Internal Transport. Appl. Sci. 2023, 13, 4652. [Google Scholar] [CrossRef]
- Foit, K.; Gołda, G.; Kampa, A. Integration and Evaluation of Intra-Logistics Processes in Flexible Production Systems Based on OEE Metrics, with the Use of Computer Modelling and Simulation of AGVs. Processes 2020, 8, 1648. [Google Scholar] [CrossRef]
- Pang, K.; Zhang, K.; Ma, S. Tailpipe emission characterizations of diesel-fueled forklifts under real-world operations using a portable emission measurement system. J. Environ. Sci. 2021, 100, 34–42. [Google Scholar] [CrossRef]
- Boenzi, F.; Digiesi, S.; Facchini, F.; Mummolo, G. Electric and LPG forklifts GHG assessment in material handling activities in actual operational conditions. In Proceedings of the 2017 IEEE International Conference on Service Operations and Logistics, and Informatics (SOLI), Bari, Italy, 18–20 September 2017; pp. 127–132. [Google Scholar] [CrossRef]
- Kępa, A. Analiza emisyjności wózków widłowych. Ekon. Organ. Logistyki 2024, 9, 53–62. [Google Scholar] [CrossRef]
- Wang, Y.; Cui, M.; Zhao, X.; Lu, G. Green synthesis of SrO bridged LaFeO₃/g-C₃N₄ nanocomposites for CO₂ conversion and bisphenol A degradation with new insights into mechanism. Catal. Sci. Technol. 2021, 11, 6432–6442. [Google Scholar] [CrossRef]
- Zhu, Y.; Yao, J.; Wang, Y.; Wang, S.; Zhang, Z.; Zhang, X.; Luo, Z.; Pan, J.; Yu, X.; Zhang, Z. Multifunctional MXene-Based Composite Sponges for Effective Photothermal Conversion and Solar-Driven CO₂ Reduction. ACS Appl. Nano Mater. 2024, 7, 8158–8168. [Google Scholar] [CrossRef]


| Author(s) (Year) | Journal | Research Scope |
|---|---|---|
| Yang, Z.; Tate, J.E.; Morganti, E.; Shepherd, S.P. (2021) [1] | Science of the Total Environment | Greenhouse gas (CO2) and Nitrogen Oxide (NOₓ) emissions from refrigerated Vans: emission increases under vehicle load conditions. |
| Sun, W.; Zhou, Y.; Lv, J.; Wu, J. (2019) [3] | Journal of Cleaner Production | This study proposes a methodology based on the Total Environmental Impact Score (TEIS) for assessing the environmental impacts of industrial processes. The approach integrates not only the concentration of pollutants emitted by the steel plant, but also considers the exhaust gas flow rate and the accessibility of emission sources, thereby enabling a more comprehensive evaluation of the environmental burden. |
| Abdul-Wahab, S.; Fadlallah, S.; Al-Rashdi, M. (2018) [4] | Sustainable Cities and Society | An assessment of the seasonal dispersion of sulfur dioxide (SO2), carbon monoxide (CO), nitrogen oxides (NOₓ), and particulate matter (PM10) with an aerodynamic diameter of less than 10 µm. The study was conducted within the context of the metallurgical industry. |
| Zhang, K; Wang, X (2021) [5] | International Journal of Environmental Research and Public Health | An investigation of the global pollution haven phenomenon in various industrial sectors. The conducted analyses indicate that trade liberalization may contribute to the reduction of global emissions. The study also emphasizes the role of intermediate goods trade and its impact on emission reductions. |
| Brodny, J.; Tutak, M. (2020) [7] | Energies | The application of artificial neural networks in modeling harmful substance emissions into the environment, with reference to the mining sector. |
| Wang, Y.; Yuan, Z.; Yan, J., et al. (2024) [8] | Sustainability | This study highlights the importance of emission control as a key component in improving air quality. It includes the development of an emission inventory and the identification of factors responsible for increased pollutant emissions. |
| Qin, X.; Xie, P.; Liao, C. (2025) [9] | Frontiers in Environmental Science | The application of the LMDI method for decomposing emission changes into their driving effects. A bidirectional fixed-effects model is employed to quantitatively assess the synergistic reduction effects between CO2 and NOₓ. |
| Lee Ch.Y.; Zhou, P. (2015) [10] | Energy Economics | An analysis of shadow prices, also referred to as marginal abatement costs, was conducted for coal-fired power plants. The study takes into account the estimation of shadow prices and the potential issue of their underestimation. |
| Song, X.; Hao, Y. (2021) [11] | Sustainability | The issue of pollutant emissions and their increase as a result of vehicle movement, including passenger cars, trucks, and buses. The analysis addresses emissions of substances such as CO, NMVOCs, NOₓ, PM2.5, PM10, CO2, CH4, N2O, NH3, and SO2. |
| Lin, X.; Yang, R.; Zhang, W., et al. (2023) [12] | Carbon Balance and Management | The identification of economic sectors that are the most frequent emitters of environmental pollutants. An analysis of correlations between emissions within high-emission networks. |
| Jain, N.; Bhatia, A.; Pathak, H. (2014] [13] | Aerosol and Air Quality | An analysis of pollutant emissions resulting from the combustion of crop residue-emissions of greenhouse gases, air pollutants, volatile organic compounds, particulate matter and smoke. |
| Stolz, B.; Held, M.; Georges, G.; Boulouchos, K. (2021) [20] | Applied Energy | Reducing emissions through the use of alternative energy sources: The role of shore-supplied electricity in lowering CO2 emissions. |
| Huang, Y.; Ng, E.C.Y.; Zhou J.L.; et al. (2018) [14] | Renewable and Sustainable Energy Reviews | Eco-driving as a method for reducing fuel consumption and emissions: current challenges and future research directions. |
| Allison, C.K.; Stanton, N.A. (2017) [15] | Theoretical Issue in Ergonomics Science | Eco-driving—economic and environmental benefits. |
| Xu, Z.; Jiang, T.; Zheng, N. (2022) [16] | Chemosphere | An analysis of CO2, NOₓ, and CO emissions generated by passenger cars: comparative experiments on the human perception of vehicle routing principles using virtual reality (VR). |
| Jayawardana, V.; Wu, C. (2022) [17] | IEEE | Eco-driving and effective driving control strategies: a reinforcement learning (RL)-based approach to developing efficient eco-driving control methods. |
| Mustapa, S.I.; Bekhet, H.A. (2016) [18] | Energy Policy | A model for estimating potential CO2 mitigation strategies in road transport considering fuel cost constraints and travel demand. |
| Roy, A.; Pramanik, S. (2024) [19] | International Journal of Hydrogen Energy | The use of hydrogen fuel in transportation as a means of reducing environmental pollutant emissions. |
| Gallo, M.; Marinelli, M. (2023) [23] | Energies | |
| Pan, S.; Ballot, E.; Fontane, F. (2013) [25] | International Journal of Production Economics | Supply chain integration as a strategy for reducing CO2 emissions. |
| No. Operation | Operation Description | Flow Between Operations | Type of Transport Vehicle | Number of Transport Vehicles Used |
|---|---|---|---|---|
| 10 | Cutting material to size | 10 ÷ 20 | Forklift | 1 |
| 20 | Rough turning | 20 ÷ 30 | 1 | |
| 30 | Profile turning | 30 ÷ 40 | 2 | |
| 40 | Milling of keyway grooves | 40 ÷ 50 | 2 | |
| 50 | Shaft surface grinding | 50 ÷ 60 | 1 | |
| 60 | Quality control and deburring | 60—finished products warehouse | 1 |
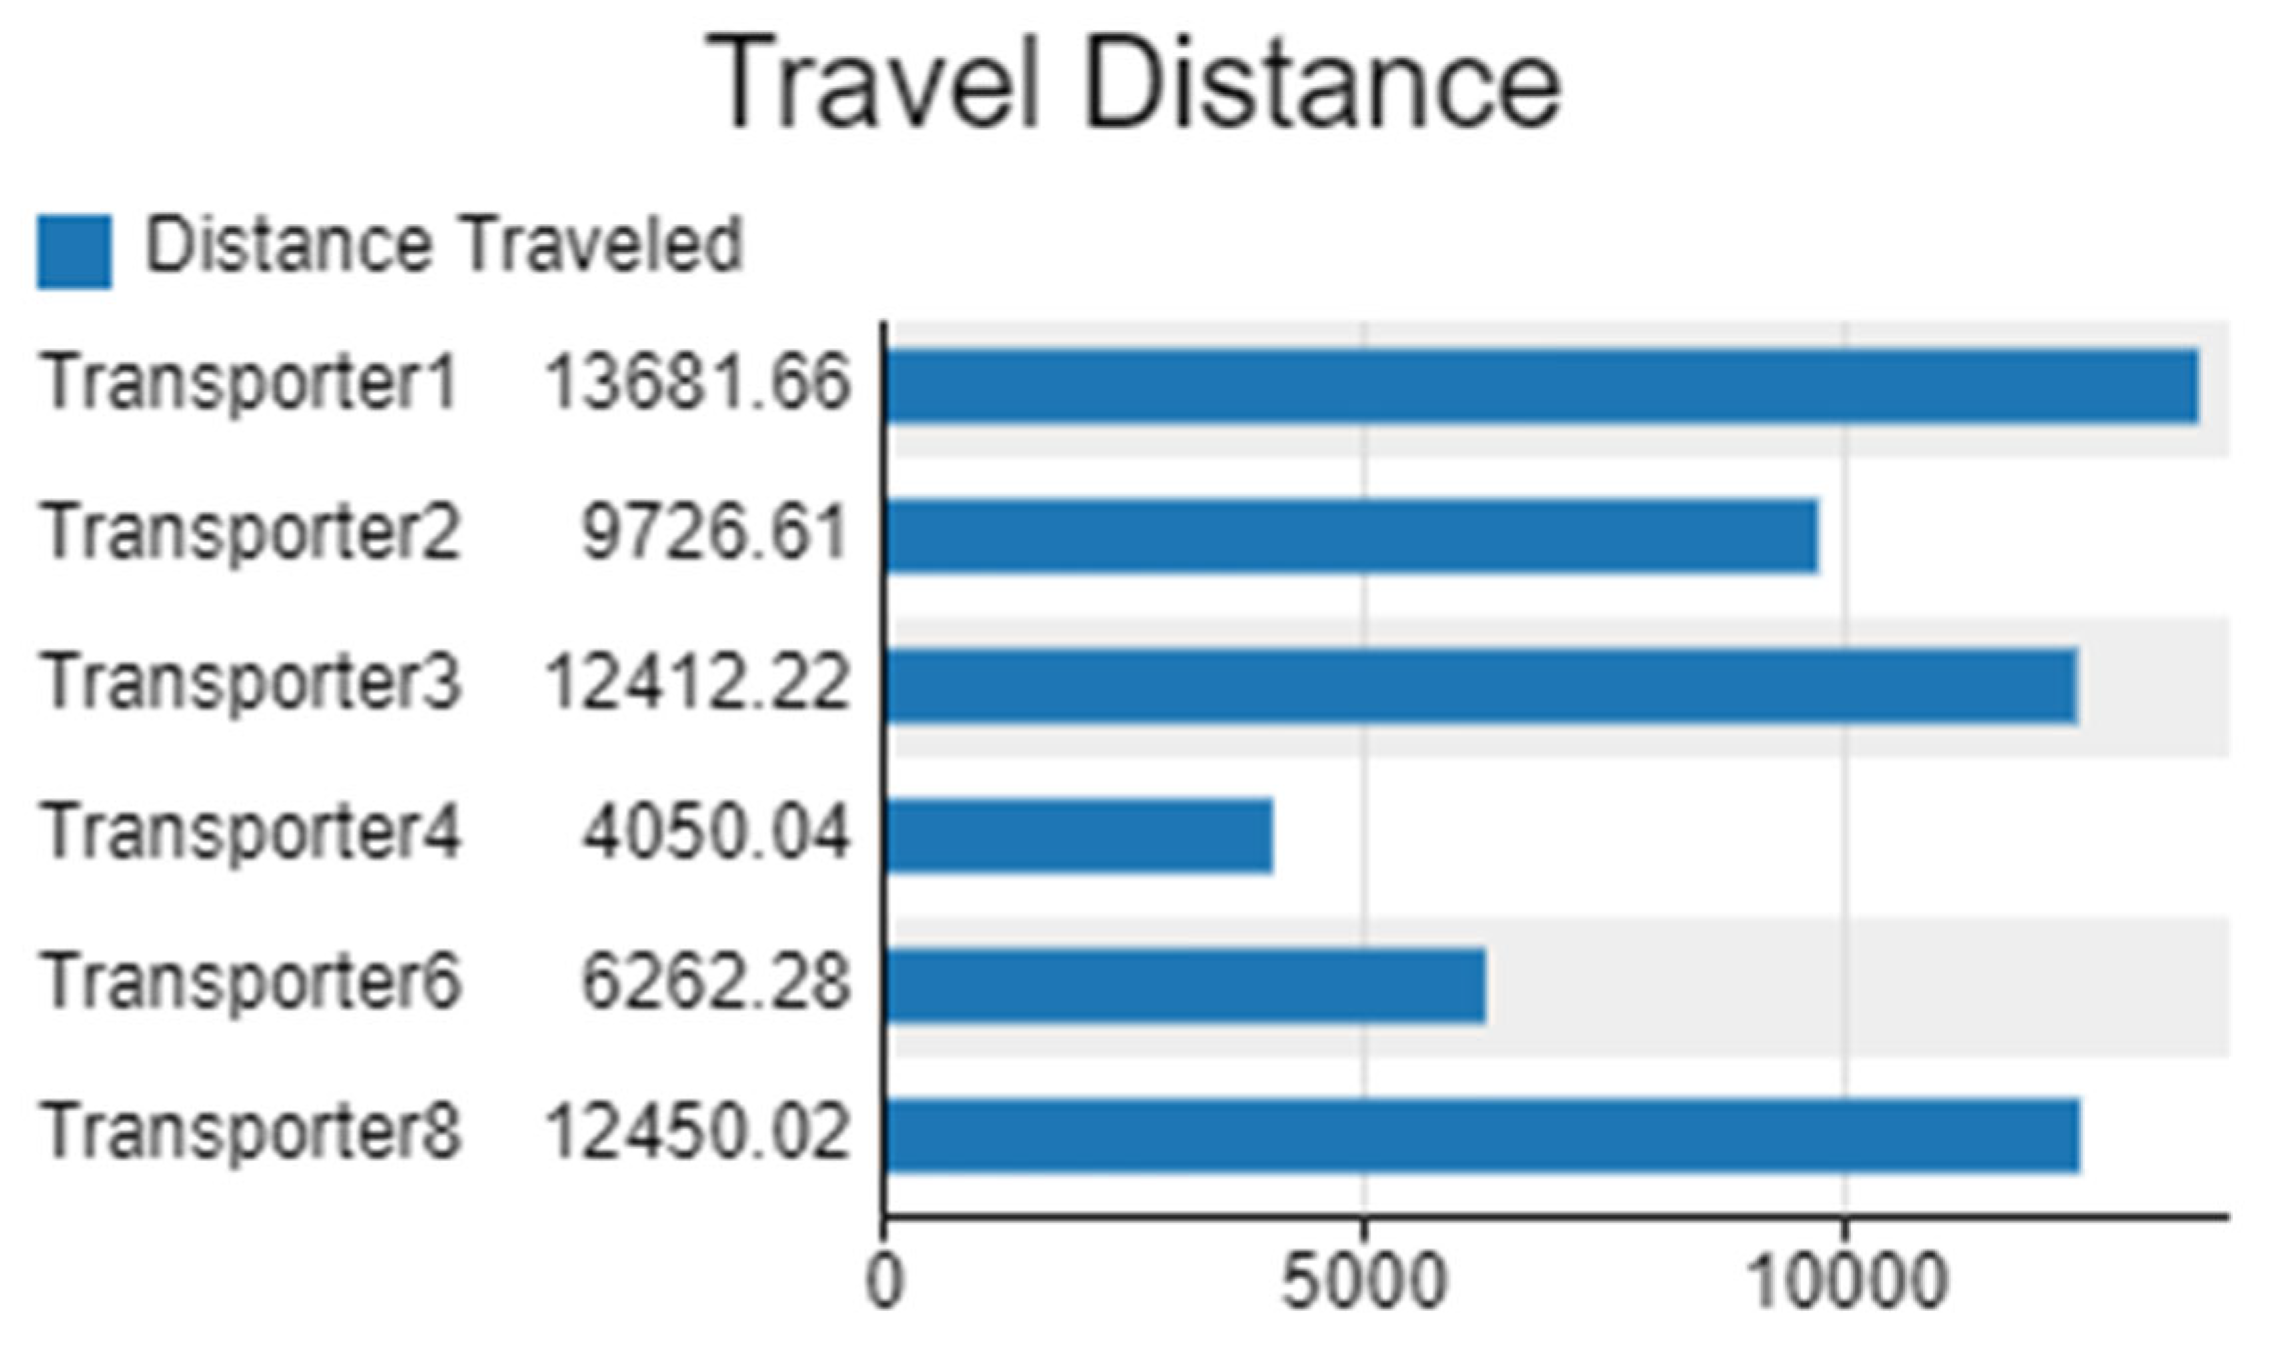
| Flow Between Operations | Number of Transport Units | Internal Transport Vehicle Name |
|---|---|---|
| 10 ÷ 20 | 1 | Transporter 1 |
| 20 ÷ 30 | 1 | Transporter 2 |
| 30 ÷ 40 | 1 | Transporter 3 |
| 40 ÷ 50 | 2 | Transporters 4 and 5 |
| 50 ÷ 60 | 2 | Transporters 6 and 7 |
| 60—Finished Products Warehouse | 1 | Transporter 8 |
| Emission Type | LPG-Powered Forklifts | Diesel-Powered Forklifts |
|---|---|---|
| Carbon Dioxide (CO2) [g/km] | 3132.63 | 1820.47 |
| Nitrogen Oxides (NOx) [g/km] | 31.14 | 17.25 |
Disclaimer/Publisher’s Note: The statements, opinions and data contained in all publications are solely those of the individual author(s) and contributor(s) and not of MDPI and/or the editor(s). MDPI and/or the editor(s) disclaim responsibility for any injury to people or property resulting from any ideas, methods, instructions or products referred to in the content. |
© 2025 by the authors. Licensee MDPI, Basel, Switzerland. This article is an open access article distributed under the terms and conditions of the Creative Commons Attribution (CC BY) license (https://creativecommons.org/licenses/by/4.0/).
Share and Cite
Pawlak, S.; Małysa, T.; Fornalczyk, A.; Sobianowska-Turek, A.; Kuczyńska-Chałada, M. Analysis of Opportunities to Reduce CO2 and NOX Emissions Through the Improvement of Internal Inter-Operational Transport. Sustainability 2025, 17, 5974. https://doi.org/10.3390/su17135974
Pawlak S, Małysa T, Fornalczyk A, Sobianowska-Turek A, Kuczyńska-Chałada M. Analysis of Opportunities to Reduce CO2 and NOX Emissions Through the Improvement of Internal Inter-Operational Transport. Sustainability. 2025; 17(13):5974. https://doi.org/10.3390/su17135974
Chicago/Turabian StylePawlak, Szymon, Tomasz Małysa, Angieszka Fornalczyk, Angieszka Sobianowska-Turek, and Marzena Kuczyńska-Chałada. 2025. "Analysis of Opportunities to Reduce CO2 and NOX Emissions Through the Improvement of Internal Inter-Operational Transport" Sustainability 17, no. 13: 5974. https://doi.org/10.3390/su17135974
APA StylePawlak, S., Małysa, T., Fornalczyk, A., Sobianowska-Turek, A., & Kuczyńska-Chałada, M. (2025). Analysis of Opportunities to Reduce CO2 and NOX Emissions Through the Improvement of Internal Inter-Operational Transport. Sustainability, 17(13), 5974. https://doi.org/10.3390/su17135974