Article

Research on Port Competitiveness Dynamics in China Under the Background of Free Trade Zone and Port Integration

1
Sanya Science and Education Innovation Park of Wuhan University of Technology, Wuhan University of Technology, Sanya 572000, China
2
School of Navigation, Wuhan University of Technology, Wuhan 430063, China
3
State Key Laboratory of Maritime Technology and Safety, Wuhan University of Technology, Wuhan 430063, China
4
National Engineering Research Center for Geographic Information System, China University of Geosciences (Wuhan), Wuhan 430074, China
*
Author to whom correspondence should be addressed.
Sustainability 2025, 17(12), 5502; https://doi.org/10.3390/su17125502
Submission received: 17 April 2025 / Revised: 5 June 2025 / Accepted: 11 June 2025 / Published: 14 June 2025

Abstract

:
Free trade zone (FTZ) policies and port integration play critical roles in advancing international shipping and port development. While Free trade zones (FTZs) promote trade liberalization and attract investment to support port infrastructure, port integration helps alleviate excessive competition, reduce redundant labor, and minimize resource inefficiencies. Given these dynamics, it is important to examine how FTZs and port integration differentially shape shipping capacity and port competitiveness across China’s coastal provinces. To this end, this study introduces a comprehensive evaluation framework for port competitiveness, which considers both port operation–related factors and the external environment. The framework employs a combination of principal component analysis and the entropy weight method to assess port competitiveness in coastal regions. The findings reveal that comprehensive port service capacity and management efficiency capacity have the most significant influence on port competitiveness, outweighing the impact of other evaluated indicators. It also reveals that the development of China’s coastal ports is regionally unbalanced, with strong competitiveness in the Yangtze River Delta, Pearl River Delta, and Bohai Rim clusters, moderate development in the southeastern cluster, and relatively weak performance in the Beibu Gulf cluster. Both FTZ and port integration policies can promote port competitiveness to some extent, especially for professional technical support and services, digital management, and overall management efficiency. The dynamics of port competitiveness under the FTZs are higher than those under port integration. The research results deepen the understanding of the roles of FTZ and port integration policies in promoting the competitiveness of ports in various regions and provide insights for ports to seize opportunities and enhance development. The reinforcement of industrial synergies with neighboring regions and the formation of complementary development patterns enhance their overall competitiveness. Exploring new modes aligned with the advancement of FTZs and port integration can further stimulate regional economic development and support national opening-up strategies.

1. Introduction

Free trade zones (FTZs) have emerged as pivotal instruments of national trade policy and are strategically designed to foster economic growth and dismantle trade barriers. Numerous nations have implemented FTZs to develop export-driven strategies and stimulate employment [1,2]. In China, FTZs represent a cornerstone of economic modernization designed to cultivate both domestic and foreign investments and develop a competitive business environment. Since the inauguration of the first FTZ in Shanghai in 2013, 17 additional FTZs across Tianjin, Guangdong, Jiangsu, etc. have been sanctioned to promote China’s economic reform and international trade development.
Current research on FTZs focuses on their multifaceted impacts on green productivity, investment flows, and trade facilitation [3,4,5,6], their effects on port competitiveness remain underexplored. Existing studies have largely focused on firm-level performance or environmental outcomes [1,7,8,9], leaving a theoretical and empirical gap concerning how FTZ policies reshape the operational and strategic advantages of ports. However, their influence on port competitiveness has received limited academic attention, particularly on how policy advantages reshape port performance.
Ports are critical strategic assets that underpin regional economic growth and serve as gateways for international trade, reflecting a country’s level of openness and modernization [10]. While China has achieved world-leading port throughput levels—reaching 15.51 billion tons and 300 million TEUs in 2023—its ranking of 20th in the World Bank’s Logistics Performance Index highlights significant room for improvement in operational efficiency [11]. Problems such as overexpansion and competition among local governments have led to resource waste and hindered synergy. However, port integration has been proposed to address overcapacity, homogenization, and resource duplication by merging port operations within regions. This policy, first piloted in Zhejiang, aims to optimize port governance, reduce internal competition, and strengthen coordinated development.
FTZs primarily improve ports’ external environments via trade facilitation and policy incentives, while port integration restructures internal governance and resource allocation. Understanding the comparative effects of these dual strategies is crucial for policy optimization and strategic planning in coastal regions. This study develops an integrated analytical framework that jointly examines the effects of Free Trade Zones (FTZs) and port integration policies on port competitiveness, addressing the limitations of prior single-policy studies. A multidimensional index system covering infrastructure, operational efficiency, service capacity, economic conditions, and social governance is constructed. By combining principal component analysis with the entropy weight method, the proposed approach not only addresses the subjectivity problem inherent in conventional weighting schemes but also improves the robustness and objectivity of competitiveness evaluation results. Using multi-source data from 11 coastal provinces between 2016 and 2022, the study identifies heterogeneous policy impacts and regional disparities, offering theoretical insights and practical guidance for port cluster optimization and differentiated development. The novelty of this work lies in its dual-policy perspective, integration of multi-source heterogeneous data, and data-driven analytical strategy. These contributions can support the optimization of national port policy and sustainable coastal development planning.

2. Literature Review

2.1. FTZ and Port Integration

The establishment of FTZs has gained significant attention from the research and industrial communities. Studies on FTZs cover various aspects, including functional positioning, economic growth, capital flows, and foreign trade [12,13]. Huang et al. (2022) [14] investigated the development of Taiwan’s FTZ and analyzed the factors influencing its business activities, whereas Wan et al. (2014) [15] examined regional economic development from the perspective of the supply chain. Song et al. (2019) [9] used the Hainan FTZ as a case study to model external environmental impacts on enterprises, focusing on economic factors, environmental protection, science and technology education, and forecasting the future development potential of firms. Chen et al. (2018) [16] developed an evaluation framework to assess developmental performance and conducted an empirical analysis of typical FTZs. Liu et al. (2021) [17] employed the Super-SBM model to evaluate port efficiency within the FTZ and utilized the Tobit regression model to identify both the internal and external determinants of port efficiency. Existing studies have mostly focused on how FTZs correlate with enterprise competitiveness and port development. Thus, port competitiveness dynamics under the FTZ and port integration are worth further exploration from regional and national perspectives.
As ports play an increasingly pivotal role in international trade and global supply chains, their integration has attracted the attention of policymakers, port administrators, and academics. Various facets of dynamics, including port group competition and cooperation [18,19,20,21,22], port-city relations [23,24], and port layout optimization [25,26] under the integration of ports have been examined. Zhao and Zhen (2015) [27] conducted a comprehensive analysis of the objectives and methodologies for port resource integration by employing the ecological niche theory. Wang et al. (2015) [28] examine the categories of port integration in China and the corresponding driving factors, including legislation and spatial planning, resource optimization, port function adjustment, and ports. Guo et al. (2018) [29] identified ports as transport hubs and explored regional port integration by maximizing social welfare and excess port resource investment. Research investigating the influence of port integration policies has focused primarily on the combinations of terminal ownership, vessel transfer, liner service, pricing strategy, and resource integration on port cooperation and competitiveness. Other external factors such as trade growth, investment attraction, and logistics efficiency are vital for enhancing port competitiveness. Comprehensive research on the implementation effects of FTZ and port integration policies on port competitiveness can provide policymakers with informed decision-making for development strategies, such as resource allocation and optimization.

2.2. Port Competitiveness

The developmental status of ports is driven by multiple factors, including infrastructure, hinterland economies, policy support, land-based and maritime operations, and geographical location [30,31,32,33,34,35,36,37]. Pahl et al. (2018) [38] evaluate the logistics demand and infrastructure development of Arctic ports in the context of Arctic marine economic activities. Wiegmans et al. (2015) [39] analyzed the relationship between throughput and port development in inland ports and concluded that port development depends on terminal facility availability, diversified cargo types, and efficient transportation networks. Zhang et al. (2025) [40] emphasize that ports not only act as maritime nodes but also as central hubs for their hinterland economies. The relationship between ports and urban cities using a complex network method revealed that although this correlation has weakened, ports with strong hinterlands still play critical roles in the global maritime transport network [41,42,43,44]. The importance of the hinterland was also confirmed by Ceulemans et al. (2025) [45], with coordinated and diversified hinterlands fostering port growth. FTZs have emerged as pivotal initiatives for fostering open trade and economic development driven by advanced logistics systems and strategic policy advantages (Liu et al. 2021) [17]. The impacts of FTZ policies exhibit differences from region to region. Specifically, the FTZ promotion policies have lagging impacts on Shanghai Port and Tianjin Port. The Guangdong Free Trade Zone’s policies have a short-term continuous promoting impact on Guangzhou Port’s production (Fan et al., 2022) [46]. A comprehensive port competitiveness evaluation framework can be further developed by holistically incorporating the key elements of port operations, including infrastructure, production operations, and shipping services, along with external factors such as governmental management, macroeconomic conditions, and policy support.
Quantitative evaluation of port competitiveness involves the collection, processing, and analysis of port throughput, operational and managerial efficiency, berth utilization data, shipping trade volumes, urban development indicators, and economic investment metrics (Xie et al., 2021) [47]. The processing and analysis methods include the entropy weight method, factor analysis, principal component analysis, data envelopment analysis, and complex networks [44,48,49,50,51,52,53,54]. The entropy weight method (Wan et al., 2021) [55] assigns weights based on the entropy value, which represents information that contributes to the factors considered for port competitiveness. Factor and principal component analyses (PCA) were used to identify the key factors that significantly impact port competitiveness [56]. The PCA-entropy approach balances statistical rigor with objectivity. Compared with DEA (Data Envelopment Analysis), which typically requires clear input–output relationships and is sensitive to outliers, PCA-Entropy is more flexible in handling panel data without assuming a production frontier. This study considers 16 indicators from the perspectives of port infrastructure, operational efficiency, shipping services, the economic environment, and social governance to construct a comprehensive port competitiveness evaluation framework. PCA was employed to extract composite variables from the original data, and the entropy weighting method was used to assign weights to the derived variables. It provides a robust evaluation of port competitiveness by identifying the key factors driving port competitiveness. Using a multidimensional evaluation framework, this study delivers an in-depth analysis of port competitiveness to offer decision-making support for the sustainable development and strategic planning of ports.

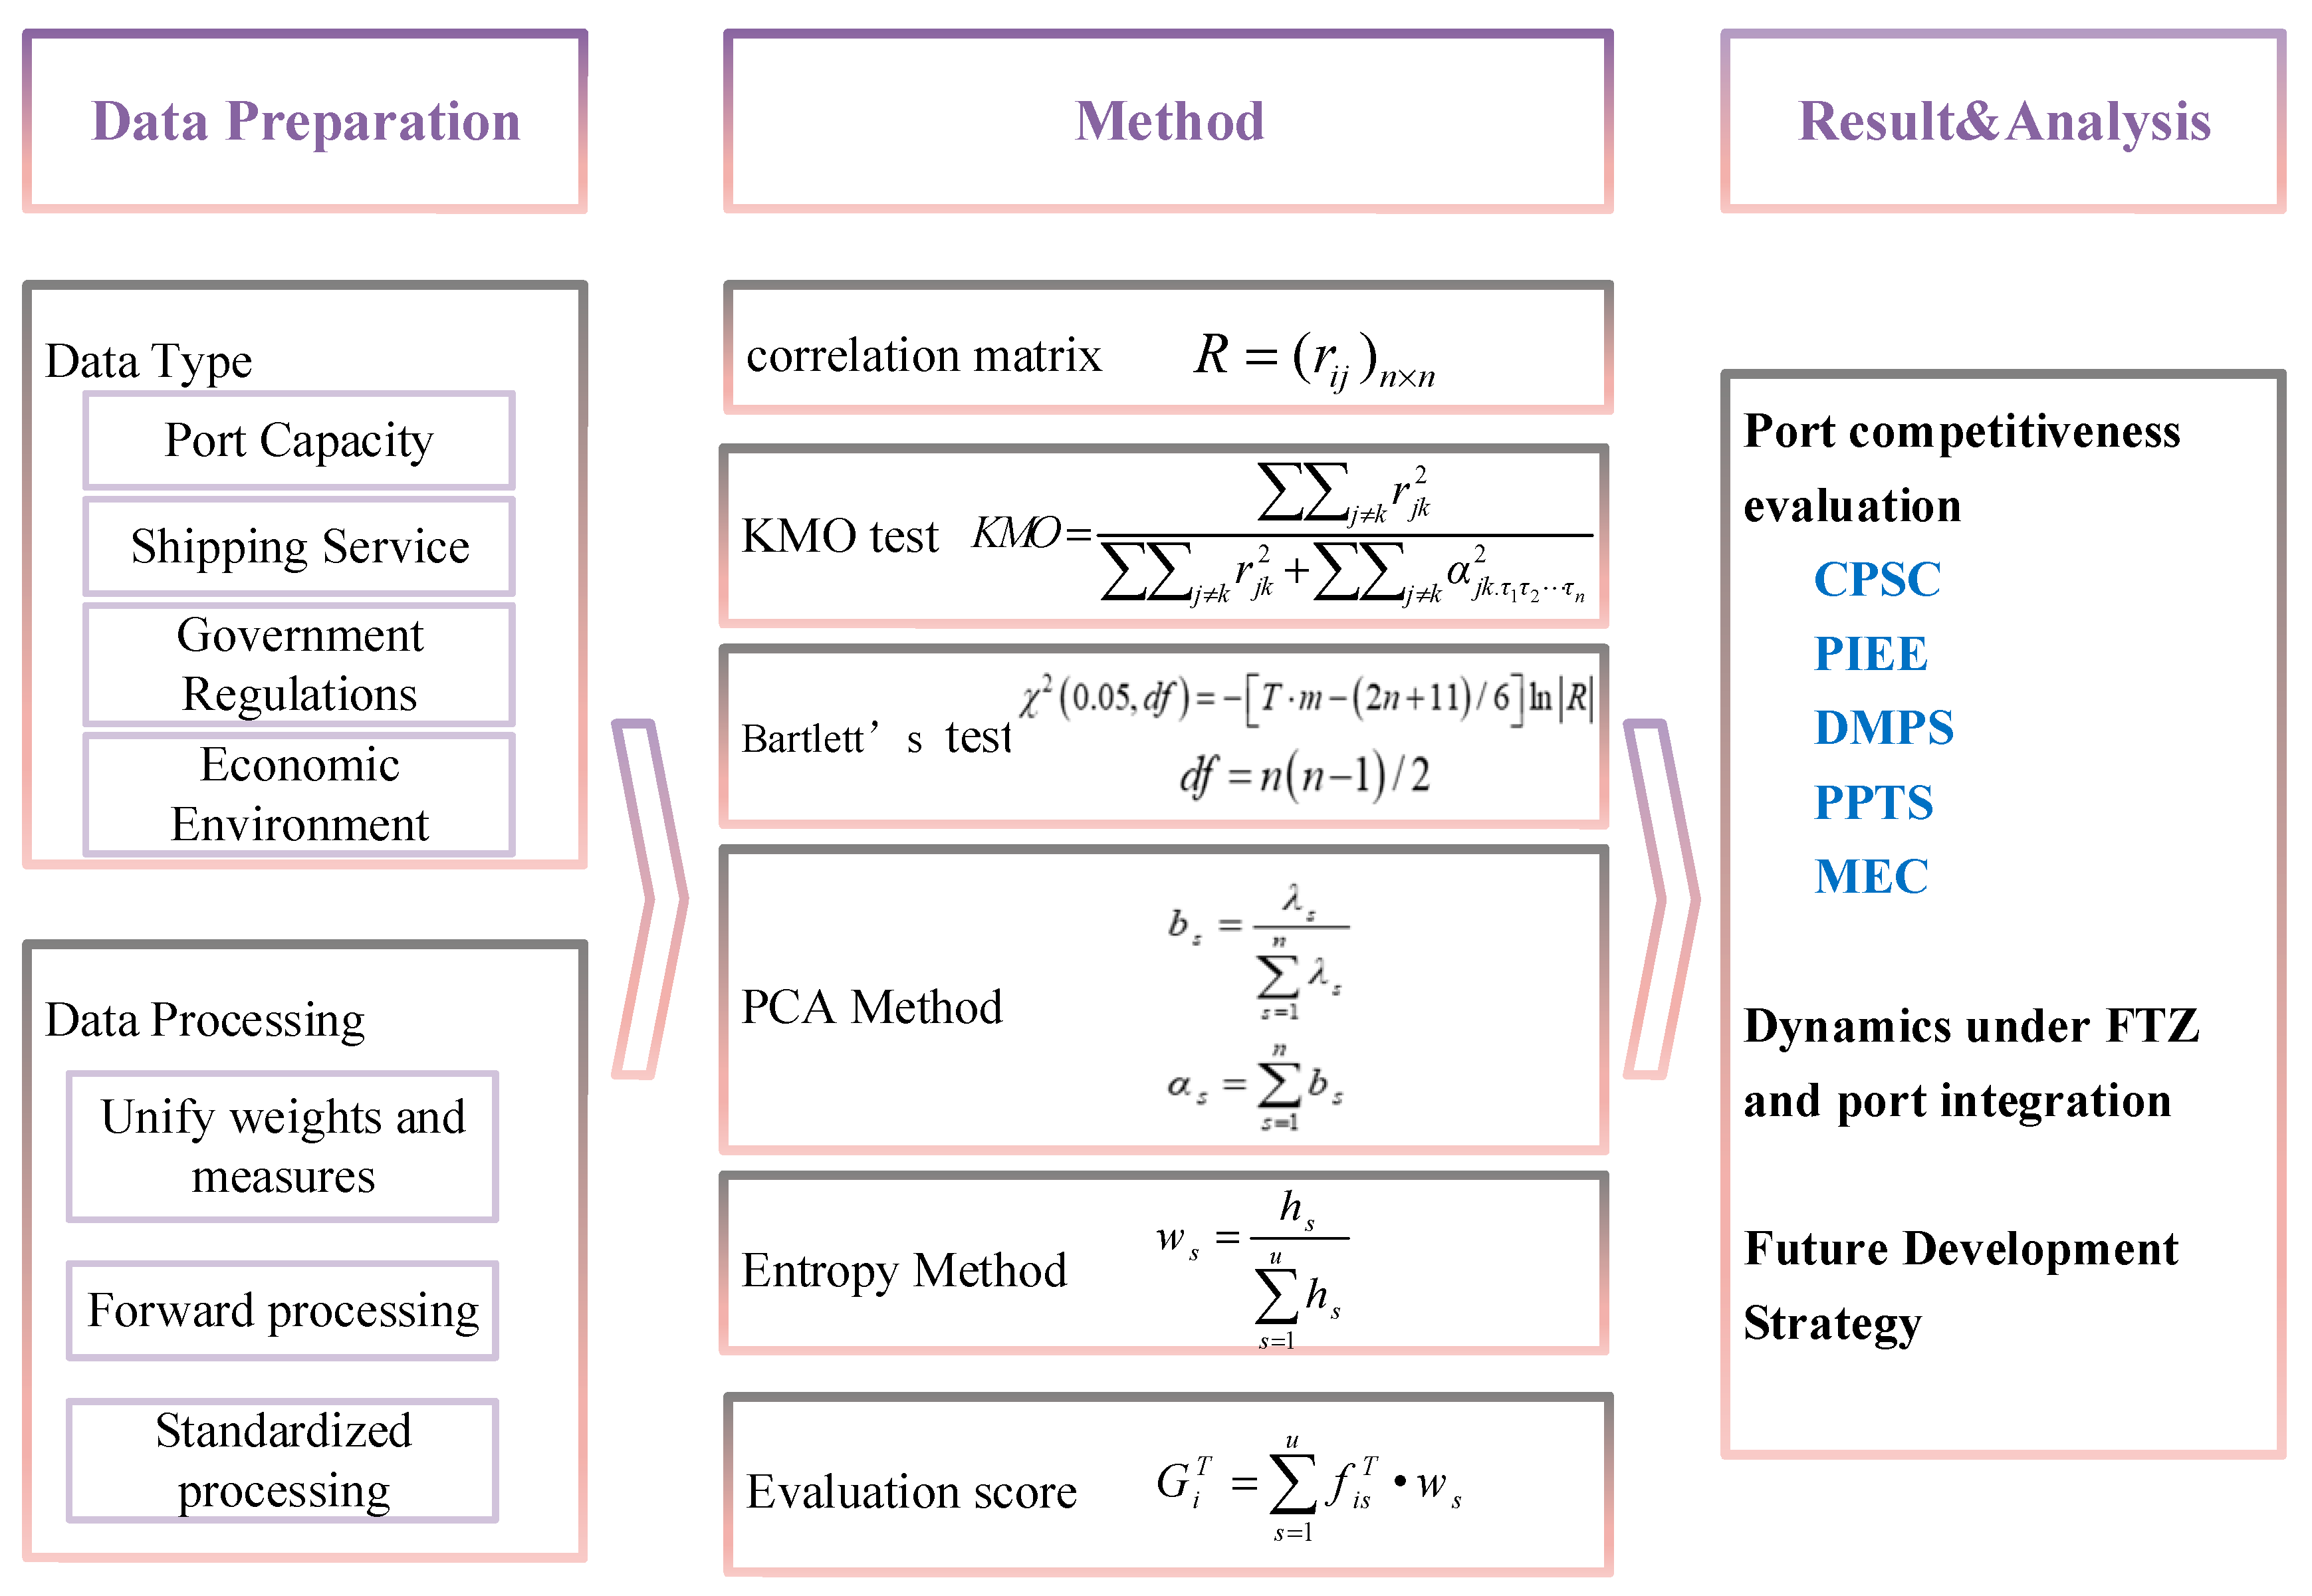
3. Research Methodology and Data

3.1. Research Methodology

The methodological framework employed in this study is illustrated in Figure 1. First, multidimensional data such as port infrastructure information, business metrics, shipping service data, government regulations, and macroeconomic indicators were collected. Second, a comprehensive port competitiveness evaluation framework was developed from the perspectives of port infrastructure and operations, shipping services, economic environment, and social governance. Third, the port competitiveness dynamics in China’s coastal provinces against the background of the FTZ and port integration were analyzed using PCA and entropy-weighted methods. This enables a deeper investigation of the critical determinants of port competitiveness and provides support for targeted strategic recommendations to bolster sustainable development. The notation used in the port competitiveness evaluation methodology variables and explanatory, value-range, as well as units measured, is described as follows in Table A1.

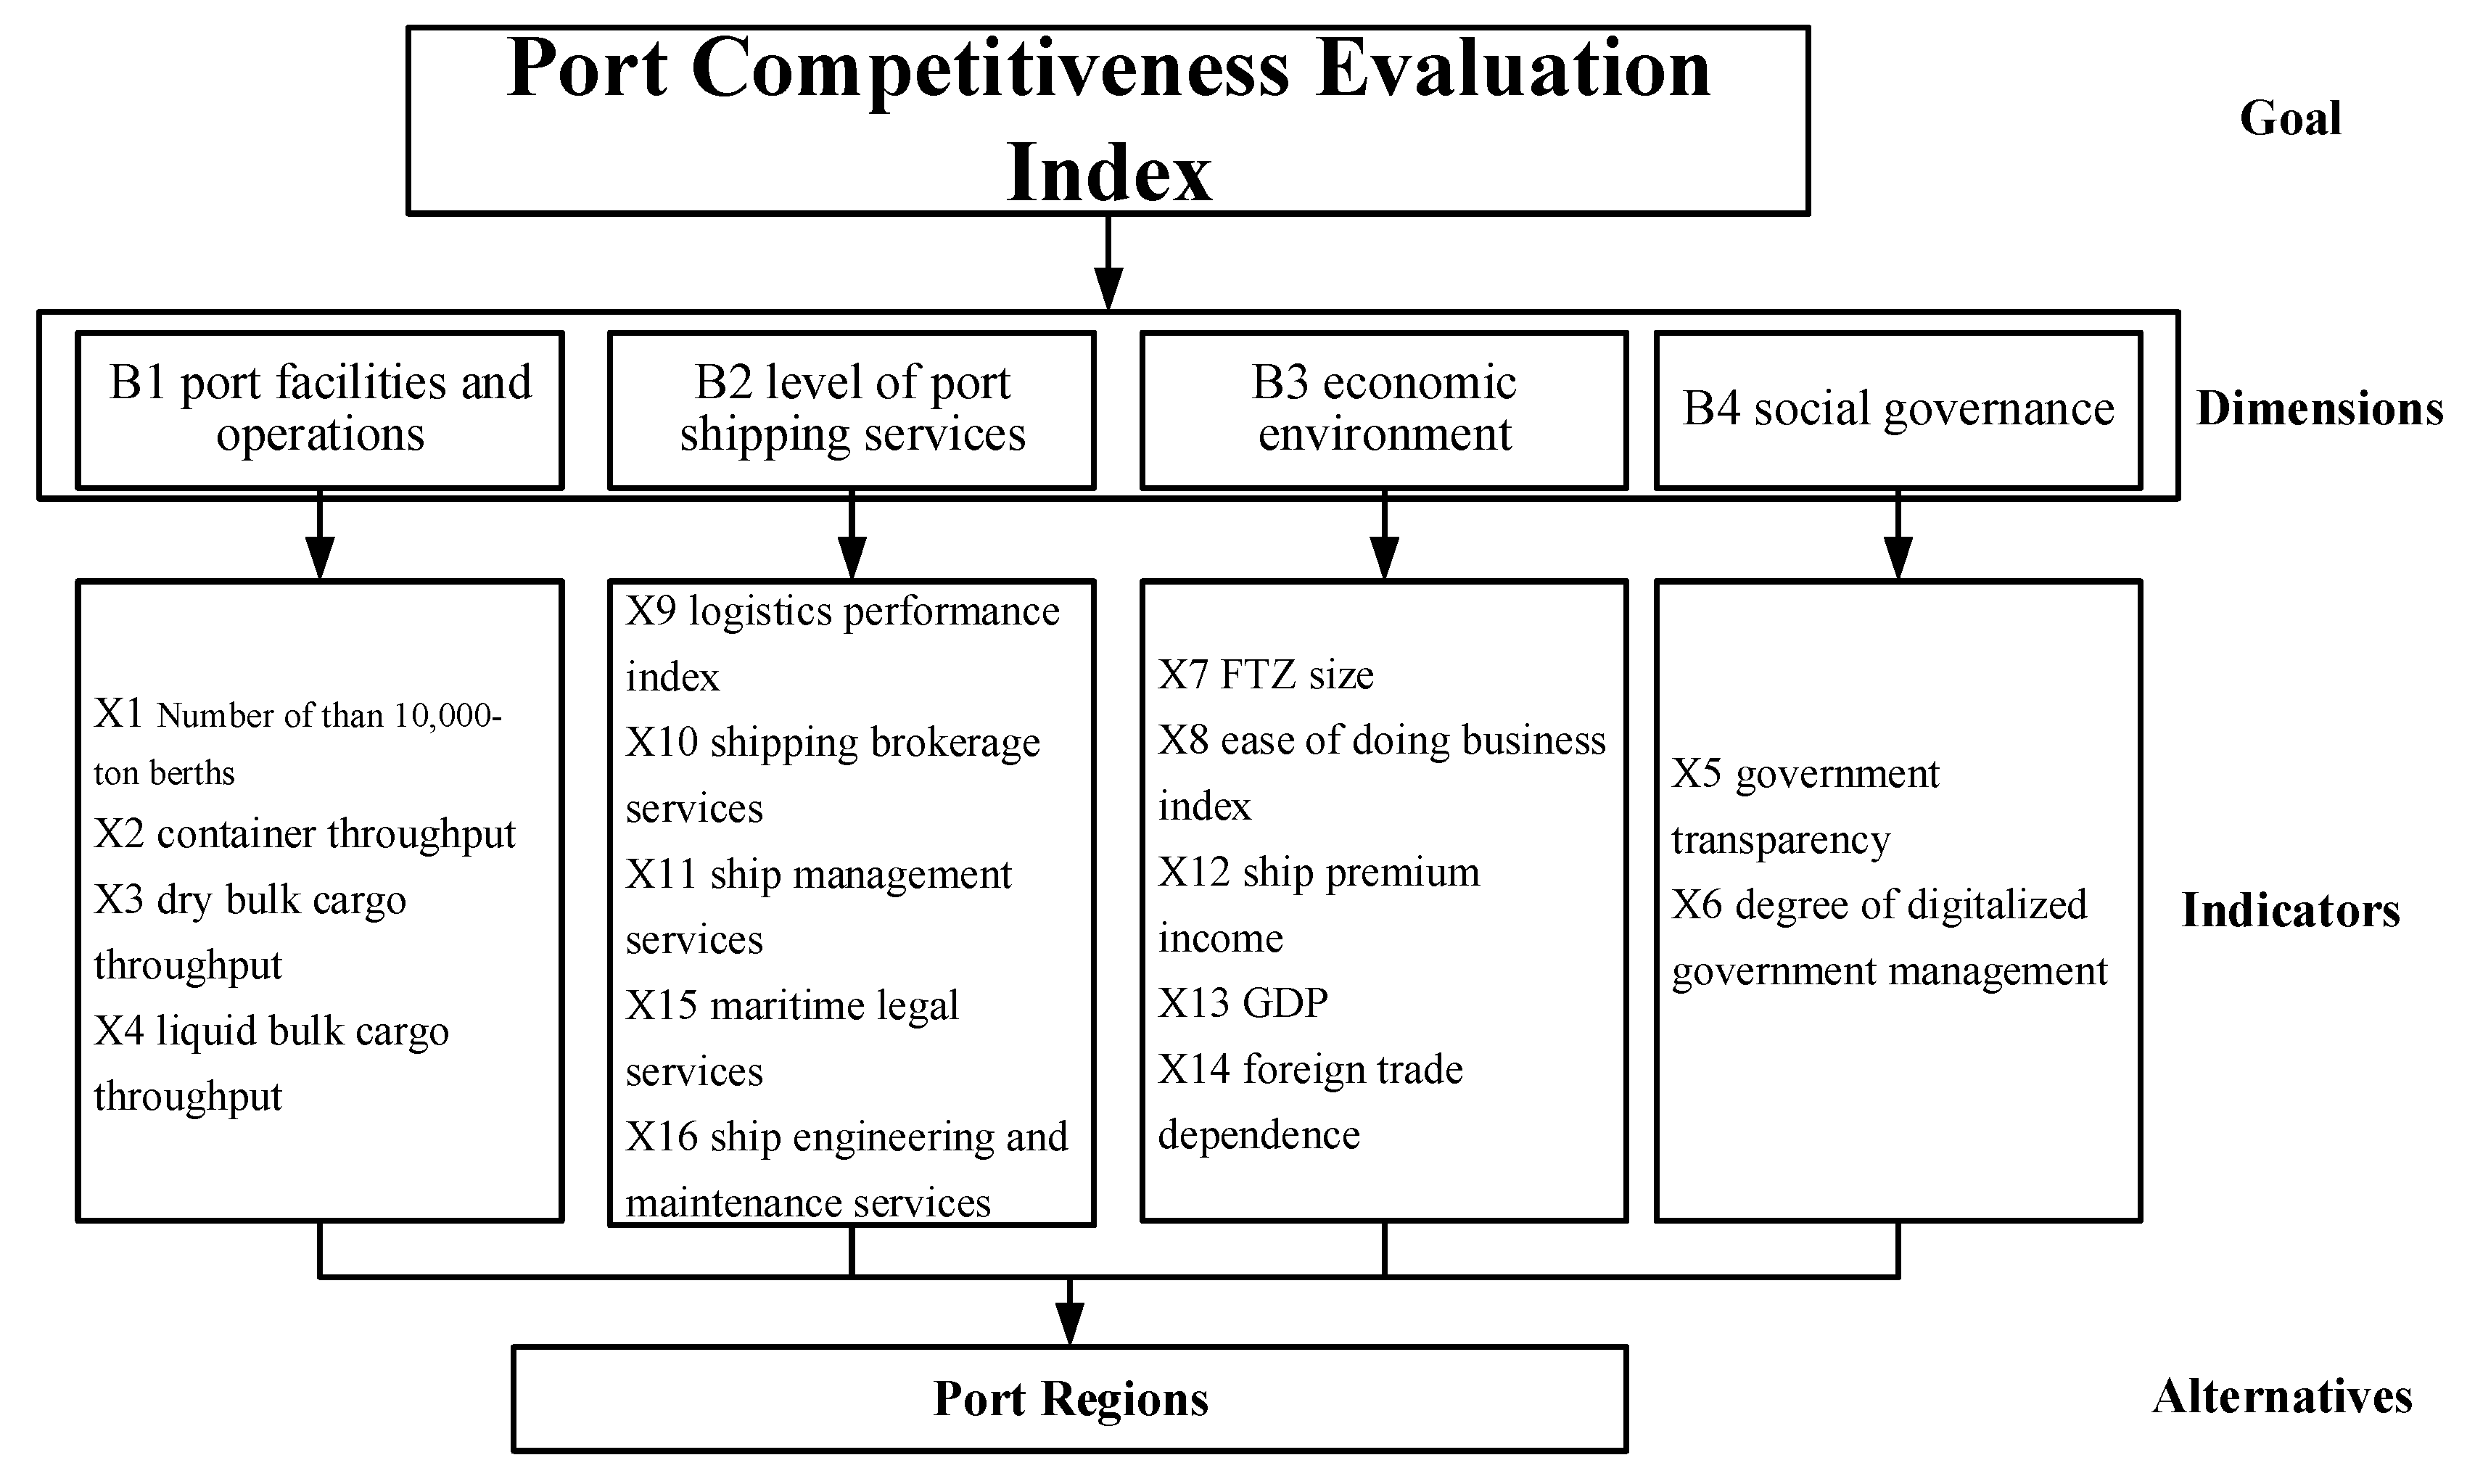
3.1.1. Port Competitiveness Evaluation Index Framework

A port competitiveness evaluation index framework was constructed incorporating port operation-related factors and external environment aspects, which include berth conditions, cargo throughput, and shipping support services. The external environment aspects include government management and macroeconomics. The port competitiveness evaluation index is as follows:
D = { B 1 , B 2 , B 3 , B 4 } = { x 1 , , x j , x k , x h , , x n }
where x 1 is number of berths that can provide service for ships greater than 10,000 tons, x 2 is container throughput, x 3 is dry bulk cargo throughput, x 4 is liquid bulk cargo throughput, x 5 is government transparency, x 6 is degree of digitalized government management, x 7 is FTZ size, x 8 is ease of doing business index, x 9 is logistics performance index, x 10 is shipping brokerage services, x 11 is ship management services, x 12 is ship premium income, x 13 is GDP, x 14 is foreign trade dependence, x 15 is maritime legal services, and x 16 is ship engineering and maintenance services.
In Figure 2, B 1 represents port facilities and operations, including x 1 , x 2 , x 3 , and x 4 , and reflecting the level of port infrastructure construction. Terminals and berths reflect the berthing service capacity of a port, and the throughput of different types of goods reflects the operational capacity of the port. B 2 represents the level of port shipping services, including x 9 , x 10 , x 11 , and x 15 . It provides specialized shipping brokerage services, including chartering and cargo solicitation via agencies, brokerages, and consulting; delivers ship engineering and maintenance services via manufacturing, reconstruction, repair, and overhaul; and provides maritime legal services via maritime arbitration. B 3 refers to the economic environment, including x 7 , x 8 , x 12 , x 13 , and x 14 . The gross domestic product measures the economic situation and development level. Foreign trade dependence implies the rationality of the regional economic structure and degree of openness. The business environment is directly related to the vitality of the port economy and the development of port competitiveness. B 4 refers to social governance and includes x 5 , x 6 , and x 11 . Government transparency reflects the degree of standardization of government management. Transparent and efficient government management can improve port operation efficiency. The digital management level of the organizational system demonstrates the degree of port management modernization. Digital management can optimize port resource allocation and improve operational efficiency. FTZ policy directly affects the convenience of import and export trade. A good policy environment can attract trade transactions and aid port development.
Before proceeding with the quantitative evaluation, all selected indicators must be standardized to eliminate dimensional differences and ensure comparability across provinces and time periods.

3.1.2. Standardization of Competitiveness Evaluation Indicators

The data for Liaoning, Hebei, Tianjin, Shandong, Jiangsu, Shanghai, Zhejiang, Fujian, Guangdong, Guangxi, and Hainan from 2016 to 2022 were standardized as follows:
z i j T = x ij T x j ¯ s j
x j ¯ = 1 m c - a T = a c i = 1 m x ij T
s j = 1 m c - a T = a c i = 1 m x ij T x j ¯ 2
T = a , , c ;   i = 1 , 2 , , m ;   j = 1 , 2 , n
where i denotes the province number in the following order: Liaoning (i = 1), Hebei (i = 2), Tianjin (i = 3), Shandong (i = 4), Jiangsu (i = 5), Shanghai (i = 6), Zhejiang (i = 7), Fujian (i = 8), Guangdong (i = 9), Guangxi (i = 10), and Hainan (i = 11); x ij T denotes the original value of the jth evaluation indicator for province i in year T; x j ¯ denotes the mean value of the jth evaluation indicator of all provinces; s j denotes the standard deviation of the jth evaluation indicator for all provinces; and z i j T denotes the standardized value of the jth evaluation indicator for province i in year T.
After standardizing the competitiveness evaluation indicators, it is necessary to examine their interrelationships to ensure suitability for subsequent dimensionality reduction. Therefore, correlation analysis is conducted in the next section.

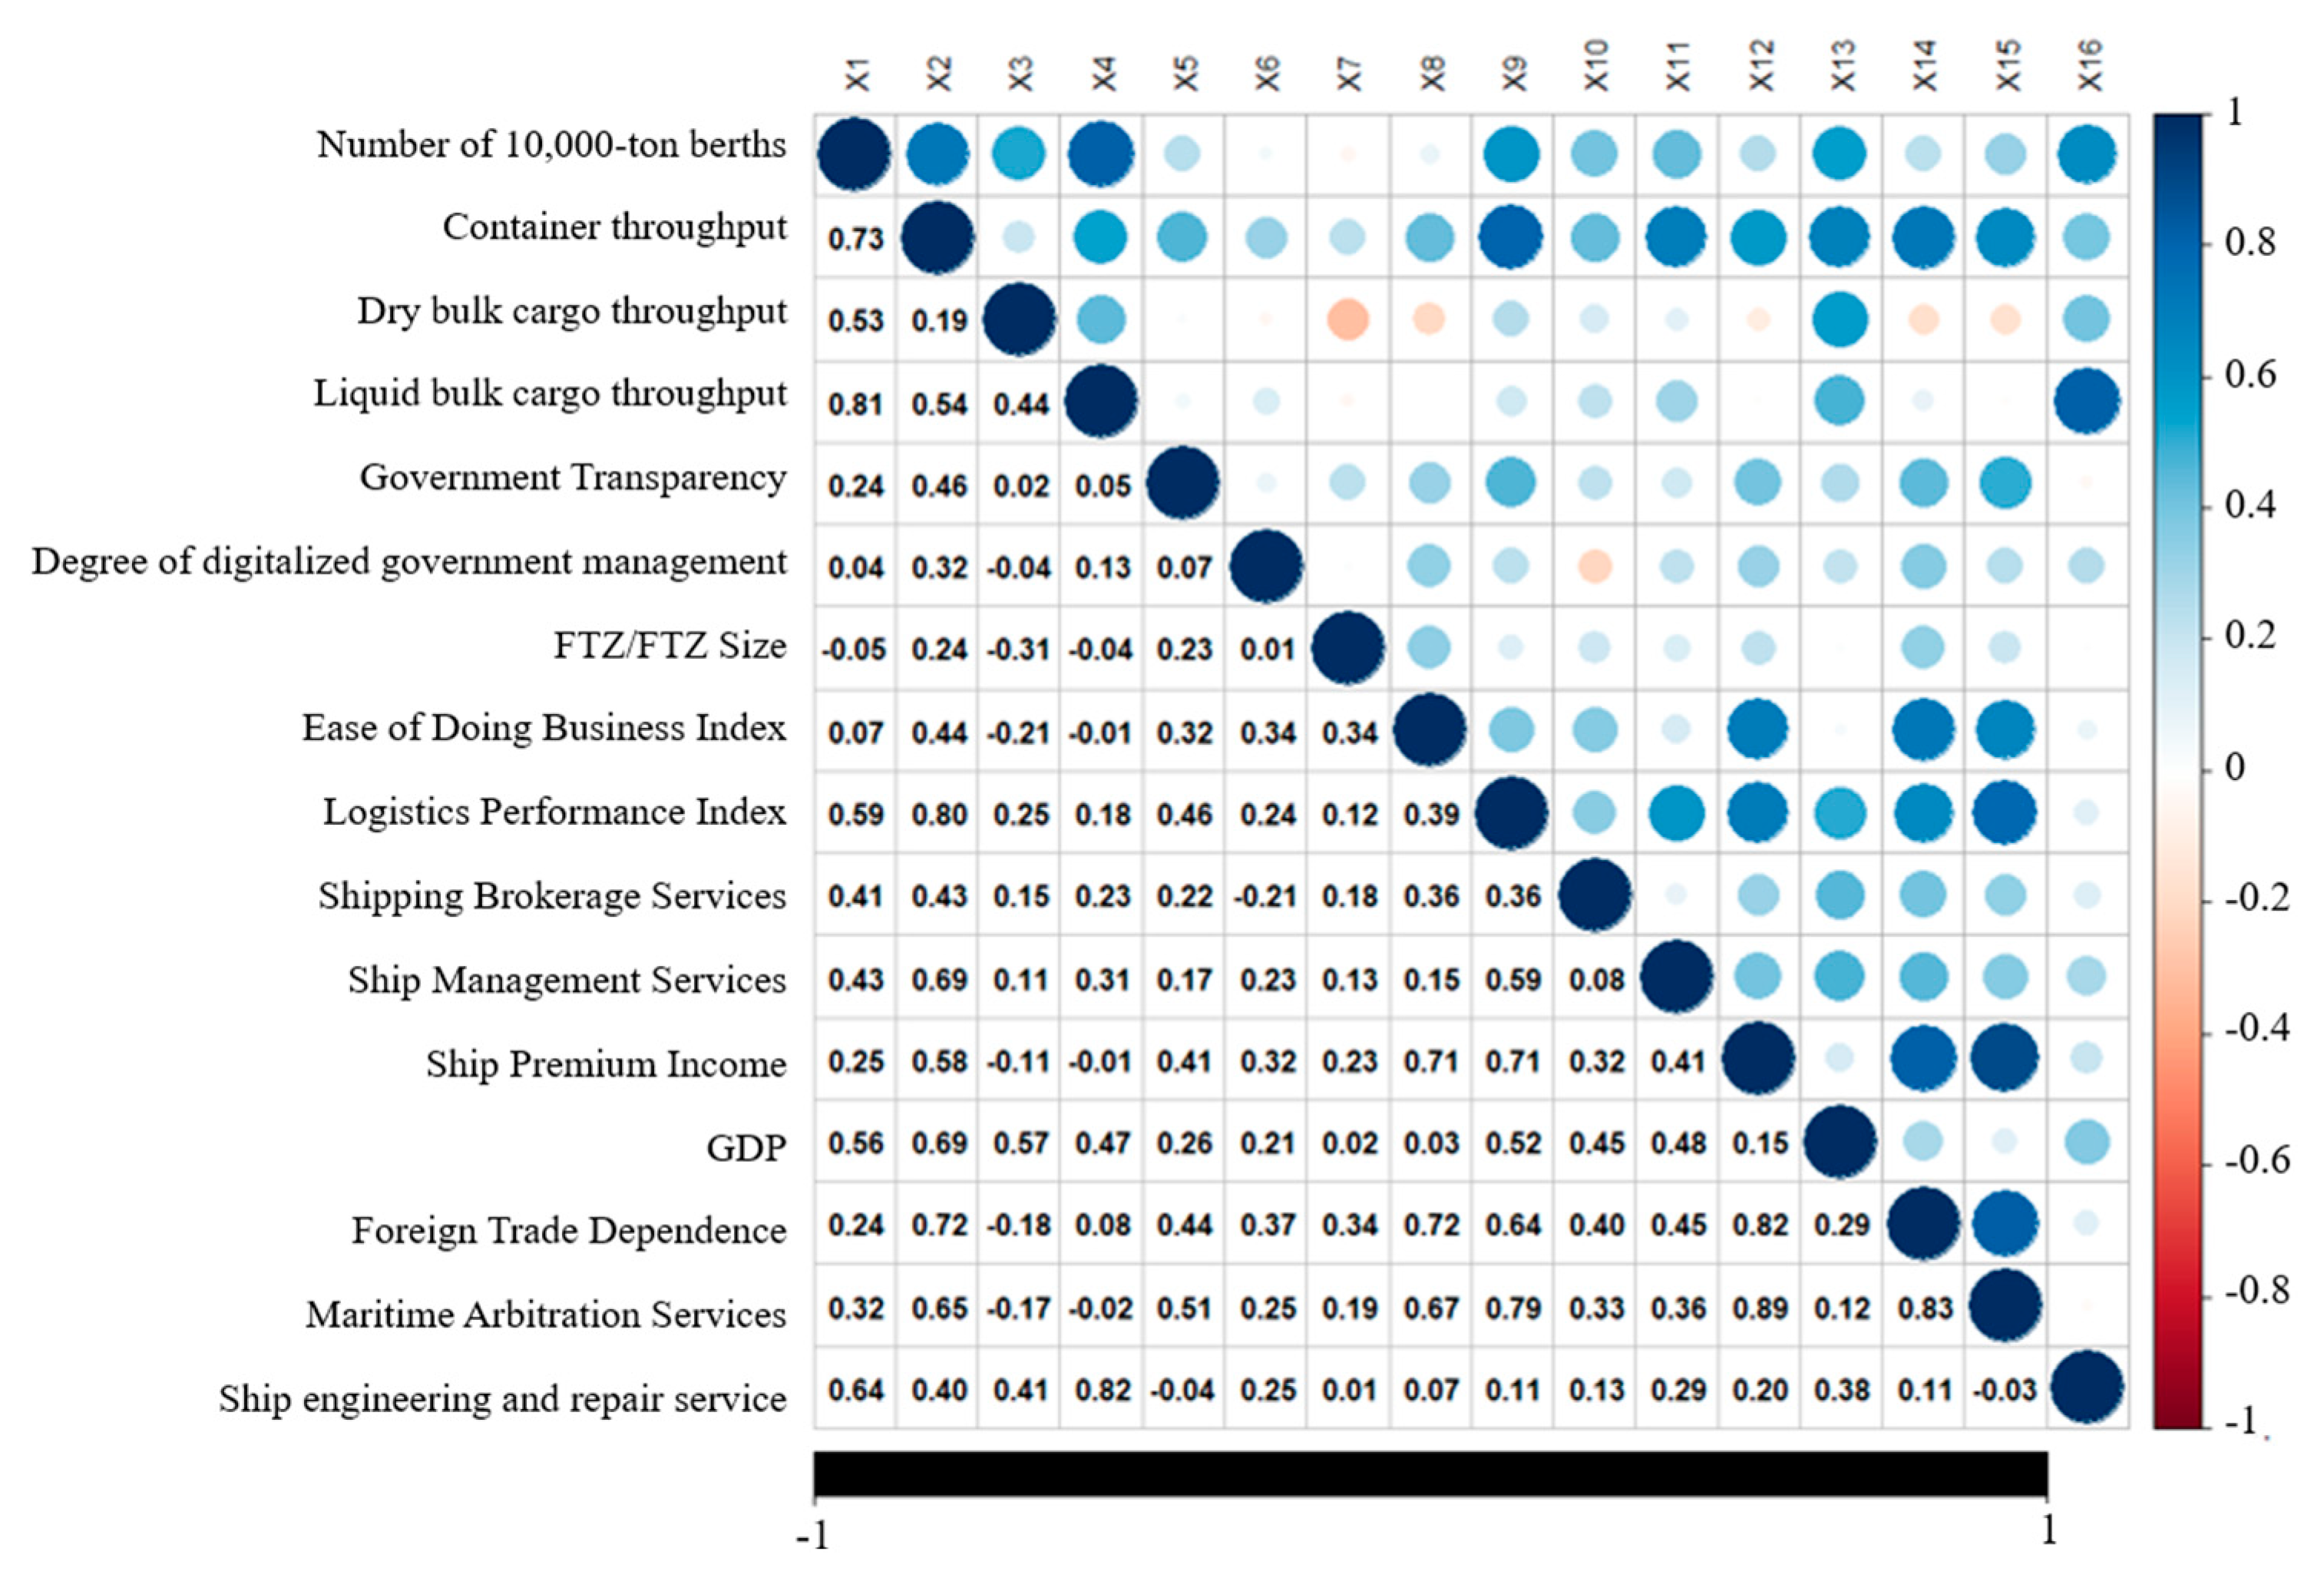
3.1.3. Correlation Calculation for Competitiveness Evaluation Indicators

The correlation matrix R = ( r i j ) n × n of competitiveness evaluation indicators is calculated as follows:
r jk = T = a c i = 1 m z i j T z j ¯ z i k T z k ¯ T = a c i = 1 m z i j T z j ¯ 2 T = a c i = 1 m z i k T z k ¯ 2
where r j j = 1 ,   r k j = r j k ,   j , k = 1 , 2 , 3 , , n , a n d   r j k is the correlation coefficient between the jth x and the kth evaluation indicators. z j ¯ denotes the mean standardized value of the jth evaluation indicator of all provinces.
The bias correlation of the competitiveness evaluation indicators was calculated as shown in Equations (7)–(9). The first-order partial correlation coefficient α j k . h is as follows:
α jk h = r jk r jh r kh ( 1 r jh 2 ) ( 1 r kh 2 )
where   r j h is the correlation coefficient between the jth and hth evaluation indicators and r k h is the correlation coefficient between the kth and hth evaluation indicators.
The second-order partial correlation coefficient α j k · h o is as follows:
α jk ho = α jk h α jo h α ko h ( 1 - α jo h 2 ) ( 1 - α ko h 2 )
where α j k · h , α j o · h , and α k o · h are all first-order partial correlation coefficients.
The q (q ≤ n − 2)-order partial correlation coefficient α j k · τ 1 τ 2 τ q for any two variables x j and x k can be calculated as shown in Equation (9).
α jk τ 1 τ 2 τ q = α jk τ 1 τ 2 τ q 1 α jq τ 1 τ 2 τ q 1 α kq τ 1 τ 2 τ q - 1 ( 1 α 2 jq τ 1 τ 2 τ q 1 ) ( 1 α 2 kq τ 1 τ 2 τ q 1 )
where α j k · τ 1 τ 2 τ q 1 ,     α j q · τ 1 τ 2 τ q 1 , and α k q · τ 1 τ 2 τ q 1 are all q˗1-order partial correlation coefficients.
To ensure the suitability of the evaluation indicators for principal component analysis, further statistical tests such as the KMO test and Bartlett’s test are conducted based on the correlation matrix.

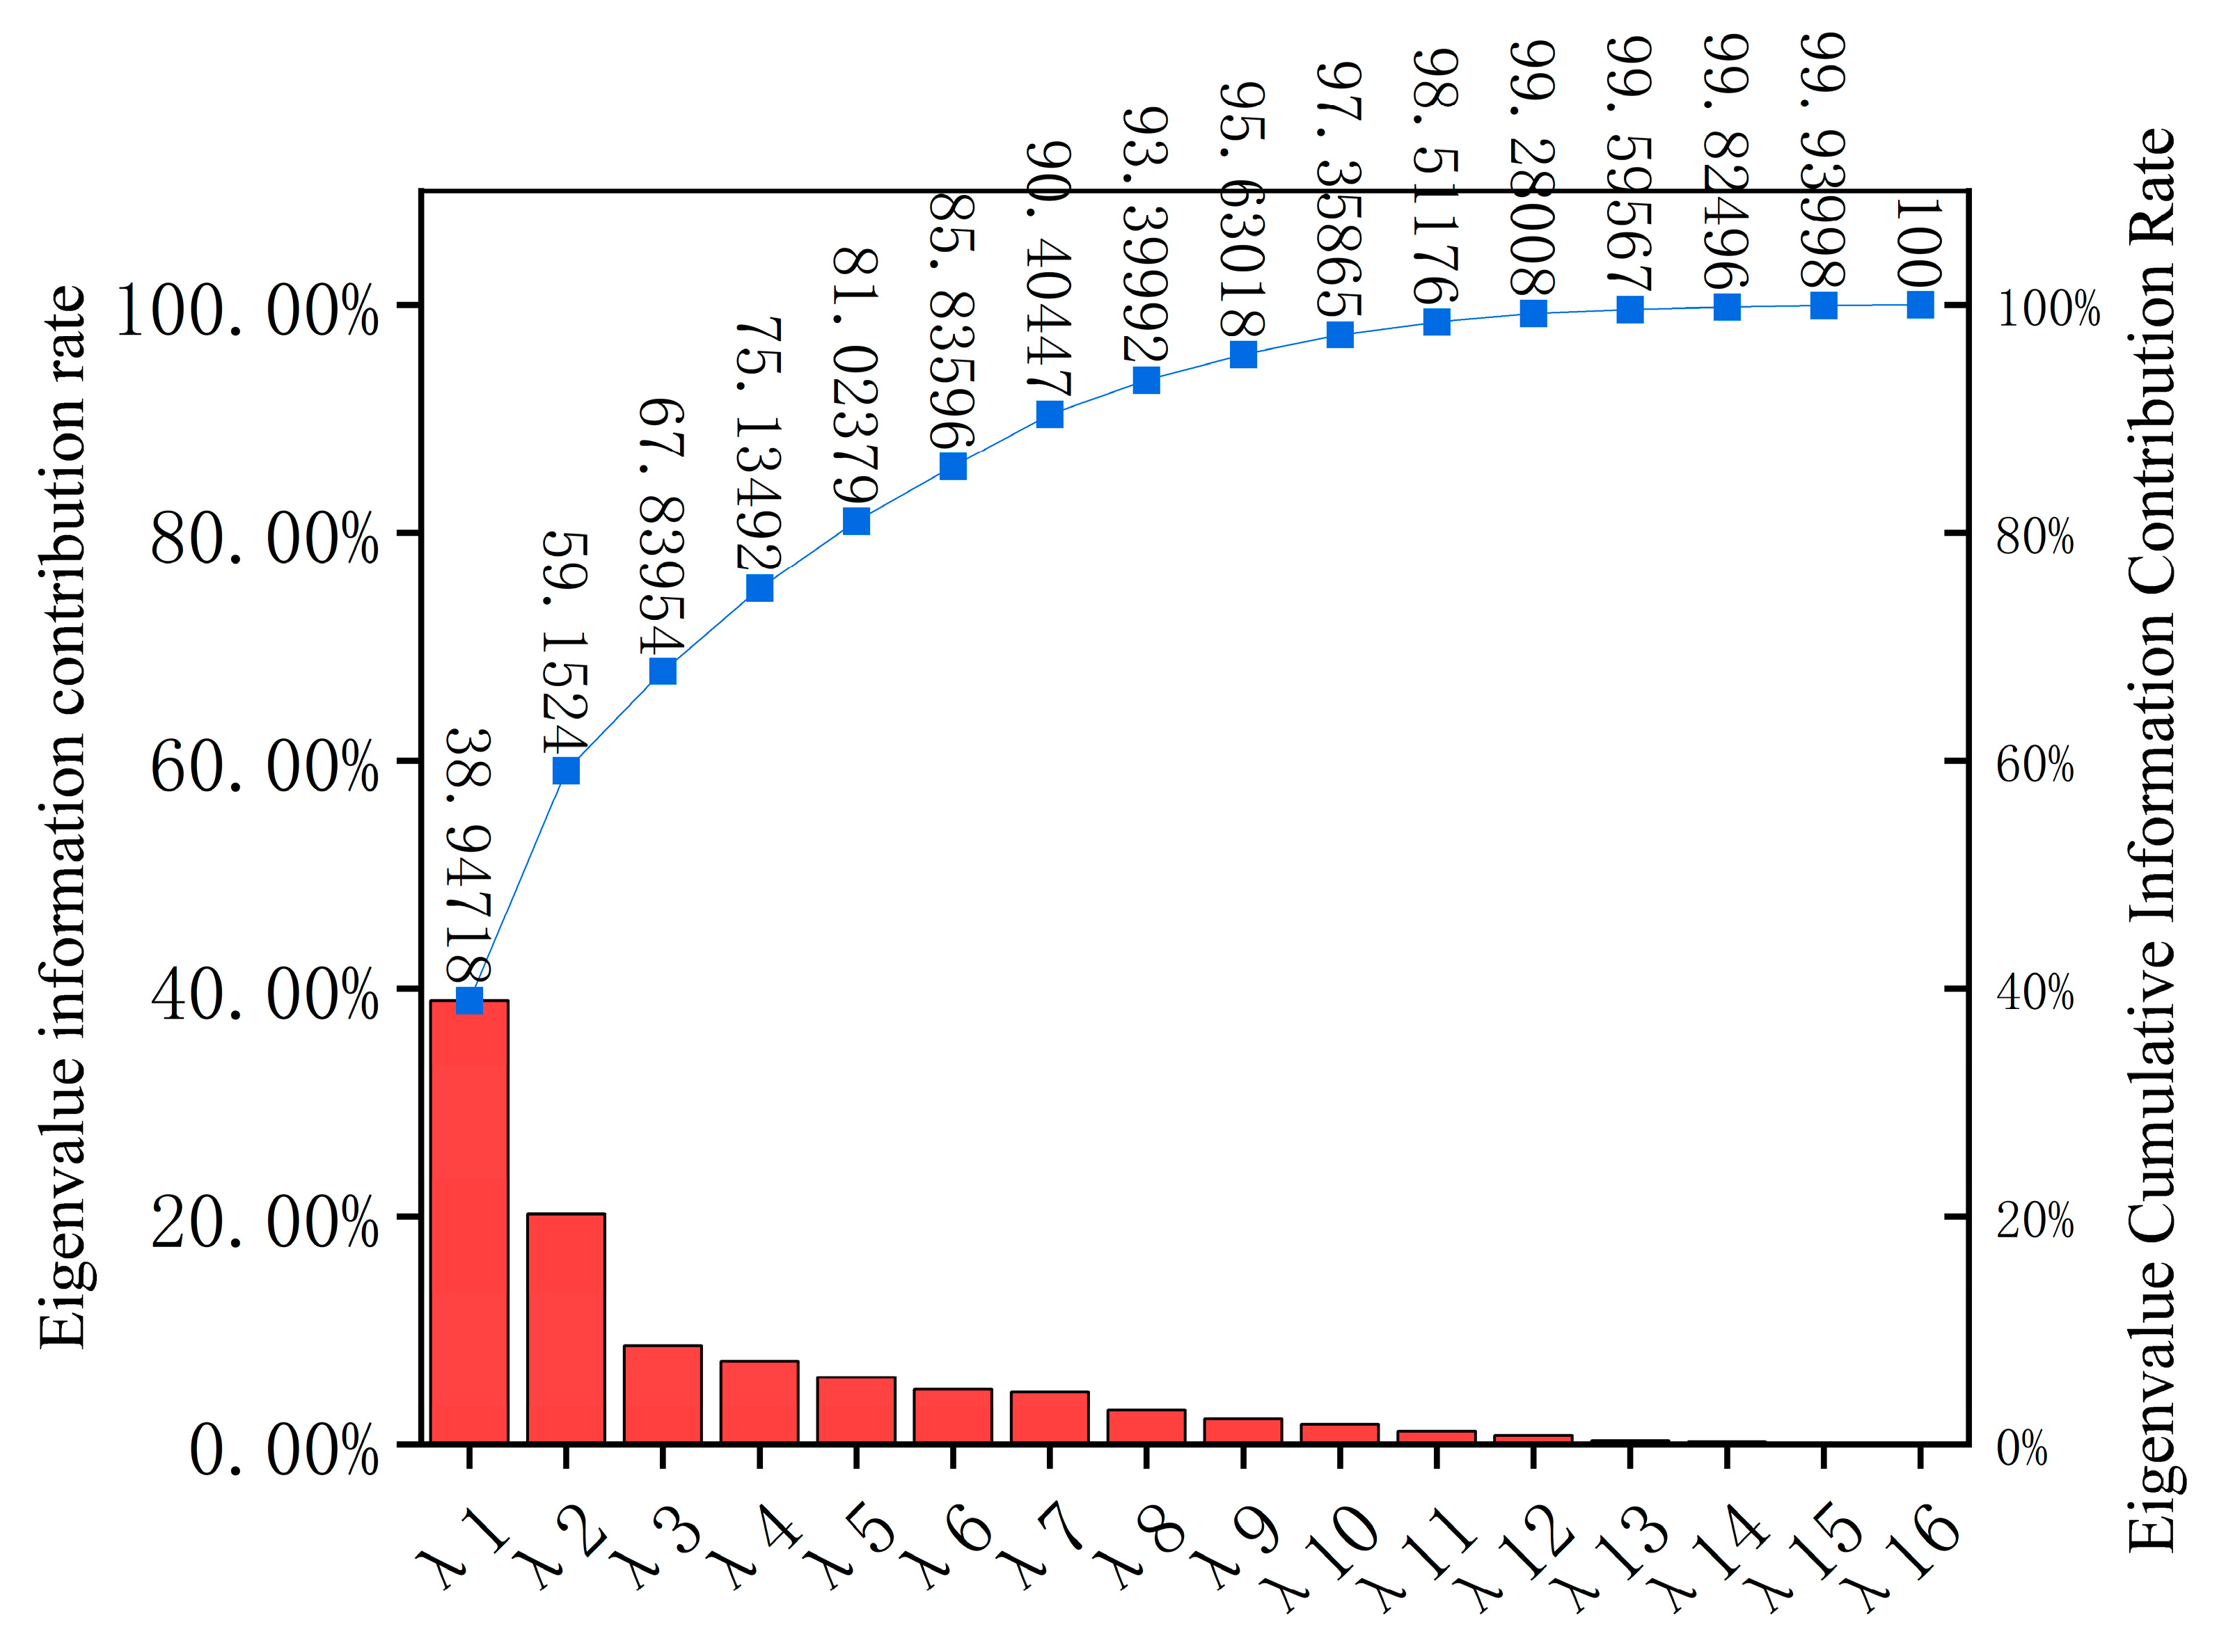
3.1.4. Principal Component Analysis of Port Competitiveness Evaluation Indicators

1.
Kaiser–Meyer–Olkin (KMO) test
The KMO test was used to test the correlation significance between competitiveness evaluation indicators, whose values are distributed between 0 and 1, with values closer to 1 indicating stronger correlations and those closer to 0 indicating weaker correlations.
K M O = j k r j k 2 j k r j k 2 + j k α j k . τ 1 τ 2 τ n 2
2.
Bartlett’s test
Bartlett’s test was conducted based on the correlation coefficient matrix, R = r j k n × n . χ 2 can be calculated using Equations (11) and (12).
χ 2 0.05 , d f = T m 2 n + 11 / 6 ln R
d f = n n 1 / 2
where T m is the number of data records for port competitiveness evaluation; n is the number of indicators used for the PCA; |R| is the determinant value of the correlation coefficient matrix R; and d f is the degree of freedom in Bartlett’s test. Bartlett’s test value was calculated and compared with χ 2 0.05 , d f , which represents a 95% confidence value with d f degrees of freedom. If χ 2 < χ 2 0.05 , d f , the correlation between the indicators is suitable for factor analysis, and vice versa.
3.
Calculation of the principal component score
The eigenvalues λ s , the corresponding information contribution rate b s , and the cumulative contribution rate α s were calculated after both the KMO test and Bartlett’s test indicated the suitability of factor analysis. λ s was calculated as follows:
λ s E R = 0
where E is the unit matrix with the same order as R. All eigenvalues sorted from largest to smallest satisfy λ 1 λ 2 λ s λ n 0 . Next, the information contribution rate b s of the principal component F s is calculated as shown in Equation (14), and α s is the cumulative contribution rate of the principal component F 1 F 2 F s F n is calculated as shown in Equation (15).
b s = λ s s = 1 n λ s
α s = s = 1 n b s
The F s principal component scores f i s T for province i in year T were calculated as follows:
f i s T = v 1 s z i 1 T + v 2 s z i 2 T + . + v n s z i n T
where T j is the eigenvector corresponding to   λ j ,   T j = v 1 j , v 2 j , . . . , v n j T ,   j = 1,2 , 3 , , n .
Once the KMO and Bartlett’s tests confirm the data suitability, the principal component scores can be calculated and further used to derive port competitiveness scores.

3.1.5. Port Competitiveness Calculation
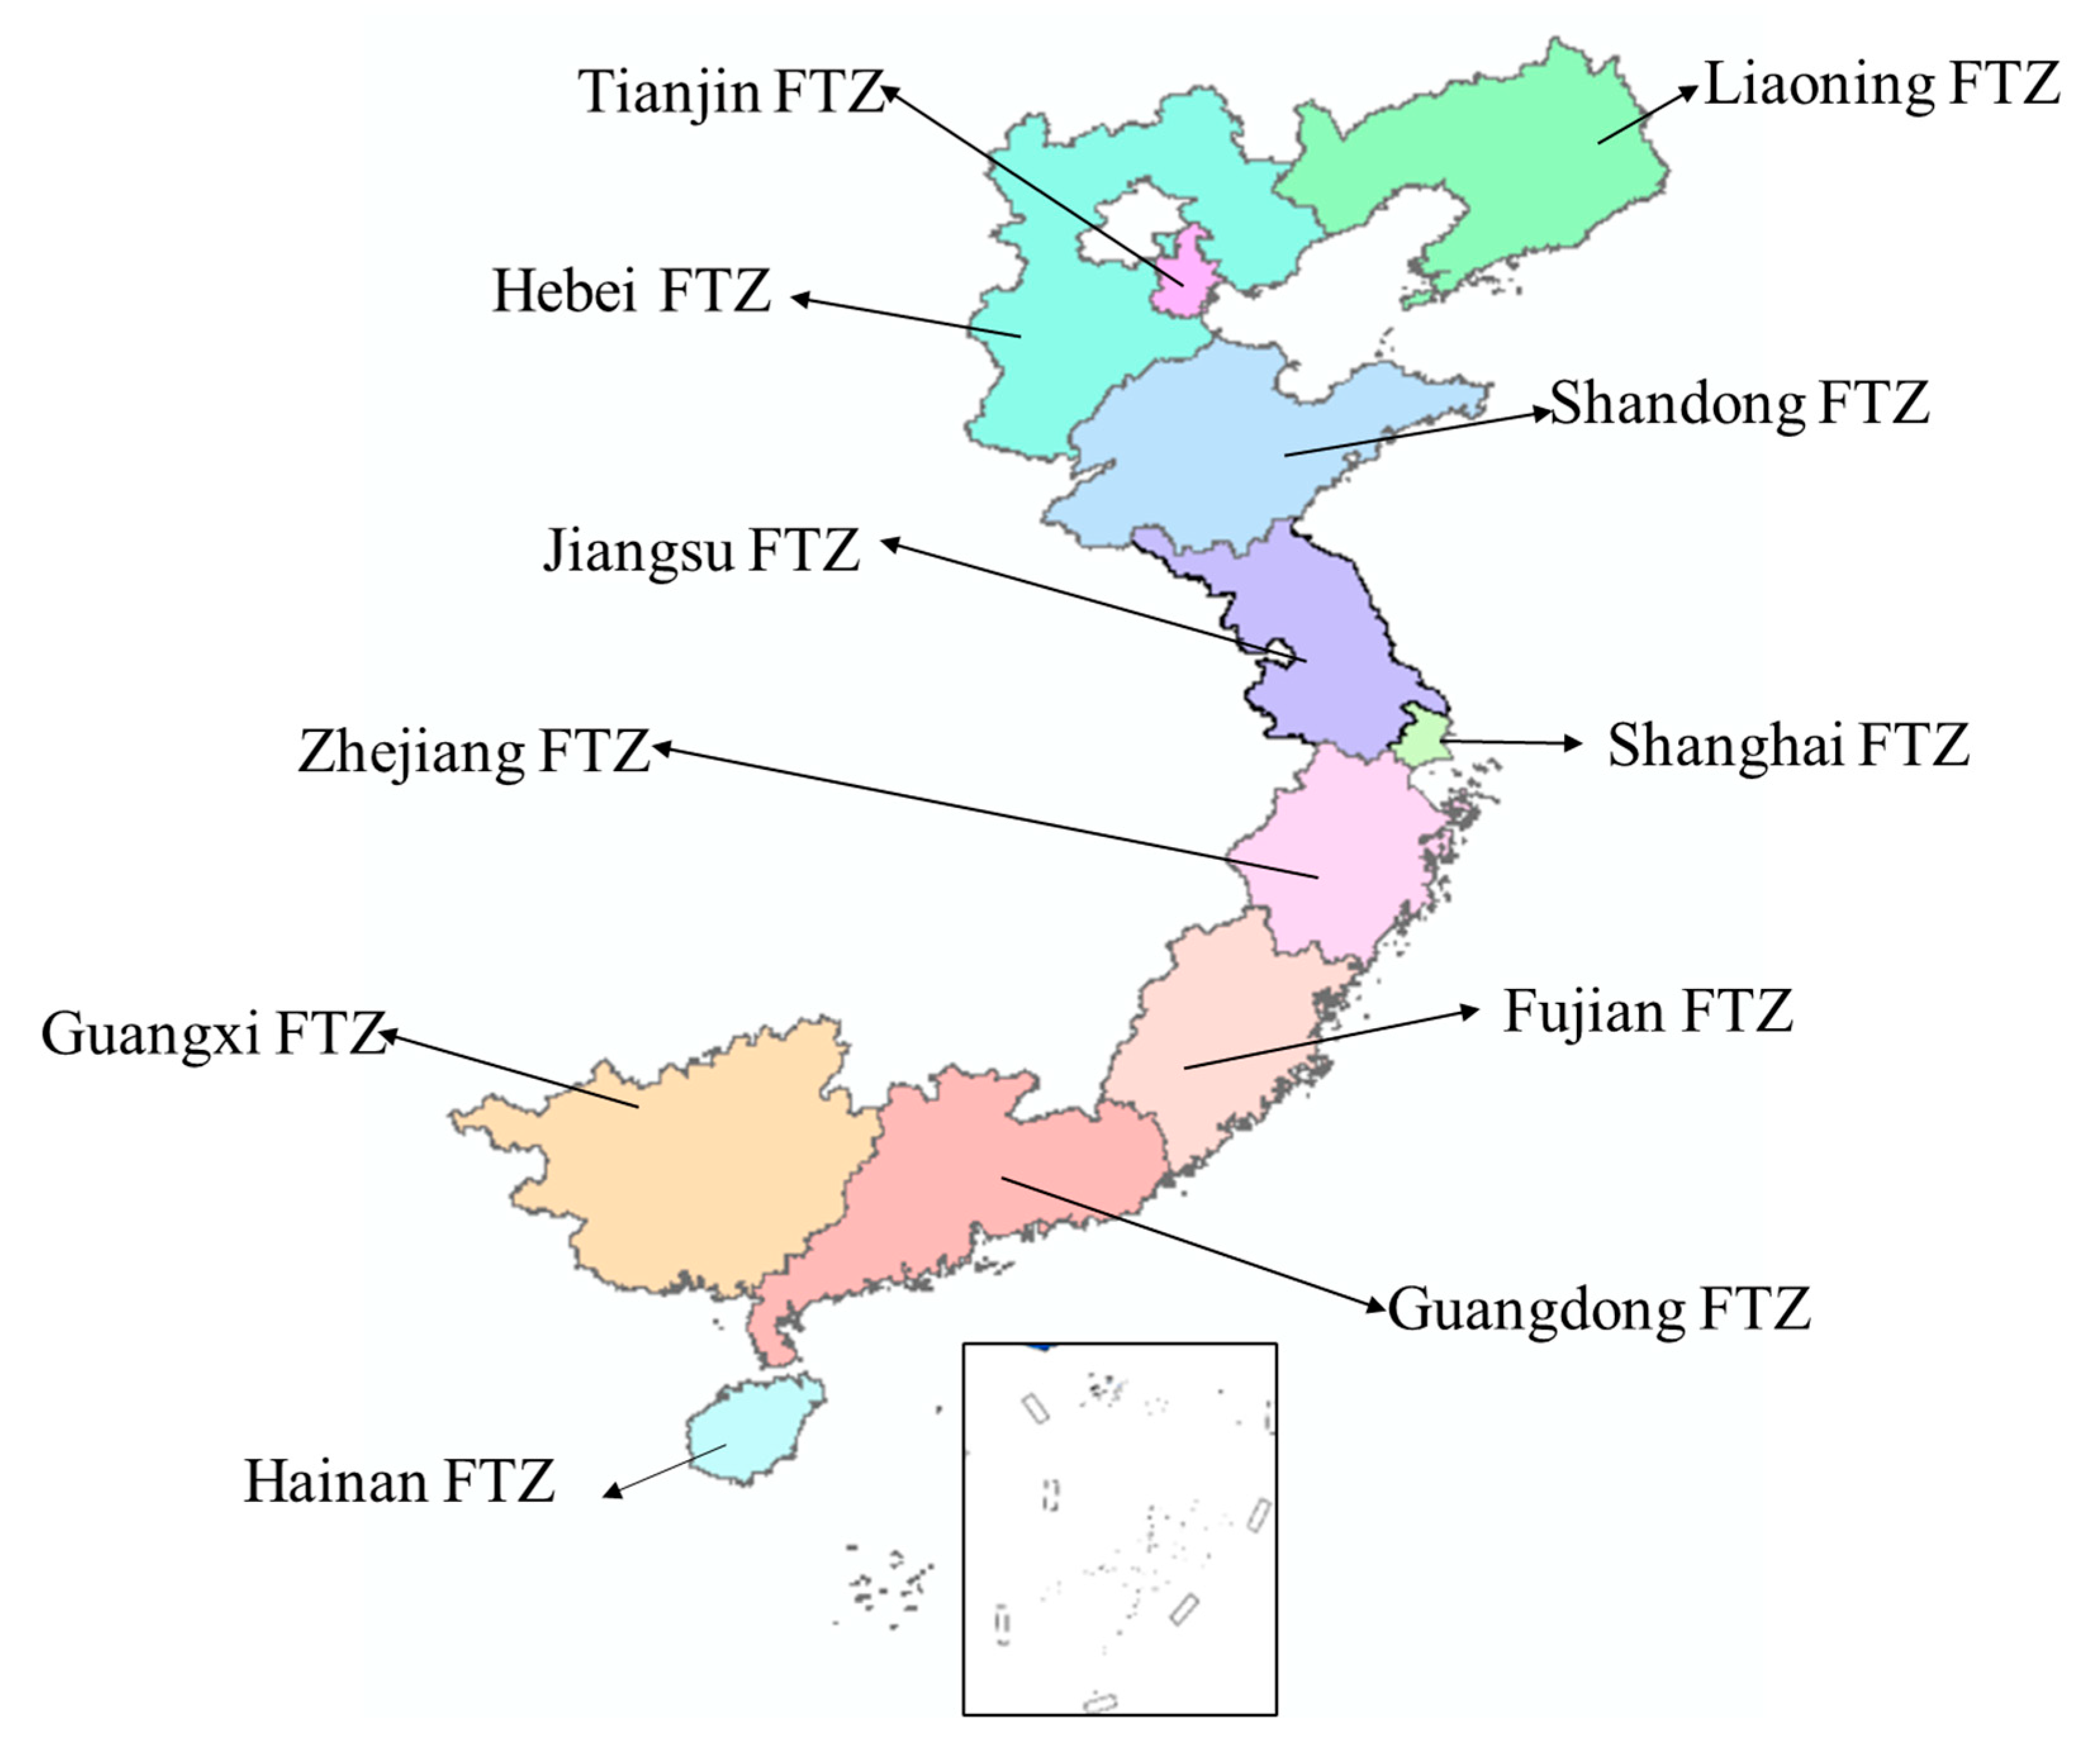
Based on the cumulative contribution rate α s being greater than 85% and the eigenvalue λ s being greater than 1, the first u (u < n) principal components are extracted. The principal component score matrix for all provinces for all years was obtained as follows:
F = f 11 a f 1 u a f m 1 a f m u a f 11 c f 1 u c f m 1 c f m u c
f ¯ i s T is obtained by normalizing f i s T using the polar transform method:
f ¯ i s T = f i s T m i n ( f s ) m a x ( f s ) m i n ( f s )
where f ¯ i s T [ 0,1 ] , m i n ( f s ) and m a x ( f s ) are the minimum value and maximum value of the sth principal component score for the mth province between years a and c, respectively. T = a , , c ;   i = 1,2 , , m ;   s = 1,2 , 3 , , u . Gravimetric transformation of the normalized principal component f ¯ i s T yields p i s T as follows:
p i s T = f i s T ¯ T = a c i = 1 m f i s T ¯
Calculate the entropy value e s for the s principal component as follows.
e s = 1 ln m ( c a ) T = a c i = 1 m p i s T l n p i s T
Calculate the variation coefficient h s for the sth principal component as follows.
h s = 1 e s
Calculate the weight w s for the sth principal component:
w s = h s s = 1 u h s
Based on the entropy value, variation coefficient, and weight of each principal component, the port competitiveness score of province i in year T G i T is expressed as follows:
G i T = s = 1 u f i s T w s
where, T = a , , c ;   i = 1 , 2 , , m ;   s = 1 , 2 , 3 , , u .

3.2. Research Data

The study area included coastal ports (excluding Hong Kong, Macao, and Taiwan) in 11 provinces of China, including Liaoning, Hebei, Tianjin, Shandong, Jiangsu, Shanghai, Zhejiang, Fujian, Guangdong, and Guangxi Hainan. As shown in Figure 3, Shanghai FTZ was established in September 2013. Tianjin FTZ was established in April 2015. In 2015, Tianjin Port Group and Hebei Port Group signed a framework agreement to realize the integration of Hebei Port. In 2015, the Zhejiang Port Investment and Operation Group was established. Zhejiang FTZ was established in April 2017. Fujian FTZ was established in April 2015. In June 2017, Fujian Province accelerated the integration of ports in Fujian. The Guangdong FTZ was established in April 2015. At the end of 2018, Guangdong Province integrated the province’s port resources. Hainan Free Trade Port was established in April 2018. In May 2019, Hainan Province and COSCO Shanghai integrated China’s port resources in the South China Sea port area. Shandong Port Group was established in August 2019. Shandong FTZ was established in August 2019. Liaoning Port Group was established in January 2019. Liaoning FTA was established in August 2019. Guangxi FTA was established in August 2019. In October 2019, the Beibu Gulf Port Cluster was established.
The data were primarily derived from the Ministry of Transport of China, China Maritime Administration, China Port Yearbook, and the statistical yearbooks of various provinces from 2016 to 2022, as listed in Table 1.

4. Results

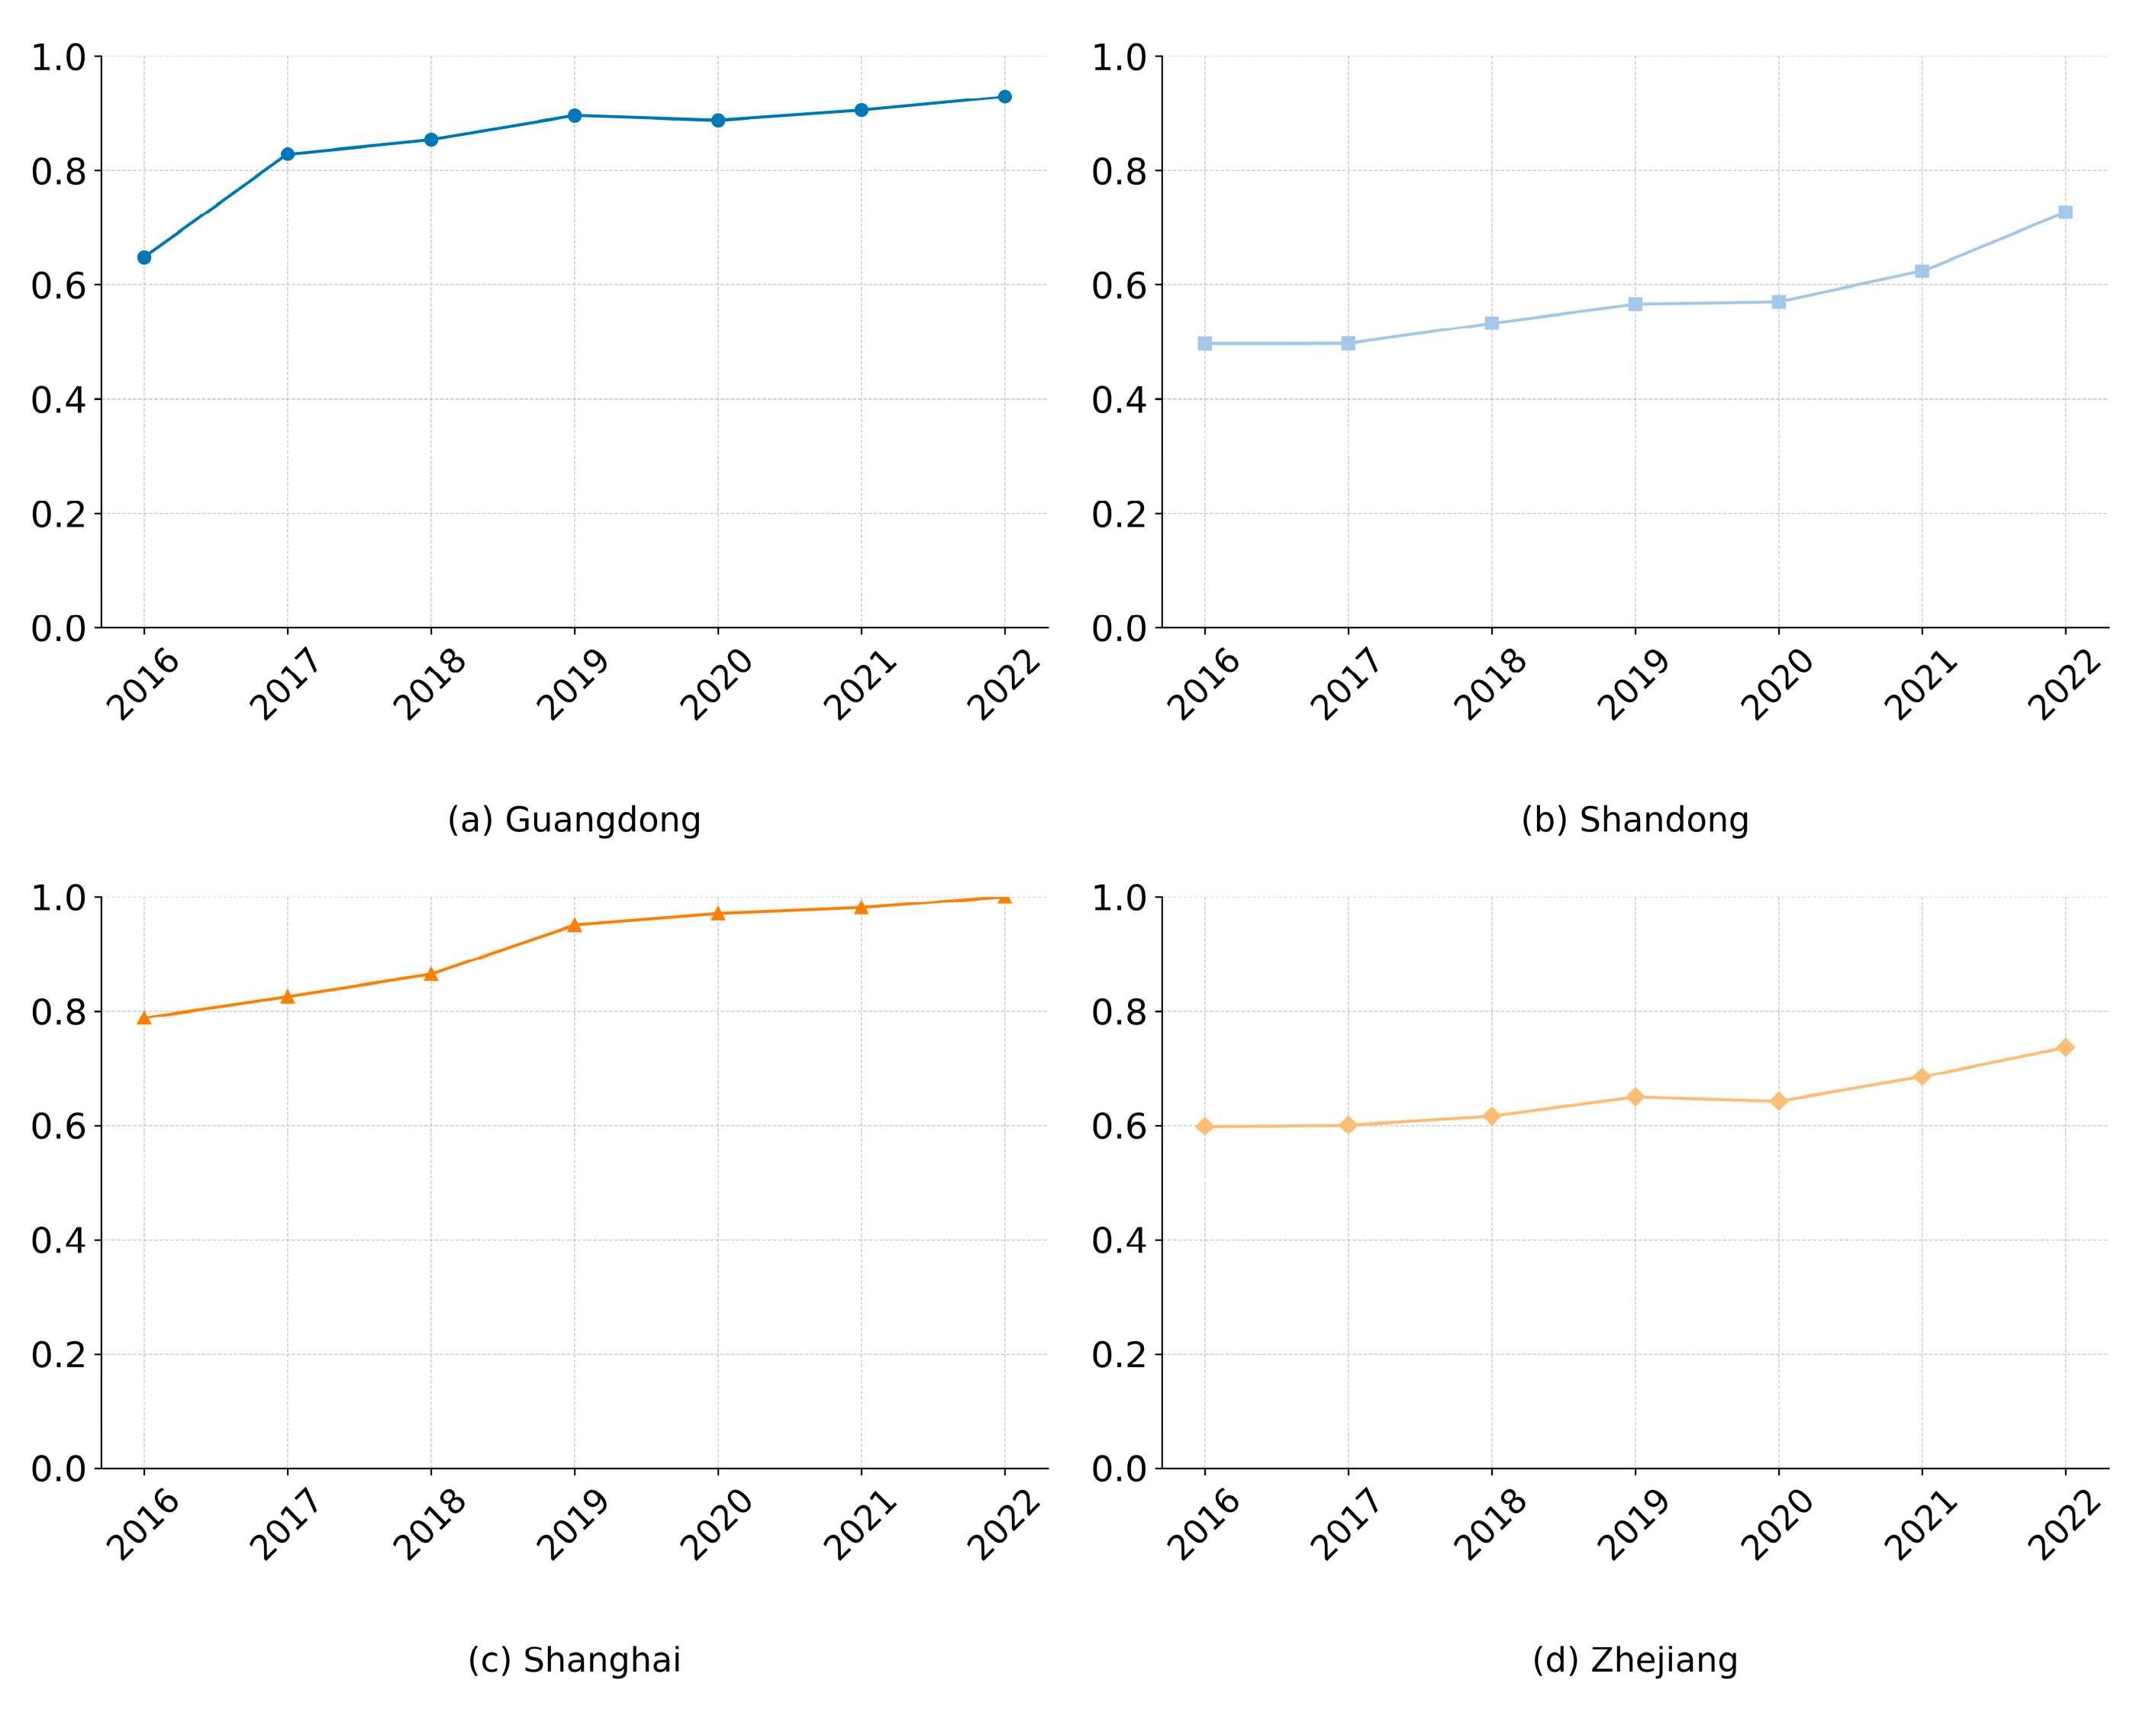
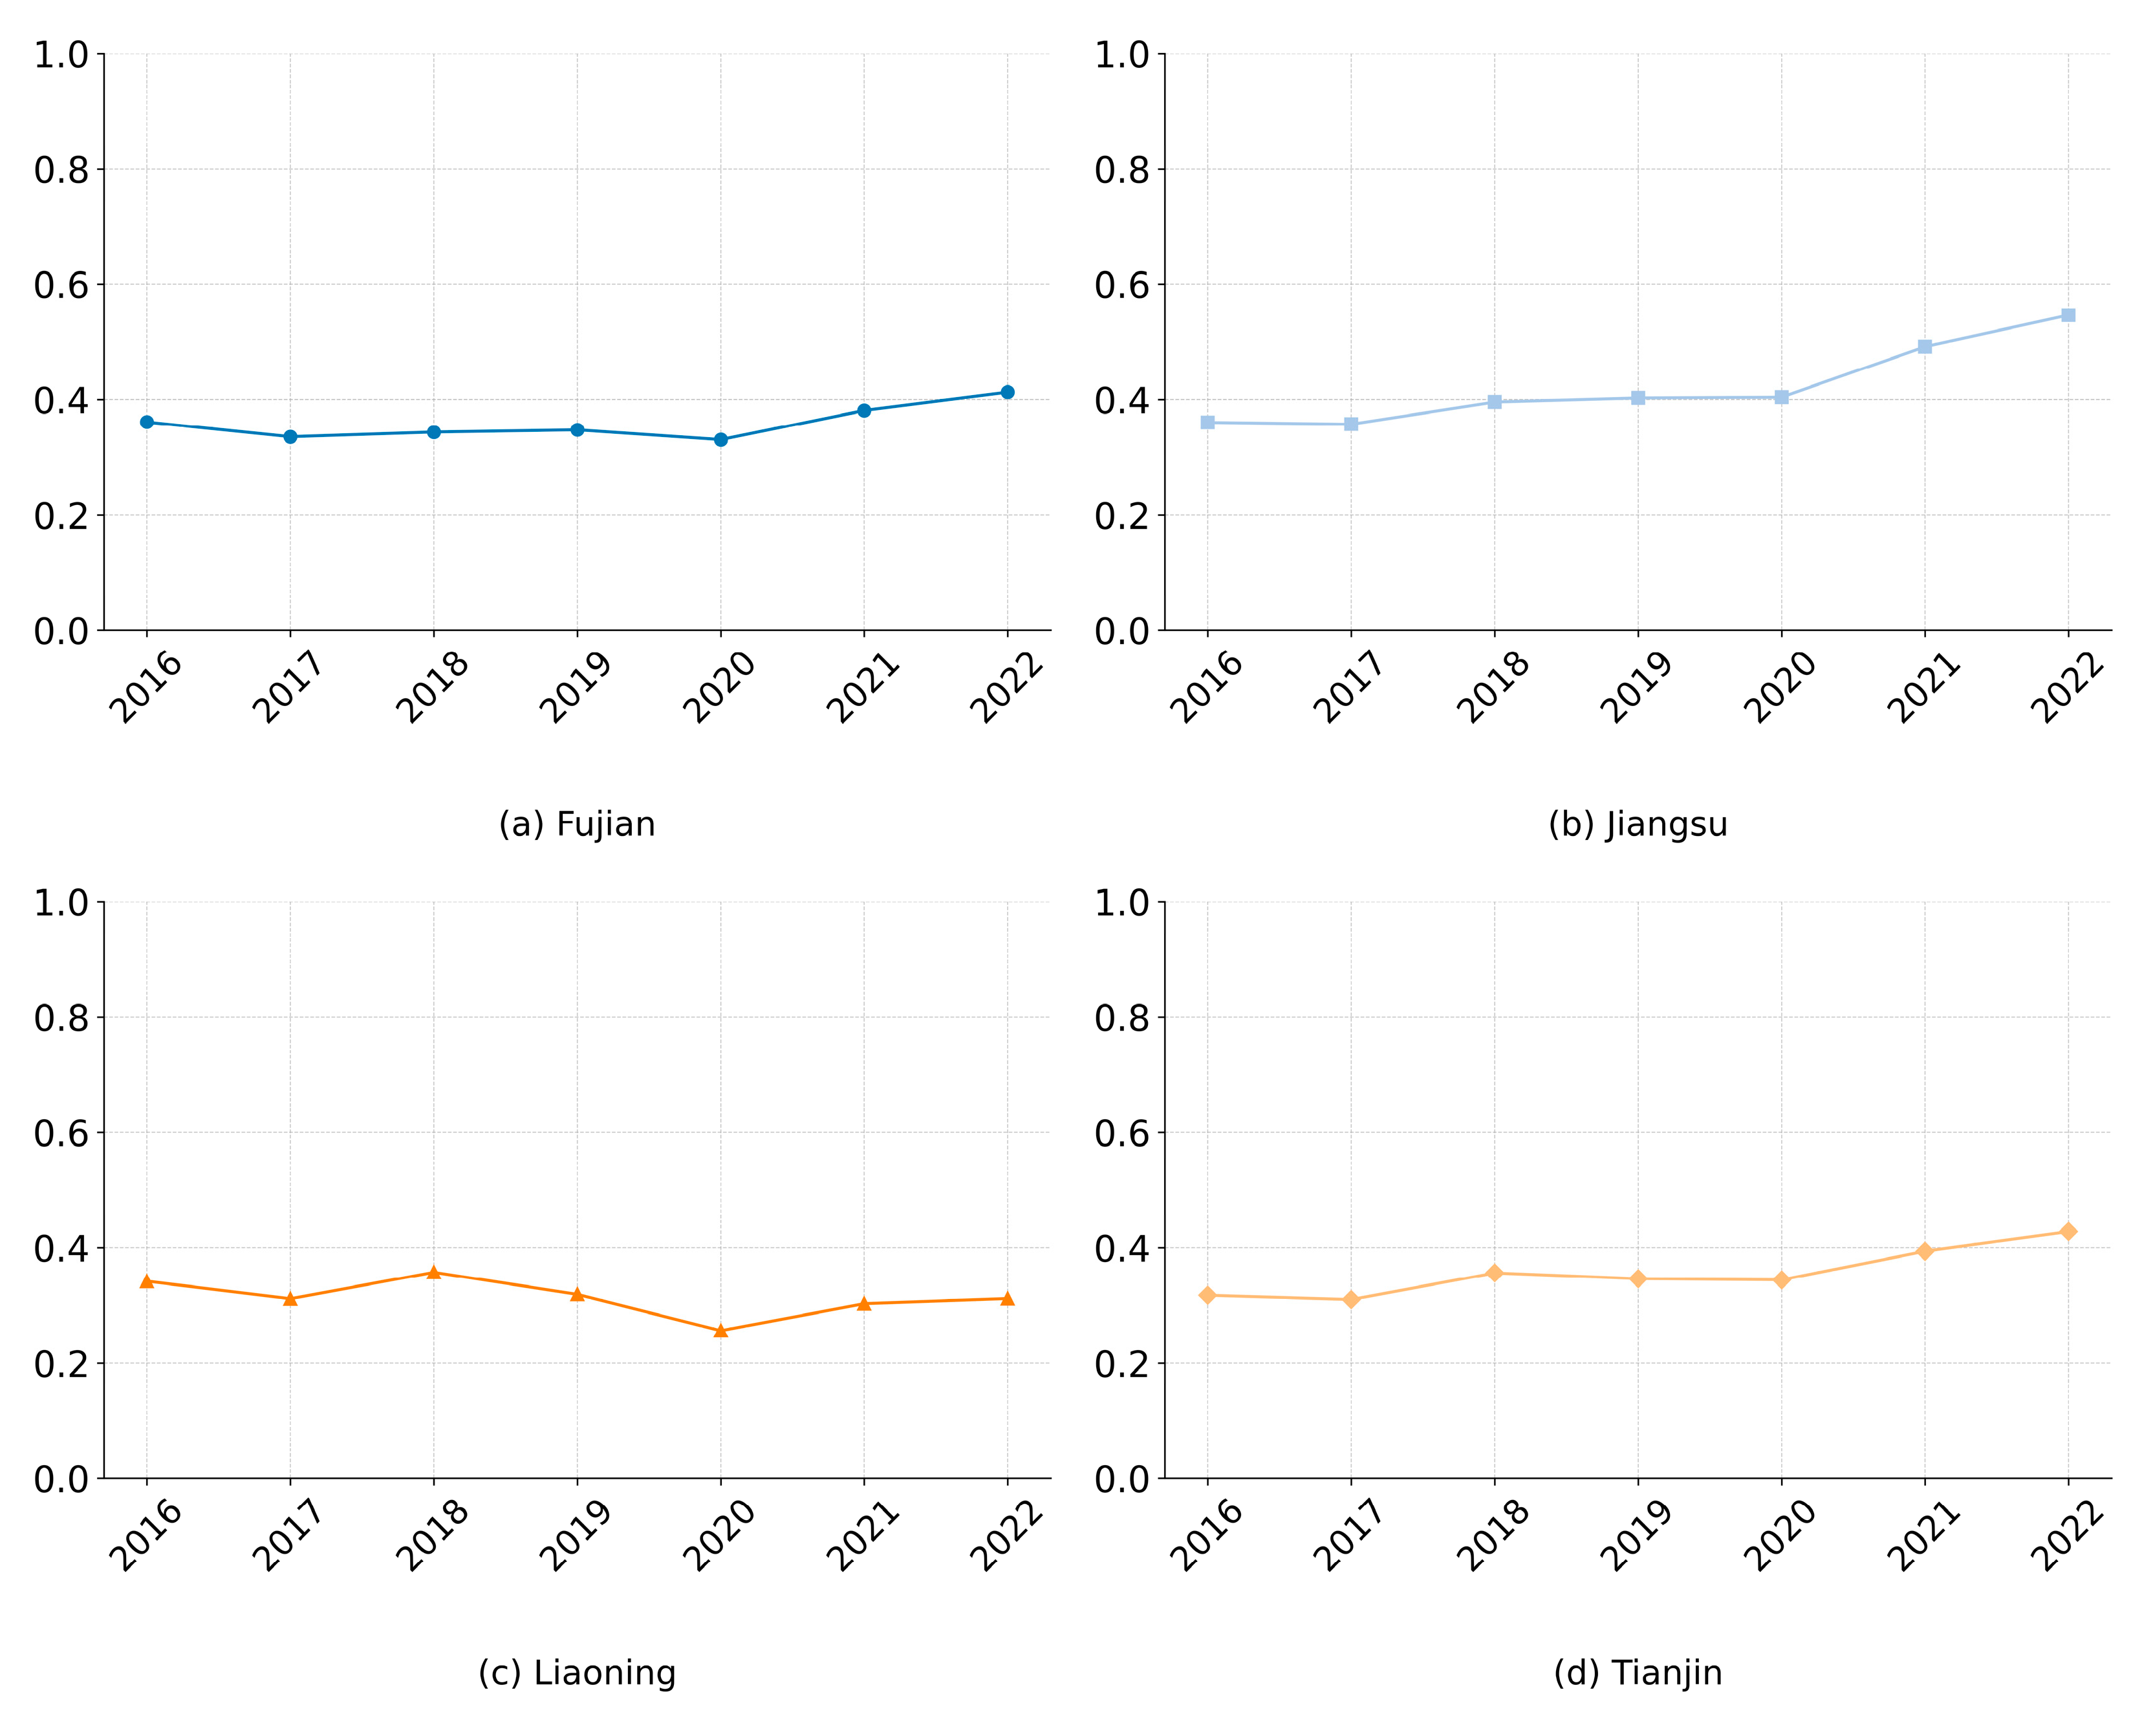
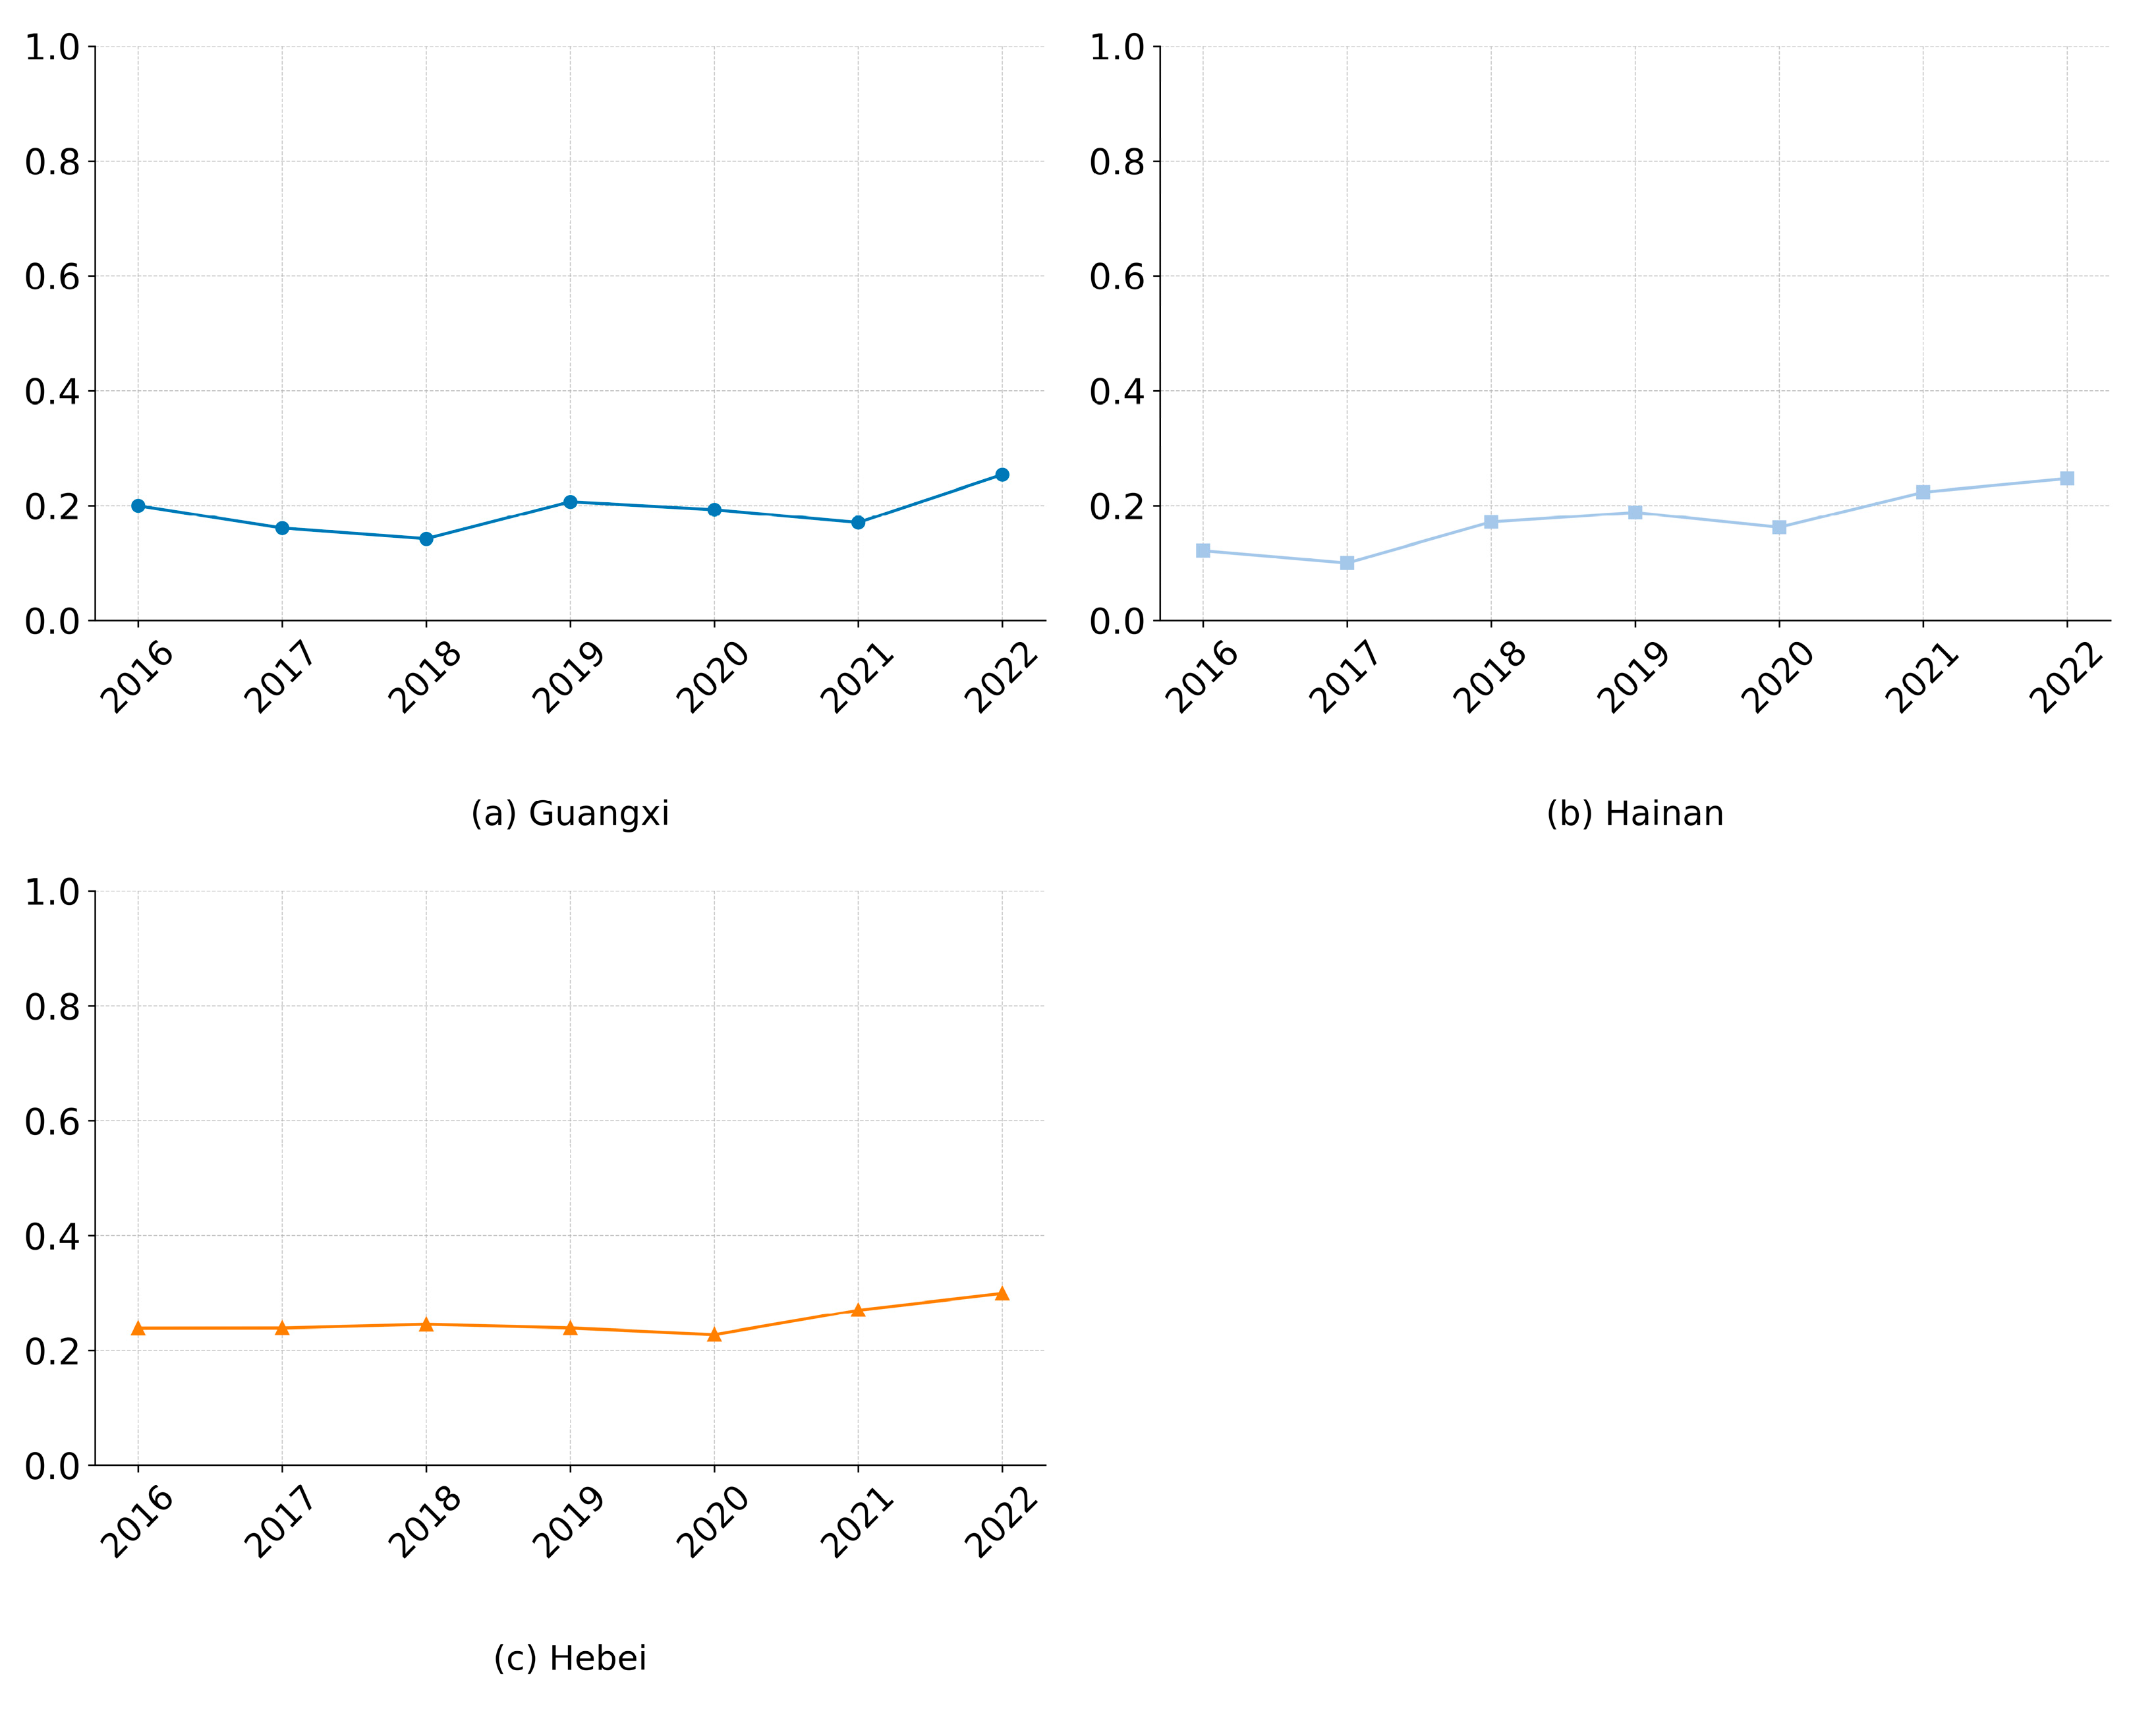
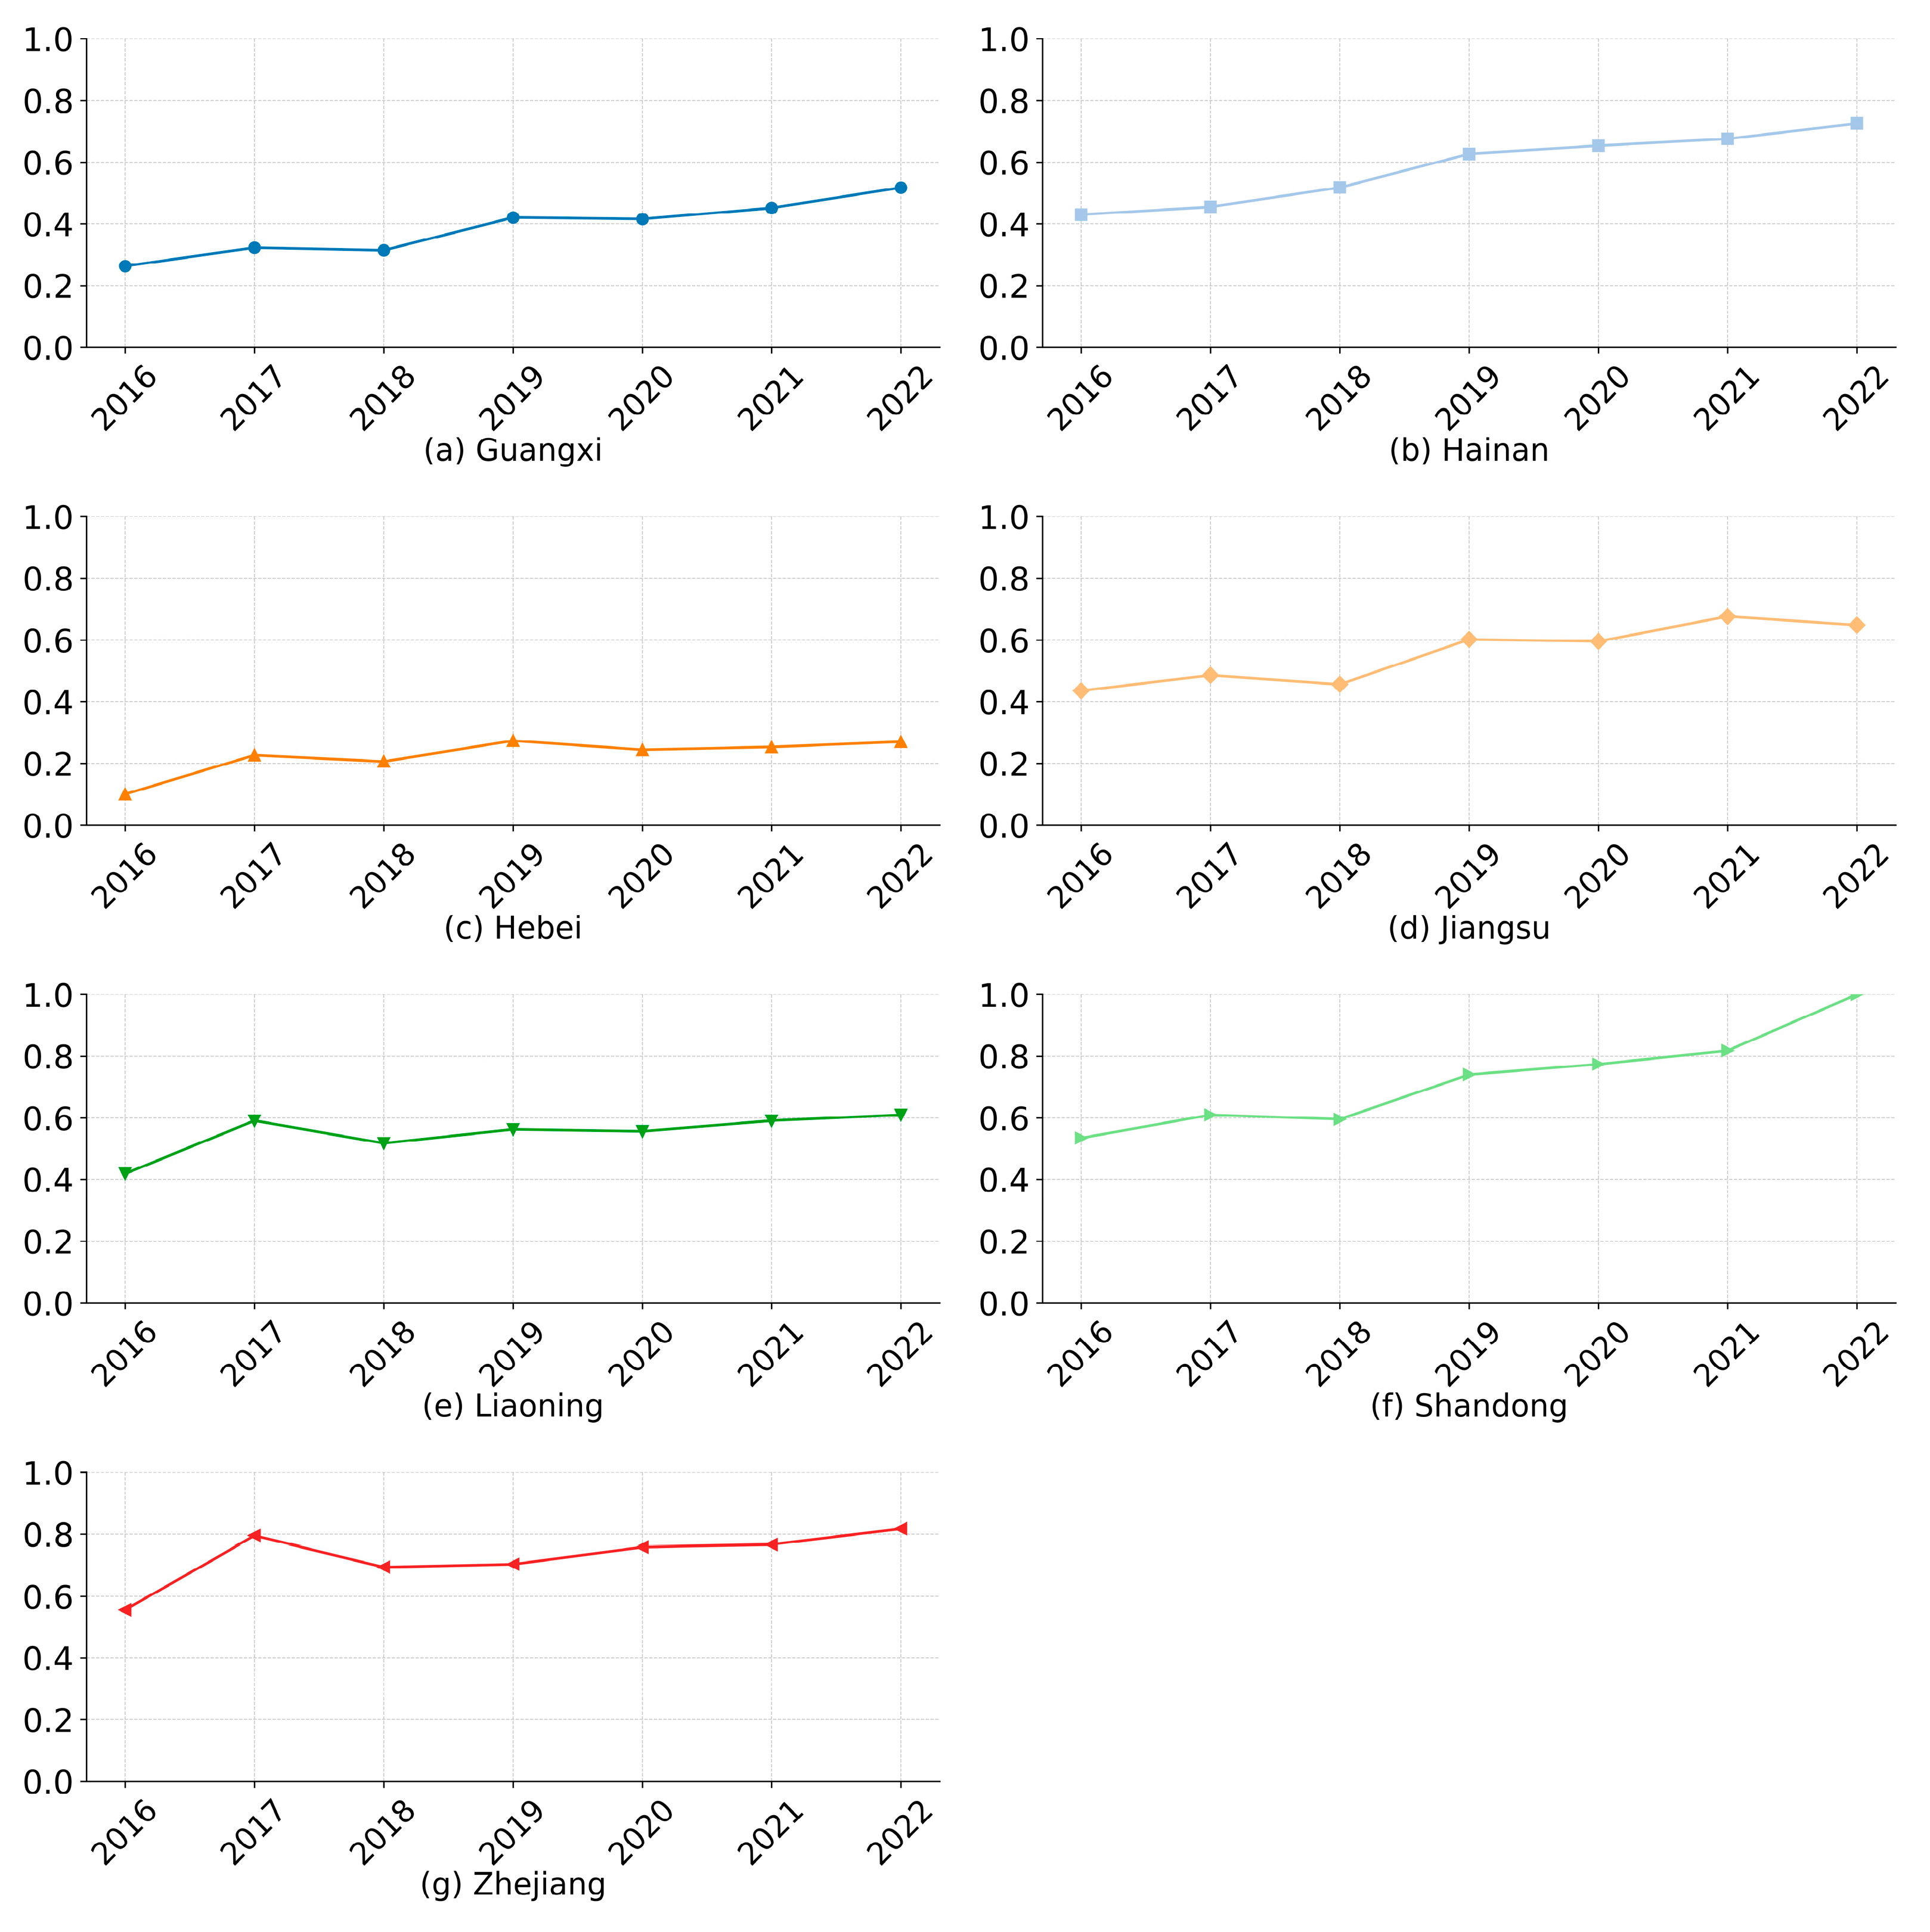
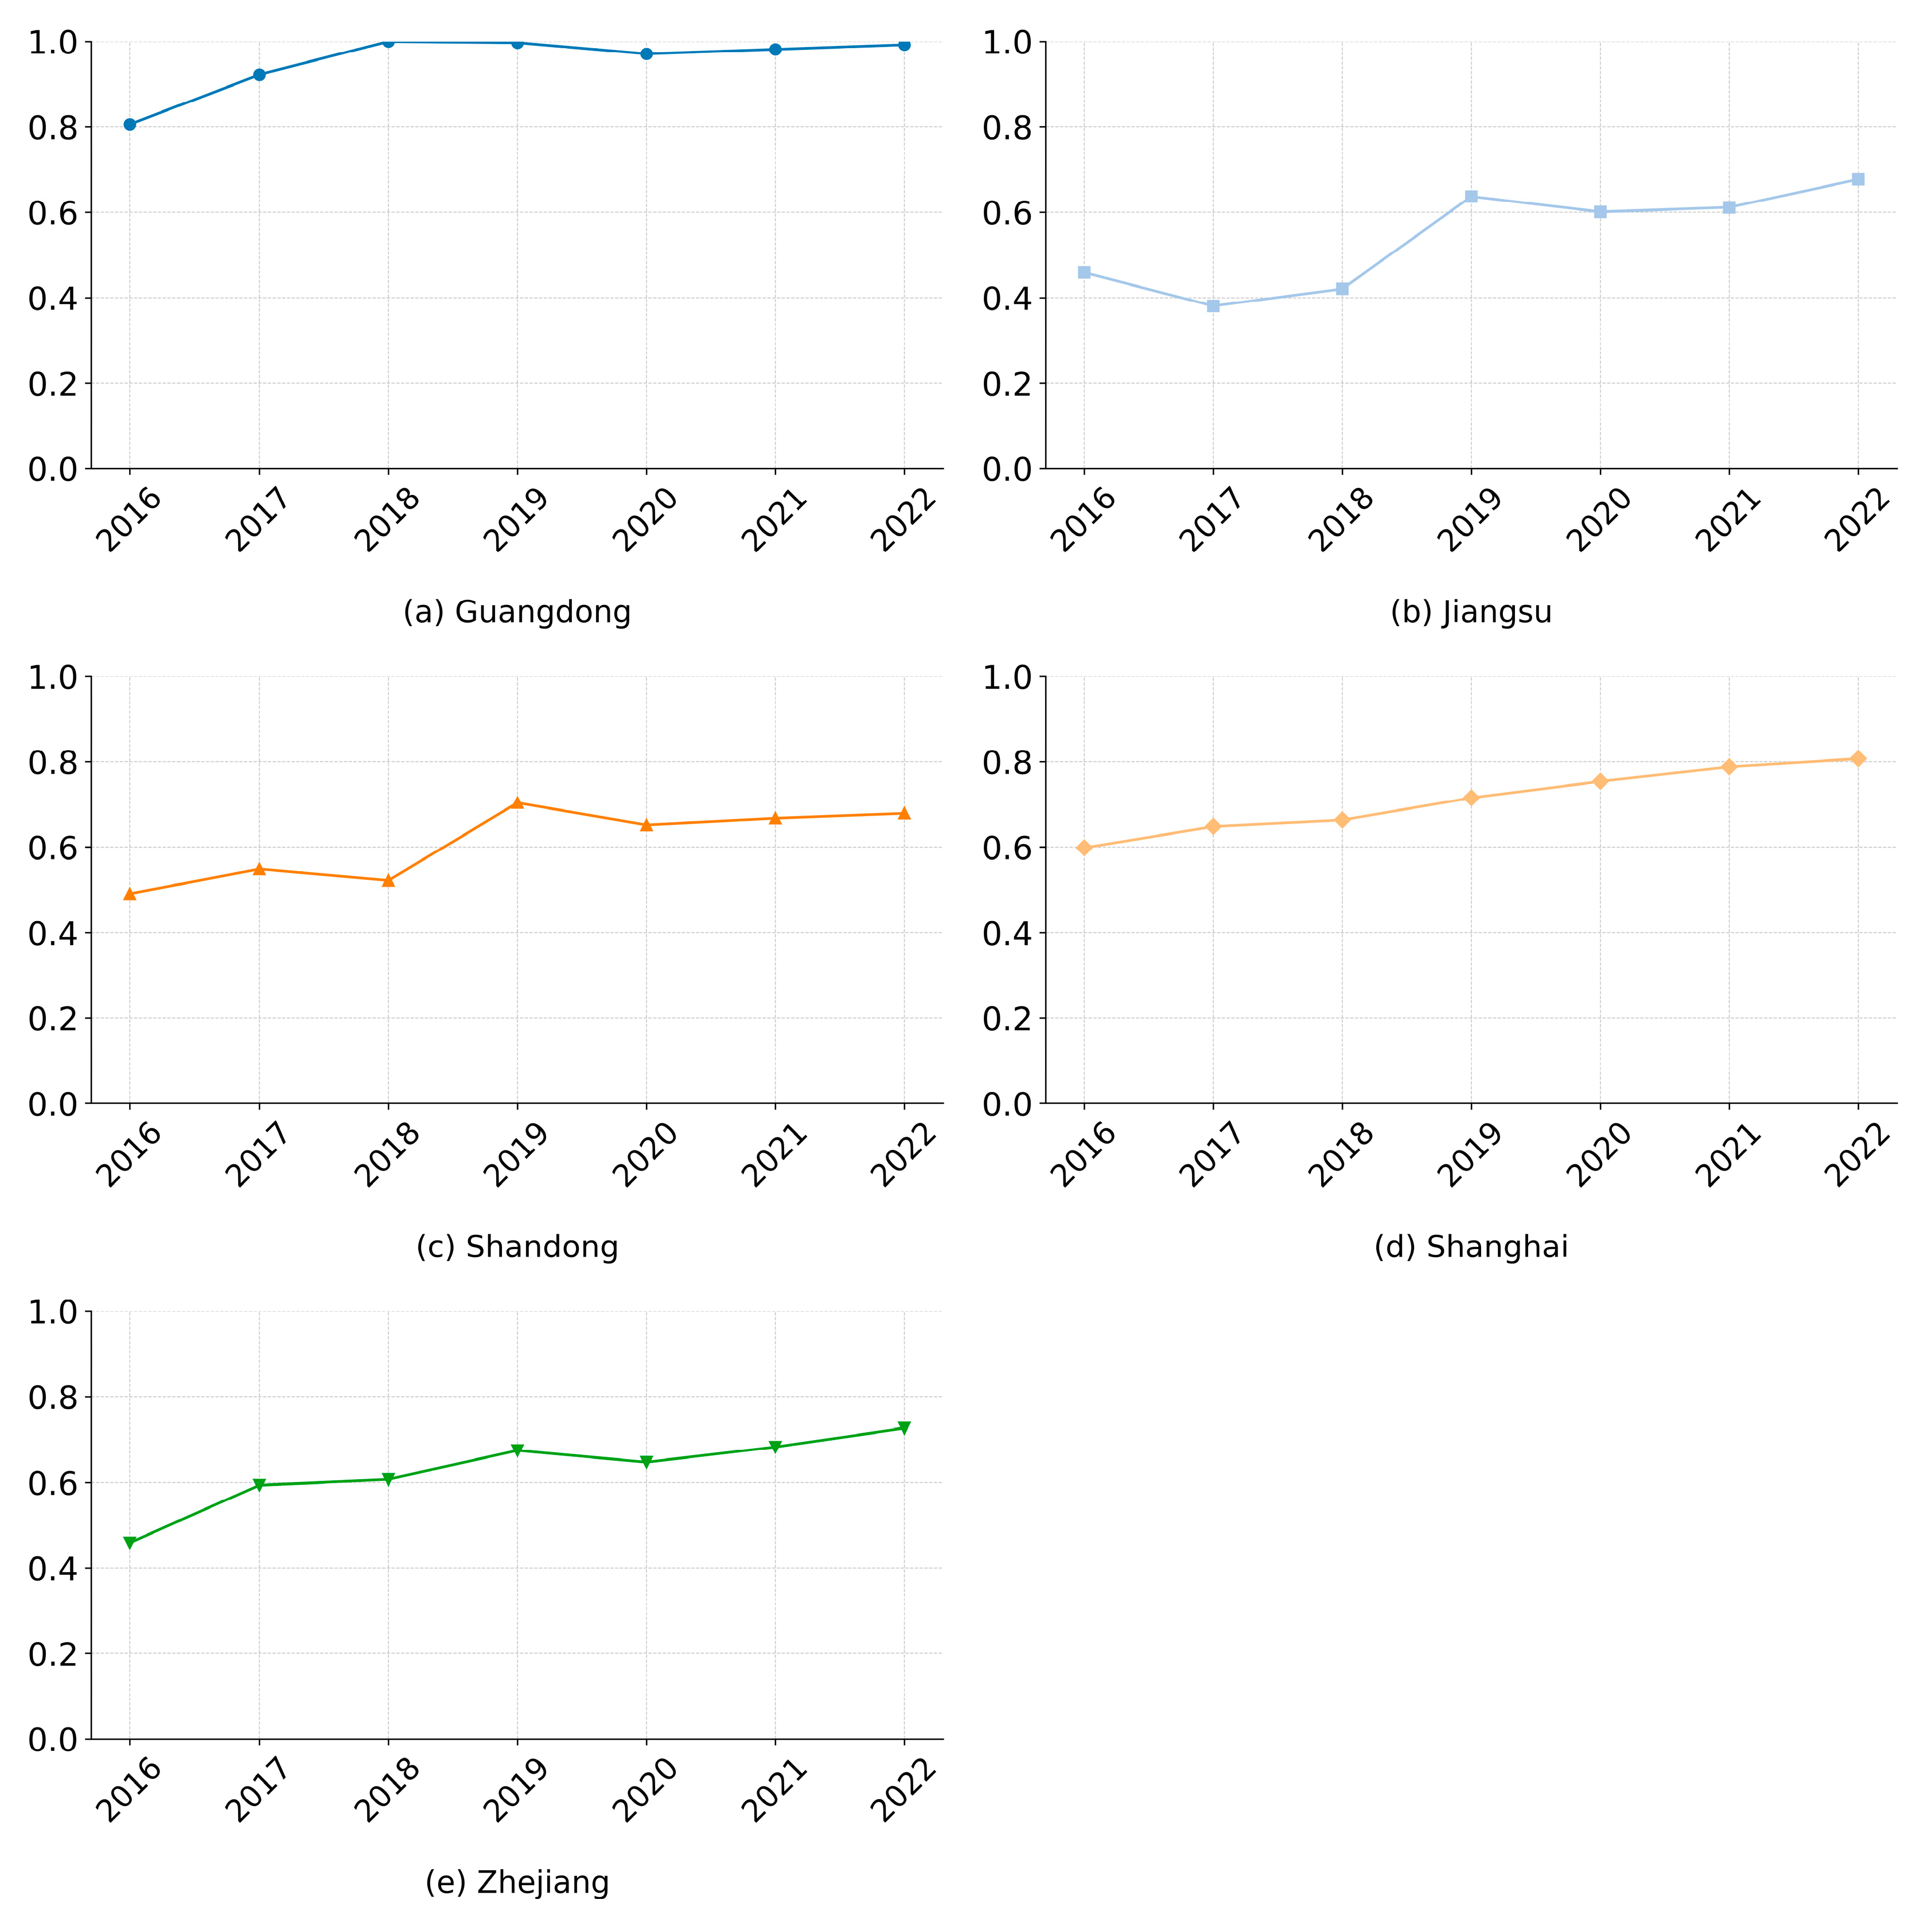
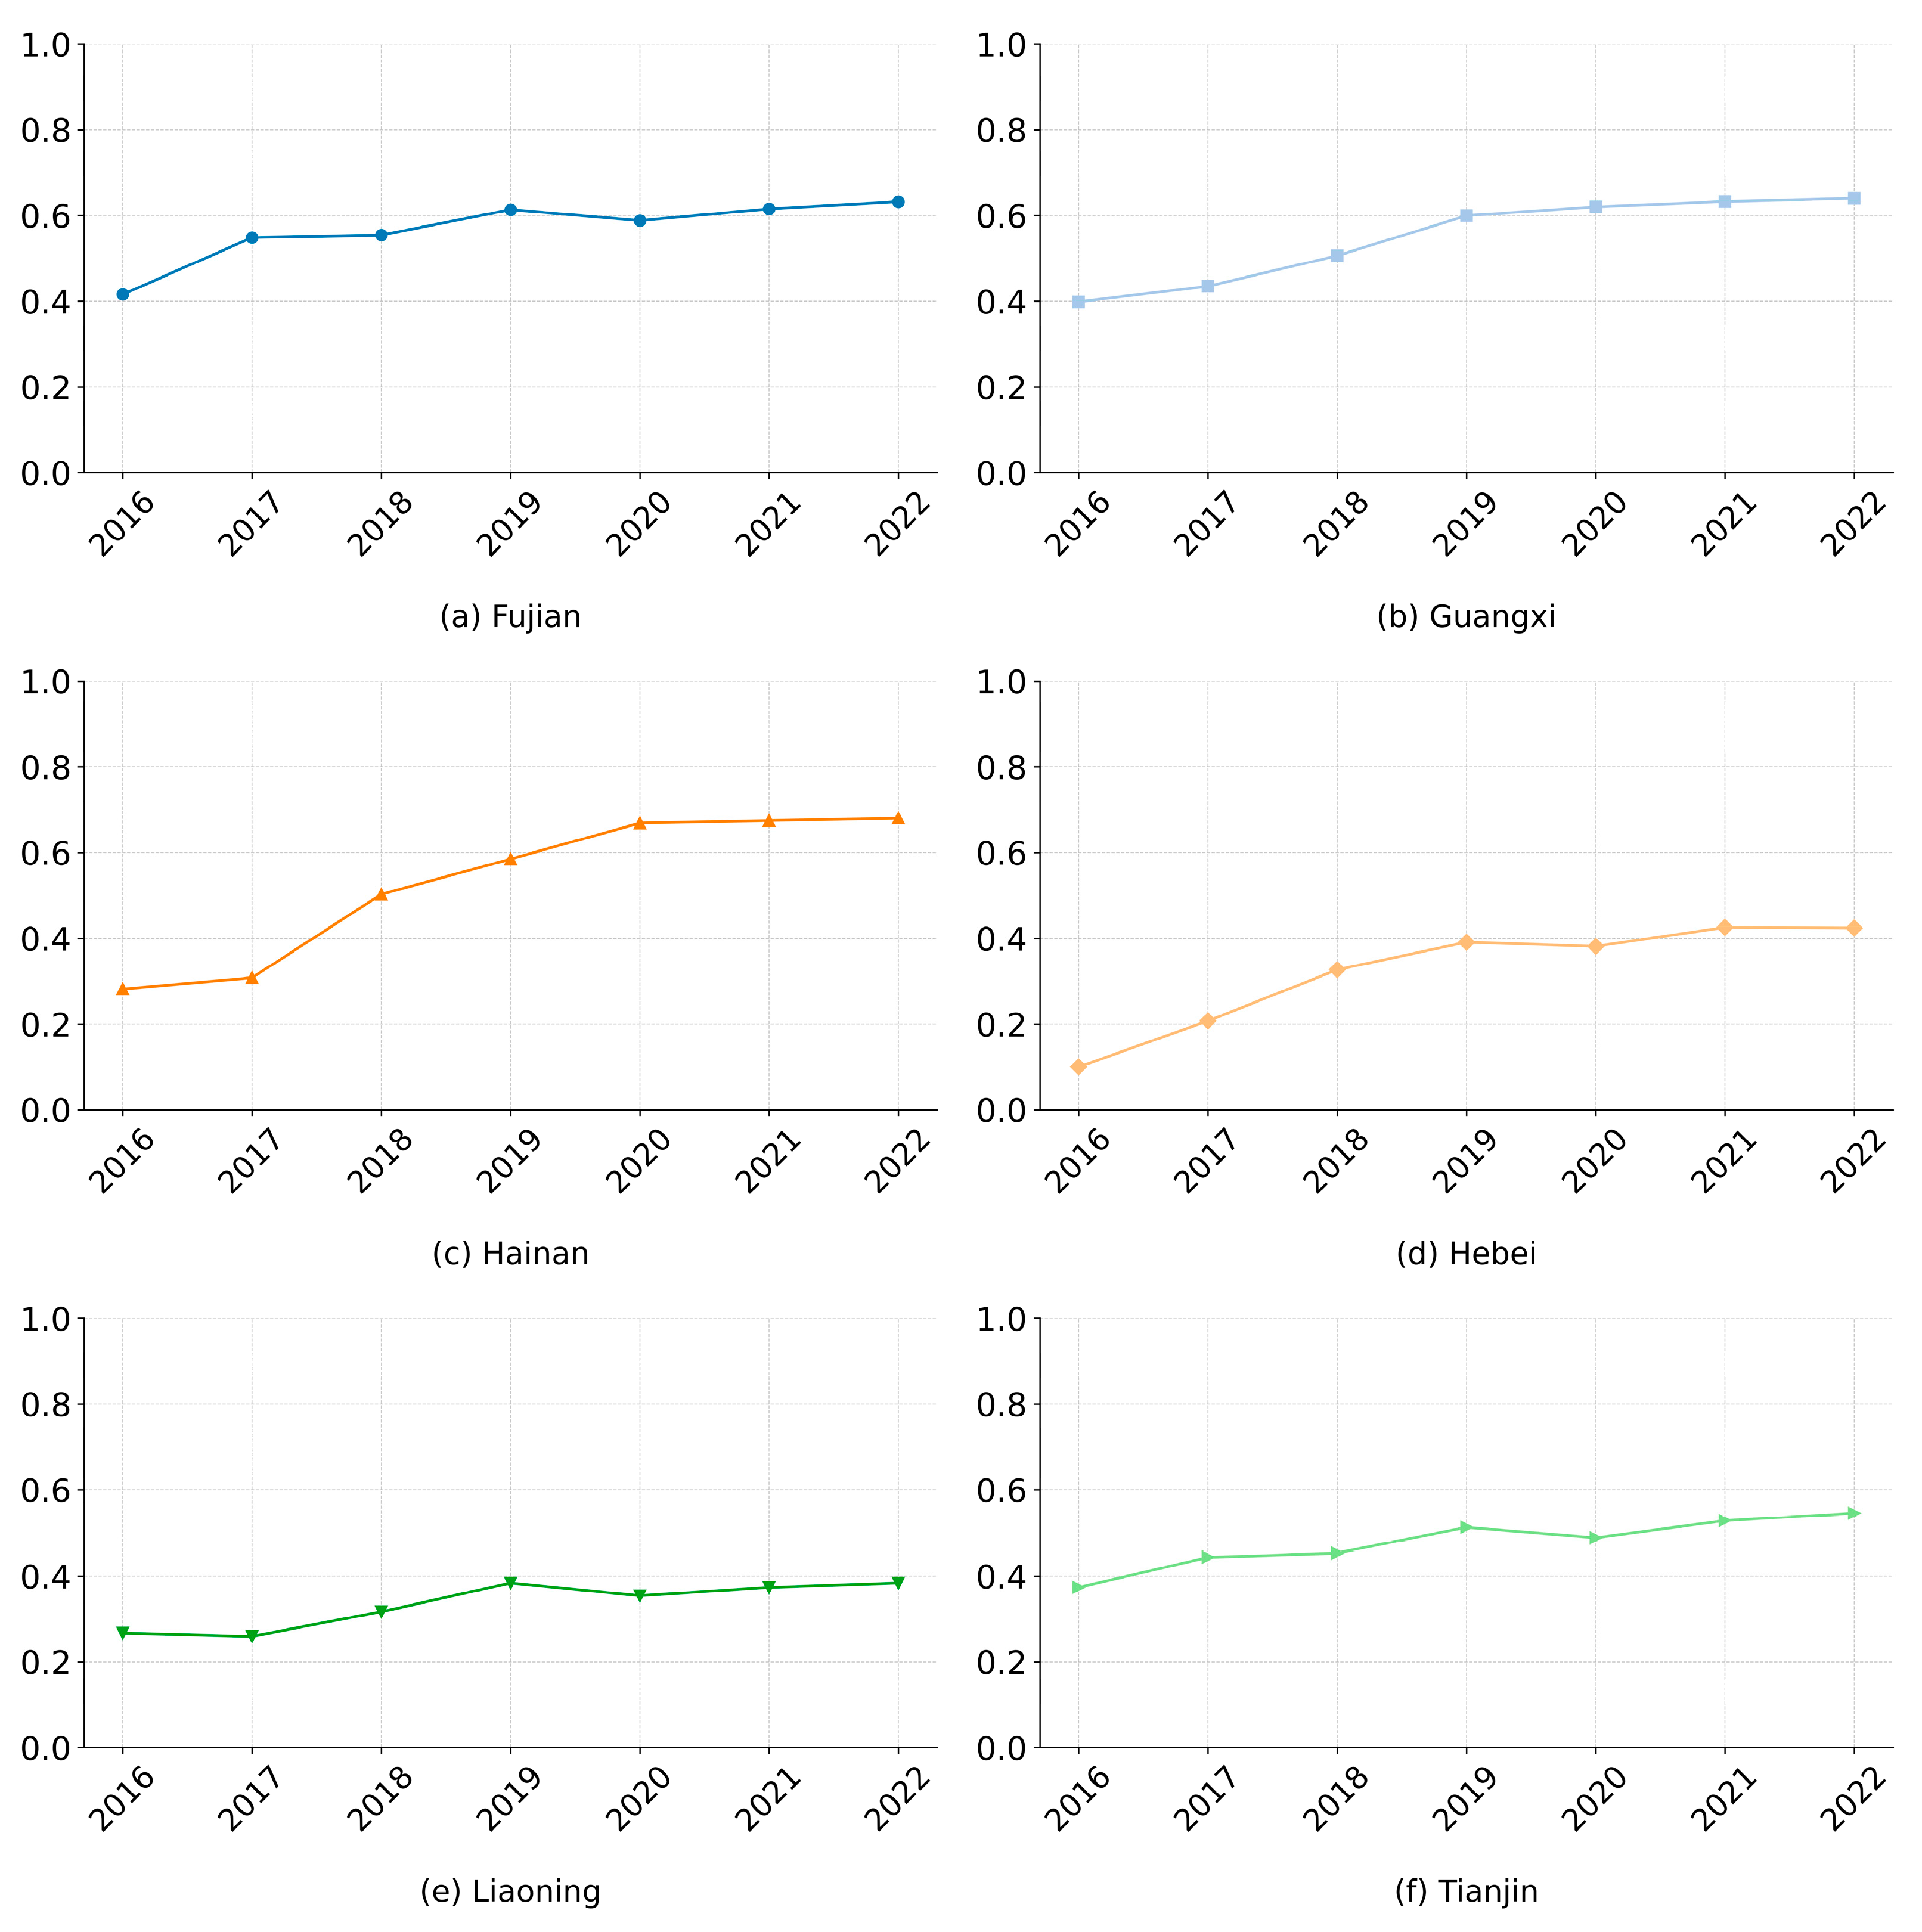
4.1. Port Competitiveness Evaluation
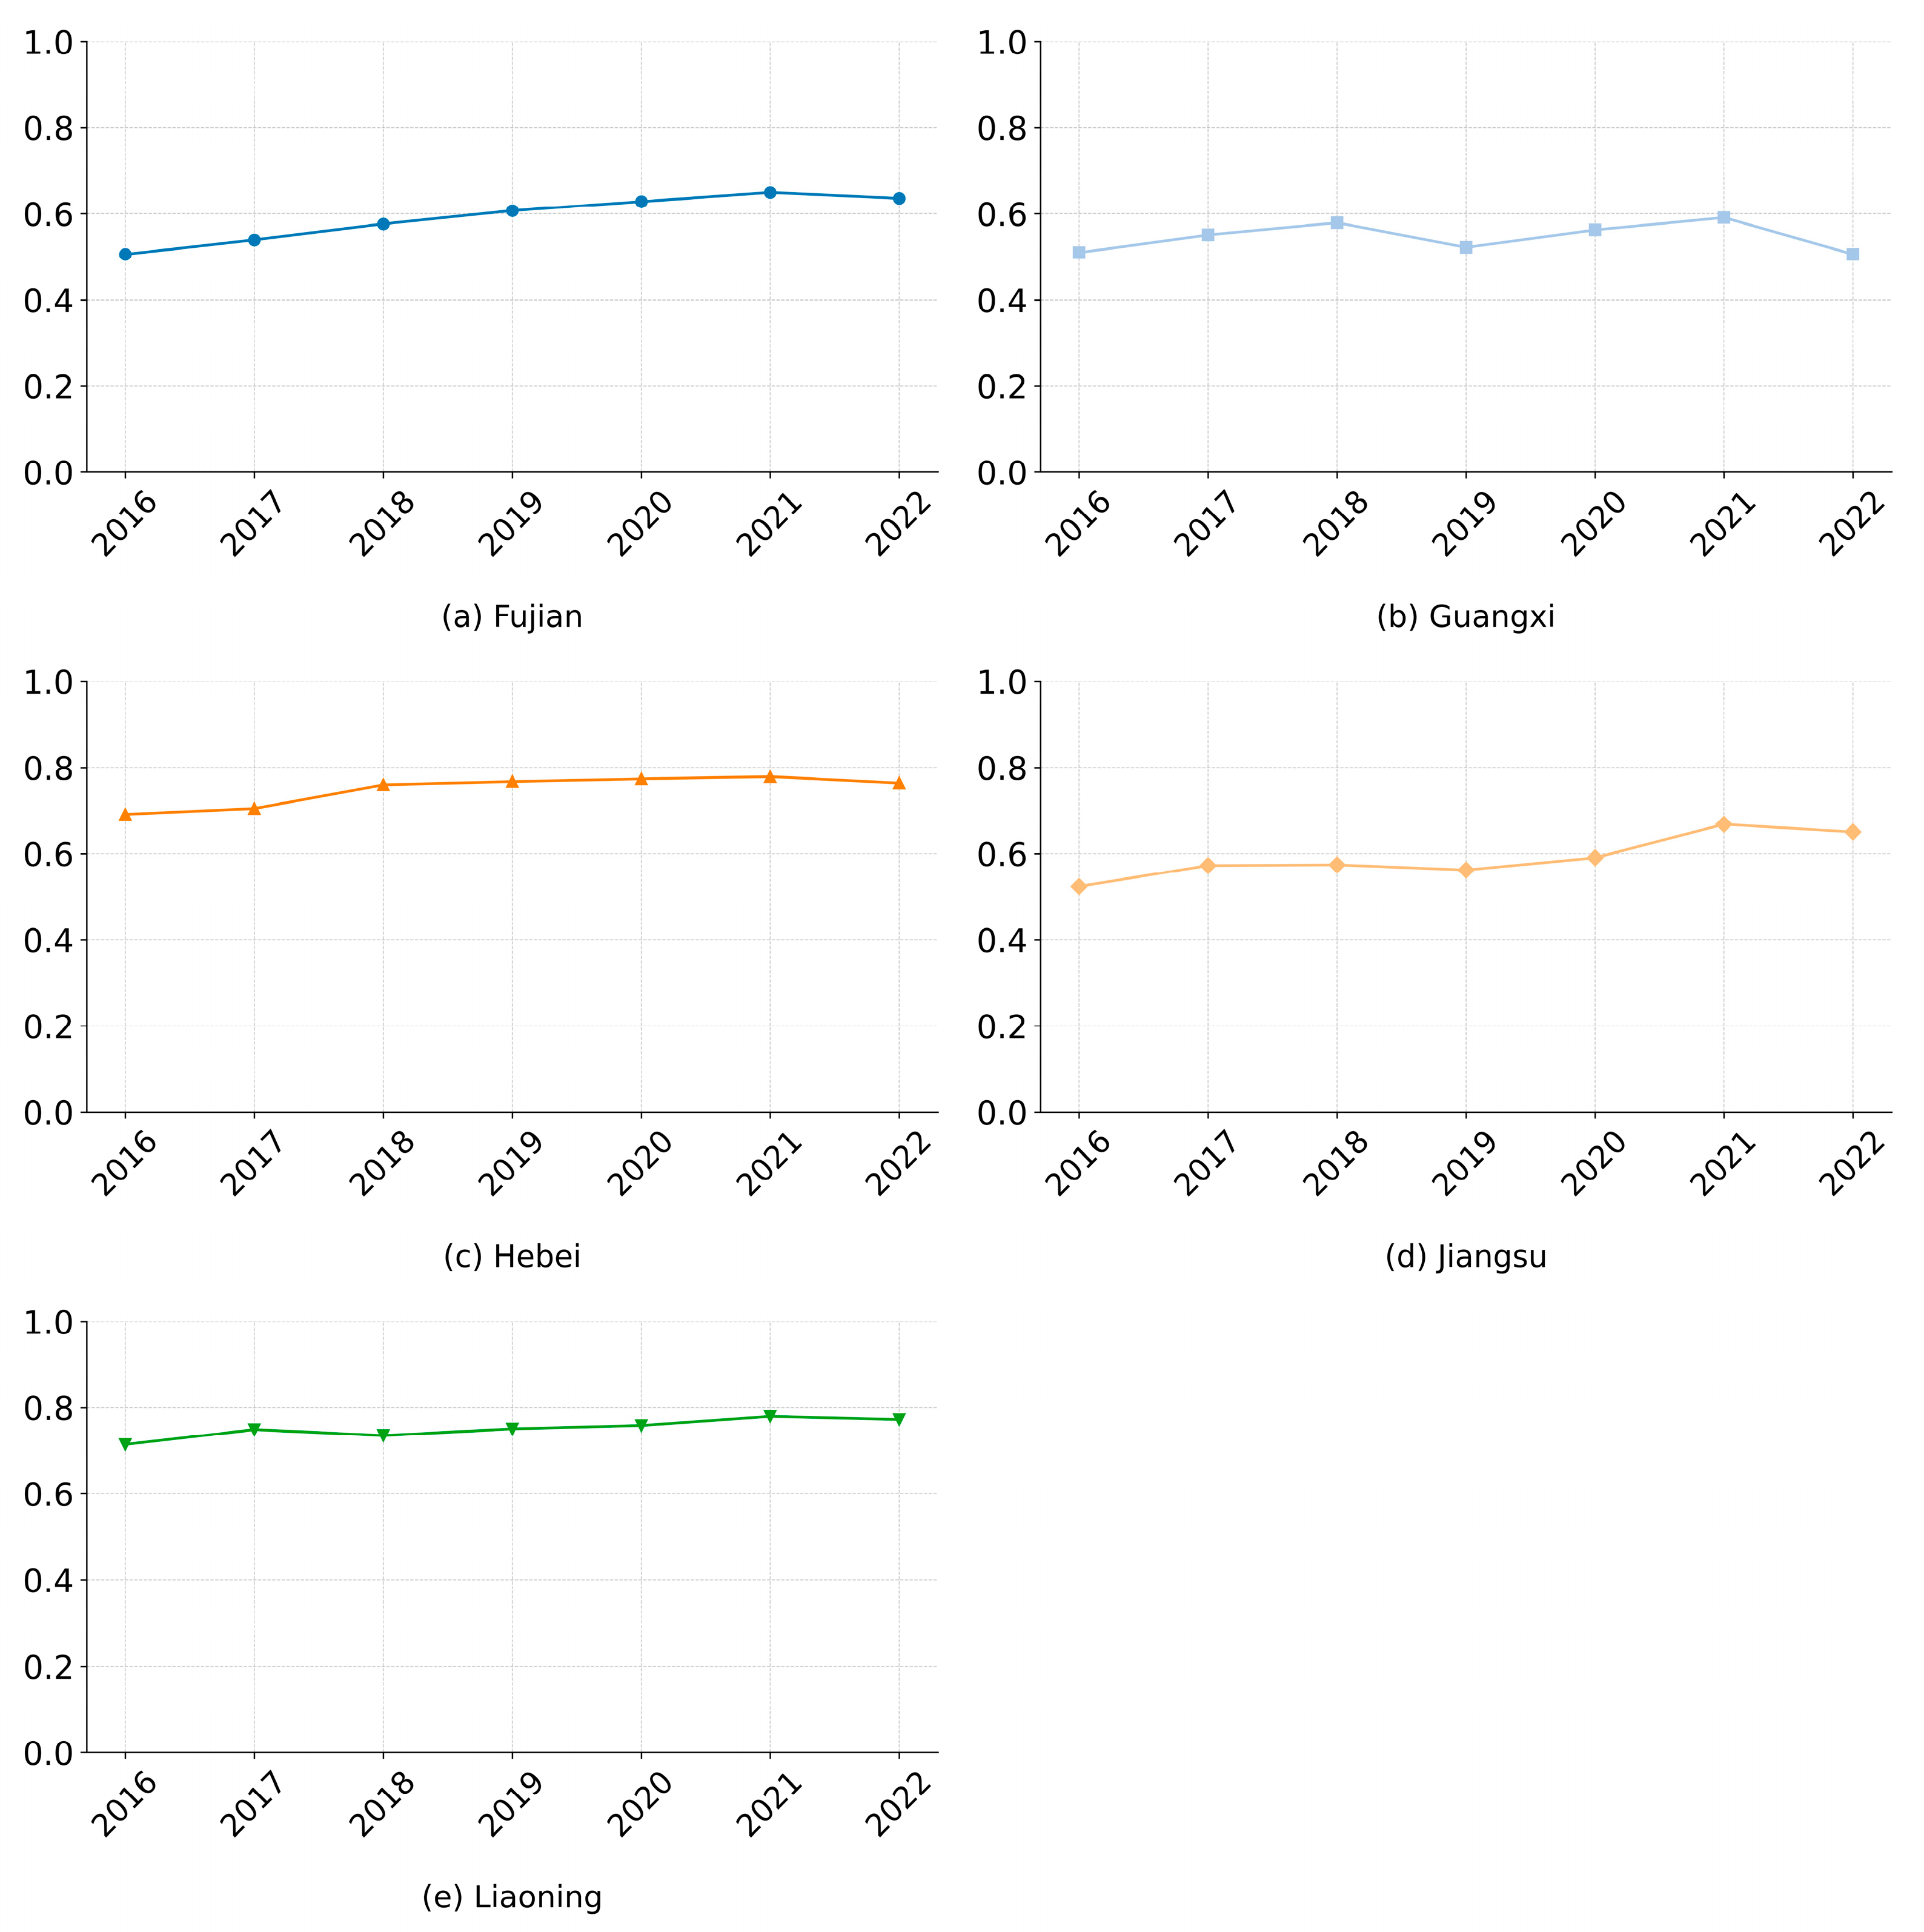
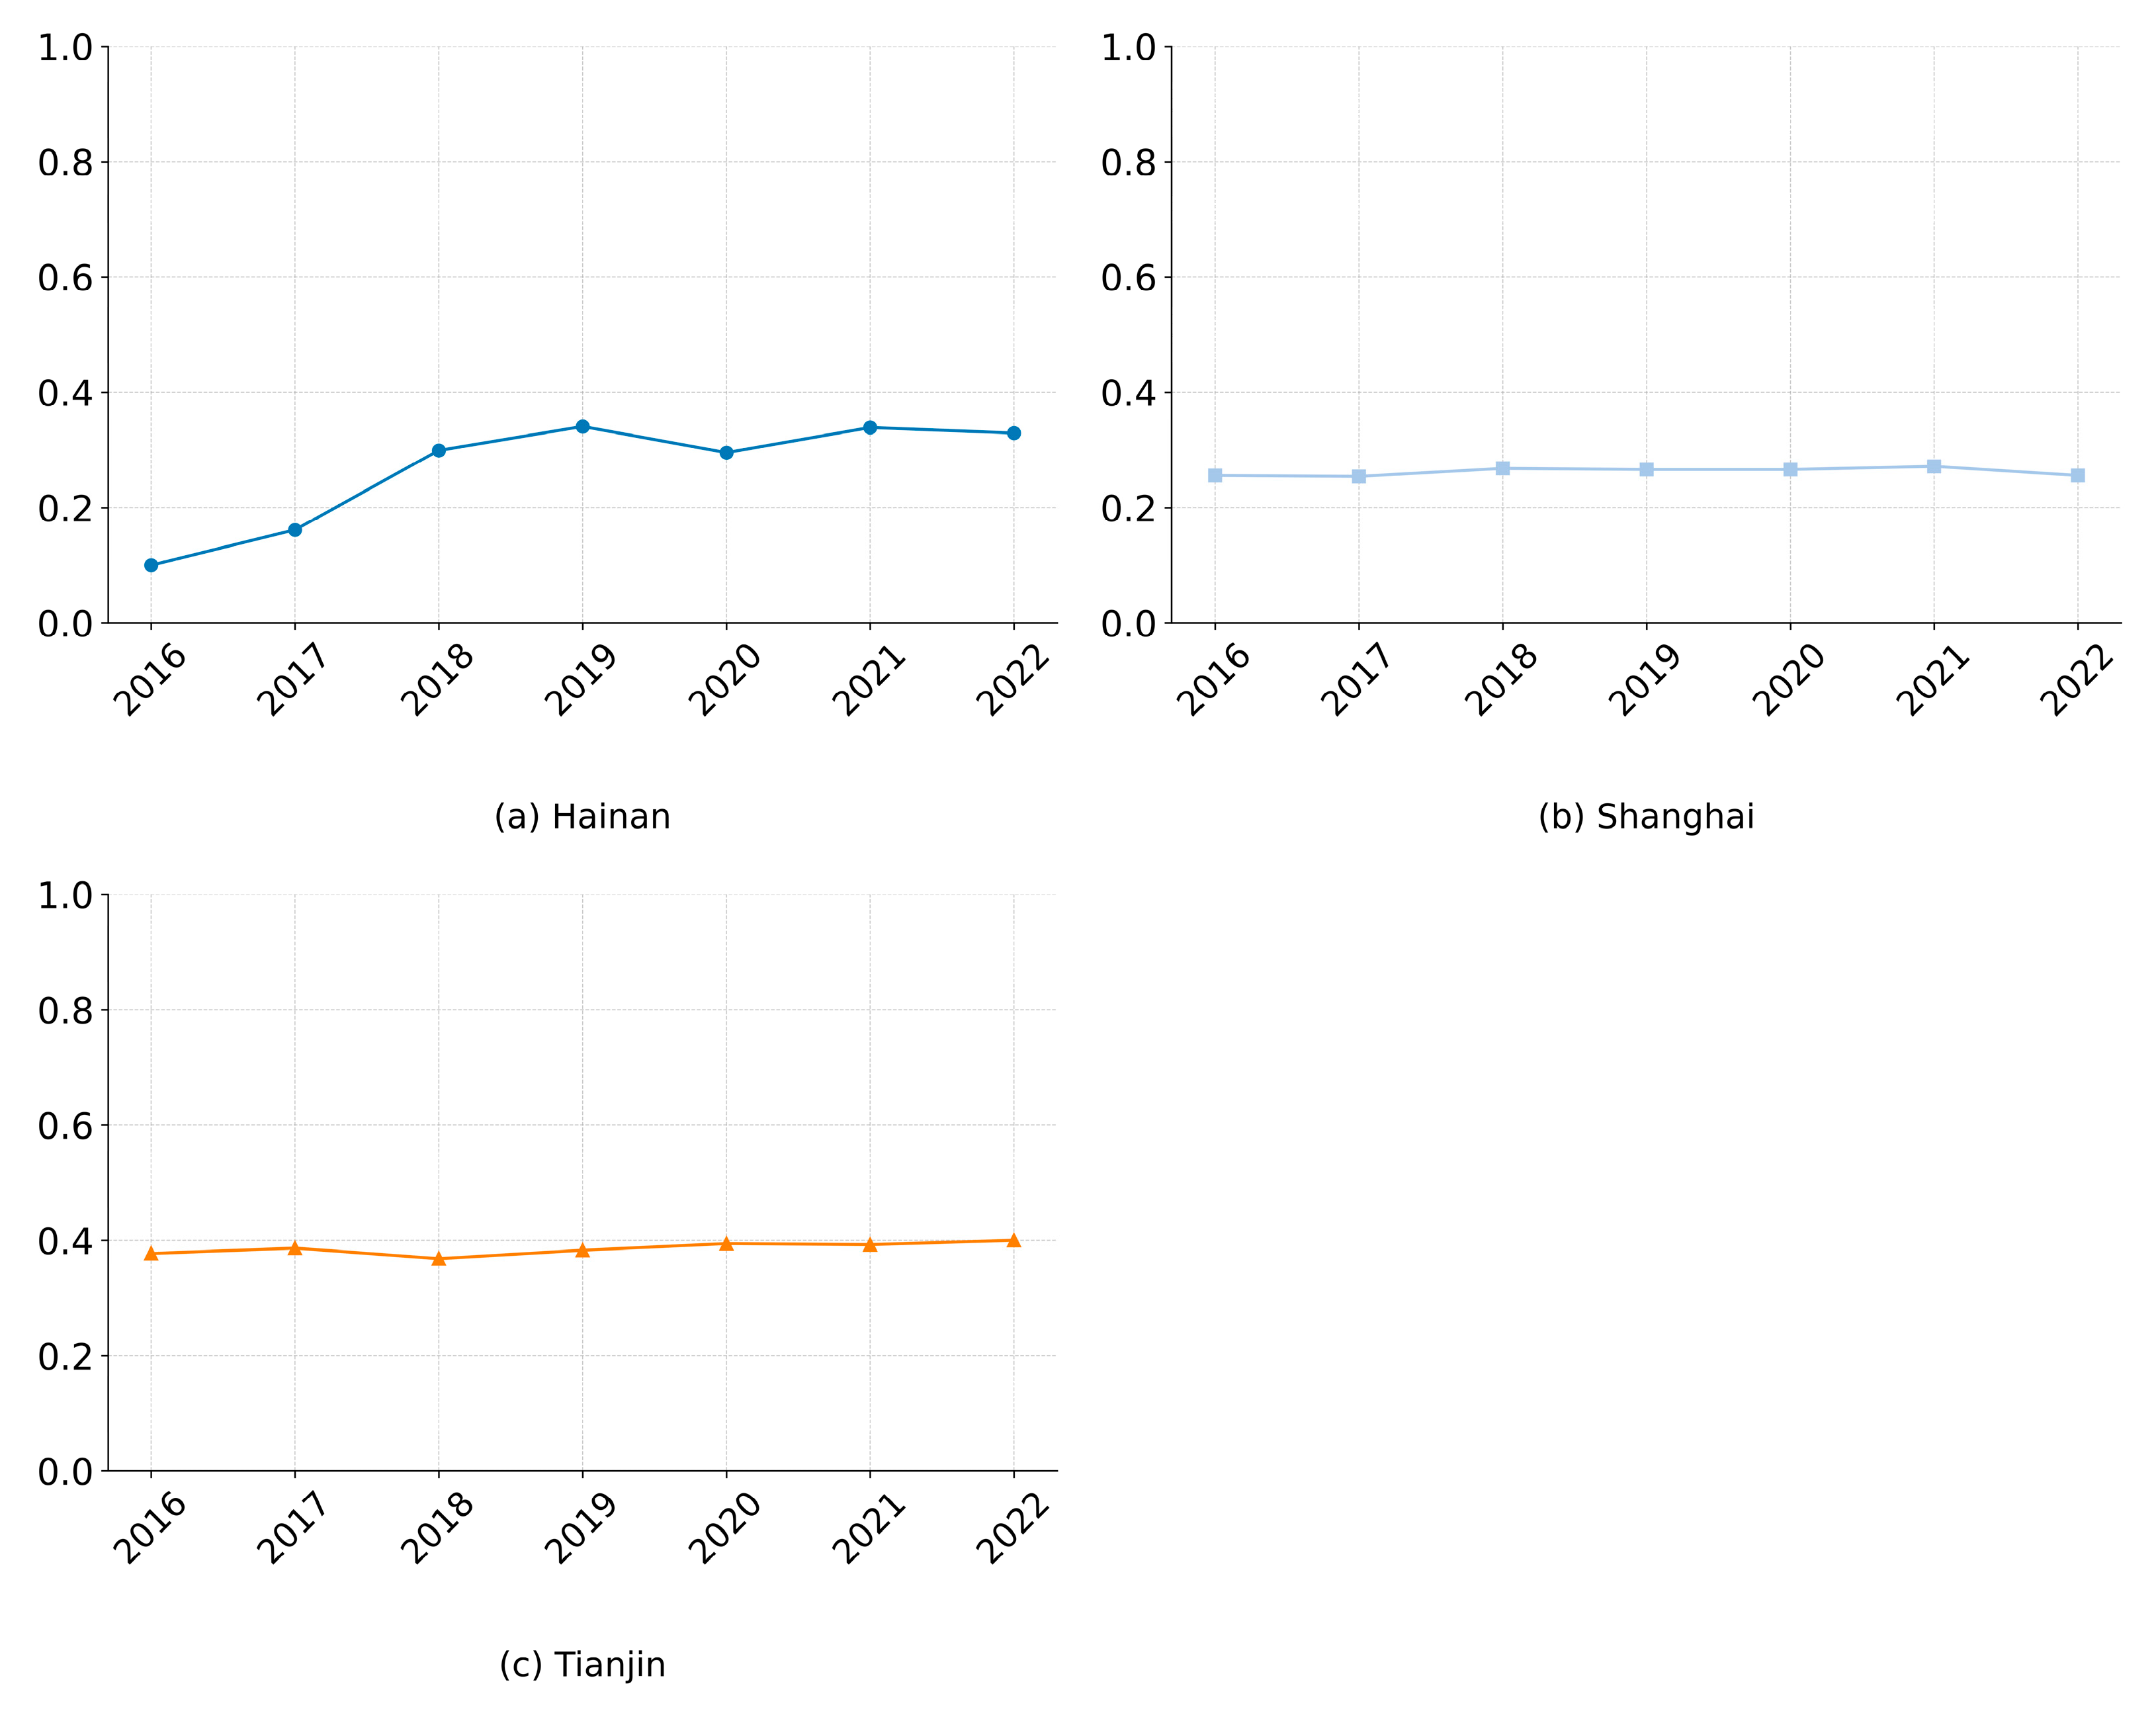
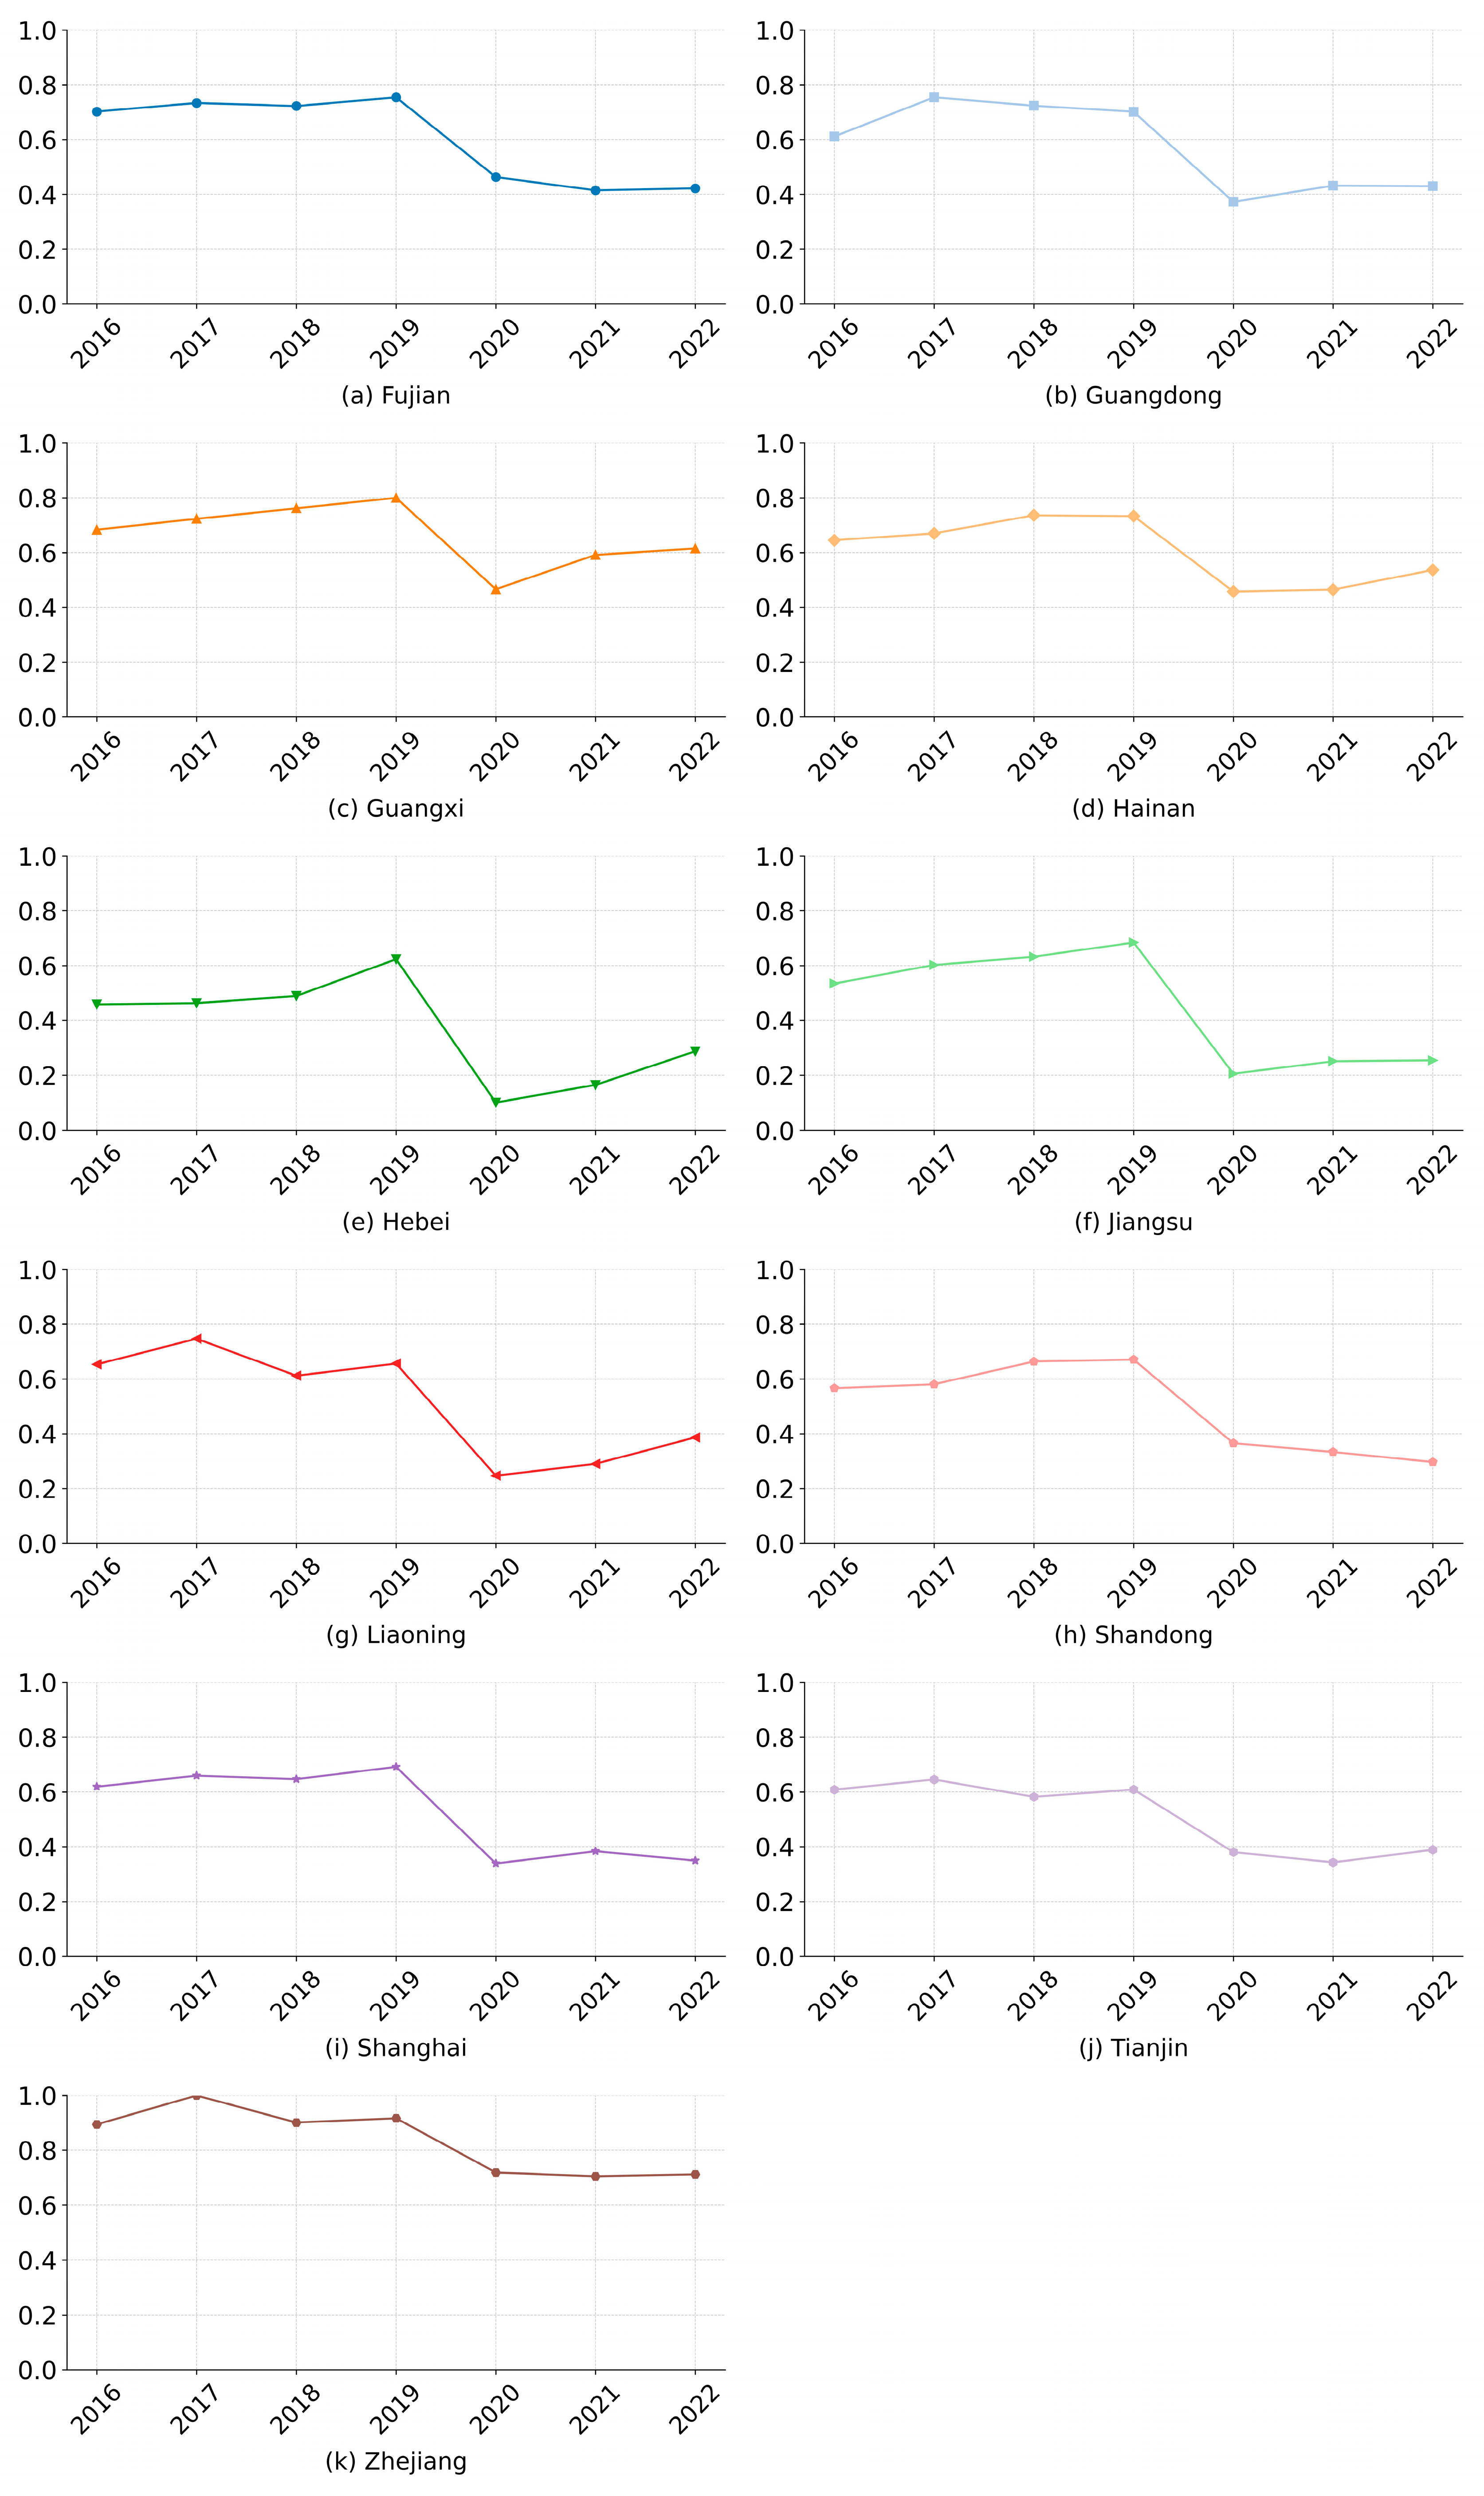
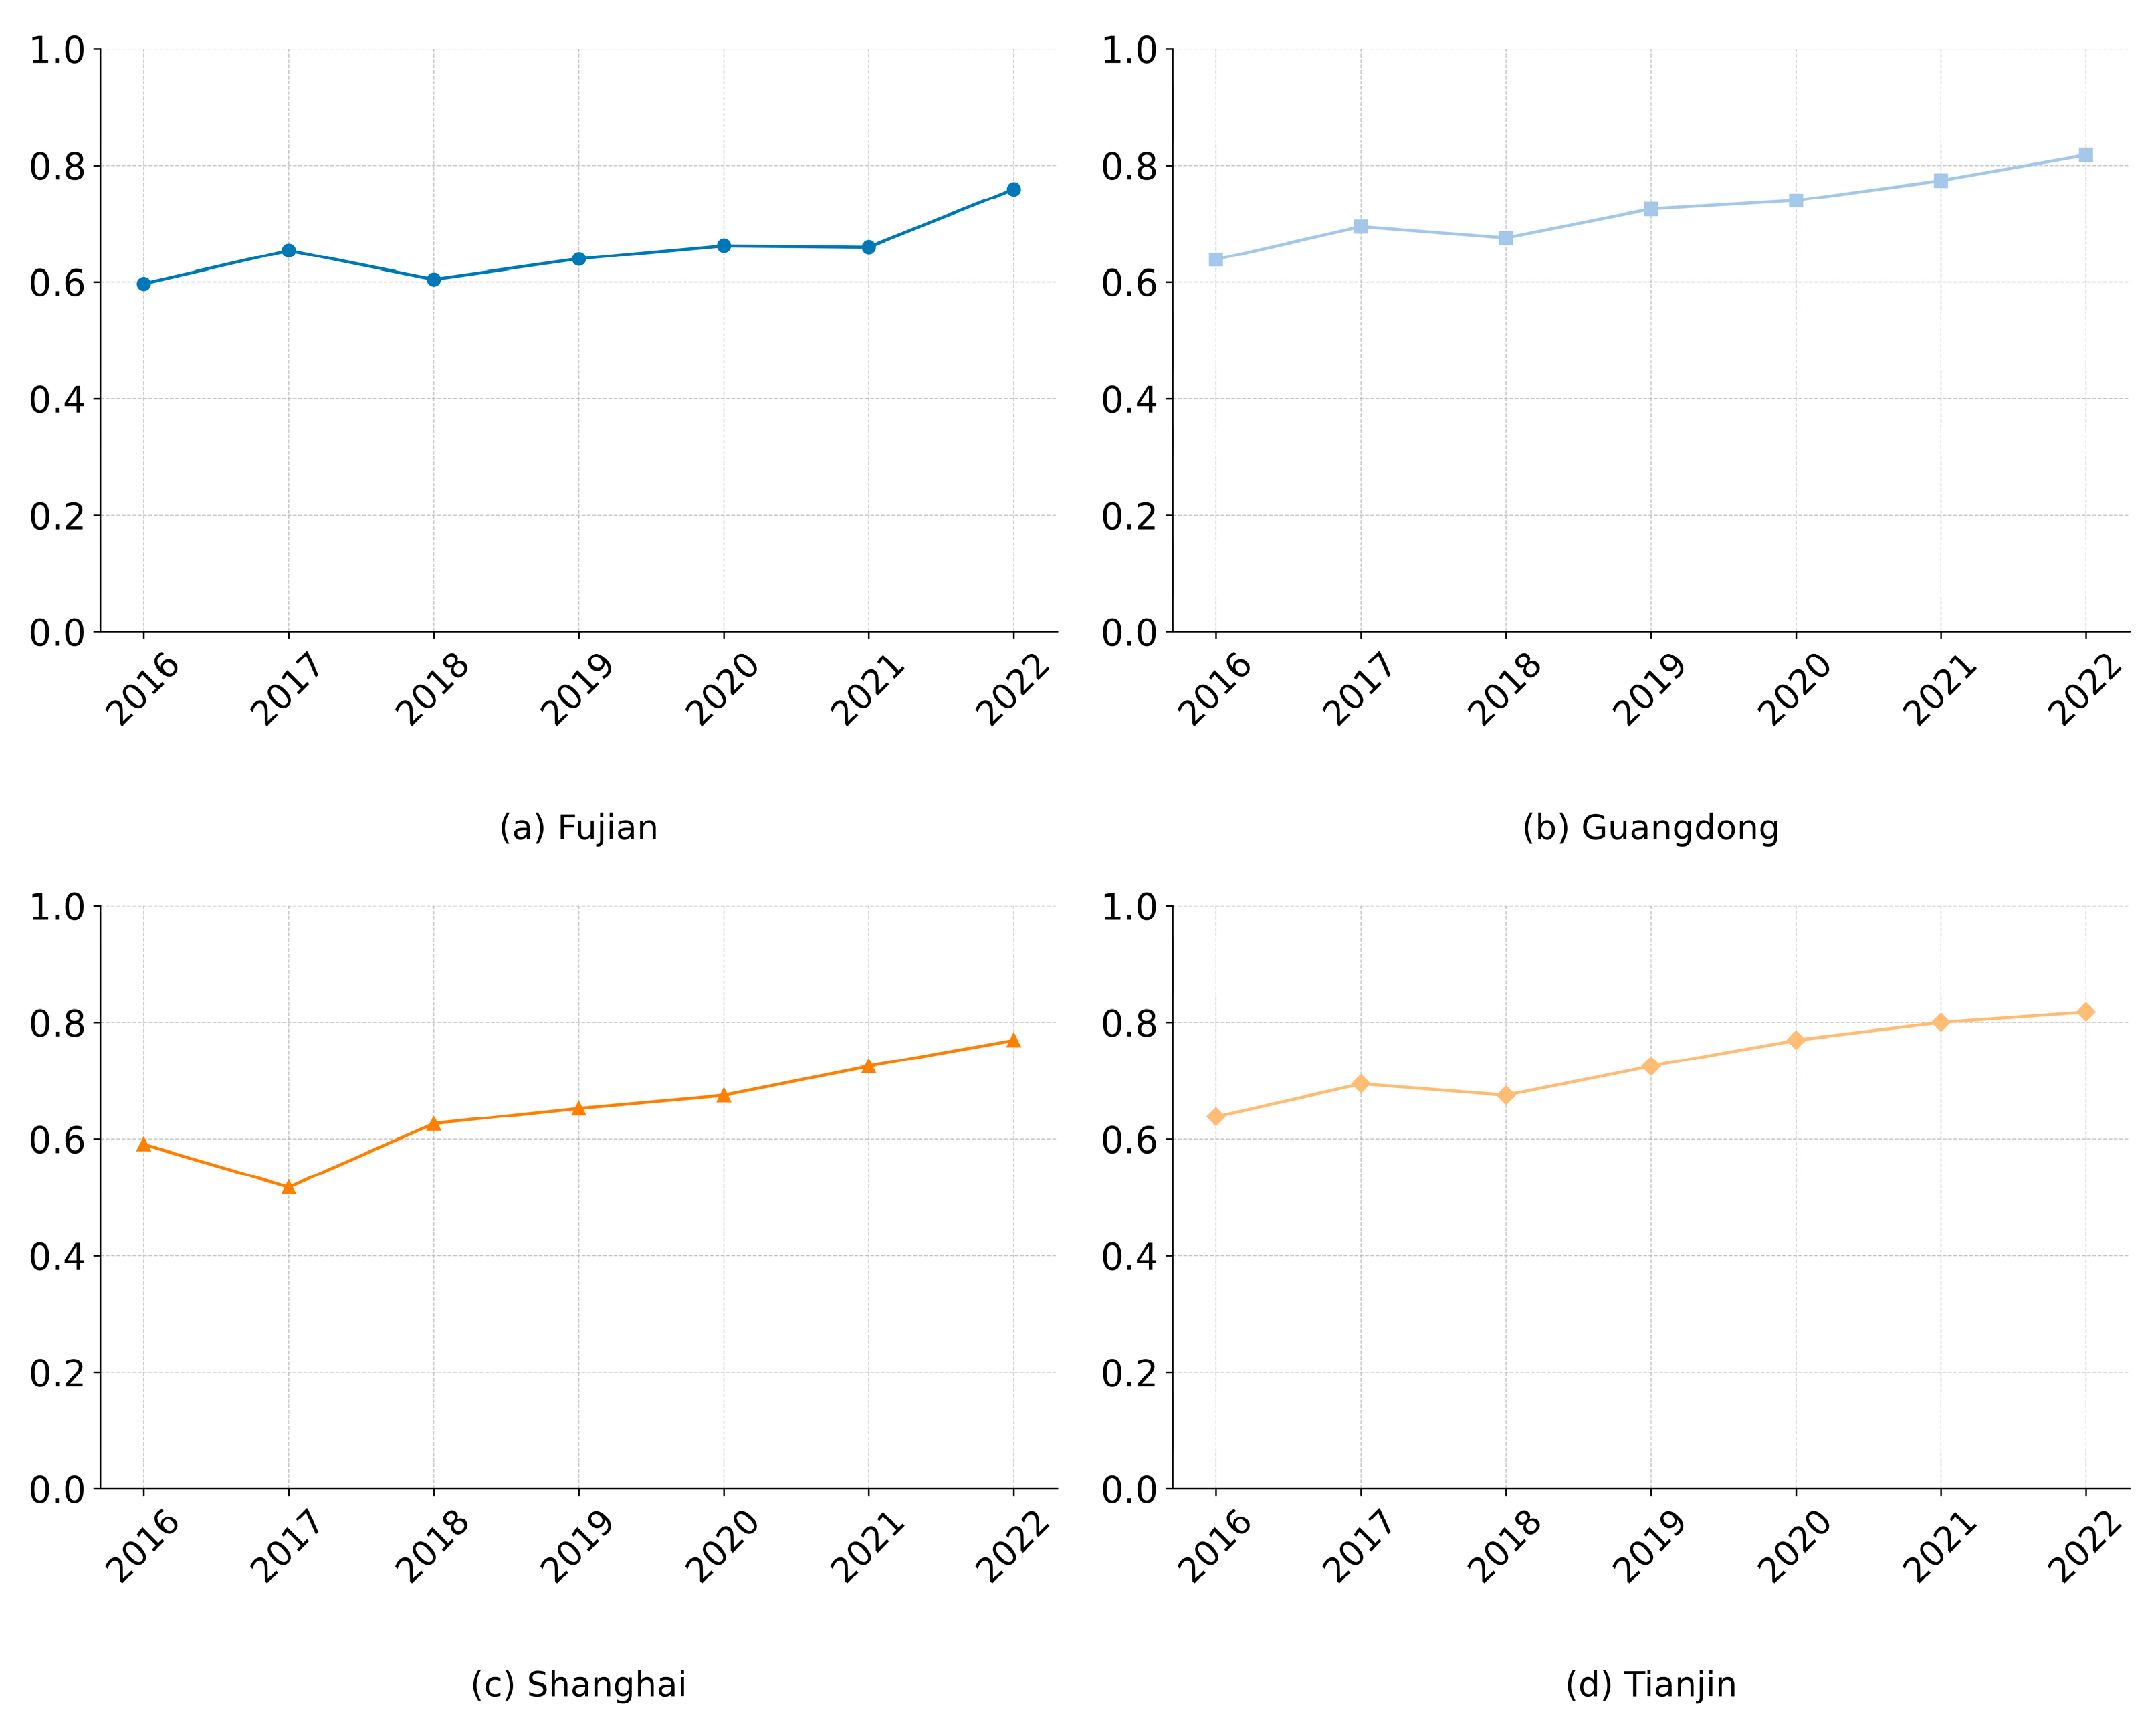
The correlations between different port competitiveness evaluation indicators include very strong (correlation > 0.75), moderate (correlation between 0.3 and 0.75), and weak (correlation less than 0.3) correlations, as shown in Figure 4. Specifically, 10,000-ton berths have a strong correlation with liquid bulk cargo throughput, and logistics performance is strongly correlated with container throughput and ease of doing business. Conversely, the 10,000-ton berths, container throughput, liquid bulk cargo throughput, GDP, and dependence on foreign trade are weakly correlated with digital management by the government, ship management services, ship repair services, and maritime arbitration services. Moreover, digital management by the government, ship management services, ship repair services, maritime arbitration services, and ease of doing business had weak correlations.
Based on the correlation analysis, the KMO (0.635 > 0.6) and Bartlett tests (p-value < 0.05) indicated that the standardized evaluation indexes of port facilities and operations, shipping services, economic environment, and social governance satisfied the requirements of PCA. Each principal component was calculated sequentially and sorted from largest to smallest based on the information contribution rate, as shown in Figure 5. The cumulative contribution of the first five principal components reached 81.57%, which implies that the first five principal components reflect most of the information for the 16 evaluation indicators and provide sufficient explanation for the results.
Table 2 presents a score coefficient matrix of the principal components to elucidate the primary determinants of port competitiveness. The first principal component primarily reflects the Comprehensive Port Service Capacity (CPSC) and exhibits substantial high correlations with container throughput, government transparency, ease of doing business, logistics performance, ship premium income, foreign trade dependency, and maritime arbitration services. The second principal component is characterized by variables, including the 10,000-ton berths, dry bulk cargo throughput, liquid bulk cargo throughput, ease of doing business index, ship engineering and repair services, and GDP. It can capture the influence of both the level of port infrastructure and the surrounding economic environment, particularly bulk cargo handling capacity, ship service support, and regional economic development; hence, it is referred to as port infrastructure and the economic environment (PIEE). The third principal component exhibits a significant relationship with the government’s digital management and shipping brokerage services. Digital management is a crucial tool for improving the operational efficiency and transparency of ports, whereas shipping brokerage services reflect the professional service capacity of ports within the global shipping network. Consequently, this component is called digital management and professional service capabilities (DMPS). The fourth principal component demonstrates elevated relationships with variables such as FTZ size, shipping brokerage services, and ship engineering and repair services, indicating that it primarily reflects the comprehensive port service capacity impact of policy support (e.g., FTZ) and technical service capacity (e.g., ship engineering and repair services). A low tariff rate serves to reduce import and export costs, whereas efficient, professional technical support is essential for attracting demand for ship services, thus named policy and professional technical support capability (PPTS). The fifth principal component exhibited higher coefficients for FTZ size and ship management services, suggesting that it primarily represents port management efficiency capability (MEC).
Using the entropy weighting method, the weights of the five principal components were w1 = 0.3158, w2 = 0.1886, w3 = 0.1271, w4 = 0.1402, and w5 = 0.2283. The port competitiveness of the coastal provinces was determined as shown in Figure 6. Guangdong, Zhejiang, Jiangsu, and Shandong exhibited a marked and consistent upward trend in port competitiveness between 2016 and 2022. Their shared characteristics include favorable geographical locations, well-developed port infrastructure, and robust regional economic support. Stable port competitiveness underscores the central role of ports in national maritime shipping. Guangdong ranked first, driven by its superior competitiveness in terms of logistics efficiency, policy environment, and infrastructure. Zhejiang is primarily correlated with the sustained expansion of the Ningbo-Zhoushan Port and continuous improvements in port service capacity. Jiangsu demonstrated a robust upward trend, indicating the rapid expansion of cargo throughput and service capacity. The growth of Shandong was largely driven by breakthroughs in internationalization and cargo throughput at the Qingdao and Yantai Ports.
In Figure 7, Fujian, Shanghai, Tianjin, Liaoning, and Guangxi have stable development characterized by relatively small fluctuations in port competitiveness. The modest fluctuations observed for Fujian reflect its stable performance in terms of service capabilities and infrastructure. The stability observed in Shanghai can be attributed to its prominent role as a global shipping hub and well-established port management strategy. Tianjin experienced a slight decline in its national maritime shipping industry. Liaoning’s competitiveness score fluctuates between 0.0102–0.0103, reflecting stagnant port development. Guangxi’s competitiveness exhibited substantial fluctuations between 2016 and 2018 before stabilizing, illustrating that growth potential is closely related to broader economic and policy support.
In Figure 8, Hebei’s port competitiveness score has grown slowly, with limited overall improvement, and it is in a relatively backward position in China’s maritime industry. Hainan demonstrated substantial growth in its port competitiveness score since 2017, with the increase nearly doubling. This significant improvement can be primarily attributed to Hainan’s FTZ policy, which encompasses policy support, infrastructure development, and increased openness to external markets.
The annual distribution patterns depicted in Figure 6, Figure 7 and Figure 8 indicate a growing divergence in port competitiveness across provinces, with particularly marked differentiation between the southeastern (e.g., Guangdong and Zhejiang) and northern (e.g., Liaoning and Hebei) coastal regions. Hebei and Liaoning exhibited lower overall scores, reflecting their relative disadvantages in terms of port infrastructure and service quality. The core growth areas were concentrated in Guangdong, Zhejiang, Jiangsu, and Shandong. The stable development areas included Shanghai and Fujian. Policy-driven effects are particularly pronounced in Hainan, where rapid progress is highlighted in port competitiveness. In contrast, development-constrained regions, such as Hebei and Liaoning, are increasingly marginalized in the maritime industry, necessitating the implementation of targeted policies and enhanced technology.

4.1.1. CPSC

The CPSC of ports in China’s coastal provinces from 2016 to 2022 is shown in Figure 9. Shanghai, Guangdong, Zhejiang, and Shandong had coefficients of 0.78, 0.64, 0.59, and 0.50, respectively, indicating a high position in China’s maritime industry. Shanghai, recognized as an international shipping center, has consistently maintained its leading position in terms of comprehensive maritime service capability. Shanghai’s advantages in terms of government transparency, container throughput, and maritime arbitration services are particularly noteworthy. The CPSC of Guangdong can primarily be attributed to its continuous improvements in container throughput, logistics performance, and optimization of the policy environment, with the ports of Shenzhen and Guangzhou playing important roles as international hub ports. Zhejiang Province will experience significant growth between 2016 and 2022. The Ningbo-Zhoushan Port is a global leader in cargo throughput. Sustained improvements in the CPSC of Shandong Province are underpinned by the ongoing strengthening of international shipping networks and logistics efficiency.
In Figure 10, the CPSC of ports in Jiangsu, Fujian, Tianjin, and Liaoning provinces was moderate. However, the development of CPSC in these regions exhibited notable divergence. Jiangsu has demonstrated consistent year-on-year improvement, reaching a score of 0.55 in 2022, which is attributable to the accelerated development of inland ports and enhancements in the regional logistics infrastructure. Tianjin has also shown consistent growth, from 0.31 to 0.42; however, the disparity with the southeastern coastal region has widened concurrently. Fujian Province exhibited modest but steady growth, indicating a stable and upward trend. Liaoning Province experienced a general downward trend marked by fluctuations, accompanied by relatively slow port development.
In Figure 11, the CPSC in Guangxi, Hainan, and Hebei ranked behind, indicating their substantial potential for further enhancement in logistics efficiency and service capacity. These provinces may be constrained by regional economic and infrastructural factors. Hainan’s score increased from 0.1214 to 0.2484, primarily driven by the implementation of Hainan’s FTZ policy, which substantially enhanced its port service capacity and logistics efficiency.

4.1.2. PIEE

The PIEE of ports in Guangdong, Shandong, and Zhejiang between 2016 and 2022 is illustrated in Figure 12. Guangdong, Shandong, and Zhejiang consistently ranked at high levels. The sustained growth in dry bulk cargo and liquid bulk cargo throughput at the Qingdao and Yantai Ports has provided robust support for the continued prominence of Shandong. Guangdong, with a score of 0.73 or higher, is driven by substantial investments in port infrastructure, continuous advancements in bulk cargo handling capacity, and a prominent economic status. Notably, the ports of Shenzhen and Guangzhou exhibit significant advantages in the transportation of both liquid and dry bulk cargo. Zhejiang showed a notable increase, peaking at 0.93. Leadership in the dry bulk throughput of Ningbo-Zhoushan Port has been the key driver.
In Figure 13, the scores for PIEE across Jiangsu, Fujian, Hebei, Liaoning, and Guangxi range from 0.5 to 0.77, reflecting a moderate level. The growth observed in Jiangsu is primarily attributed to the expansion of 10,000-ton berths in ports along the Yangtze River, supporting bulk cargo transportation. Fujian demonstrated a more stable growth trend owing to incremental enhancements in bulk cargo transportation capacity. Despite its limited growth, Hebei has a traditional advantage in bulk cargo transportation. The growth observed in Liaoning and Guangxi was comparatively slow, suggesting that these provinces were relatively underdeveloped in terms of port infrastructure.
In Figure 14, Hainan falls behind, with a coefficient of 0.47, indicating opportunities for future advancement. Tianjin and Shanghai focus on high-end container transportation and internationalized services, with less attention being paid to bulk cargo handling and regional services.
Guangdong and Zhejiang, located in the southeastern coastal region, maintain leadership in the PIEE, which is primarily attributed to significant investments in infrastructure modernization, bulk cargo handling capacity, and the optimization of the economic environment. Shandong, Hebei, and Liaoning in the northern coastal region have maintained their traditional advantages in terms of bulk cargo transportation capacity and port infrastructure. Guangxi and Hainan, in the southwestern coastal region, exhibited slower infrastructure development.

4.1.3. DMPS

The DMPS of ports in China’s coastal provinces from 2016 to 2022 exhibit marked variations, as illustrated in Figure 15. Subfigures (a–k) show the normalized trends of CPSC in Fujian, Guangdong, Guangxi, Hainan, Hubei, Jiangsu, Liaoning, Shandong, Shanghai, Tianjin, and Zhejiang, respectively. Between 2016 and 2019, the coefficients consistently exceeded 0.6, except for Hebei, reflecting a relatively high performance. However, by 2020, they had experienced a general decline of 0.2–0.3. In 2021 and 2022, the DMPS began a gradual rebound; however, it has yet to recover to pre-pandemic levels. The primary underlying factor is the slowdown in domestic economic growth caused by the pandemic, leading to slower GDP growth, which directly affects the comprehensive development and investment in ports. International market demand decreased, and ports heavily reliant on foreign trade were seriously affected, resulting in a corresponding decline in the demand for professional services. The intensification of economic uncertainty has made port operators more inclined to maintain operations in the short term and reduce their medium—to long-term investments in digital construction. In general, the DMPS demonstrated relatively small regional disparities. Except for Zhejiang leading and Hebei (lagging), the differences in DMPS between the other regions were relatively small, indicating a more balanced overall development.

4.1.4. PPTS

The PPTS of ports in China’s coastal provinces between 2016 and 2022 is illustrated in Figure 16. Guangdong, Shanghai, Tianjin, and Fujian maintained robust PPTS with coefficients consistently exceeding 0.6, which is attributable to their well-established technical service frameworks.
In Figure 17, Zhejiang, Shandong, Jiangsu, Hainan, and Guangxi witnessed substantial improvements in PPTS. Notably, after the implementation of the FTZ, the PPTS for Zhejiang, Shandong, and Jiangsu increased by more than 0.14. These regions have experienced growth in shipping brokerage services as well as ship engineering and repair service industries. Hainan benefited greatly from the Hainan Free Trade Port Policy. This consistently bolstered the improvement in PPTS. In general, the southeastern and northern coastal regions ranked ahead of the others, whereas the southwestern coast lagged. However, there was significant spatial variability along the northern coast, with Shandong performing better and Hebei performing worse.

4.1.5. MEC

The MEC of ports in China’s coastal provinces exhibits a consistent upward trend between 2016 and 2022, as shown in Figure 18 Zhejiang, Shandong, and Jiangsu showed consistent and steady growth, ranging from 0.4 to 0.75. Guangdong and Shanghai consistently exceeded 0.6. Under FTZ policies, port customs clearance efficiency has seen substantial improvements, streamlined the import-export processes, and enhanced overall efficiency. For instance, Zhejiang implemented the adoption of an ‘airport’-style maritime traffic organization and management, and Shandong markedly reduced the processing time for import documentation. It has notably improved the efficiency of ship movement at ports and further elevated ports’ international competitiveness.
In Figure 19, the MECs of Liaoning and Hebei were chronically low compared to those of the others. The underdevelopment of port infrastructure and insufficient policy support can be improved. Hainan and Guangxi, as key representatives of the southwestern coastal region, have demonstrated consistent improvements in MEC, particularly under the implementation of the “One Belt, One Road” and “Western Land and Sea Corridor” initiatives, which have substantially facilitated international maritime trade.
The Southeast Coast and Yangtze River Delta region emerged as leaders in the MEC, followed by Bohai Bay. However, they exhibit a relatively slow growth rate. Conversely, the Southwest Coast exhibited a stable growth trend despite its lower ranking. Enhancements in MEC are critical indicators of the comprehensive competitiveness of ports across all provinces. Efficient customs clearance, robust policy support, and optimal service capabilities are key drivers for improving PME. Between 2016 and 2022, supported by national policies and port-led reforms, ports will experience substantial improvement. Notably, developed regions such as Guangdong and Shanghai have sustained their dominant positions.

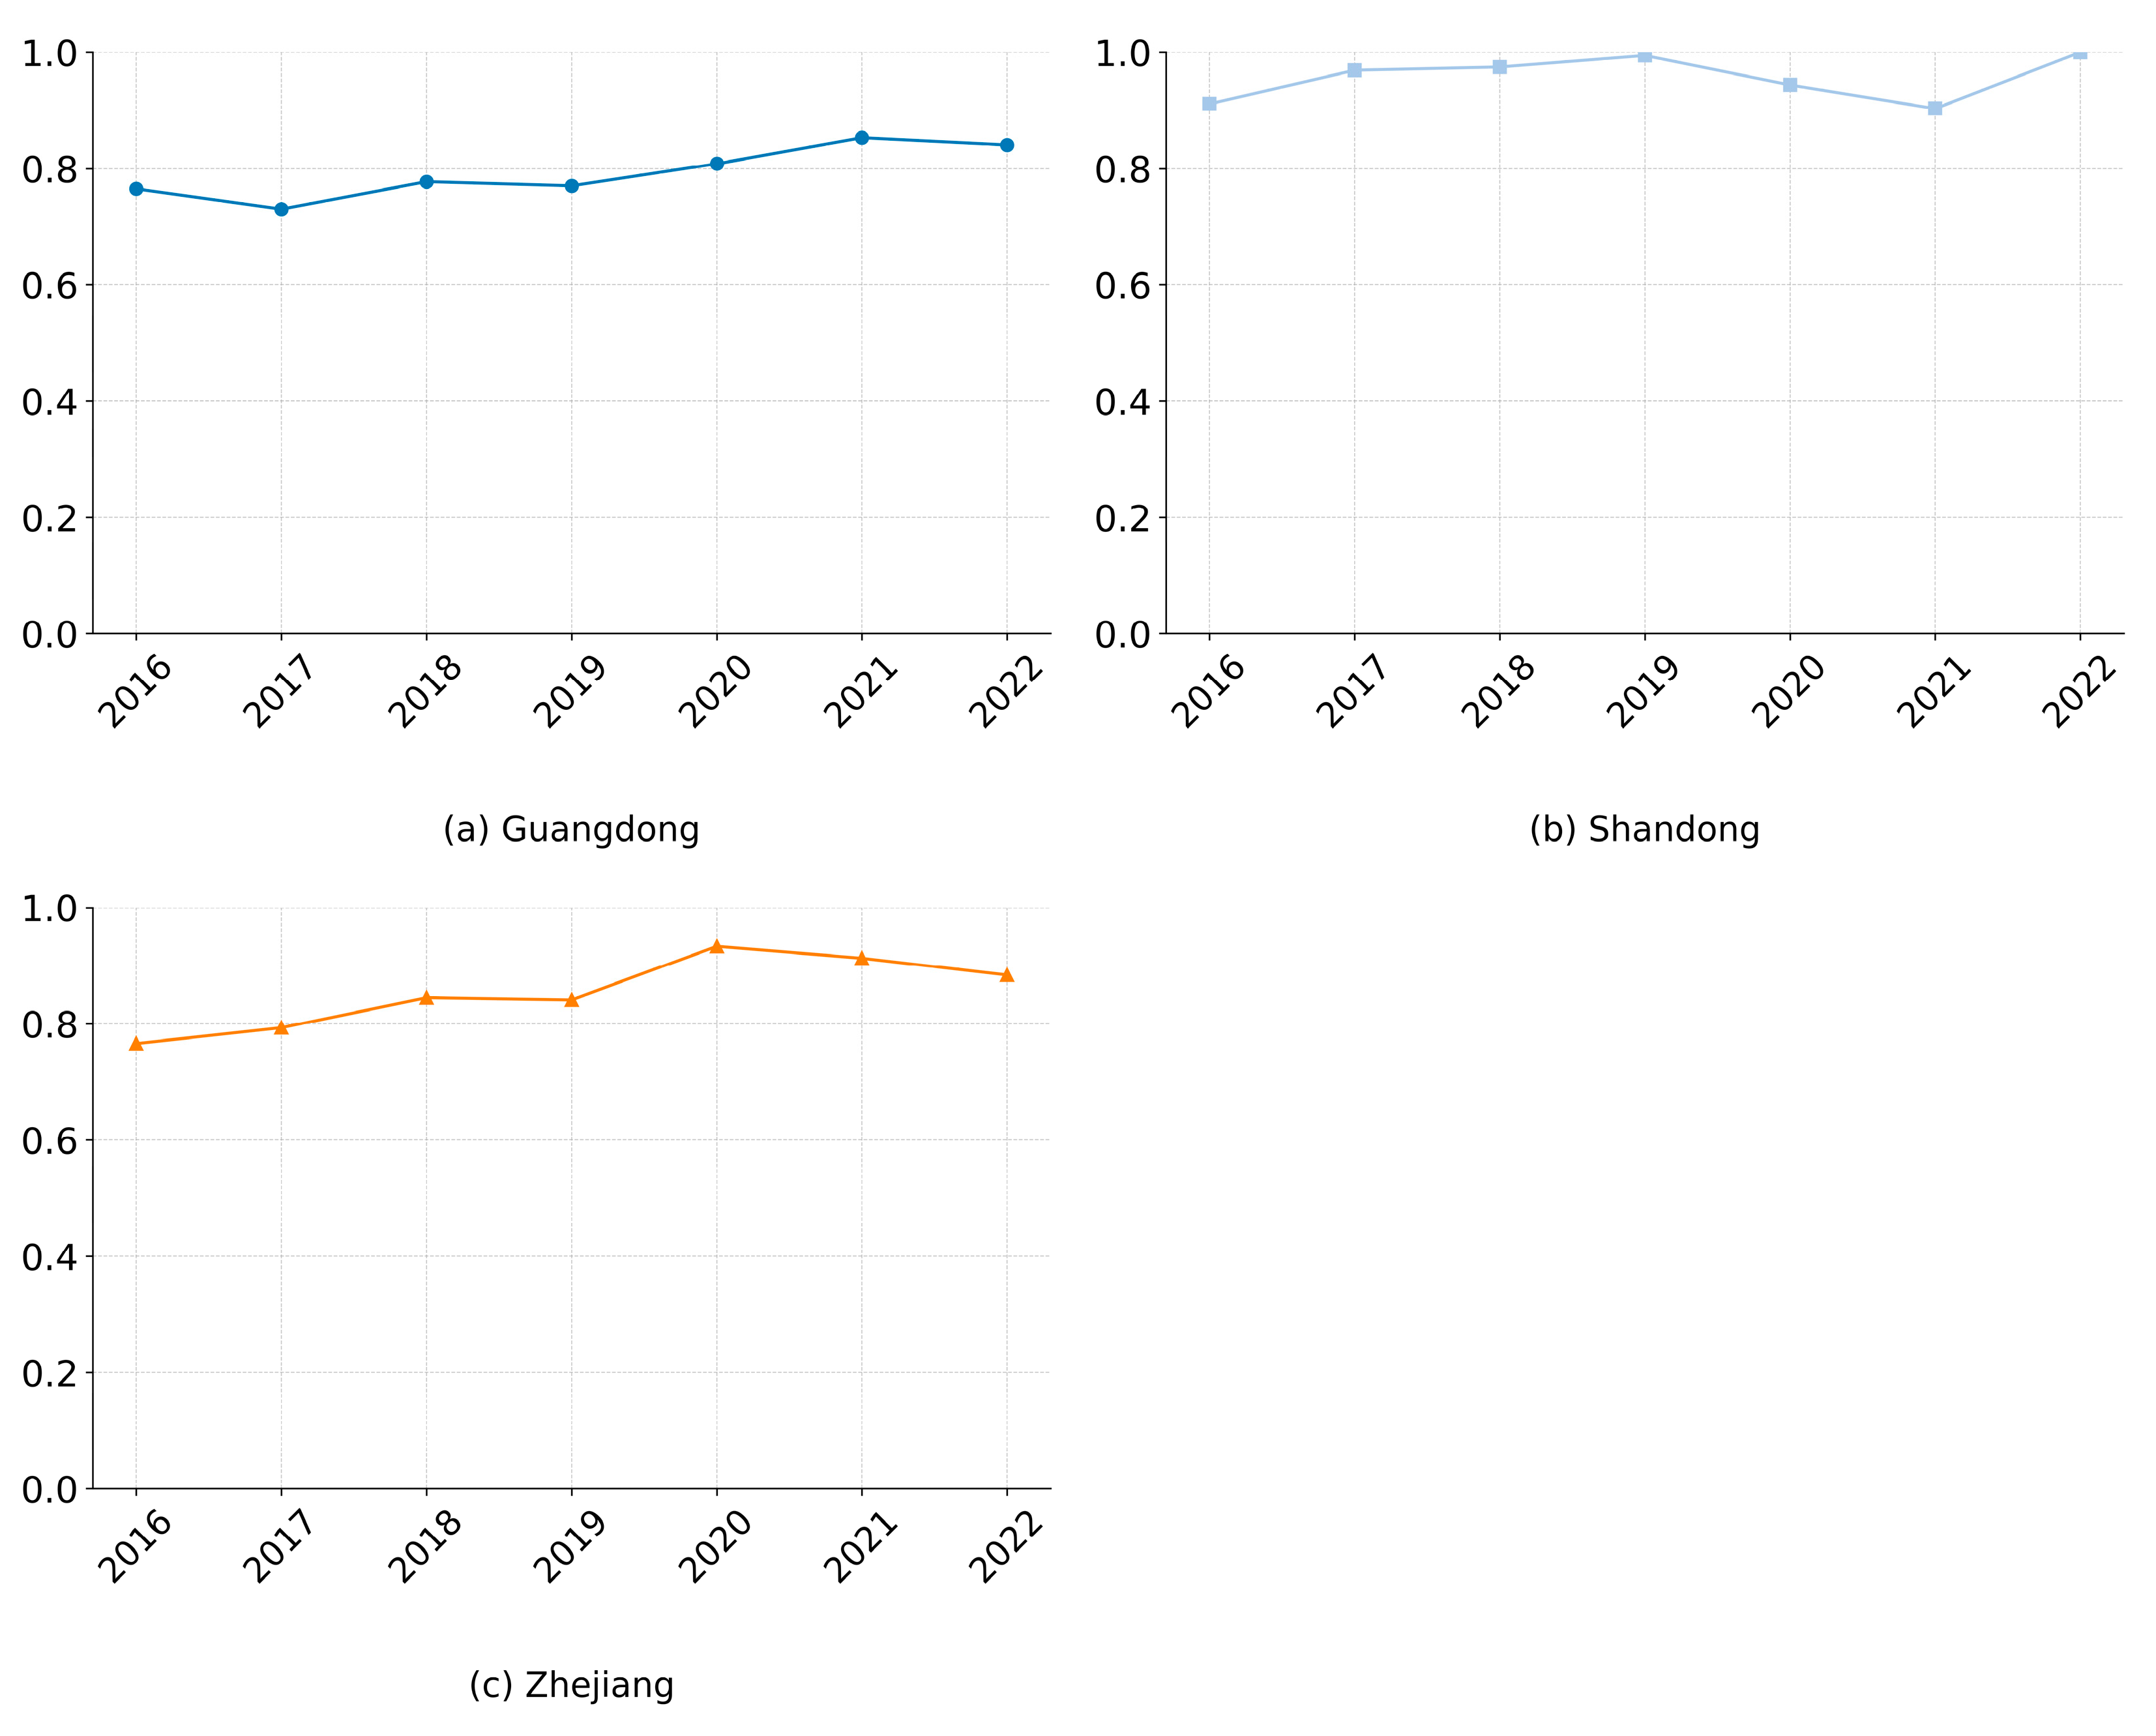
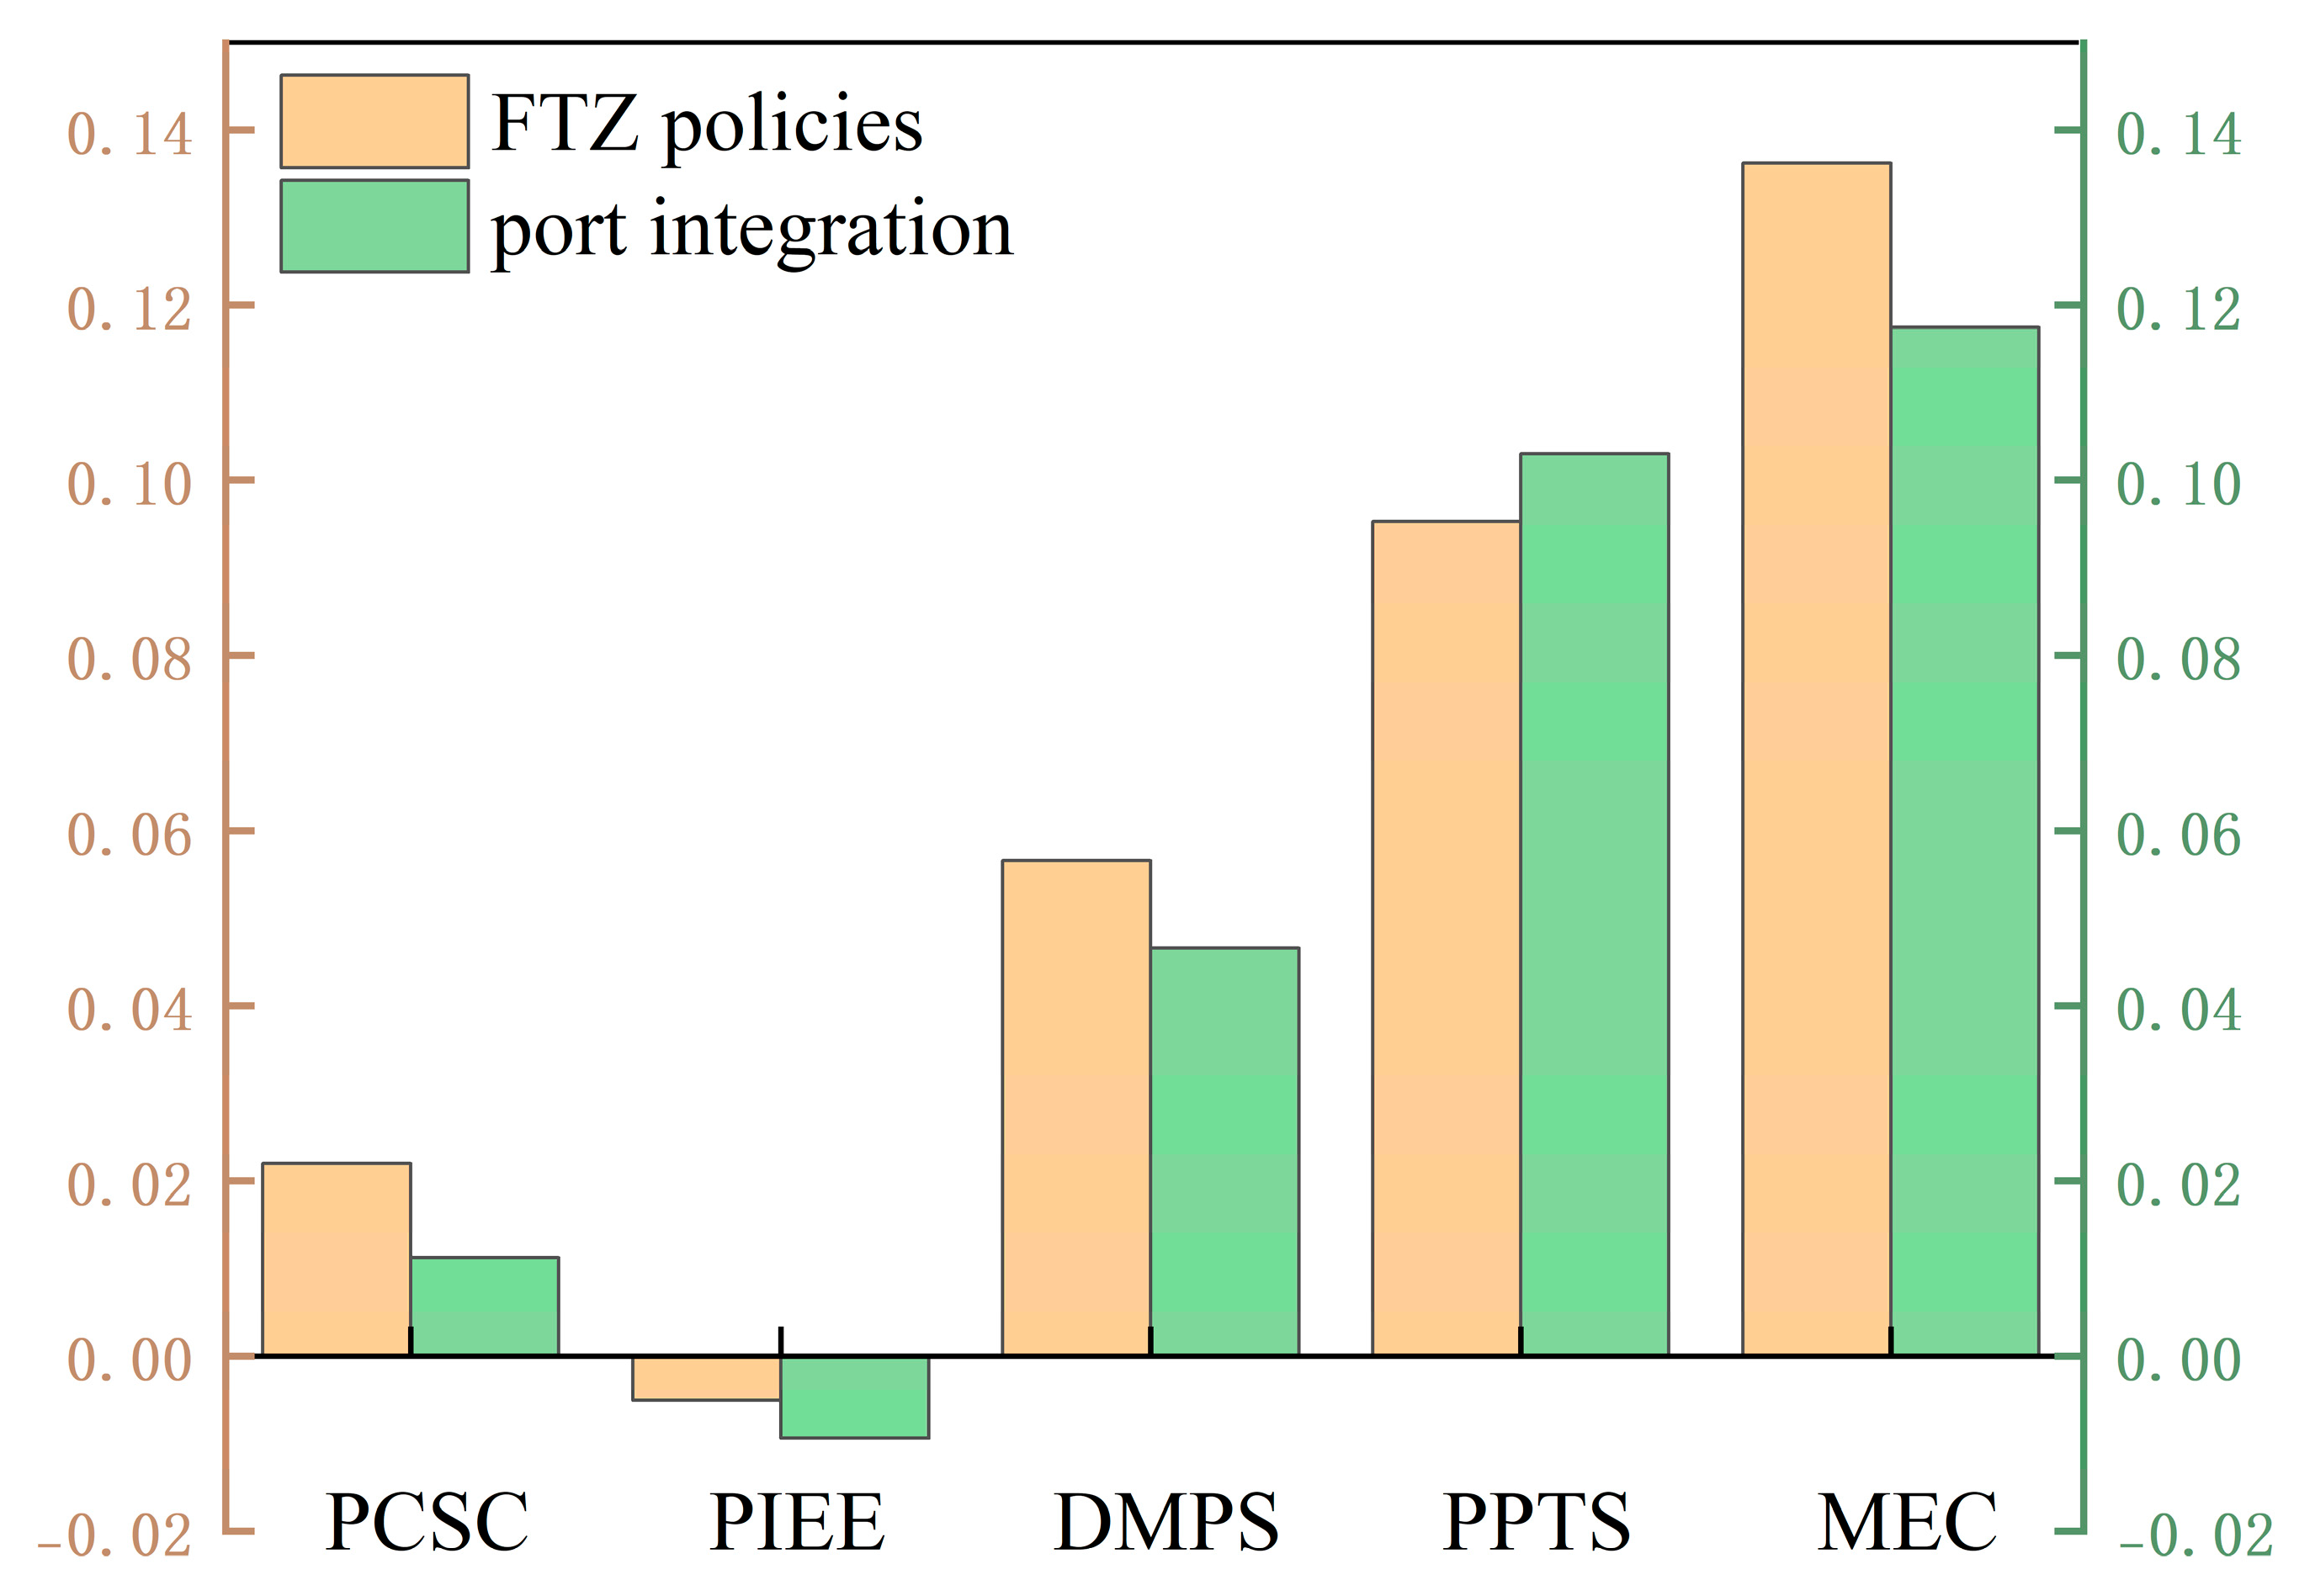
4.2. Dynamics Under FTZ and Port Integration

The FTZ policy introduced novel opportunities for port development in China. However, their effects vary across geographical locations, provincial scales, policy implementations, and government support. An in-depth comparative analysis of the changes in port competitiveness before and after the establishment of FTZs was conducted for Liaoning, Hebei, Shandong, Jiangsu, Guangdong, Guangxi, and Hainan, as shown in Table 3. The establishment of FTZs positively affects port competitiveness (PC). Provinces such as Zhejiang, Liaoning, Shandong, Guangxi, Hebei, and Jiangsu experienced substantial improvements in port competitiveness. Hainan showed the highest increase in PC, with a value of 0.0053. This is primarily because of the “zero-tariff” policy, open business approval authority for registered enterprises, and modern infrastructure construction. There were also differences in the improvements in CPSC, PIEE, DMPS, PPTS, and MEC. The mean value was 0.0636 for enhancement in the DMPS. The integration of port infrastructure with information, networks, and new energy, and the combination of FTZ with overseas warehouses and modern logistics improves the DMPS. The mean value was 0.1159 for the enhancement in PPTS. The commodity resource allocation hub construction under the FTZ supports the issuance of commodity storage and transportation implementation and professional and technical reform. The most significant improvement was in the EMC, with a mean value of 0.1360. FTZs improve international ship registration, expand the financial service capacity of ports, promote the development of multimodal transportation, and enhance port ship management efficiency. Hainan changed approvals to filings in accordance with the law to reduce administrative licensing matters and the time span for issuing documents to optimize the customs clearance mode. The effect of FTZ on port infrastructure is implicit in their promotion of the hinterland economy. Infrastructure construction is a long-term evolution process that weakens the attraction of investment in infrastructure for enterprises to some extent.
The port integration process varies according to geographic location, city scale, and integration mode. Zhejiang Province pioneered the integration of the Ningbo, Zhoushan, Wenzhou, Jiaxing, and Taizhou ports in 2015, establishing the Zhejiang Provincial Port Investment and Operation Group to coordinate integration efforts. During the study period, provinces including Liaoning, Hebei, Tianjin, Shandong, Jiangsu, Fujian, Guangdong, Guangxi, and Hainan sequentially formed provincial port groups or formalized port integration agreements, thereby consolidating regional port resources. This study conducts an in-depth comparative analysis of the changes in port competitiveness under port integration, as shown in Table 4. Liaoning, Shandong, Fujian, Guangdong, Guangxi, and Hainan show improvements in port competitiveness under port integration. The competitiveness of Guangxi ports increased by 0.0024, and it realized more centralized and efficient port operations and management via unified planning, construction, management, and operations. Internal conflict and vicious competition among ports can also be reduced. Differences were observed in the enhancements of CPSC, PIEE, DMPS, PPTS, and MEC. The most notable improvement was in the EMC, with a mean value of 0.0775. Centralized management and efficient allocation of resources have been realized via the integration of investment and control, logistics, shipping, and trade. Management and coordination costs have been reduced, and decision-making and execution efficiency have improved. The enhancements in the DMPS and PPTS showed marked improvement, with mean values of 0.0370 and 0.0701, respectively. This implies that policy initiatives and advanced professional technologies robustly support the integration of port resources. The performance improvement in PIEE under port integration is not significant, which may be related to the fact that infrastructure development often faces time constraints and cannot be completed temporarily.
The establishment of FTZs, together with port integration, created new opportunities for the development of China’s ports. However, the impacts of these policies varied significantly across regions. Analyzing these differences is of substantial practical significance for the development of a targeted policy framework. This study involves an in-depth investigation of changes in port competitiveness both before and after the establishment of FTZs and port integration in China’s coastal provinces, with the aim of assessing the possible effects on port development and identifying regional differences, as shown in Figure 20. FTZs and port integration have notably enhanced professional technical support and services, digital management, and overall management efficiency.

5. Discussion

In Figure 8, from a spatial distribution perspective, the CPSC exhibited a hierarchical pattern across various regions between 2016 and 2022, with the southeast coastal region ranking first, followed by the Yangtze River Delta, the northern coastal region, and the southwestern coastal region. This kind of heterogeneity might be caused by various factors, such as differences in economic development levels, natural resource endowments, geographical conditions, and the effects of path dependence on port development [57]. For example, the primary constraints hindering port development in the southwestern and northeastern coastal regions are inadequate infrastructure, insufficient high-end service capacity, and low logistics efficiency. It is imperative to bolster the construction of port infrastructure and service capacity to reduce regional disparities and enhance internationalization.
The COVID−19 pandemic had a serious impact on global trade in 2020 [58]. The decline of DMPS can be attributed largely to the outbreak of the COVID-19 pandemic in early 2020, which precipitated substantial fluctuations in the global shipping market and severely disrupted port operations. The reduction in international trade and the corresponding decline in shipping volumes directly affected the operational efficiency of port digital management platforms and reduced the demand for shipping brokerage services. Furthermore, in response to pandemic prevention and control, many ports prioritized infrastructure protection and logistics supply guarantees, which in turn diminished investments in digital infrastructure and high-end service capacities.
As a significant measure for China to deepen the reform of the social and economic system, the FTZ policy has played a vital role in stimulating the economic development of China’s free trade port cities [46]. Advancing policy innovation, bolstering the global attractiveness of ports, strengthening the development of technical service infrastructure, and upgrading ship repairs and maritime brokerage services are critical strategies for enhancing port competitiveness. Tianjin’s FTZ tariff preferences and well-established technical services have attracted substantial maritime shipping demand. The formation of a provincial port group seems to have positive effects on the port system evolution, facing the current development of Chinese coastal ports [57]. In recent years, the Beibu Gulf Port Group (BGPG), the port integrator in Guangxi, has increased investment in the port infrastructure and corridors connecting the seaports and China’s vast western inland regions. And a combination of competition and cooperation, can be observed in the Chinese coastal region [57]. A representative example is the co-opetition among the three provincial port groups in the Yangtze River Delta, namely, Shanghai, Zhejiang, and Jiangsu.
Coastal provinces can leverage the policy advantages of FTZs, actively facilitate port integration processes, explore innovative development modes, bolster port infrastructure, enhance technological advancement, and expand service capacity to boost port competitiveness. Upgrading port infrastructure from the perspectives of both hardware and software and streamlining the allocation of natural resources under the integration of automation, intelligent systems, 5G technology, and sustainable practices require optimizing the warehousing capacity, establishing intelligent logistics platforms and shipping databases, and leveraging 5G network technology to facilitate data storage and exchange to create intelligent warehousing. Fostering policy innovation and technological advancement includes enhancing the legal and institutional framework within the FTZ, broadening the pilot areas of international ship registration, reducing international shipping taxation, expanding financial services, and optimizing logistics efficiency to maximize the benefits of FTZs. Improving port integration efficiency. The government has formulated relevant policies that clearly define the development objectives, key priorities, and safeguarding mechanisms for port integration. Under strategic guidance, each region designs and implements the corresponding port integration development plan, leveraging its unique locational advantages and economic development imperative while simultaneously minimizing redundant infrastructure development and mitigating harmful competition. For instance, in Bohai Bay, efforts should be made to optimize the coordinated development among the coastal ports of Tianjin, Hebei, Shandong, and Liaoning. Similarly, in the Yangtze River Delta, the Ningbo-Zhoushan and inland ports should form a coordinated development path that enhances integrated development under regional economic cooperation. For instance, Hainan can enhance its interaction with the Guangdong–Hong Kong–Macao Bay Area to attract high-quality investments from Guangdong, Hong Kong, and Macao. Hebei actively engages in the integration of the Beijing–Tianjin–Hebei region and fosters complementary development alongside Tianjin Port. Reinforcement of industrial synergies with neighboring regions and the formation of complementary development patterns enhance their overall competitiveness.

6. Conclusions and Future Works

This study develops a comprehensive port competitiveness evaluation framework within the FTZ and port integration policies and employs principal component analysis and entropy weighting methods to examine the dynamic shifts in port competitiveness across China’s coastal provinces from 2016 to 2022. The findings of this study are as follows:
(1)
For the coastal provinces in China, the weights of CPSC, PIEE, DMPS, PPTS, and MEC were 0.3158, 0.1886, 0.1271, 0.1402, and 0.2283, respectively, indicating that CPSC and MEC exert considerable influences on the competitiveness of ports.
(2)
The results of the comprehensive port competitiveness evaluation show that core growth areas are concentrated in Guangdong, Zhejiang, Jiangsu, and Shandong; stable development areas include Shanghai and Fujian; policy-driven effects are particularly significant in Hainan; and development-restricted areas include Hebei and Liaoning.
(3)
The development of China’s coastal ports is characterized by regional imbalance. Specifically, the Yangtze River Delta, Pearl River Delta, and Bohai Rim (northern) port clusters demonstrate strong competitiveness; the southeastern coastal port cluster maintains a moderate level, whereas the Beibu Gulf (southwestern) port cluster remains relatively weak.
(4)
Both FTZ and port integration policies can promote port competitiveness to some extent, especially for professional technical support and services, digital management, and overall management efficiency. The dynamics of port competitiveness under an FTZ are higher than those under port integration.
This study provides a data-driven evaluation of port competitiveness dynamics under the influence of FTZ and port integration policies. While the results offer meaningful policy insights, several limitations should be acknowledged, which also point to opportunities for future research.
First, although the regional differentiation identified—such as growth hubs (e.g., Guangdong and Zhejiang), stable zones (e.g., Shanghai and Fujian), and lagging areas (e.g., Hebei and Liaoning)—is consistent with China’s macroeconomic regional strategies, the current interpretation primarily relies on descriptive spatial patterns. Future research could benefit from integrating spatial econometric models or dynamic panel data techniques (such as System GMM) to better capture spatial spillover effects and policy heterogeneity across regions. In addition, a stronger theoretical contextualization could be achieved by incorporating frameworks such as Future research could benefit from stronger theoretical contextualization by incorporating frameworks such as New Economic Geography (NEG), Institutional Theory, and Regional Innovation Systems (RIS) [59,60] to explore the deeper structural, institutional, and policy-related drivers behind these competitive disparities.
Furthermore, although the study implicitly reflects the multidimensional nature of port competitiveness, the five core components (CPSC, PIEE, DMPS, PPTS, and MEC) could be more explicitly aligned with well-established theoretical typologies such as the Port Competitiveness Pyramid [61] and the Triple Bottom Line (TBL) [62] framework. Such alignment would enhance theoretical clarity and strengthen the justification for indicator selection, enabling broader generalization and cross-regional comparison.
Moreover, while the finding that FTZs contribute more significantly to port competitiveness than port integration is valuable, the study does not establish robust causality. The current analysis is limited to comparative trend evaluation without formal econometric validation. To enhance inferential strength, future research could adopt quasi-experimental designs, such as difference-in-differences (DID) using the staggered rollout of FTZs as treatment variation to address endogeneity and policy selection bias, thereby enabling stronger causal attribution of policy effects.
In summary, enhancing theoretical interpretation and incorporating rigorous econometric techniques will be important steps toward deepening the explanatory power and policy relevance of port competitiveness research.

Author Contributions

Conceptualization, H.Y.; methodology, H.Y. and Z.G.; resources, H.Y. and L.X.; data curation, Z.G.; writing—original draft preparation, H.Y. and Z.G.; writing—review, and editing, H.Y. and L.X.; visualization, Z.G. All authors have read and agreed to the published version of the manuscript.

Funding

This research was funded by the National Natural Science Foundation of China (No. 42371415 and No. 42101429), the National Key Research and Development Program of China (No. 2022YFC3302703), and the Young Elite Scientists Sponsorship Program by China Association for Science and Technology (CAST) (No. YESS20220491), the Education Department of Hainan Province (No. Hnjg2024-284).

Institutional Review Board Statement

Not applicable.

Informed Consent Statement

Not applicable.

Data Availability Statement

Data are contained within the article.

Conflicts of Interest

The authors declare that they have no known competing financial interests or personal relationships that could have appeared to influence the work reported in this paper.

Appendix A

Table A1. The notation used in the methodology.
ClassificationVariablesExplanatoryValue-RangeUnits Measured
Port competitiveness evaluation index framework D = { B 1 , B 2 , B 3 , B 4 } D represents port competitiveness evaluation index framework B 1 represents port facilities and operations, B 2 represents the level of port shipping services, B 3 refers to the economic environment, B 4 refers to social governance
{ x 1 , , x j , x k , x h , , x n } port competitiveness evaluation index
x 1 number of berths that can provide service for ships greater than 10,000 tons[60, 350]numerical value
x 2 container throughput[160, 6800]Ten thousand TEU
x 3 dry bulk cargo throughput[2700, 104000]Ten thousand tons
x 4 liquid bulk cargo throughput[240, 28200]Ten thousand tons
x 5 government transparency[0, 100]numerical value
x 6 degree of digitalized government management[0, 100]numerical value
x 7 FTZ size[10, 273]Square kilometer
x 8 ease of doing business index[0, 100]numerical value
x 9 logistics performance index[0, 100]numerical value
x 10 shipping brokerage services[0, 100]numerical value
x 11 ship management services[0, 100]numerical value
x 12 ship premium income[2, 36]Billions of RMB
x 13 GDP[4000, 110000]One trillion RMB
x 14 foreign trade dependence[0, 1]numerical value
x 15 maritime legal services[0, 100]numerical value
x 16 ship engineering and maintenance services[0, 1]numerical value
i [1, 11]numerical value
T [2016, 2022]year
Standardization of competitiveness evaluation indicators x ij T the original value of the jth evaluation indicator for province i in year T numerical value
x j ¯ the mean value of the jth evaluation indicator of all provinces numerical value
s j the standard deviation of the jth evaluation indicator for all provinces[0, 1]numerical value
z i j T denotes the standardized value of the jth evaluation indicator for province i in year T.[0, 1]numerical value
Correlation calculation for competitiveness evaluation indicators R = ( r i j ) n × n The correlation matrix of competitiveness evaluation indicators[0, 1]numerical value
r j k the correlation coefficient between the jth x and the kth evaluation indicators[0, 1]numerical value
r j h the correlation coefficient between the jth and hth evaluation indicators[0, 1]numerical value
r k h the correlation coefficient between the kth and hth evaluation indicators[0, 1]numerical value
z j ¯ the mean standardized value of the jth evaluation indicator of all provinces.[0, 1]numerical value
α j k · h , α j o · h , and α k o · h first-order partial correlation coefficient[0, 1]numerical value
α j k · h o second-order partial correlation coefficient[0, 1]numerical value
α j k · τ 1 τ 2 τ q 1 , α j q · τ 1 τ 2 τ q 1 , and α k q · τ 1 τ 2 τ q 1 q˗1-order partial correlation coefficients[0, 1]numerical value
Correlation calculation for competitiveness evaluation indicators χ 2 0.05 , d f a 95% confidence value with d f degrees of freedom[0, 1]numerical value
d f the degree of freedom in Bartlett’s test numerical value
Ethe unit matrix with the same order as R.[0, 1]numerical value
λ s eigenvalues sorted of E[0, 20]numerical value
b s the information contribution rate of the principal component F s [0, 1]numerical value
α s the cumulative contribution rate of the principal component F 1 F 2 F s F n [0, 1]numerical value
F s the principal component[0, 1]numerical value
f i s T The F s principal component scores for province i in year T[0, 1]numerical value
T j = v 1 j , v 2 j , . . . , v n j T the eigenvector corresponding to λ j [0, 1]numerical value
Port competitiveness calculation f 11 a f 1 u a f m 1 a f m u a f 11 c f 1 u c f m 1 c f m u c The principal component score matrix for all provinces for all years[0, 1]numerical value
f ¯ i s T normalizing f i s T using the polar transform method[0, 1]numerical value
m i n ( f s ) the minimum value of the sth principal component score for the mth province between years a and c[0, 1]numerical value
m a x ( f s ) the maximum value of the sth principal component score for the mth province between years a and c[0, 1]numerical value
p i s T Gravimetric transformation of the normalized principal component f ¯ i s T [0, 1]numerical value
e s the entropy value for the sth principal component[0, 1]numerical value
h s the variation coefficient h s for the sth principal component[0, 1]numerical value
w s the weight w s for the sth principal component[0, 1]numerical value
G i T [0, 1]numerical value
Table A2. The raw data for Jiangsu.
Indicators2016201720182019202020212022
ships greater than 10,000 tons7272728190146160
container throughput162917251800187818952180.12393.67
dry bulk cargo throughput28,55230,74031,82435,74538,84340,52337,802
liquid bulk cargo throughput2855341535361887176520261890
government transparency78.0265.0372.6970.0476.5772.6970.04
degree of digitalized government management90.9193.9494.3191.964.569.673.82
FTZ size54.17554.17554.175119.98100.97119.98119.98
ease of doing business index59.2148.8157.4658.2563.239.9453.19
logistics performance index7653.789057.68969.299947.6810,895.7212,441.7112,478.05
shipping brokerage services,13222935425062
ship engineering and maintenance services73.0262.0379.6975.0472.5775.6976.04
ship management services186.2182.1192.1187.7195.1324204.2196
maritime legal services,10101214151516
ship premium income34,195.4383528,706.446,449.3918,952.6837,709.0726,288.0856,546.61
GDP77,40085,90093,20098,700102,700116,364.2122,875.6
foreign trade dependence0.4345529720.4659150.4699830.4397160.4430.44790.4412

References

  1. Li, S.; Liu, J.; Kong, Y. Pilot free trade zones and Chinese port-listed companies performance: An empirical research based on quasi-natural experiment. Transp. Policy 2021, 111, 125–137. [Google Scholar] [CrossRef]
  2. Chang, Y.; Wang, S. China’s pilot free trade zone and high-quality economic development: The mediation effect of data real integration and the regulating effect of technological innovation. Environ. Dev. Sustain. 2024, 1–39. [Google Scholar] [CrossRef]
  3. Jiang, Y.; Wang, H.; Liu, Z. The impact of the free trade zone on green total factor productivity—Evidence from the shanghai pilot free trade zone. Energy Policy 2021, 148, 112000. [Google Scholar] [CrossRef]
  4. Zhuo, C.; Mao, Y.; Rong, J. Policy dividend or “policy trap”? Environmental welfare of establishing free trade zone in China. Sci. Total Environ. 2021, 756, 143856. [Google Scholar] [CrossRef] [PubMed]
  5. Qiu, D.; Lan, Y.; Cao, A.; Tan, L. Research on the impact of China’s free trade zone policies on urban economic development. China Econ. J. 2024, 17, 481–498. [Google Scholar] [CrossRef]
  6. Li, X.; Xu, Q.; Wang, H. Environmental effects of the establishment of pilot free trade zones: Evidence from Chinese resource-based enterprises. Environ. Sci. Pollut. Res. 2023, 30, 21384–21403. [Google Scholar] [CrossRef]
  7. Cheng, J.; Ma, L. China’s Pilot Free Trade Zones and Company’s Sustainability Performance. Sustainability 2023, 15, 14632. [Google Scholar] [CrossRef]
  8. Chen, J.; Fei, Y.; Lee, P.T.W.; Tao, X. Overseas port investment policy for China’s central and local governments in the Belt and Road Initiative. In China’s New Global Strategy; Routledge: London, UK; New York, USA, 2020; pp. 120–139. [Google Scholar]
  9. Song, M.; Wang, J.; Wang, S.; Zhao, D. Knowledge accumulation, development potential and efficiency evaluation: An example using the Hainan free trade zone. J. Knowl. Manag. 2019, 23, 1673–1690. [Google Scholar] [CrossRef]
  10. Junior, I.C.L.; de Oliveira, U.R.; de Almeida Guimarães, V.; Ribeiro, L.G.; Fernandes, V.A. Probabilistic analysis of the sustainable performance of container terminals. Res. Transp. Bus. Manag. 2022, 43, 100725. [Google Scholar]
  11. Beysenbaev, R.; Dus, Y. Proposals for improving the logistics performance index. Asian J. Shipp. Log. 2020, 36, 34–42. [Google Scholar] [CrossRef]
  12. Bi, S.; Shao, L.; Tu, C.; Lai, W.; Cao, Y.; Hu, J. Achieving carbon neutrality: The effect of China pilot Free Trade Zone policy on green technology innovation. Environ. Sci. Pollut. Res. 2023, 30, 50234–50247. [Google Scholar] [CrossRef] [PubMed]
  13. Shahid, R.; Shahid, H.; Shijie, L.; Mahmood, F.; Yifan, N. Impact of opening-up on industrial upgrading in global value chain: A difference-in-differences estimation for Shanghai pilot free trade zone. Kybernetes 2024, 53, 6139–6154. [Google Scholar] [CrossRef]
  14. Huang, S.H.S.; Hsu, W.K.K.; Chen, K.Y.A. An assessment model of investment environment in free trade port zone-an empirical study on Kaohsiung port. Int. J. Shipp. Transp. Logist. 2022, 14, 302–319. [Google Scholar] [CrossRef]
  15. Wan, Z.; Zhang, Y.; Wang, X.; Chen, J. Policy and politics behind Shanghai’s free trade zone program. J. Transp. Geogr. 2014, 34, 1–6. [Google Scholar] [CrossRef]
  16. Chen, J.; Wan, Z.; Zhang, F.; Park, N.K.; Zheng, A.; Zhao, J. Evaluation and comparison of the development performances of typical free trade port zones in China. Transp. Res. Part A Policy Pract. 2018, 118, 506–526. [Google Scholar] [CrossRef]
  17. Liu, J.; Wang, X.; Guo, J. Port efficiency and its influencing factors in the context of pilot free trade zones. Transp. Policy 2021, 105, 67–79. [Google Scholar] [CrossRef]
  18. Ma, Q.; Li, S.; Jia, P.; Kuang, H. Is port integration a panacea for regions green development: An empirical study of China port city. Transp. Policy 2025, 160, 15–28. [Google Scholar] [CrossRef]
  19. Mou, N.; Wang, C.; Yang, T.; Ren, H.; Zhang, L.; Xu, H.; Liu, W. Spatiotemporal patterns of maritime trade between China and Maritime Silk Road: Evidence from a quantitative study using social network analysis. J. Transp. Geogr. 2022, 102, 103387. [Google Scholar] [CrossRef]
  20. Kavirathna, C.A.; Kawasaki, T.; Hanaoka, S. Intra-port coopetition under different combinations of terminal ownership. Transp. Res. Part E Logist. Transp. Rev. 2019, 128, 132–148. [Google Scholar] [CrossRef]
  21. Kavirathna, C.A.; Kawasaki, T.; Hanaoka, S.; Bandara, Y.M. Cooperation with a vessel transfer policy for coopetition among container terminals in a single port. Transp. Policy 2020, 89, 1–12. [Google Scholar] [CrossRef]
  22. Chen, J.; Li, T.; Zhao, H. Independent operation or coordinated integration? Enhancing the system resilience of ports in dealing with congestion based on a bilateral bargaining game. Ocean. Coast. Manag. 2024, 259, 107437. [Google Scholar] [CrossRef]
  23. Cong, L.Z.; Zhang, D.; Wang, M.L.; Xu, H.F.; Li, L. The role of ports in the economic development of port cities: Panel evidence from China. Transp. Policy 2020, 90, 13–21. [Google Scholar] [CrossRef]
  24. Ziemska-Osuch, M.; Guze, S. Analysis of the Impact of Road Traffic Generated by Port Areas on the Urban Transport Network—Case Study of the Port of Gdynia. Appl. Sci. 2023, 13, 200. [Google Scholar] [CrossRef]
  25. Abu Aisha, T.; Ouhimmou, M.; Paquet, M. Optimization of container terminal layouts in the seaport—Case of port of Montreal. Sustainability 2020, 12, 1165. [Google Scholar] [CrossRef]
  26. Yang, J.; Li, Y.; Dai, F.; Ni, J. How can pilot free trade zones affect regional technology innovation?—Evidence from China at the city level. Appl. Econ. 2025, 57, 216–231. [Google Scholar] [CrossRef]
  27. Zhao, N.; Zhen, H. Construction of port niche model and measurement of resource overlapping in port group. Navig. China 2015, 38, 117–126. [Google Scholar]
  28. Wang, C.; Ducruet, C.; Wang, W. Port integration in China: Temporal pathways, spatial patterns and dynamics. Chinese Geogr. Sci. 2015, 25, 612–628. [Google Scholar] [CrossRef]
  29. Guo, L.; Yang, D.; Yang, Z. Port integration method in multi-port regions (MPRs) based on the maximal social welfare of the external transport system. Transp. Res. Part A Policy Pract. 2018, 110, 243–257. [Google Scholar] [CrossRef]
  30. Bartosiewicz, A.; Kucharski, A.; Miszczyński, P. Efficiency of maritime container terminals in the Baltic Sea region using data envelopment analysis slack-based model. Res. Transp. Bus. Manag. 2024, 56, 101166. [Google Scholar] [CrossRef]
  31. Souza, F.; Pitombo, C.S.; Jong, G.D.; Yang, D. Port choice in Rio de Janeiro, Brazil: An analysis of the perspectives of exporters and importers in the container market. Int. J. Shipp. Transp. Logist. 2023, 17, 232–256. [Google Scholar] [CrossRef]
  32. Yu, H.; Fang, Q.; Fang, Z.; Xu, L.; Liu, J. Carbon footprints: Uncovering spatiotemporal dynamics of global container ship emissions during 2015–2021. Mar. Pollut. Bull. 2024, 209, 117165. [Google Scholar] [CrossRef] [PubMed]
  33. Talley, W.K.; Ng, M. Cargo port choice equilibrium: The case of shipping lines and cargo port service providers. Transp. Res. Part E Logist. Transp. Rev. 2022, 164, 102817. [Google Scholar] [CrossRef]
  34. Zhang, J.; Deng, S.; Kim, Y.; Zheng, X. A Comparative Analysis of Performance Efficiency for the Container Terminals in China and Korea. J. Mar. Sci. Eng. 2024, 12, 1568. [Google Scholar] [CrossRef]
  35. Yu, H.; Chen, F. Quantitative analysis of the efficiency dynamics of global liquefied natural gas shipping under COVID-19. Digit. Transp. Saf. 2024, 3, 19–35. [Google Scholar] [CrossRef]
  36. Mahmud, K.K.; Chowdhury, M.M.H.; Shaheen, M.M.A. Green port management practices for sustainable port operations: A multi method study of Asian ports. Marit. Policy Manag. 2024, 51, 1902–1937. [Google Scholar] [CrossRef]
  37. Xu, L.; Chen, N.; Chen, Z.; Zhang, C.; Yu, H. Spatiotemporal forecasting in earth system science: Methods, uncertainties, predictability and future directions. Earth-Sci. Rev. 2021, 222, 103828. [Google Scholar] [CrossRef]
  38. Pahl, J.; Kaiser, B.A. Arctic port development. In Arctic Marine Resource Governance and Development; Springer: Cham, Switzerland, 2018; pp. 139–184. [Google Scholar]
  39. Wiegmans, B.; Witte, P.; Spit, T. Characteristics of European inland ports: A statistical analysis of inland waterway port development in Dutch municipalities. Transp. Res. Part A Policy Pract. 2015, 78, 566–577. [Google Scholar] [CrossRef]
  40. Zhang, Q.; Qiu, Y.; Yang, D. Unpacking the evolution of port systems: A review study. Transp. Rev. 2025, 45, 259–281. [Google Scholar] [CrossRef]
  41. Ducruet, C.; Cuyala, S.; El Hosni, A. Maritime networks as systems of cities: The long-term interdependencies between global shipping flows and urban development (1890–2010). J. Transp. Geogr. 2018, 66, 340–355. [Google Scholar] [CrossRef]
  42. Yu, H.; Cui, X.; Bai, X.; Chen, C.; Xu, L. Incorporating graph theory and time series analysis for fine-grained traffic flow prediction in port areas. Ocean. Eng. 2025, 335, 121693. [Google Scholar] [CrossRef]
  43. Peng, P.; Cheng, S.; Chen, J.; Liao, M.; Wu, L.; Liu, X.; Lu, F. A fine-grained perspective on the robustness of global cargo ship transportation networks. J. Geogr. Sci. 2018, 28, 881–889. [Google Scholar] [CrossRef]
  44. Yu, H.; Fang, Z.; Peng, G.; Feng, M. Revealing the linkage network dynamic structures of Chinese maritime ports through automatic information system data. Sustainability 2017, 9, 1913. [Google Scholar] [CrossRef]
  45. Ceulemans, E.; Cardenas, I.; van Hassel, E.; Vanelslander, T. Synchromodal transport vs. conventional hinterland transport: A stakeholder theory analysis. Transp. Rev. 2025, 45, 1–25. [Google Scholar] [CrossRef]
  46. Fan, G.; Xie, X.; Chen, J.; Wan, Z.; Yu, M.; Shi, J. Has China’s Free Trade Zone policy expedited port production and development? Mar. Policy 2022, 137, 104951. [Google Scholar] [CrossRef]
  47. Xie, F.; Wang, C.; Xu, L. Whether to invest in terminal efficiency: A perspective considering customer preference and capital constraint in competitive environment? Ocean. Coast Manag. 2021, 205, 105563. [Google Scholar] [CrossRef]
  48. Moschovou, T.P.; Kapetanakis, D. A Study of the Efficiency of Mediterranean Container Ports: A Data Envelopment Analysis Approach. CivilEng 2023, 4, 726–739. [Google Scholar] [CrossRef]
  49. Pabón-Noguera, A.; Carrasco-García, M.G.; Ruíz-Aguilar, J.J.; Rodríguez-García, M.I.; Cerbán-Jimenez, M.; Domínguez, I.J.T. Multicriteria Decision Model for Port Evaluation and Ranking: An Analysis of Container Terminals in Latin America and the Caribbean Using PCA-TOPSIS Methodologies. Appl. Sci. 2024, 14, 6174. [Google Scholar] [CrossRef]
  50. Ding, L.; Zhang, Y.; Li, Y. A Novel Multi-dimensional Evaluation Framework and Spatiotemporal Analysis of Shipping Cities Based on Entropy-Weighted TOPSIS Method. J. Knowl. Econ. 2024, 16, 5516–5547. [Google Scholar] [CrossRef]
  51. Xu, W.; Xu, Y. The evaluation of comprehensive competitiveness of coastal ports and spatial evolution of sea port hinterland in China. Econ. Geogr. 2018, 38, 26–35. [Google Scholar]
  52. Mou, N.; Liu, C.; Zhang, L.; Fu, X.; Xie, Y.; Li, Y.; Peng, P. Spatial Pattern and Regional Relevance Analysis of the Maritime Silk Road Shipping Network. Sustainability 2018, 10, 977. [Google Scholar] [CrossRef]
  53. Peng, P.; Yang, Y.; Lu, F.; Cheng, S.; Mou, N.; Yang, R. Modelling the competitiveness of the ports along the Maritime Silk Road with big data. Transp. Res. Part A Policy Pract. 2018, 118, 852–867. [Google Scholar] [CrossRef]
  54. Yu, H.; Wu, W.; Zhang, X.; Fang, Z.; Fu, X.; Xu, L.; Liu, J. Optimization-based global liquefied natural gas shipping network management for emission reduction. Ocean. Eng. 2025, 321, 120366. [Google Scholar] [CrossRef]
  55. Wan, C.; Zhao, Y.; Zhang, D.; Yip, T.L. Identifying important ports in maritime container shipping networks along the Maritime Silk Road. Ocean. Coast Manag. 2021, 211, 105738. [Google Scholar] [CrossRef]
  56. Rummel, R.J. Applied Factor Analysis; Northwestern University Press: Evanston, IL, USA, 1988. [Google Scholar]
  57. Zhang, Q.; Yan, K.; Yang, D. Port system evolution in Chinese coastal regions: A provincial perspective. J. Transp. Geogr. 2021, 92, 103031. [Google Scholar] [CrossRef]
  58. Charłampowicz, J. Maritime container terminal service quality in the face of COVID-19 outbreak. Pomorstvo 2021, 35, 93–99. [Google Scholar] [CrossRef]
  59. Imran, M.; Alam, M.S.; Jijian, Z.; Ozturk, I.; Wahab, S.; Doğan, M. From resource curse to green growth: Exploring the role of energy utilization and natural resource abundance in economic development. In Natural Resources Forum; Blackwell Publishing Ltd.: Oxford, UK, 2024. [Google Scholar]
  60. Imran, M.; Hayat, N.; Saeed, M.A.; Sattar, A.; Wahab, S. Spatial green growth in China: Exploring the positive role of investment in the treatment of industrial pollution. Environ. Sci. Pollut. Res. 2023, 30, 10272–10285. [Google Scholar] [CrossRef]
  61. Hussein, K.; Song, D.W. Port supply chain integration and sustainability: A resource-based view. Int. J. Logist. Manag. 2024, 35, 504–530. [Google Scholar] [CrossRef]
  62. Peng, Y.; Zhang, X. Spatio-temporal differences of port competitiveness and its influencing factors in China under the 21st century Maritime Silk Road. Int. J. Shipp. Transp. Logist. 2024, 19, 525–554. [Google Scholar] [CrossRef]
Figure 1. Flowchart of the research methodology.
Sustainability 17 05502 g001
Figure 2. Port competitiveness evaluation index framework.
Sustainability 17 05502 g002
Figure 3. Study area with port integration and FTZ.
Sustainability 17 05502 g003
Figure 4. Correlations between different port competitiveness evaluation indicators.
Sustainability 17 05502 g004
Figure 5. Information contribution rate and cumulative information contribution rate of principal components.
Sustainability 17 05502 g005
Figure 6. Trends of port competitiveness in Guangdong, Zhejiang, Jiangsu, and Shandong (2016–2022).
Sustainability 17 05502 g006
Figure 7. Trends of port competitiveness in Fujian, Shanghai, Tianjin, Liaoning, and Guangxi (2016–2022).
Sustainability 17 05502 g007
Figure 8. Trends of port competitiveness in Hainan and Hebei (2016–2022).
Sustainability 17 05502 g008
Figure 9. Comprehensive Port Service Capacity (CPSC) trends from 2016 to 2022 in Shanghai, Guangdong, Zhejiang, and Shandong.
Sustainability 17 05502 g009
Figure 10. Comprehensive Port Service Capacity (CPSC) trends from 2016 to 2022 in Jiangsu, Fujian, Tianjin, and Liaoning.
Sustainability 17 05502 g010
Figure 11. Comprehensive Port Service Capacity (CPSC) trends from 2016 to 2022 in Guangxi, Hainan, and Hebei.
Sustainability 17 05502 g011
Figure 12. Trends in PIEE scores across Guangdong, Shandong, and Zhejiang from 2016 to 2022.
Sustainability 17 05502 g012
Figure 13. Trends in PIEE scores across Jiangsu, Fujian, Hebei, Liaoning, and Guangxi from 2016 to 2022.
Sustainability 17 05502 g013
Figure 14. Trends in PIEE scores across Hainan, Tianjin, and Shanghai from 2016 to 2022.
Sustainability 17 05502 g014
Figure 15. Trends in DMPS scores across coastal provinces in China from 2016 to 2022.
Sustainability 17 05502 g015
Figure 16. Trends in PPTS scores across Guangdong, Shanghai, Tianjin, and Fujian from 2016 to 2022.
Sustainability 17 05502 g016
Figure 17. Trends in PPTS scores across Zhejiang, Shandong, Liaoning, Jiangsu, Hainan, Hebei, and Guangxi from 2016 to 2022.
Sustainability 17 05502 g017
Figure 18. Trends in MEC scores across Zhejiang, Shandong, Jiangsu, Guangdong, and Shanghai from 2016 to 2022.
Sustainability 17 05502 g018
Figure 19. Trends in MEC scores across Fujian, Tianjin, Liaoning, Hebei. Hainan, and Guangxi from 2016 to 2022.
Sustainability 17 05502 g019
Figure 20. Possible impact of FTZ and port integration on port competitiveness.
Sustainability 17 05502 g020
Table 1. Data sources.
IndicatorsData Source
Number of berths that can provide service for ships greater than 10,000 tons, container throughput, dry bulk cargo throughput, liquid bulk cargo throughputChina Port Yearbook(China Port Yearbook)
Government transparencyGovernment Transparency Index Report (Zhejiang University Institute of Public Policy Research)
Degree in government digital managemente-Government Research Center(National Governance Teaching and Research Department (e-Government Research Center))
Size of FTZs/BFZsFTZ Official Website(Hainan Free Trade Port-Official Website, China (Shanghai) Pilot Free Trade Zone…)
Index for ease of doing business China Government-Business Relations between Cities Report (National Institute of Development and Strategy, Renmin University of China)
Shipping Brokerage Services, Ship Management Services, Maritime Arbitration ServicesMaritime Administration of the People’s Republic of China(Maritime Administration of the People’s Republic of China)
Ship engineering and maintenance servicesDaoke Baba (Daoke Baba—Online Document Sharing Platform)
Ship Premium IncomeChina Insurance Yearbook (China Insurance Yearbook Calendar Years Summary—Statistical Yearbook.com)
GDP, foreign trade dependence, logistics performance indexLocal Statistical Yearbook(Jiangsu Statistical Yearbook 2023、Shandong Statistical Yearbook 2023…)
Table 2. Score coefficient matrix of the principal components.
IndicatorsPC1PC2PC3PC4PC5
Number of 10,000-ton berths0.6810.605−0.1060.056−0.097
Container throughput0.9410.1360.015−0.0250.180
Dry bulk throughput0.2020.734−0.191−0.266−0.191
Liquid bulk throughput0.4490.7390.1740.339−0.057
Government transparency0.525−0.226−0.293−0.1270.139
Digitalized management of government0.352−0.0950.763−0.139−0.044
FTZ Size0.256−0.356−0.0720.5890.562
Ease of doing business0.595−0.5210.1040.290−0.297
Logistics performance0.858−0.065−0.135−0.3660.036
Shipping brokerage services0.5070.052−0.6170.333−0.199
Ship management services0.6370.1360.210−0.2390.468
Ship premium income0.777−0.4460.097−0.036−0.238
GDP0.6050.508−0.159−0.1630.231
Foreign trade dependence0.815−0.4360.0720.064−0.031
Maritime arbitration services0.782−0.495−0.050−0.145−0.201
Ship engineering and repair service0.4160.6230.3770.397−0.156
Table 3. Port competitiveness dynamics under FTZ.
IndicatorsGuangxiHainanHebeiJiangsuLiaoningShandongZhejiangMean
CPCS0.06460.0713−0.00630.0071−0.03840.03330.00200.0191
PIEE−0.0569−0.00430.0076−0.01210.01520.01970.0274−0.0005
DMPS0.03830.06320.13460.05210.04420.00700.10600.0636
PPTS0.10650.06290.06720.14560.04530.14430.23910.1159
MEC0.09330.19480.06410.21610.06720.18170.13470.1360
PC0.00240.00530.00080.0017−0.00030.00130.00260.0020
Table 4. Port competitiveness dynamics under port integration.
IndicatorsFujianGuangdongGuangxiHainanHebeiJiangsuLiaoningShandongMean
PCSS−0.02580.02540.06460.0166−0.0063−0.0031−0.03840.03330.0083
PIEE0.03360.0471−0.0569−0.03010.00760.04860.01520.01970.0030
DMPS0.0318−0.03090.03830.00310.13460.06800.04420.00700.0370
PPTS0.0575−0.01950.10650.10900.06720.05030.04530.14430.0701
MEC0.13270.07780.09330.08220.0641−0.07870.06720.18170.0775
PC0.00020.00070.00240.00020.00080.0001−0.00030.00130.0007
Disclaimer/Publisher’s Note: The statements, opinions and data contained in all publications are solely those of the individual author(s) and contributor(s) and not of MDPI and/or the editor(s). MDPI and/or the editor(s) disclaim responsibility for any injury to people or property resulting from any ideas, methods, instructions or products referred to in the content.

