Article

CEO Pay Caps, Political Promotion Incentives, and Green Innovation: Evidence from Chinese Publicly Listed Firms

1
School of Economics and Management, Tongji University, Shanghai 200092, China
2
Research institute of Economics and Management, Southwestern University of Finance and Economics, Chengdu 611130, China
3
Changjiang Waterway Bureau, Wuhan 430010, China
*
Author to whom correspondence should be addressed.
Sustainability 2025, 17(12), 5504; https://doi.org/10.3390/su17125504
Submission received: 20 April 2025 / Revised: 29 May 2025 / Accepted: 12 June 2025 / Published: 14 June 2025
(This article belongs to the Section Sustainable Management)

Abstract

Based on the Chinese government’s regulation that imposes a pay cap on the CEOs of state-owned enterprises (SOEs), we investigated how a change in institutional conditions affects firms’ green innovation. Drawing on the career concern theory, we suggest that political promotion incentives are likely to substitute for monetary incentives and influence these CEOs’ decisions and actions because the regulation reduces not only their current but also their future monetary incentives. Given that Chinese governments strongly encourage SOEs to engage in green innovation to solve environmental problems, CEOs who are more successful in this respect can demonstrate a higher level of alignment with government objectives and thus have better chances of political promotion. Therefore, we hypothesized that CEOs of SOEs generate more green innovation than CEOs of privately owned firms. We further argued that the positive relationship between the pay cap regulation and SOE green innovation is stronger in the case of CEOs with political connections and weaker in the case of younger CEOs and CEOs of firms in more munificent industries. Difference-in-difference analyses of a panel dataset including 11,061 firm–year observations of 1549 firms provide support for our hypotheses. Our study contributes to the literature on why and how institutional conditions affect firms’ green innovation. Moreover, our results imply the huge potential of the government in encouraging SOEs to promote green technology development, considering the critical incentivizing role of the political promotion concern of CEOs of SOEs.

1. Introduction

The need to address grand challenges such as environmental issues has attracted considerable attention from policymakers, business practitioners, and researchers across disciplines [1,2,3]. Environmental issues transcend national borders and exert adverse effects on large numbers of people, communities, and the planet as a whole. One of the most promising avenues for addressing environmental issues is green innovation [4,5,6,7]. Green innovation, defined as the development of products, processes, and services aimed at reducing negative environmental externalities, is considered an effective way to improve environmental performance and achieve environmental sustainability [8]. With economic development, the Chinese government puts great emphasis on promoting environmental protection. Recently, China has committed to achieving carbon neutrality by 2060, calling for dedicated investment in clean energy projects and technology development [9]. Because of a series of policies promoting green innovations, the country has become one of the leading green-investment economies [10]. On top of the institutional forces on resource provision and increased regulatory scrutiny, such as the actions of other leading green economies, there is another crucial incentivizing factor that determines the prominent green innovation outputs of Chinese firms, especially SOEs.
In 2015, the State-Owned Assets Supervision and Administration Commission (SASAC) introduced a pay cap regulation for CEOs of all Chinese state-owned enterprises (SOEs). The primary purpose of the regulation is to enhance the CEO–employee compensation equality within SOEs by limiting the compensation of CEOs. However, unintended consequences have emerged due to the dual-track nature of CEOs in Chinese SOEs [11]. In particular, once the business track is constrained by a sharp decrease in compensation, they may abandon the pursuit of the business track and turn to the political track, to be promoted as a Party leader. In this sense, CEOs of SOEs may take actions to show their loyalty to the government by way of pro-environmental tools, for instance.
We thus investigated how the pay cap regulation affects firms’ green innovation. To develop our arguments, we drew on the career concern theory, which suggests that career concern incentives can substitute for monetary incentives as motivators of CEOs’ decisions and actions, especially when monetary incentives are constrained or limited by factors such as organizational policies, industry norms, and economic conditions [12,13]. In particular, the pay cap regulation reduces not only the current but also the future monetary incentives of SOE CEOs [14]. Consequently, as the career concern theory suggests, career concern incentives are likely to substitute for monetary incentives, influencing these CEOs’ decisions and actions. One of the most salient career concern incentives of SOE CEOs is political promotion [11,15]. Thus, we expected political promotion incentives to substitute for monetary incentives. Given that Chinese governments strongly encourage SOEs to engage in green innovation to solve environmental problems, CEOs who are more successful in this respect demonstrate a higher level of alignment with government objectives and thus have better chances of political promotion. Therefore, we hypothesized that SOE CEOs generate more green innovation than CEOs of privately owned firms.
Furthermore, the career concern theory suggests that the extent to which career concern incentives substitute for monetary incentives varies with the available opportunities for career advancement or for mitigating constraints on monetary incentives [16,17]. Drawing on this idea, we posited that such opportunities affect the relationship between the pay cap regulation and green innovation. Accordingly, we identified factors likely to affect SOE CEOs’ opportunities to pursue career advancement or monetary rewards and explored the moderating effects of these factors.
Based on the career concern theory, we identified three moderators: political connections, CEO age, and industry munificence. As SOE CEOs with political connections have more opportunities for career advancement [15,18,19,20], we suggest that among SOE CEOs, CEOs with political connections are likely to generate more green innovation. Furthermore, younger CEOs and CEOs working in more munificent industries have more opportunities to pursue monetary rewards [21,22,23,24]. Thus, we argue that, among SOE CEOs, younger CEOs and CEOs working in more munificent industries are less likely to generate more green innovation.
The empirical context of our study is the pay cap regulation for SOE CEOs, which was introduced by the SASAC in 2014 and came into effect in 2015. Compared with 2014, the average salary of SOE CEOs was reduced by 30,000 RMB in 2015 [14]. The regulation also limited these CEOs’ future monetary incentives since their pay was unlikely to grow, at least in the short term. Thus, this regulation offers a particularly relevant empirical context for examining whether limiting CEOs’ monetary incentives can motivate them to pursue political promotion by engaging in green innovation. To this end, we performed difference-in-difference (DID) analyses of 11,061 firm–year observations of 1549 firms. The estimation method provided two comparisons: the first is the output difference of green innovation between SOEs and non-SOEs, and the second is the output difference before and after the regulation. The estimation results provide support for our hypotheses.
Our study makes three important contributions. First, although it has been acknowledged that institutional conditions can influence firms’ green innovation [25,26,27], we drew on the career concern theory to develop a more nuanced framework to understand whether and why changes in institutional conditions lead to changes in firms’ green innovation. Second, we identified CEOs’ career concerns as critical antecedents of green innovation, extending the literature on CEO characteristics (e.g., gender, hometown identity, and experience working abroad) as antecedents of green innovation [27,28,29]. Third, we contributed to the research on the role of CEOs’ career concerns by focusing on green innovation—a hitherto unexplored outcome.
The paper is structured as follows. In Section 2, we introduce the background, details, and direct outcomes of the pay cap regulation introduced in 2015. Then, in Section 3, we analyze the research question through the career concern theory and develop our hypotheses. Next, in Section 4 and Section 5, we describe the estimation method and analyze the estimation results. Finally, we add the discussion part to conclude the study.

2. Institutional Background

2.1. Chinese SOEs’ CEOs’ Monetary and Political Promotion Incentives

The career concern theory provides a framework for understanding the motivations of individuals in organizations, emphasizing both monetary and career concern incentives as key behavioral drivers [13,28]. The core aspect of career concern theory is the recognition that individuals’ behaviors are driven not only by monetary but also by career concern incentives, which are related to future career prospects, such as career advancement, job opportunities, and professional development [28,29].
Similarly to their counterparts in U.S. firms, Chinese SOEs’ CEOs consider both monetary and career concern incentives when making strategic decisions [30]. However, a significant career concern incentive for Chinese SOEs’ CEOs, which U.S. CEOs do not have, is political promotion [12]. Unlike the U.S., which has an active external managerial labor market, CEOs of Chinese SOEs are more concerned about assessment by governments, which provides them with a strong incentive to increase their chances of political promotion, an upward move from managerial to political positions either within their firms or in governments [31,32].
Chinese SOEs’ CEOs have dual career tracks: as business managers and as politicians [11]. As business managers, their primary responsibility is to manage SOEs that compete in the market. Thus, they have monetary incentives based on evaluations conducted by governments [33]. As politicians, they can be promoted to political positions [12,31], which accord them greater political status and power [34]. The authors in [12] provide two classic examples of SOE CEOs obtaining positions as political leaders. One example is Wu Yi, the CEO of Beijing Yanshan Petrochemical Corporation, who was promoted to vice-mayor of Beijing and later to vice-premier of the State Council. Another example is Jia Qinglin, the CEO of China Machinery Engineering Corporation, who was appointed to the Politburo Standing Committee of the Chinese Communist Party in Fujian Province and, ultimately, to the national Politburo Committee.

2.2. Pay Cap Regulation for Chinese SOEs’ CEOs

The CEO-to-employee pay ratio in SOEs reached 17:1 in 2011 [35]. By nature, SOEs are controlled by governments and must fulfill the social objectives set by them [36]. One prominent social objective of SOEs is to promote social equality. However, a high CEO-to-employee pay ratio in SOEs strongly suggests social inequality [33]. For this reason, the SASAC issued an SOE CEO pay cap regulation in 2014. All Chinese SOEs are subject to the regulation. Compared with the average pay in 2014, the average pay of SOE CEOs in 2015 was reduced by 30,000 RMB [14]. In addition, the regulation limited their future pay. By imposing a pay cap, this regulation restricts the monetary rewards that CEOs can receive based on their performance or the financial success of their firms.

2.3. Comparison of the Incentives Used in Policies in the Leading Green Economies

The institutional environment is one of the most crucial aspects of enhancing firms’ green innovation outputs. In particular, there are two streams of institutions facilitating green innovations. The first stream focuses on resource provision. For example, in Europe, green financing aims to provide the resources necessary for firms to initiate energy-saving actions [37]. Consequently, some countries choose to improve their financial supporting institutions, such as by increasing green bonds and building long-term financial unions. Second, in the U.S., threatened by the regulatory power, the noncompliance cost drives firms to adopt a longer horizon and increase green innovation accordingly [25], as exemplified by the U.S. Environmental Protection Agency’s (EPA) TRI (Toxic Release Inventory) program [25].
By comparison, the setting of the Chinese institutional forces includes not only the resource provision system and regulatory power, which are generally found around the world, but also the particular incentivizing tools for CEOs of SOEs. As discussed above, the CEOs of SOEs have dual tracks in their careers [11]. Importantly, the incentives of the dual tracks can substitute for each other once one of them is constrained. As the pay cap was enacted, the monetary rewards of CEOs of SOEs were strongly lowered, which almost blocked the business track. On the basis of the political promotion as the CEOs’ primary career concern, they are inclined to be aligned with the government’s pro-environmental objectives by engaging in the research and development of energy-saving and emission reduction technologies.

3. Hypotheses

3.1. Pay Cap Regulation and Firms’ Green Innovation

The career concern theory offers valuable insights into the interplay between the monetary and career concern incentives of individuals within organizations [13]. According to this theory, while monetary incentives traditionally play a central role in motivating individuals, career concern incentives can substitute for monetary incentives. When monetary incentives are insufficient or are constrained, individuals may be motivated more by career concern incentives [38]. They may be encouraged to pursue opportunities for career advancement, such as new responsibilities or promotion. Even if monetary incentives are limited, the prospect of advancing one’s career and achieving a higher status can serve as a powerful motivator. For example, in organizations in which salaries are capped or financial incentives are relatively weak, individuals may place greater importance on opportunities for career advancement and invest in developing skills, broadening their knowledge, and undertaking challenging tasks to enhance their qualifications and increase their chances of promotion [39].
According to the career concern theory, Chinese SOEs’ CEOs may be more motivated by career concern incentives since the pay cap regulation constrains monetary incentives. As noted above, for these CEOs, political promotion is one of the most salient career concern incentives because it offers opportunities for long-term career advancement within the political system [12]. Being promoted to a political leader or a government official represents a significant career advancement, as it confers superior political status and power [11]. Thus, when monetary incentives are constrained, the political promotion incentive is highly likely to shape CEOs’ decisions, actions, and strategic priorities [12,34]. In particular, by aligning their actions with government objectives and policies, CEOs can signal their commitment, thereby increasing their chances of political promotion.
In 2013, the SASAC issued measures for assessing the performance of SOEs, stating that “rewards shall be granted to those with excellent performance and outstanding achievements in scientific and technological innovation, … environmental protection, energy conservation, and emission reduction.” These measures placed considerable emphasis on innovation and environmental protection. Green innovation, which can be applied to firms’ products, services, and processes, has been demonstrated to minimize negative environmental impacts [40]. Thus, it is highly encouraged by governments. Governments have also implemented policies aimed at encouraging SOEs to engage in green innovation to tackle urgent environmental problems [41]. For SOE CEOs, allocating more resources to green innovation manifests their efforts to align their actions with government objectives, enhancing their chances of political promotion.
Based on the above discussion, we suggest that SOE CEOs whose monetary incentives are constrained by the pay cap regulation tend to pursue political promotion. To this end, they may actively engage in green innovation. Accordingly, we put forward the following hypothesis:
Hypothesis 1.
The pay cap regulation is positively related to SOEs’ green innovation.

3.2. Moderating Analyses

As previously noted, the career concern theory suggests that career concern incentives can substitute for monetary incentives, especially when the latter are constrained. The theory also posits that the extent to which career concern incentives substitute for monetary incentives varies with the available opportunities for career advancement or monetary rewards [16,17]. Drawing on this idea, we identified three factors that are likely to affect SOE CEOs’ opportunities for career advancement or monetary rewards and explored the moderating effects of these factors. One moderator is political connections. SOE CEOs with political connections have more opportunities for career advancement [15,18,20,34]. The other two moderators are CEO age and industry munificence. Younger CEOs and CEOs in more munificent industries have more opportunities to obtain monetary rewards because they have more chances of moving to firms that are not subject to the pay cap regulation [21,22,23,24]. By doing so, they can free themselves from monetary incentive constraints and have more opportunities to pursue monetary rewards. In the following subsections, we discuss how these three factors moderate the relationship between the pay cap regulation and green innovation.

3.2.1. Moderating Effect of CEOs’ Political Connections

Based on the mechanism of the main effect, we argue that the higher probability of CEOs’ career advancement can motivate them to pursue political promotion to a greater extent. Hence, we focused on the moderating effect of political connections.
Political connections, also known as political ties, indicate personal connections between corporate top managers and political actors. Most studies in management determine political connections as the connections formed by managers serving officially in government organizations, currently or previously [18].
In reality, some CEOs in China have political connections [42]. CEOs’ political connections enable firms to obtain privileges from governments, such as subsidies [43], government contracts [44], and low tax rates [45]. More importantly, political connections signify close relationships with governments. CEOs with political connections enjoy political superiority over those without such connections [18,19,20]. In particular, such connections can amplify the benefits accrued to the CEOs of SOEs that present a satisfying performance [15].
CEOs’ tendency to substitute monetary incentives for political promotion incentives may be reinforced when they believe that they have a better chance of being promoted [46]. Thus, when monetary incentives are constrained, CEOs with political connections are more motivated by political promotion incentives than those without such connections. Therefore, among SOE CEOs, those with political connections are likely to generate more green innovation as a means of pursuing political promotion. Accordingly, we put forward the following hypothesis:
Hypothesis 2.
The positive relationship between the pay cap regulation and SOEs’ green innovation is stronger for CEOs with political connections.

3.2.2. Moderating Effect of CEO Age

As mentioned above, under conditions of monetary incentive constraints, SOE CEOs are likely to place more emphasis on career concern incentives, such as political promotion. However, this tendency may be weakened if these CEOs have other opportunities to mitigate constraints on monetary incentives [16,17]. One possible way to achieve this is to move to a firm that is not subject to the pay cap regulation (i.e., a privately owned firm). For example, in 2013, Yibing Zhai, at the age of 50, quit his position as CEO of a subsidiary of China Unicom (a large telecommunications SOE) to become the CEO of Shenzhou Taiyue, a privately listed telecommunications firm, for an annual salary of 3 million RMB. By comparison, the salary of the top-paid person in China Unicom did not reach 900,000 RMB until 2019.
Younger CEOs have more opportunities to be employed in privately owned firms. According to the studies on CEO age and their decision-making [47,48,49], CEOs under 60 years of age present a higher probability of exiting the current business and pursue employment in privately owned firms, while those over 60 years of age are less likely to do so [21,22]. Thus, younger SOE CEOs are less motivated to pursue political promotion by engaging in green innovation. In contrast, relatively older CEOs are more motivated to engage in green innovation as a means of political promotion since they have fewer opportunities to move to privately owned firms. Accordingly, we put forward the following hypothesis:
Hypothesis 3a.
The positive relationship between the pay cap regulation and SOEs’ green innovation is weaker for younger CEOs.

3.2.3. Moderating Effect of Industry Munificence

The other possible factor that influences the outside job opportunities of CEOs of SOEs is industry munificence. Industry munificence, which refers to the level of resources in an industry available to firms, can profoundly impact firms’ survival and growth [50,51]. More munificent industries can offer more growth opportunities for firms and more job opportunities for CEOs [23,24,52].
Since SOE CEOs in more munificent industries have more opportunities to move to privately owned firms, they are less motivated to pursue political promotion by engaging in green innovation. In contrast, because SOE CEOs in less munificent industries have fewer opportunities to move to privately owned firms, they are more motivated to engage in green innovation as a means of political promotion. Accordingly, we put forward the following hypothesis:
Hypothesis 3b.
The positive relationship between the pay cap regulation and SOEs’ green innovation is weaker for CEOs in more munificent industries.

4. Method

4.1. Data Sources and Sample

Our initial sample consisted of all publicly listed Chinese firms in the manufacturing sector. Manufacturing firms have long been criticized for negative environmental externalities, such as inefficient resource utilization, water contamination, and greenhouse gas emissions [53]. Consequently, governments and other stakeholders demand better environmental performance [54]. One of the most common ways for manufacturing firms to respond to this pressure is to engage in green innovation [55,56]. Because firms in other industries (e.g., finance, services, and wholesale) cause fewer environmental problems and thus seldom engage in green innovation, we focused on manufacturing firms.
We collected data from two sources. First, we collected data on firms’ green innovation from the patent database of the Chinese National Intellectual Property Administration. We identified patents related to green innovation based on the International Patent Classification (IPC) Green Inventory [57,58]. Second, we collected firm-level data from the China Stock Market and Accounting Research database. We merged the two datasets and removed observations with missing data, obtaining a panel data sample of 11,061 firm–year observations consisting of 535 firms in the treatment group and 1014 firms in the control group.

4.2. Measures

Dependent variables (DVs). Because green patents desribe useful and nonobvious inventions that contribute to environmental sustainability, we used such data to measure green innovation (GI) [25]. We created two indicators of green innovation: the number of green patent applications (GI_apply (log)) and the number of granted green patents (GI_grant (log)). These numbers were coded as 0 if a firm had no relevant records. Because the indicator data were highly skewed, we used log-transformed values (log(1 + GI)) in our empirical analysis [59,60].
Independent variable (IV). The independent variable was a dummy variable (regulation) that indicated whether a firm was an SOE affected by the pay cap regulation and whether the observation was from a time after 2014. The variable equaled 1 if a firm satisfied both criteria and 0 otherwise.
Moderating variables. First, political connections are a dummy variable that was coded as 1 if a CEO served or had previously served in a government, the military, the National People’s Congress, or the Chinese People’s Political Consultative Conference and coded as 0 otherwise [61]. Second, CEO_young was a dummy variable that equaled 1 if a CEO was under 60 years of age and 0 otherwise. According to [7,50], Chinese CEOs under 60 years of age have many more career concern incentives than those over 60 years of age. Third, munificence was measured as the average growth in industry sales over the previous five years [62,63].
Control variables. We controlled for several firm-level variables that could influence firms’ green innovation: return on assets (ROA), leverage, firm listing age, firm size, board size, board independence, shares of the largest shareholder (largest investor), R&D intensity, CEO tenure, CEO duality, and CEO gender. ROA is the ratio of net income to total assets. Leverage is the ratio of long-term debt to equity. Firm listing age is the natural logarithm of the number of years since the year when the firm was publicly listed. Firm size is the natural logarithm of total assets. Board size is the log-transformed number of directors on the firm’s board. Board independence is the proportion of independent directors. Shares of the largest shareholder denote the shares owned by the firm’s largest shareholder. R&D intensity is the ratio of R&D expenditures to sales. CEO tenure is the number of years during which the CEO has held the position. CEO duality is a dummy variable that equals 1 if the CEO is also the chairperson of the board or 0 otherwise. CEO gender is a dummy variable that equals 1 if a CEO is female or 0 otherwise.

4.3. DID Estimation Model

To empirically test our hypotheses, we employed the DID method [64]. Specifically, we compared the difference in green innovation before and after the introduction of the pay cap for SOEs (treatment group) with the corresponding difference for firms that are not affected by the regulation but are otherwise similar (control group). Then, we estimated the impact of the pay cap regulation on green innovation using the following regression formula:
      G I i t = α i + α l α t + β 1   r e g u l a t i o n i t + β 2     m o d e r a t o r s r e g u l a t i o n + λ Σ c o n t r o l s i t + ε i t
where i denotes the firm, t is the year, and α i , α t , and α l α t are the firm, year, and industry-by-year fixed effects, respectively. The dependent variable is G I i t . The independent variable ( r e g u l a t i o n i t ) is a dummy variable indicating whether firm i is a treated firm after the introduction of the pay cap regulation in year t. The moderators are CEO_young, industry munificence, and political connections. The controls are the vectors of all the control variables and ε i t is the error term. We clustered the standard errors at the industry-year level, considering heteroskedasticity and serial correlation within the same industry per year [65,66]. To avoid estimation bias caused by extreme values, we winsorized all the continuous variables at the 1% and 99% levels. Finally, the coefficient of interest is β 1 , which captures the difference in green innovation in the treatment group relative to the control group after the introduction of the pay cap.

5. Results

5.1. Descriptive Statistics and Correlations

Table 1 presents the descriptive statistics and correlations of the variables used in this study. To check for harmful multicollinearity, we calculated variance inflation factors (VIFs). The mean VIF was 1.23 and the maximum VIF was 1.60. Since they were less than 10, we concluded that multicollinearity was unlikely to bias our regression results [67].

5.2. Main Effects

Table 2 presents the main results of the DID estimation.
Number of green patent applications as the dependent variable. In Models (1)–(3), the dependent variable ( G I i t ) was measured using the number of green patent applications. Model (1) included only the independent variable ( r e g u l a t i o n i t ) and all the fixed effects. As expected, the coefficient of regulation was positive and significant ( β = 0.047, p < 0.1). Model (2) included all the control variables in addition to the independent variable ( r e g u l a t i o n i t ). The coefficient of regulation remained positive and significant (β = 0.063, p < 0.05). Thus, both Models (1) and (2) support Hypothesis 1, according to which the pay cap regulation is positively related to SOEs’ green innovation. Using the results of Model (2), we computed the economic effect and found that the number of green patent applications was 6.3% higher after the introduction of the regulation.
In Model (3), we assessed the dynamics of the treatment effect. To do so, we replaced the independent variable ( r e g u l a t i o n i t ) with a set of nine dummy variables indicating the four pre-treatment years (pre_4, pre_3, pre_2, and pre_1); the treatment year (current); and the first, second, third, and fourth post-treatment years (post_1, post_2, post_3, and post_4). The coefficients of all the pre-treatment dummies (pre_4, pre_3, pre_2, and pre_1) were relatively small and insignificant at the 0.1 significance level, indicating that there was no preexisting trend in the data. More importantly, we found positive and significant effects in the treatment year (β = 0.109, p < 0.01) and in the first (β = 0.061, p < 0.1), second (β = 0.074, p < 0.1), and third (β = 0.163, p < 0.01) post-treatment years. However, the effect becomes insignificant in the fourth post-treatment year (β = 0.035, p > 0.1), suggesting that the influence of the pay cap regulation may last only three years.
Number of granted green patents as the dependent variable. In Models (4)–(6), the dependent variable ( G I i t ) was measured using the number of granted green patents. Model (4) included only the independent variable ( r e g u l a t i o n i t ) and all the fixed effects. As expected, the coefficient of regulation was positive and significant (β = 0.030, p < 0.1). Model (5) included all the other control variables in addition to the independent variable ( r e g u l a t i o n i t ). The coefficient of regulation was still positive and significant (β = 0.058, p < 0.01). Thus, both Models (4) and (5) support Hypothesis 1. Using the results of Model (5), we computed the economic effect and found that the number of granted green patents was 5.8% higher after the introduction of the pay cap regulation.
In Model (6), we assessed the dynamics of the treatment effect. The empirical specification was the same as in Model (3). The coefficients of all pre-treatment dummies (pre_4, pre_3, pre_2, and pre_1) were relatively small and insignificant at the 0.1 significance level, suggesting that there was no pre-existing significant difference between the treatment and control groups in our data. More importantly, we found insignificant effects in the treatment year (β = 0.055, p > 0.1) and in the first (β = 0.021, p > 0.1), second (β = 0.025, p > 0.1), and third (β = 0.048, p > 0.1) post-treatment years. However, the positive effect became significant in the fourth post-treatment year (β = 0.085, p < 0.05). Given that the treated firms started to submit more green patent applications in the treatment year, as shown in Model (3), the dynamics of green innovation grants suggested that applications translated into more granted green patents after three to four years. This is consistent with the innovation lag reported in previous studies [68,69] and with the fact that in China, there is an interval of two to four years between the time a patent application is submitted and the time the patent is granted [70].

5.3. Moderating Effects

Table 3 presents the results of the moderating effects.
Number of green patent applications as the dependent variable. In Models (1)–(3), the number of green patent applications was the dependent variable. Model (1) tested the moderating effect of political connections. The interaction between the regulation and political connections was positive and significant (β = 0.193, p < 0.05), suggesting that the positive relationship between the pay cap regulation and the number of green patent applications was stronger for SOE CEOs with political connections. Therefore, Hypothesis 2 is supported. With other variables maintained at their means and the value of political connections changed from 0 to 1, the magnitude of the main effect of the regulation on the number of green patent applications increased by approximately 136%.
Model (2) tested the moderating effect of CEO age. The interaction between the regulation and CEO_young was negative and significant (β = −0.263, p < 0.05), suggesting that the positive relationship between the pay cap regulation and the number of SOEs’ green patent applications was weaker for younger CEOs. Therefore, Hypothesis 3a is supported. With other variables maintained at their means and the value of CEO_young changed from 0 to 1, the magnitude of the main effect of the regulation on the number of green patent applications decreased by about 138%.
Model (3) tested the moderating effect of industry munificence. The interaction between the regulation and industry munificence was negative and significant (β = −0.865, p < 0.01), suggesting that the positive relationship between the pay cap regulation and the number of SOEs’ green patent applications was weaker for CEOs working in more munificent industries. Therefore, Hypothesis 3b is supported. With other variables maintained at their means and the value of industry munificence increasing from one standard deviation (SD) below the mean to one SD above the mean, the magnitude of the main effect of the regulation on the number of green patent applications decreased by about 20%.
Number of granted green patents as the dependent variable. In Models (4)–(6), the number of green patent applications was the dependent variable. Model (4) tested the moderating effect of political connections. The interaction between the regulation and political connections was positive and significant (β = 0.147, p < 0.01), suggesting that the positive relationship between the pay cap regulation and the number of green patents granted to SOEs was stronger for CEOs with political connections. Therefore, Hypothesis 2 is supported. With other variables maintained at their means and the value of political connections changed from 0 to 1, the magnitude of the main effect of the regulation on the number of granted green patents increased by about 89%.
Model (5) tested the moderating effect of CEO age. The interaction between the regulation and CEO_young was negative and significant (β = −0.319, p < 0.01), suggesting that the positive relationship between the pay cap regulation and the number of green patents granted to SOEs was weaker for younger CEOs. Therefore, Hypothesis 3a is supported. With other variables maintained at their means and the value of CEO_young changed from 0 to 1, the magnitude of the main effect of the regulation on the number of granted green patents decreased by about 51%.
Model (6) tested the moderating effect of industry munificence. The interaction between the regulation and industry munificence was negative and significant (β = −0.445, p < 0.1), suggesting that the positive relationship between the pay cap regulation and the number of green patents granted to SOEs was weaker for CEOs working in more munificent industries. Therefore, Hypothesis 3b is supported. With other variables maintained at their means and the value of industry munificence increasing from one SD below the mean to one SD above the mean, the magnitude of the main effect of the regulation on the number of granted green patents decreased by about 13%.

5.4. Supplementary Analysis and Robustness Check

5.4.1. Excluding Firms with No Green Patent Applications

In the main analyses, we included firms with no green patent applications and, consequently, no granted green patents (about 50.7% of the sample). However, including these firms may have biased the results. To address this concern, we excluded these firms and performed the analyses again. The results are presented in Table 4 (Models (1)–(8)). Overall, the results were consistent with those of the main analyses, except for the moderating role of industry munificence, which was still negative but insignificant (GI_apply(log) [DV]: β = −0.999, p > 0.1; GI_grant(log) [DV]: β = −0.466, p > 0.1). The negative interactions remained unchanged. In other words, the results were mostly robust when firms with no green patent applications were excluded.

5.4.2. Addressing Confounding Effects
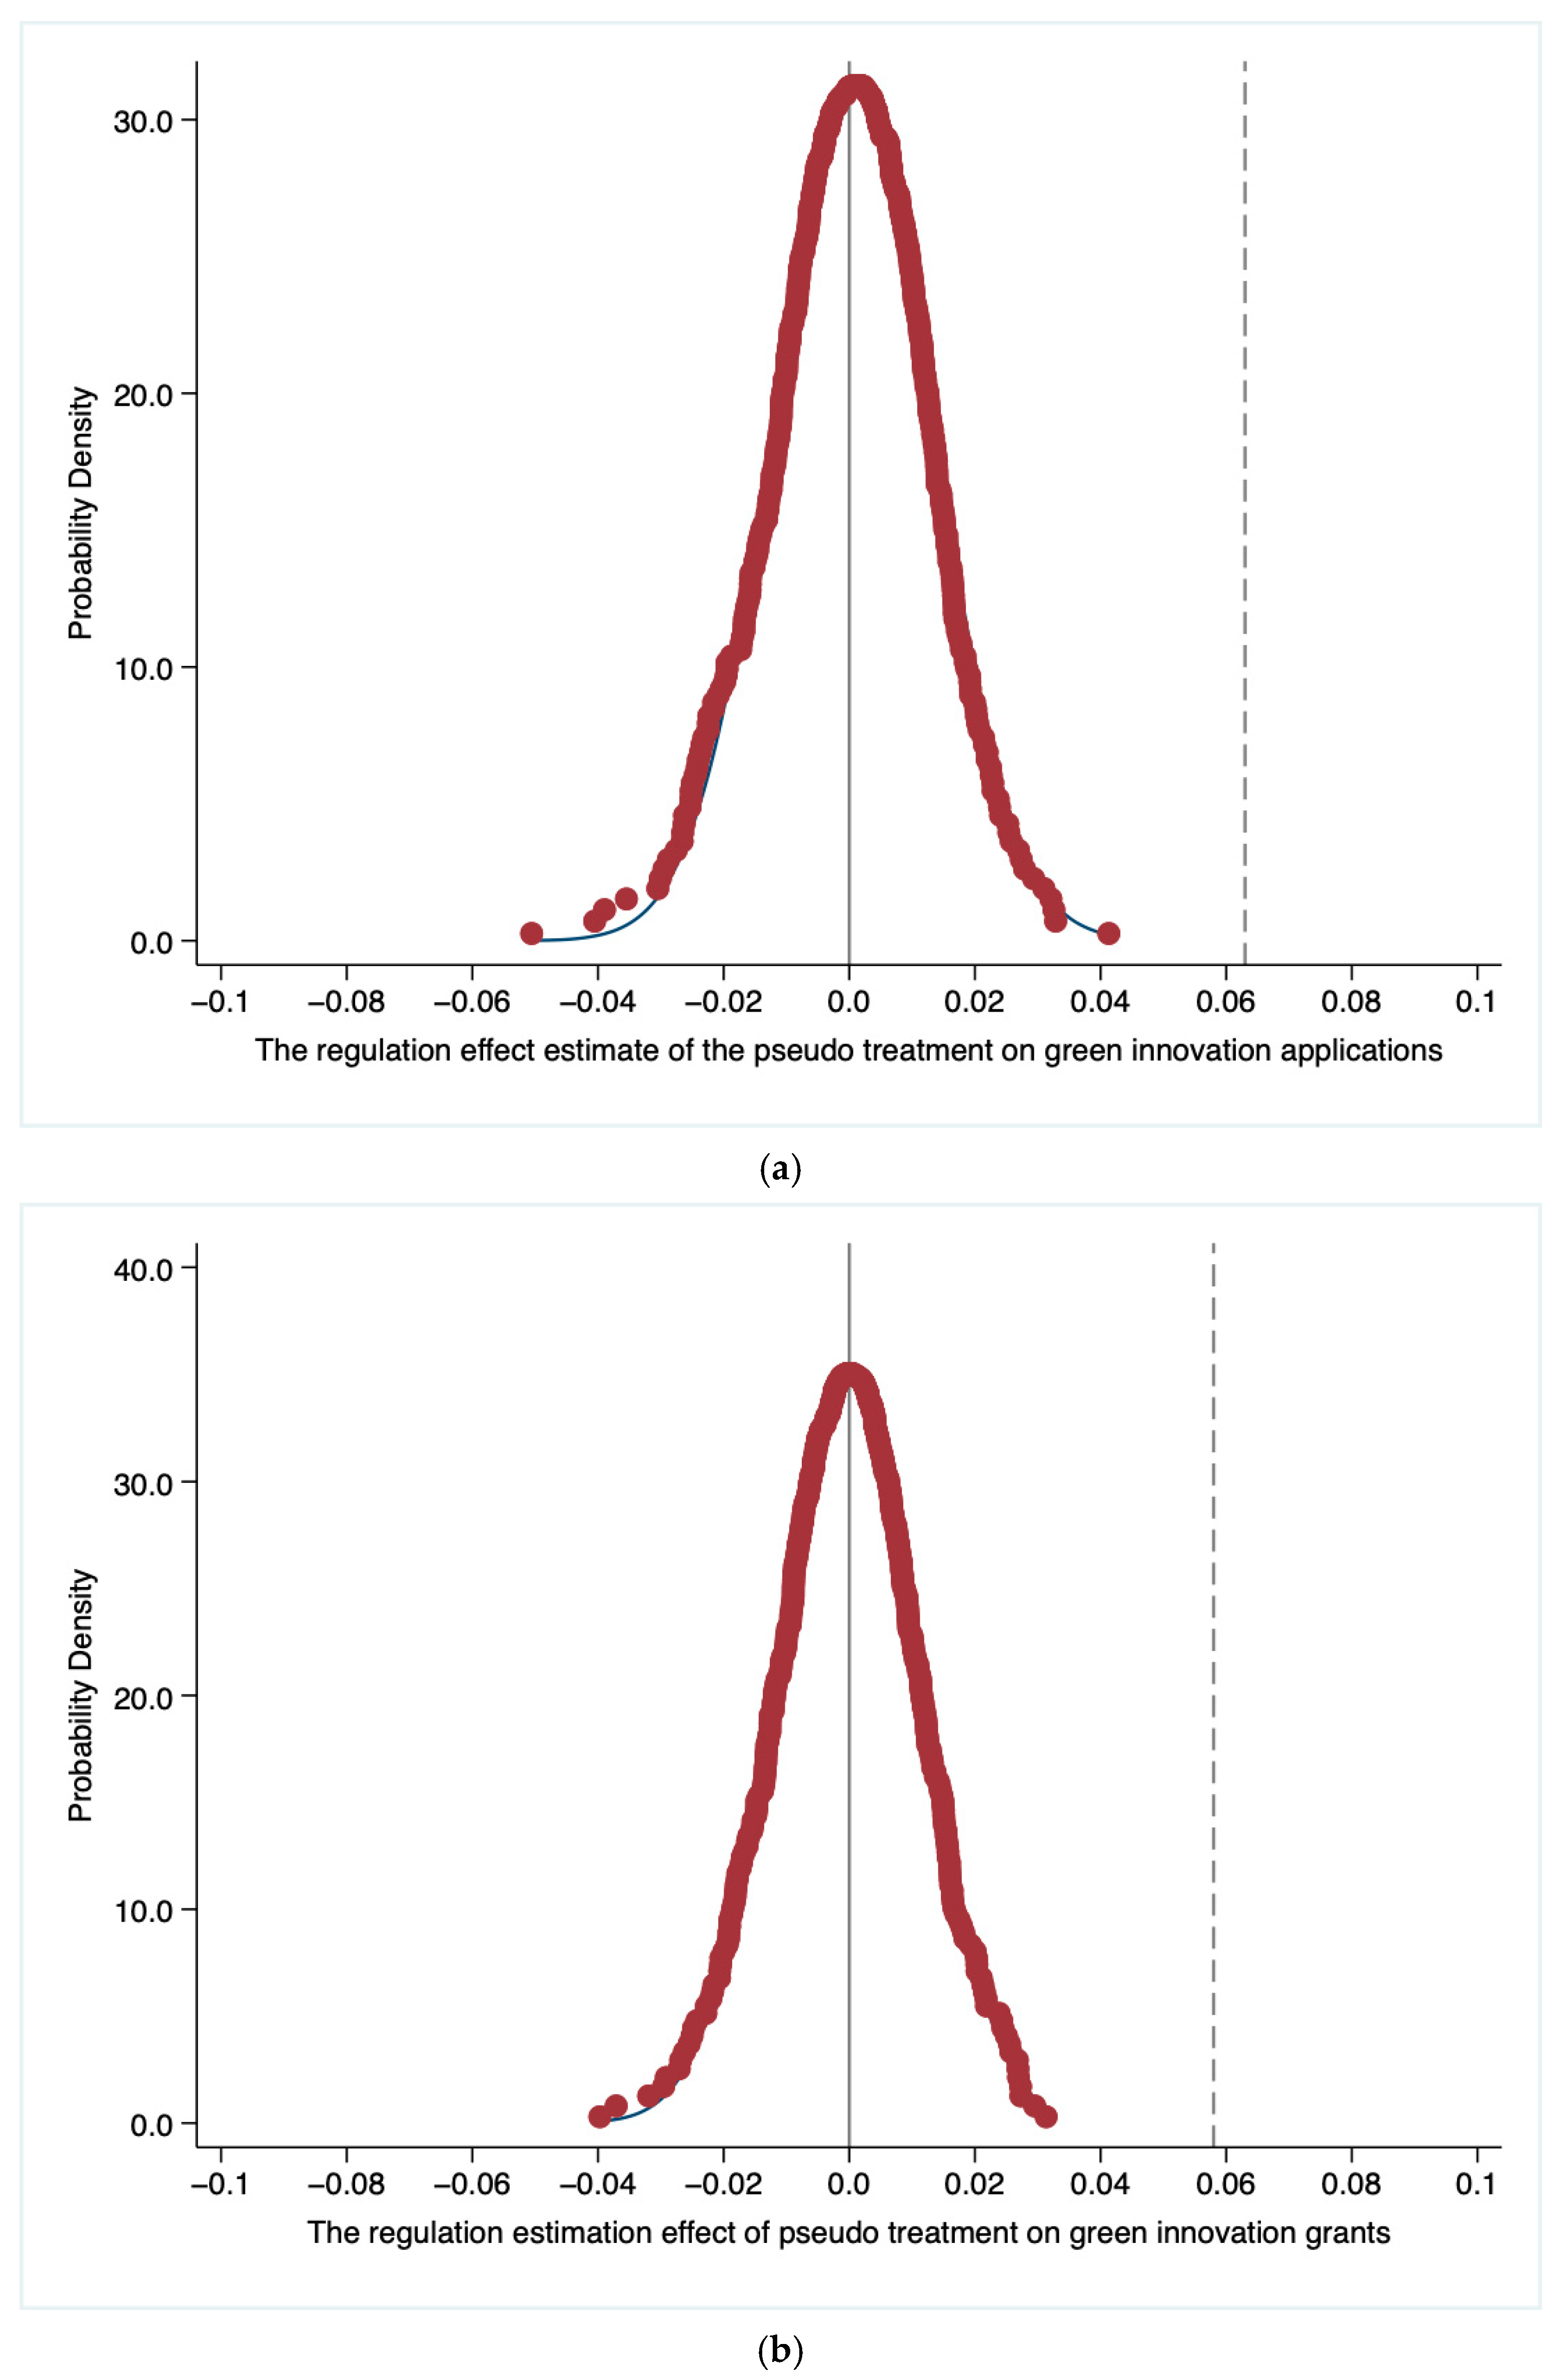
Other governmental policies may stimulate SOEs’ green innovation, producing confounding effects. For example, in 2010, the National Development and Reform Commission implemented a low-carbon policy in pilot cities. Firms based in these cities may engage in green innovation more actively to reduce carbon emissions. Therefore, we used low_carbon as a dummy variable that equaled 1 if a firm was based in a city subject to the low-carbon policy after 2010 or 0 otherwise. Moreover, in 2012, the National Development and Reform Commission introduced a carbon emission trading policy into pilot cities. Firms based in these cities may generate more green innovation to reduce carbon emissions. Therefore, we used trading as a dummy variable that equaled 1 if a firm was based in a city subject to the carbon emission trading policy after 2012 or 0 otherwise. We used the two dummy variables as additional control variables. The results are presented in Table 5 (Models (1)–(8)). Overall, the results were consistent with the main analyses, except for the moderating role of CEO age in Model (7), which was still negative but insignificant (β = −0.095, p > 0.1). The negative interactions remained unchanged.

5.4.3. Placebo Test

Besides the governmental policies noted above, unobservable factors may also influence the relationship between the pay cap regulation and firm innovation. Following [71], we used a placebo test to evaluate the robustness of our results. We generated a placebo treatment by randomly reassigning the observations in our sample to the treatment and control groups and re-estimated the baseline model specified in Equation (1). We replicated the procedure 1000 times and stored the estimated coefficients of interest. The distribution of the coefficients is shown in Figure 1a,b. For example, Figure 1a shows that the average coefficients were around 0 for the number of green patent applications as the dependent variable. Figure 1b shows a similar pattern for the number of granted green patents as the dependent variable. Thus, the results of the placebo test rule out the possibility that other, unobservable factors drive the relationship between the pay cap regulation and green innovation, suggesting that our main results are reliable.

6. Conclusions

This study provides empirical evidence of a positive relationship between the pay cap regulation and green innovation output in Chinese SOEs. The relationship appears to be stronger when the CEO possesses political connections and weaker when the CEO is younger or when the CEO operates in a munificent industry. If it is assumed that many CEOs of SOEs are driven by political promotion incentives, the consequences of such incentives for SOEs’ strategic decision-making and outcomes would clearly be significant and worthy of further research.

6.1. Theoretical Implications

Our study has important theoretical implications. First, we contribute to the literature on the relationship between institutional conditions and firms’ green innovation [10,25,38]. Relying on the career concern theory, we suggest that the pay cap regulation can influence green innovation, thereby providing a more nuanced framework for understanding whether and why changes in institutional conditions lead to changes in firms’ green innovation. We show that when such changes, for example, the introduction of the pay cap regulation, constrain certain incentives for CEOs, these incentives are likely to be replaced by other incentives as drivers of CEOs’ strategic choices. Therefore, we suggest that CEOs’ motives play an important role in explaining the mechanisms by which institutional conditions influence green innovation.
Second, our findings suggest that CEOs’ career concerns may be critical antecedents of green innovation, extending the literature on CEO characteristics as antecedents of green innovation [59,72,73]. More importantly, our results provide new insights into the interplay between institutional conditions and CEOs, which influences firms’ green innovation. This is an important finding because CEOs’ decision-making is context-dependent [74,75]. Institutional conditions, which shape formal and informal rules within firms, tend to either reinforce or constrain CEOs’ strategic decisions related to green innovation [76,77].
Third, our study extends the research on the impact of CEOs’ career concerns by focusing on firms’ green innovation, which has hitherto been unexplored. It has been documented that CEOs’ career concerns can influence strategic choices such as firms’ investment decisions [49], delaying the disclosure of bad news [78], payout policies [79], and R&D intensity [80]. We add to this literature by demonstrating that CEOs’ career concerns can also affect strategic choices related to firms’ environmental management activities, such as green innovation.

6.2. Practical Implications

Our study also has important practical implications. First, this study has implications for policymakers. The results demonstrate the huge potential of SOEs in addressing grand environmental challenges due to their nature. In particular, CEOs of SOEs may be incentivized by political promotion concerns. They tend to be aligned with government objectives in environmental protection by way of engaging in green innovation outputs. Policymakers can use this mechanism for reference and introduce regulations specific to SOEs to stimulate their environmental innovations.
Second, this study has implications for environment-oriented shareholders. Because green innovation can improve environmental performance and contribute to environmental sustainability [8], firms are encouraged to allocate resources to green innovation. However, due to uncertainty about returns, CEOs may be reluctant to invest in green innovation [81]. Our findings suggest that CEOs’ incentives may be important drivers of green innovation. Chinese SOEs’ CEOs are likely to pursue political promotion if their monetary incentives are constrained by the pay cap regulation. This tendency leads them to invest more heavily in green innovation, as this signals conformity to government objectives, increasing their chances of political promotion. Therefore, we suggest that aligning CEOs’ incentives with green innovation can motivate them to invest more heavily in green innovation. Hence, shareholders and boards of directors may design incentive contracts and evaluation systems based on various incentives to encourage CEOs to invest more heavily in green innovation.

6.3. Limitations and Future Directions

Our study is not without limitations. First, the pay cap regulation for Chinese SOEs is a unique empirical context; as such, it may limit the generalizability of our findings. For example, in the U.S., imposing pay caps by governments on the CEOs of publicly listed firms may not be feasible. Although shareholders can vote on the compensation of CEOs, compulsory pay caps set by governments are unlikely to happen in the U.S. Thus, future research may use more general contexts to assess the generalizability of our findings. Second, Chinese governments have many other objectives besides promoting environmental sustainability. Thus, SOE CEOs may pursue political promotion by taking initiatives to achieve government objectives that are not related to green innovation, which is the focus of this study. Future research may examine this possibility. Third, the estimation results of one of the moderators—industry munificence—are insignificant in some robustness checks. It indicates that the characteristic of industry may not persistently weaken the main effect.

Author Contributions

Conceptualization, Q.S. and S.C.; methodology, Q.S. and X.Z.; software, Q.S.; validation, Q.S., S.C. and X.Z.; formal analysis, Q.S.; investigation, Q.S.; resources, S.C.; data curation, Q.S.; writing—original draft preparation, Q.S.; writing—review and editing, X.Z. and J.Z.; visualization, Q.S.; supervision, X.Z.; project administration, S.C.; funding acquisition, S.C. All authors have read and agreed to the published version of the manuscript.

Funding

This research was funded by the National Natural Science Foundation of China (NSFC) of China, grant number 72072132.

Institutional Review Board Statement

Not applicable.

Informed Consent Statement

Not applicable.

Data Availability Statement

The data used are all public data that can be downloaded from the websites mentioned in the paper.

Conflicts of Interest

The authors declare no conflicts of interest.

References

  1. George, G.; Howard-Grenville, J.; Joshi, A.; Tihanyi, L. Understanding and Tackling Societal Grand Challenges through Management Research. Acad. Manag. J. 2016, 59, 1880–1895. [Google Scholar] [CrossRef]
  2. Nilsson, A. Making Norms to Tackle Global Challenges: The Role of Intergovernmental Organisations. Res. Policy 2017, 46, 171–181. [Google Scholar] [CrossRef]
  3. Wickert, C.; Muzio, D. What Is the Strategy of Strategy to Tackle Climate Change? J. Manag. Stud. 2025, 62, 954–964. [Google Scholar] [CrossRef]
  4. Khavul, S.; Bruton, G.D. Harnessing Innovation for Change: Sustainability and Poverty in Developing Countries. J. Manag. Stud. 2013, 50, 285–306. [Google Scholar] [CrossRef]
  5. Owen, R.; Macnaghten, P.; Stilgoe, J. Responsible Research and Innovation: From Science in Society to Science for Society, with Society. Sci. Public Policy 2012, 39, 751–760. [Google Scholar] [CrossRef]
  6. Stilgoe, J.; Owen, R.; Macnaghten, P. Developing a Framework for Responsible Innovation. Res. Policy 2013, 42, 1568–1580. [Google Scholar] [CrossRef]
  7. Voegtlin, C.; Scherer, A.G. Responsible Innovation and the Innovation of Responsibility: Governing Sustainable Development in a Globalized World. J. Bus. Ethics 2017, 143, 227–243. [Google Scholar] [CrossRef]
  8. Kim, I.; Pantzalis, C.; Zhang, Z. Multinationality and the Value of Green Innovation. J. Corp. Finance 2021, 69, 101996. [Google Scholar] [CrossRef]
  9. Polzin, F.; Sanders, M. How to Finance the Transition to Low-Carbon Energy in Europe? Energy Policy 2020, 147, 111863. [Google Scholar] [CrossRef]
  10. Yu, C.-H.; Wu, X.; Zhang, D.; Chen, S.; Zhao, J. Demand for Green Finance: Resolving Financing Constraints on Green Innovation in China. Energy Policy 2021, 153, 112255. [Google Scholar] [CrossRef]
  11. Hu, H.W.; Xu, D. Manager or Politician? Effects of CEO Pay on the Performance of State-Controlled Chinese Listed Firms. J. Manag. 2022, 48, 1160–1187. [Google Scholar] [CrossRef]
  12. Cao, X.; Lemmon, M.; Pan, X.; Qian, M.; Tian, G. Political Promotion, CEO Incentives, and the Relationship Between Pay and Performance. Manag. Sci. 2019, 65, 2947–2965. [Google Scholar] [CrossRef]
  13. Gibbons, R.; Murphy, K.J. Optimal Incentive Contracts in the Presence of Career Concerns: Theory and Evidence. J. Polit. Econ. 1992, 100, 468–505. [Google Scholar] [CrossRef]
  14. Ceweekly. The Pay Cap Regulation for Top Executives of the State-Owned Enterprises Is About to Be Issued. The Salary Design Is Said to Only Consider “Lei Feng”. 4 May 2015. Available online: https://www.ceweekly.cn/mag/2015/0504/110281.html (accessed on 10 May 2025).
  15. Hung, M.; Wong, T.J.; Zhang, T. Political Considerations in the Decision of Chinese SOEs to List in Hong Kong. J. Account. Econ. 2012, 53, 435–449. [Google Scholar] [CrossRef]
  16. Ederhof, M. Incentive Compensation and Promotion-Based Incentives of Mid-Level Managers: Evidence from a Multinational Corporation. Account. Rev. 2011, 86, 131–153. [Google Scholar] [CrossRef]
  17. Gayle, G.-L.; Golan, L.; Miller, R.A. Promotion, Turnover, and Compensation in the Executive Labor Market. Econometrica 2015, 83, 2293–2369. [Google Scholar] [CrossRef]
  18. Chen, C.J.; Li, Z.; Su, X.; Sun, Z. Rent-Seeking Incentives, Corporate Political Connections, and the Control Structure of Private Firms: Chinese Evidence. J. Corp. Finance 2011, 17, 229–243. [Google Scholar] [CrossRef]
  19. Li, Y.; Wong, C.W.Y.; Miao, X. Political Connection, Political Promotion and Corporate Environmental Information Disclosure in China. Chin. Manag. Stud. 2021, 16, 78–101. [Google Scholar] [CrossRef]
  20. Zhang, H.; Li, L.; Zhou, D.; Zhou, P. Political Connections, Government Subsidies and Firm Financial Performance: Evidence from Renewable Energy Manufacturing in China. Renew. Energy 2014, 63, 330–336. [Google Scholar] [CrossRef]
  21. Brickley, J.A. Empirical Research on CEO Turnover and Firm-Performance: A Discussion. J. Account. Econ. 2003, 36, 227–233. [Google Scholar] [CrossRef]
  22. Liu, Y. Outside Options and CEO Turnover: The Network Effect. J. Corp. Finance 2014, 28, 201–217. [Google Scholar] [CrossRef]
  23. Makarius, E.E.; Stevens, C.E.; Tenhiälä, A. Tether or Stepping Stone? The Relationship between Perceived External Reputation and Collective Voluntary Turnover Rates. Organ. Stud. 2017, 38, 1665–1686. [Google Scholar] [CrossRef]
  24. Richard, O.C.; Kirby, S.L.; Chadwick, K. The Impact of Racial and Gender Diversity in Management on Financial Performance: How Participative Strategy Making Features Can Unleash a Diversity Advantage. Int. J. Hum. Resour. Manag. 2013, 24, 2571–2582. [Google Scholar] [CrossRef]
  25. Berrone, P.; Fosfuri, A.; Gelabert, L.; Gomez-Mejia, L.R. Necessity as the Mother of ‘Green’ Inventions: Institutional Pressures and Environmental Innovations. Strat. Manag. J. 2013, 34, 891–909. [Google Scholar] [CrossRef]
  26. Jiang, W.; Wang, K.; Zhou, K.Z. How Political Ties and Green Innovation Co-Evolve in China: Alignment with Institutional Development and Environmental Pollution. J. Bus. Ethics 2023, 186, 739–760. [Google Scholar] [CrossRef]
  27. Leyva-de la Hiz, D.I.; Hurtado-Torres, N.; Bermúdez-Edo, M. The Heterogeneity of Levels of Green Innovation by Firms in International Contexts: A Study Based on the Home-Country Institutional Profile. Organ. Environ. 2019, 32, 508–527. [Google Scholar] [CrossRef]
  28. Holmström, B. Managerial Incentive Problems: A Dynamic Perspective. Rev. Econ. Stud. 1999, 66, 169–182. [Google Scholar] [CrossRef]
  29. Fama, E.F. Agency Problems and the Theory of the Firm. J. Polit. Econ. 1980, 88, 288–307. [Google Scholar] [CrossRef]
  30. Xie, J. CEO Career Concerns and Investment Efficiency: Evidence from China. Emerg. Mark. Rev. 2015, 24, 149–159. [Google Scholar] [CrossRef]
  31. Groves, T.; Hong, Y.; McMillan, J.; Naughton, B. China’s Evolving Managerial Labor Market. J. Polit. Econ. 1995, 103, 873–892. [Google Scholar] [CrossRef]
  32. Li, H.; Zhou, L.-A. Political Turnover and Economic Performance: The Incentive Role of Personnel Control in China. J. Public Econ. 2005, 89, 1743–1762. [Google Scholar] [CrossRef]
  33. Xu, D.; Lu, J.W.; Gu, Q. Organizational Forms and Multi-Population Dynamics: Economic Transition in China. Adm. Sci. Q. 2014, 59, 517–547. [Google Scholar] [CrossRef]
  34. Hsu, P.-H.; Liang, H.; Matos, P. Leviathan Inc. and Corporate Environmental Engagement. Manag. Sci. 2023, 69, 7719–7758. [Google Scholar] [CrossRef]
  35. China Daily. What Is a Reasonable Income Gap? The Pay of Top Executives in State-Owned Enterprises Has Exceeded That of Their Employees by 13 Times. 29 August 2014. Available online: https://cn.chinadaily.com.cn/2014-08/29/content_18511475.htm (accessed on 10 May 2025).
  36. Wang, D.; Luo, X.R. Retire in Peace: Officials’ Political Incentives and Corporate Diversification in China. Adm. Sci. Q. 2019, 64, 773–809. [Google Scholar] [CrossRef]
  37. Obobisa, E.S.; Ahakwa, I. Stimulating the Adoption of Green Technology Innovation, Clean Energy Resources, Green Finance, and Environmental Taxes: The Way to Achieve Net Zero CO2 Emissions in Europe? Technol. Forecast. Soc. Change 2024, 205, 123489. [Google Scholar] [CrossRef]
  38. Siemsen, E. The Hidden Perils of Career Concerns in R&D Organizations. Manag. Sci. 2008, 54, 863–877. [Google Scholar]
  39. Baker, G.P. Incentive Contracts and Performance Measurement. J. Polit. Econ. 1992, 100, 598–614. [Google Scholar] [CrossRef]
  40. Adams, R.; Jeanrenaud, S.; Bessant, J.; Denyer, D.; Overy, P. Sustainability-oriented Innovation: A Systematic Review. Int. J. Manag. Rev. 2016, 18, 180–205. [Google Scholar] [CrossRef]
  41. Voegtlin, C.; Scherer, A.G.; Stahl, G.K.; Hawn, O. Grand Societal Challenges and Responsible Innovation. J. Manag. Stud. 2022, 59, 1–28. [Google Scholar] [CrossRef]
  42. Fu, J.-Y.; Sun, P. Closing the Revolving Door: What If Board Political Connections Are Permanently Broken? J. Manag. 2024, 50, 2534–2570. [Google Scholar] [CrossRef]
  43. Faccio, M.; Masulis, R.W.; McConnell, J.J. Political Connections and Corporate Bailouts. J. Finance 2006, 61, 2597–2635. [Google Scholar] [CrossRef]
  44. Goldman, E.; Rocholl, J.; So, J. Politically Connected Boards of Directors and the Allocation of Procurement Contracts. Rev. Finance 2013, 17, 1617–1648. [Google Scholar] [CrossRef]
  45. Adhikari, A.; Derashid, C.; Zhang, H. Public Policy, Political Connections, and Effective Tax Rates: Longitudinal Evidence from Malaysia. J. Account. Public Policy 2006, 25, 574–595. [Google Scholar] [CrossRef]
  46. March, J.G.; Simon, H.A. Organizations; Wiley: New York, NY, USA, 1958. [Google Scholar]
  47. Belenzon, S.; Shamshur, A.; Zarutskie, R. CEO’s Age and the Performance of Closely Held Firms. Strat. Manag. J. 2019, 40, 917–944. [Google Scholar] [CrossRef]
  48. Li, X.; Low, A.; Makhija, A.K. Career Concerns and the Busy Life of the Young CEO. J. Corp. Finance 2017, 47, 88–109. [Google Scholar] [CrossRef]
  49. Liu, F.; Zhang, L. Executive Turnover in China’s State-Owned Enterprises: Government-Oriented or Market-Oriented? China J. Account. Res. 2018, 11, 129–149. [Google Scholar] [CrossRef]
  50. Park, N.K.; Mezias, J.M. Before and after the Technology Sector Crash: The Effect of Environmental Munificence on Stock Market Response to Alliances of E-commerce Firms. Strat. Manag. J. 2005, 26, 987–1007. [Google Scholar] [CrossRef]
  51. Starbuck, W.H. Organizations and Their Environments. In Handbook of Industrial and Organizational Psychology; Rand McNally: Chicago, IL, USA, 1976. [Google Scholar]
  52. Bennett, N.; Blum, T.C.; Roman, P.M. Presence of Drug Screening and Employee Assistance Programs: Exclusive and Inclusive Human Resource Management Practices. J. Organ. Behav. 1994, 15, 549–560. [Google Scholar] [CrossRef]
  53. Johansson, G.; Winroth, M. Introducing Environmental Concern in Manufacturing Strategies: Implications for the Decision Criteria. Manag. Res. Rev. 2010, 33, 877–899. [Google Scholar] [CrossRef]
  54. Berrone, P.; Gomez-Mejia, L.R. Environmental Performance and Executive Compensation: An Integrated Agency-Institutional Perspective. Acad. Manag. J. 2009, 52, 103–126. [Google Scholar] [CrossRef]
  55. Kunapatarawong, R.; Martínez-Ros, E. Towards Green Growth: How Does Green Innovation Affect Employment? Res. Policy 2016, 45, 1218–1232. [Google Scholar] [CrossRef]
  56. Rehman, S.U.; Kraus, S.; Shah, S.A.; Khanin, D.; Mahto, R.V. Analyzing the Relationship between Green Innovation and Environmental Performance in Large Manufacturing Firms. Technol. Forecast. Soc. Change 2021, 163, 120481. [Google Scholar] [CrossRef]
  57. Cecere, G.; Corrocher, N.; Gossart, C.; Ozman, M. Technological Pervasiveness and Variety of Innovators in Green ICT: A Patent-Based Analysis. Res. Policy 2014, 43, 1827–1839. [Google Scholar] [CrossRef]
  58. Quan, X.; Ke, Y.; Qian, Y.; Zhang, Y. CEO Foreign Experience and Green Innovation: Evidence from China. J. Bus. Ethics 2023, 182, 535–557. [Google Scholar] [CrossRef]
  59. Funk, R.J. Making the Most of Where You Are: Geography, Networks, and Innovation in Organizations. Acad. Manag. J. 2014, 57, 193–222. [Google Scholar] [CrossRef]
  60. Yang, H.; Phelps, C.; Steensma, H.K. Learning from What Others Have Learned from You: The Effects of Knowledge Spillovers on Originating Firms. Acad. Manag. J. 2010, 53, 371–389. [Google Scholar] [CrossRef]
  61. Zheng, W.; Singh, K.; Mitchell, W. Buffering and Enabling: The Impact of Interlocking Political Ties on Firm Survival and Sales Growth. Strat. Manag. J. 2015, 36, 1615–1636. [Google Scholar] [CrossRef]
  62. Keats, B.W. The Vertical Construct Validity of Business Economic Performance Measures. J. Appl. Behav. Sci. 1988, 24, 151–160. [Google Scholar] [CrossRef]
  63. Li, J.; Tang, Y. CEO Hubris and Firm Risk Taking in China: The Moderating Role of Managerial Discretion. Acad. Manag. J. 2010, 53, 45–68. [Google Scholar] [CrossRef]
  64. Flammer, C. Does Product Market Competition Foster Corporate Social Responsibility? Evidence from Trade Liberalization. Strat. Manag. J. 2015, 36, 1469–1485. [Google Scholar] [CrossRef]
  65. Abadie, A.; Athey, S.; Imbens, G.W.; Wooldridge, J.M. When Should You Adjust Standard Errors for Clustering? Q. J. Econ. 2023, 138, 1–35. [Google Scholar] [CrossRef]
  66. Thompson, S.B. Simple Formulas for Standard Errors That Cluster by Both Firm and Time. J. Financ. Econ. 2011, 99, 1–10. [Google Scholar] [CrossRef]
  67. Ryan, T.P. Modern Regression Methods; John Wiley & Sons: Hoboken, NJ, USA, 2008; ISBN 978-0-470-08186-0. [Google Scholar]
  68. Acharya, V.V.; Baghai, R.P.; Subramanian, K.V. Wrongful Discharge Laws and Innovation. Rev. Financ. Stud. 2014, 27, 301–346. [Google Scholar] [CrossRef]
  69. Amore, M.D.; Schneider, C.; Žaldokas, A. Credit Supply and Corporate Innovation. J. Financ. Econ. 2013, 109, 835–855. [Google Scholar] [CrossRef]
  70. He, Z.-L.; Tong, T.W.; Zhang, Y.; He, W. Constructing a Chinese Patent Database of Listed Firms in China: Descriptions, Lessons, and Insights. J. Econ. Manag. Strat. 2018, 27, 579–606. [Google Scholar] [CrossRef]
  71. Bertrand, M.; Duflo, E.; Mullainathan, S. How Much Should We Trust Differences-In-Differences Estimates? Q. J. Econ. 2004, 119, 249–275. [Google Scholar] [CrossRef]
  72. Javed, M.; Wang, F.; Usman, M.; Ali Gull, A.; Uz Zaman, Q. Female CEOs and Green Innovation. J. Bus. Res. 2023, 157, 113515. [Google Scholar] [CrossRef]
  73. Ren, S.; Wang, Y.; Hu, Y.; Yan, J. CEO Hometown Identity and Firm Green Innovation. Bus. Strat. Environ. 2021, 30, 756–774. [Google Scholar] [CrossRef]
  74. Hambrick, D.C. Upper Echelons Theory: An Update. Acad. Manag. Rev. 2007, 32, 334–343. [Google Scholar] [CrossRef]
  75. Hambrick, D.C.; Mason, P.A. Upper Echelons: The Organization as a Reflection of Its Top Managers. Acad. Manag. Rev. 1984, 9, 193–206. [Google Scholar] [CrossRef]
  76. Crossland, C.; Hambrick, D.C. Differences in Managerial Discretion across Countries: How Nation-Level Institutions Affect the Degree to Which CEOs Matter. Strat. Manag. J. 2011, 32, 797–819. [Google Scholar] [CrossRef]
  77. Ocasio, W. Towards an Attention-based View of the Firm. Strat. Manag. J. 1997, 18, 187–206. [Google Scholar] [CrossRef]
  78. Baginski, S.P.; Campbell, J.L.; Hinson, L.A.; Koo, D.S. Do Career Concerns Affect the Delay of Bad News Disclosure? Account. Rev. 2018, 93, 61–95. [Google Scholar] [CrossRef]
  79. Aktas, N.; Boone, A.; Croci, E.; Signori, A. Reductions in CEO Career Horizons and Corporate Policies. J. Corp. Finance 2021, 66, 101862. [Google Scholar] [CrossRef]
  80. Cheng, Z.; Wangrow, D.B.; Barker, V.L. Career Concerns of Young and Old CEOs: Their Effect on R&D Spending in the Software Industry. Long Range Plann. 2024, 57, 102438. [Google Scholar]
  81. Kawai, N.; Strange, R.; Zucchella, A. Stakeholder Pressures, EMS Implementation, and Green Innovation in MNC Overseas Subsidiaries. Int. Bus. Rev. 2018, 27, 933–946. [Google Scholar] [CrossRef]
Figure 1. Distribution of coefficients in the placebo test. (a) Effect of the placebo treatment on green patent applications. (b) Effect of the placebo treatment on granted green patents.
Sustainability 17 05504 g001
Table 1. Descriptive statistics and partial correlations.
VariableMeanSD(1)(2)(3)(4)(5)(6)(7)(8)(9)(10)(11)(12)(13)(14)(15)(16)(17)
(1) GI_apply (log)0.3340.7771.000
(2) GI_grant (log)0.3540.7380.7011.000
(3) Regulation 0.1750.3800.0630.0691.000
(4) ROA0.0410.0580.0490.006−0.0831.000
(5) Leverage0.4190.2000.1200.1510.147−0.3511.000
(6) Firm listing age2.1180.792−0.018−0.0210.340−0.1800.3141.000
(7) Board independence0.3740.0620.0330.039−0.011−0.008−0.002−0.0391.000
(8) Firm size22.0411.2200.2590.3000.2730.0190.4410.3100.0471.000
(9) Board size2.2650.1650.0610.0570.0800.0260.0940.058−0.3850.1701.000
(10) Largest investor3.4910.441−0.0080.0170.0810.0940.050−0.1170.0550.150−0.0211.000
(11) R&D intensity 2.7623.0390.1560.1600.0570.070−0.245−0.1600.047−0.049−0.069−0.1191.000
(12) CEO tenure4.5293.1930.0470.052−0.0320.034−0.0350.1190.0400.0470.002−0.1000.1051.000
(13) CEO duality0.0530.224−0.009−0.022−0.040−0.015−0.019−0.134−0.011−0.051−0.038−0.0020.002−0.1531.000
(14) CEO gender0.0550.228−0.006−0.010−0.0360.001−0.030−0.0410.046−0.020−0.0910.0140.0160.021−0.0011.000
(15) CEO_young0.9670.180−0.0020.0060.045−0.0350.0190.036−0.0120.0010.0100.028−0.033−0.081−0.0160.0031.000
(16) Munificence0.2150.0560.0050.003−0.107−0.0200.1220.029−0.0090.0490.0010.064−0.066−0.0480.015−0.0060.0371.000
(17) Political connections0.1570.3640.0720.061−0.0710.070−0.048−0.1230.017−0.013−0.031−0.0240.0440.1440.0220.059−0.093−0.0041.000
Notes: N = 11,061. Correlations with an absolute value greater than 0.019 are significant at the 0.05 level. SD = standard deviation; ROA = return on assets.
Table 2. Impact of the CEO pay cap regulation on green innovation.
(1)(2)(3)(4)(5)(6)
VariableGI_apply (log)GI_apply (log)GI_apply (log)GI_grant (log)GI_grant (log)GI_grant (log)
Regulation (H1)0.047 *0.063 ** 0.030 *0.058 ***
(0.027)(0.028) (0.015)(0.017)
Pre_4 0.003 −0.014
(0.036) (0.035)
Pre_3 0.023 −0.032
(0.034) (0.046)
Pre_2 0.056 −0.013
(0.046) (0.035)
Pre_1 0.047 −0.003
(0.030) (0.046)
Current 0.109 *** 0.055
(0.036) (0.037)
Post_1 0.061 * 0.021
(0.031) (0.043)
Post_2 0.074 * 0.025
(0.044) (0.046)
Post_3 0.163 *** 0.048
(0.033) (0.045)
Post_4 0.035 0.085 **
(0.034) (0.042)
ROA 0.268 **0.274 ** −0.197 *−0.208 *
(0.115)(0.115) (0.111)(0.110)
Leverage 0.172 ***0.166 *** 0.0530.055
(0.034)(0.034) (0.043)(0.043)
Firm listing age −0.014−0.013 0.038 **0.041 ***
(0.023)(0.026) (0.016)(0.014)
Board independence 0.222 **0.230 *** 0.148 *0.147 *
(0.085)(0.084) (0.074)(0.076)
Firm size 0.039 ***0.039 *** 0.038 ***0.038 ***
(0.008)(0.008) (0.013)(0.012)
Board size 0.108 **0.110 *** 0.0520.052
(0.041)(0.041) (0.042)(0.041)
Largest investor −0.094 ***−0.093 *** −0.058 ***−0.058 ***
(0.018)(0.018) (0.019)(0.019)
R&D intensity 0.0030.003 0.009 ***0.009 ***
(0.003)(0.003) (0.003)(0.003)
CEO tenure 0.004 **0.004 ** 0.004 *0.004 *
(0.001)(0.002) (0.002)(0.002)
CEO duality 0.042 ***0.041 ** 0.0060.006
(0.015)(0.016) (0.012)(0.012)
CEO gender −0.008−0.010 0.039 **0.039 **
(0.026)(0.026) (0.019)(0.019)
Constant0.160 ***−0.734 ***−0.744 ***0.137 ***−0.713 **−0.722 **
(0.004)(0.197)(0.200)(0.003)(0.300)(0.298)
R20.0950.1000.1020.0730.0790.079
Notes: N = 11,061. The values in parentheses are standard errors. Standard errors clustered at the industry-year level. ROA: return on assets; * p < 0.1; ** p < 0.05; *** p < 0.01.
Table 3. Moderating role of CEOs’ political connections and external job opportunities.
(1)(2)(3)(4)(5)(6)
VariableGI_apply (log)GI_apply (log)GI_apply (log)GI_grant (log)GI_grant (log)GI_grant (log)
Regulation0.050 **0.321 **0.238 ***0.048 ***0.381 ***0.147 ***
(0.024)(0.126)(0.060)(0.017)(0.109)(0.046)
Political connections−0.014 −0.043 **
(0.033) (0.020)
Regulation × political connections (H2)0.193 ** 0.147 ***
(0.080) (0.048)
CEO_young 0.022 0.070 **
(0.029) (0.027)
Regulation × CEO_young (H3a) −0.263 ** −0.319 ***
(0.115) (0.103)
Munificence −0.442 *** −0.566 ***
(0.117) (0.100)
Regulation × munificence (H3b) −0.865 *** −0.445 *
(0.216) (0.227)
ROA0.272 **0.270 **0.279 **−0.192 *−0.186−0.186 *
(0.115)(0.115)(0.111)(0.110)(0.112)(0.109)
Leverage0.175 ***0.175 ***0.172 ***0.0560.0440.053
(0.034)(0.034)(0.034)(0.044)(0.043)(0.042)
Firm listing age−0.015−0.013−0.0130.036 **0.038 **0.039 **
(0.023)(0.023)(0.023)(0.015)(0.016)(0.015)
Board independence0.222 **0.221 **0.225 **0.146 *0.155 **0.149 *
(0.084)(0.085)(0.085)(0.074)(0.076)(0.074)
Firm size0.037 ***0.038 ***0.044 ***0.037 ***0.041 ***0.043 ***
(0.008)(0.008)(0.008)(0.013)(0.013)(0.013)
Board size0.108 **0.110 ***0.103 **0.0510.0530.048
(0.041)(0.041)(0.041)(0.041)(0.042)(0.042)
Largest investor−0.095 ***−0.094 ***−0.086 ***−0.058 ***−0.052 **−0.050 **
(0.018)(0.018)(0.018)(0.019)(0.021)(0.019)
R&D intensity0.0030.0030.0030.009 ***0.009 ***0.010 ***
(0.003)(0.003)(0.003)(0.003)(0.003)(0.003)
CEO tenure0.003 **0.004 **0.004 ***0.004 *0.005 **0.004 **
(0.001)(0.001)(0.001)(0.002)(0.002)(0.002)
CEO duality0.042 ***0.043 ***0.043 ***0.0070.0050.006
(0.015)(0.015)(0.015)(0.012)(0.013)(0.012)
CEO gender−0.012−0.010−0.0080.034 *0.034 *0.042 **
(0.026)(0.026)(0.026)(0.019)(0.020)(0.019)
Constant−0.680 ***−0.743 ***−0.765 ***−0.684 **−0.875 ***−0.731 **
(0.197)(0.199)(0.197)(0.296)(0.290)(0.297)
R20.1010.1010.1020.0800.0820.081
Notes: N = 11,061. The values in parentheses are standard errors. Standard errors clustered at the industry-year level. ROA: return on assets; * p < 0.1; ** p < 0.05; *** p < 0.01.
Table 4. Robustness check: excluding firms with no patent applications.
(1)(2)(3)(4)(5)(6)(7)(8)
VariableGI_apply (log)GI_apply (log)GI_apply (log)GI_apply (log)GI_grant (log)GI_grant (log)GI_grant (log)GI_grant (log)
Regulation0.113 **0.089 **0.554 **0.311 **0.094 ***0.080 ***0.323 ***0.182
(0.046)(0.040)(0.230)(0.150)(0.028)(0.028)(0.119)(0.118)
Political connections 0.029 0.026
(0.066) (0.047)
Regulation × political connections (H2) 0.380 ** 0.170 **
(0.145) (0.070)
CEO_young 0.030 0.139 ***
(0.056) (0.051)
Regulation × CEO_young (H3a) −0.448 ** −0.233 *
(0.210) (0.119)
Munificence −1.186 ** −1.625 ***
(0.492) (0.368)
Regulation × munificence (H3b) −0.999 −0.466
(0.624) (0.562)
ROA0.794 ***0.787 ***0.798 ***0.781 ***−0.144−0.141−0.126−0.163
(0.236)(0.232)(0.236)(0.236)(0.244)(0.245)(0.243)(0.241)
Leverage0.393 ***0.396 ***0.398 ***0.374 ***0.0920.0940.0930.070
(0.077)(0.078)(0.076)(0.079)(0.080)(0.079)(0.081)(0.080)
Firm listing age−0.075 **−0.073 **−0.071 *−0.073 **−0.014−0.013−0.012−0.011
(0.036)(0.035)(0.035)(0.036)(0.026)(0.026)(0.026)(0.026)
Board independence0.301 *0.312 *0.299 *0.306 *0.251 *0.261 *0.257 *0.259 *
(0.175)(0.168)(0.174)(0.175)(0.138)(0.135)(0.138)(0.136)
Firm size0.116 ***0.109 ***0.114 ***0.127 ***0.145 ***0.142 ***0.146 ***0.158 ***
(0.022)(0.021)(0.022)(0.022)(0.028)(0.029)(0.028)(0.028)
Board size0.138 *0.148 **0.142 *0.139 *0.0100.0170.0170.017
(0.073)(0.072)(0.072)(0.076)(0.074)(0.072)(0.074)(0.074)
Largest investor−0.208 ***−0.215 ***−0.207 ***−0.203 ***−0.077 *−0.080 *−0.075 *−0.070
(0.037)(0.036)(0.037)(0.038)(0.044)(0.043)(0.044)(0.045)
R&D intensity0.0020.0020.0020.0020.013 ***0.013 ***0.013 ***0.013 ***
(0.006)(0.006)(0.006)(0.006)(0.005)(0.005)(0.005)(0.005)
CEO tenure0.007 **0.005 *0.006 **0.008 ***0.0030.0020.0040.004
(0.003)(0.003)(0.003)(0.003)(0.004)(0.005)(0.004)(0.004)
CEO duality0.0550.0580.0570.058 *−0.021−0.023−0.018−0.017
(0.035)(0.035)(0.035)(0.034)(0.024)(0.023)(0.025)(0.025)
CEO gender−0.054−0.051−0.055−0.0440.132 **0.133 **0.129 **0.144 ***
(0.065)(0.064)(0.065)(0.065)(0.050)(0.051)(0.050)(0.048)
Constant−1.978 ***−1.832 ***−1.988 ***−1.969 ***−2.741 ***−2.679 ***−2.919 ***−2.700 ***
(0.590)(0.568)(0.578)(0.610)(0.645)(0.640)(0.629)(0.632)
R20.1740.1760.1750.1760.1370.1380.1380.141
Notes: N = 5714. The values in parentheses are standard errors. Standard errors clustered at the industry-year level; * p < 0.1; ** p < 0.05; *** p < 0.01.
Table 5. Robustness check: potential confounding effects of the low-carbon policy.
(1)(2)(3)(4)(5)(6)(7)(8)
VariableGI_apply (log)GI_apply (log)GI_apply (log)GI_apply (log)GI_grant (log)GI_grant (log)GI_grant (log)GI_grant (log)
Regulation0.063 **0.050 **0.321 **0.238 ***0.058 ***0.048 ***0.1500.147 ***
(0.029)(0.024)(0.126)(0.059)(0.017)(0.016)(0.104)(0.046)
Low carbon0.0480.0470.0460.039−0.015−0.016−0.017−0.025
(0.036)(0.036)(0.037)(0.035)(0.061)(0.061)(0.061)(0.061)
Trading−0.006−0.009−0.009−0.008−0.013−0.015−0.015−0.015
(0.030)(0.029)(0.029)(0.030)(0.035)(0.035)(0.034)(0.034)
Political connections −0.014 −0.043 **
(0.033) (0.020)
Regulation × political connections (H2) 0.193 ** 0.148 ***
(0.080) (0.049)
CEO_young 0.022 0.077 ***
(0.029) (0.027)
Regulation × CEO_young (H3a) −0.263 ** −0.095
(0.115) (0.103)
Munificence −0.437 *** −0.570 ***
(0.117) (0.102)
Regulation × munificence (H3b) −0.864 *** −0.445 *
(0.215) (0.228)
ROA0.270 **0.273 **0.272 **0.280 **−0.198 *−0.192 *−0.190 *−0.187 *
(0.115)(0.115)(0.115)(0.111)(0.111)(0.111)(0.112)(0.109)
Leverage0.173 ***0.177 ***0.176 ***0.173 ***0.0530.0550.0540.053
(0.034)(0.034)(0.034)(0.034)(0.043)(0.043)(0.043)(0.042)
Firm listing age−0.013−0.015−0.012−0.0130.038 **0.036 **0.038 **0.040 ***
(0.023)(0.023)(0.023)(0.023)(0.015)(0.015)(0.015)(0.015)
Board independence0.219 **0.219 **0.217 **0.222 **0.148 *0.147 *0.152 **0.151 **
(0.085)(0.084)(0.085)(0.085)(0.075)(0.074)(0.073)(0.074)
Firm size0.039 ***0.037 ***0.038 ***0.044 ***0.038 ***0.037 ***0.038 ***0.043 ***
(0.008)(0.008)(0.008)(0.008)(0.013)(0.013)(0.013)(0.013)
Board size0.109 ***0.109 ***0.111 ***0.104 **0.0520.0520.0550.049
(0.040)(0.040)(0.040)(0.040)(0.042)(0.041)(0.042)(0.042)
Largest investor−0.094 ***−0.095 ***−0.094 ***−0.087 ***−0.058 ***−0.058 ***−0.059 ***−0.050 **
(0.018)(0.018)(0.018)(0.018)(0.019)(0.019)(0.019)(0.019)
R&D intensity0.0030.0030.0030.0030.009 ***0.009 ***0.009 ***0.010 ***
(0.003)(0.003)(0.003)(0.003)(0.003)(0.003)(0.003)(0.003)
CEO tenure0.004 **0.003 **0.004 **0.004 ***0.004 *0.004 *0.004 **0.004 **
(0.001)(0.001)(0.001)(0.001)(0.002)(0.002)(0.002)(0.002)
CEO duality0.042 ***0.042 ***0.043 ***0.043 ***0.0060.0070.0070.007
(0.016)(0.016)(0.015)(0.015)(0.012)(0.012)(0.012)(0.012)
CEO gender−0.009−0.013−0.011−0.0080.039 **0.034 *0.036 *0.042 **
(0.026)(0.026)(0.026)(0.026)(0.018)(0.019)(0.019)(0.019)
Constant−0.764 ***−0.713 ***−0.771 ***−0.791 ***−0.709 **−0.683 **−0.797 ***−0.721 **
(0.190)(0.190)(0.193)(0.191)(0.295)(0.292)(0.287)(0.293)
R20.1000.1010.1010.1020.0790.0800.0790.081
Notes: N = 11,061. The values in parentheses are standard errors. Standard errors clustered at the industry-year level. ROA: return on assets; * p < 0.1; ** p < 0.05; *** p < 0.01.
Disclaimer/Publisher’s Note: The statements, opinions and data contained in all publications are solely those of the individual author(s) and contributor(s) and not of MDPI and/or the editor(s). MDPI and/or the editor(s) disclaim responsibility for any injury to people or property resulting from any ideas, methods, instructions or products referred to in the content.

