Abstract
In alignment with China’s carbon peak and carbon neutrality commitments, digital inclusive finance (DIF) has emerged as a strategic instrument for carbon emission mitigation, facilitated by coordinated policy interventions and market-driven innovations. This study conducted an original multi-dimensional investigation into DIF’s carbon intensity reduction effects through an integrated analytical framework. Employing two-way fixed effects and mediation analysis models, we systematically evaluated both direct impacts and green-credit-mediated pathways using panel data across 247 Chinese cities from 2011 to 2020. A dynamic Spatial Durbin model further elucidated the spatiotemporal evolution of DIF’s spatial spillover effects. It was found that DIF development can reduce the carbon intensity of cities, and in particular, this phenomenon shows different effects in different types of cities. Green credit mechanisms effectively mediate their effects in the decarbonization process of DIF, confirming their key role in financial intermediation. In addition, DIF has a strong cross-regional spatial spillover effect, and its carbon emission reduction impact transcends local administrative jurisdictions. The results of this study will provide valuable insights and practical recommendations for policymakers and stakeholders to develop effective carbon reduction strategies that contribute to sustainable development in China and globally.
1. Introduction
Since the onset of industrialization, the Anthropocene epoch has been characterized by a continuous rise in global temperatures. According to multi-model ensemble analyses [1], the year 2024 is anticipated to mark the beginning of the initial two-decade span (2020–2039) where the 1.5 °C climate target is achieved, with probabilities ranging from likely (≥66%) to virtually certain (≥99%). This climatic shift has resulted in significant planetary-scale disruptions, including unprecedented glacial retreat; accelerated oceanic thermal expansion; and increased frequency and severity of hydrometeorological extremes, such as megadroughts and catastrophic floods. Glacial retreat is a decrease in the volume of a glacier, and ocean thermal expansion is an increase in the volume of seawater due to rising temperatures. The IPCC Sixth Assessment Report (AR6) concludes with high confidence (virtually certain) that anthropogenic GHG (greenhouse gas), primarily from the burning of fossil fuels and industrial activities, is mainly driven by observed warming and associated climate disasters.
Amid the intensifying global climate crisis driven by anthropogenic activities, cities have become critical arenas for implementing China’s transition toward carbon neutrality. As the main avenues for deploying energy-saving and emission-reduction strategies, metropolitan regions are a critical factor in the realization of China’s objectives to reach carbon peak and attain carbon neutrality. Carbon peak refers to a period of gradual decline in carbon dioxide emissions after they have reached an all-time high, and carbon neutrality is the offsetting of anthropogenic carbon dioxide emissions through various means to achieve net zero emissions. Functioning as key industrial hubs for energy development, cities simultaneously ensure energy and industrial security while serving as major sources of carbon emissions. Consequently, the development of differentiated emission reduction strategies and the promotion of low-carbon urban development are of substantial significance.
The economic dynamism of cities is becoming increasingly interconnected with the issue of carbon emissions. The conventional perspective frequently perceives economic growth and environmental protection as contradictory; however, practical experience demonstrates that through innovation-driven strategies, industrial upgrading, and green transformations, economic development can serve as a crucial driving force for achieving urban low-carbon transitions. The digital economy era is rapidly advancing, fueled by breakthroughs in AI, distributed ledger systems, cloud-based platforms, and advanced data analytics, which are reshaping technological innovation and industrial modernization. These technologies are fundamentally reshaping the global economic landscape and accelerating the transition into this new era. The convergence of cutting-edge digital innovations with economic and societal domains has fostered unprecedented development in the digital economy, characterized by its extensive scope and profound influence. This transformation is becoming a critical driver in reorganizing global resources, transforming the economic framework of the world, and redefining the competitive dynamics of the global economy.
Digital finance broadly encompasses the utilization of modern technological tools in financial services by financial institutions and technology firms to enable innovative business models, such as financing and payment systems. Digital inclusive finance (DIF) emphasizes the democratization of digital finance, representing the smooth incorporation of digital technologies into conventional financial practices. It significantly expands financing channels, reduces costs, and enhances efficiency, enabling micro, small, and medium-sized enterprises (MSMEs) as well as individual businesses to achieve key financial objectives, such as access to credit and investment opportunities. Within the framework of new development paradigms, digital inclusive finance places particular emphasis on green credit, investment services, and the application of digital tools to monitor and manage corporate production behaviors, thereby fostering eco-friendly methodologies to ensure environmental sustainability.
A considerable body of extant literature has examined the relationship between digital inclusive finance and urban carbon emissions [2,3,4]. However, these studies have overlooked the impact of digital inclusive finance on the economy. This paper integrates urban carbon emissions and the urban economy to investigate the impact of digital inclusive finance on urban carbon emission intensity. It innovatively employs green credit, a financial indicator, as a mediating variable to explore the impact path between the two. In addition, it builds on previous research to consider the impact of digital financial inclusion and city type. The extant scholarship on this subject has largely overlooked the dynamic spatial spillover effect [5]. This paper proposes a novel dynamic spatial model to examine the spatial dependencies and regional variations.
This study makes the following three contributions:
- Presenting a fresh viewpoint using green credit as a mediating factor. This study analyzes the linkage between urban carbon intensity and digital inclusive finance. Specifically, green credit is utilized as a mediating factor to analysis the interplay among urban carbon intensity, green credit, and digital financial inclusion.
- Heterogeneity between cities is accounted for. This research utilizes heterogeneous exploration of the linkage between digital inclusive finance and urban carbon intensity across cities with varying levels of natural resource endowments. Given the uneven distribution of natural resources across China’s regions, cities are categorized based on their natural resource abundance.
- A flexible dynamic model is constructed to address the shortcomings of the static model, which is insufficiently flexible. To investigate the geographical implications of digital financial inclusion, a non-static Spatial Durbin model is employed for analytical purposes. This approach facilitates the exploration of spatial dependencies and regional variations within the data.
In the context of China’s comprehensive promotion of green and low-carbon development, and the realization of the “dual-carbon” goal, this study systematically examines the impact of the development of digital inclusive finance on the intensity of urban carbon emissions and its dynamic spatial effects. The analysis is based on panel data from 247 prefectural-level and above cities in China, and it examines the intermediary effect of green credit in the process. It provides a scientific basis for the precise formulation of differentiated carbon emission reduction policies and helps China to take a sustainable development path that balances economic growth and environmental protection. The structure of this study is structured in the following manner: Section 1 outlines the study’s background. Section 2 formulates the literature review and research hypotheses. Section 3 outlines the methodology, encompassing model specifications, variable definitions, and data sources. Section 4 provides the findings derived from the model analysis. Section 5 summarizes the key conclusions and proposes policy recommendations, shortcomings, and prospects.
2. Literature Review and Hypothesis
2.1. Literature Review
Since the mid-twentieth century, global warming and the greenhouse effect have garnered significant global attention. As the most populous developing country, China has experienced a notable increase in carbon emissions alongside rapid economic growth. The announcement of the Peak Carbon and Carbon Neutrality targets in 2020 underscores China’s commitment to reducing carbon emissions while simultaneously advancing ecological civilization and sustainable economic growth. China has made significant advancements in digital technologies, with digital finance exerting a profound national influence in recent years [6]. The development of China’s digital economy from 2016 to 2022 is shown in Figure 1.
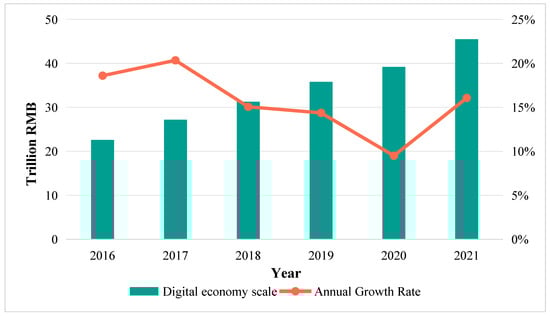
Figure 1.
The scale and growth rate of China’s digital economy from 2016 to 2021.
Since its inception in 2005, financial inclusion has become a fundamental strategy within the economic and financial sector. It aims to provide affordable and effective financial services to a broad population, ensuring widespread accessibility, usage, and reach [7,8]. Rapid advancements in digital innovations, including cloud computing, extensive data analytics, and AI, have transformed traditional financial inclusion into digital inclusive finance. This evolution has facilitated the provision of online services in terms of the financial aspect, including loan financing, asset management, and transaction processing [9,10]. Using digital approaches to achieve inclusive finance indirectly impacts urban carbon emissions primarily through changes in industrial composition and advancements in technology [11,12]. Studies demonstrate that optimizing industrial structures is crucial for reducing greenhouse gas outputs and fostering sustainable economic development, with an expanded tertiary sector contributing to lower greenhouse gas emissions [13,14,15]. Both domestically and internationally, digital financial inclusion enhances technological progress by improving energy utilization rate; minimizing resource consumption; and accelerating the adoption of energy, which is recyclable, and all of these factors lead to significant reductions in adjacent carbon emission [16,17,18]. Additionally, technological innovation and industrial infrastructure upgrades further influence emission reduction. Digital financial inclusion also promotes more flexible and diverse financial services, facilitating the adoption of green credit initiatives [19,20,21], Figure 2 shows that the balance and proportion of green credit of major financial institutions in China are gradual.
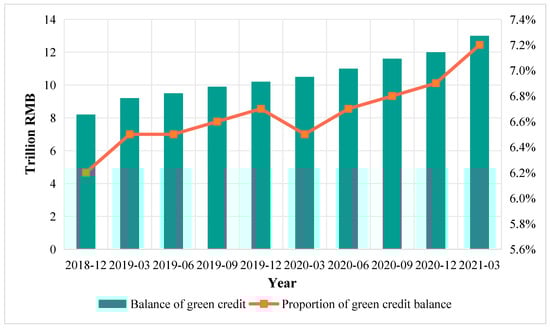
Figure 2.
The balance and proportion of green loans of major Chinese financial institutions from 2018 to 2021.
Overall, scholars have conducted a large number of studies on digital inclusive finance, urban carbon intensity and green credit, which have demonstrated the existence of certain links between the three and provided certain ideas for the research in this paper. However, there is still room for research on several aspects of the impact of digital inclusive finance on urban carbon intensity. Firstly, previous studies have focused on industry-related mediators, such as economic sector composition and technological progress, while financial variables as potential mediators have been under-discussed, limiting a comprehensive understanding of the economic and social impacts of digital inclusive finance [2,3]. Secondly, many existing studies fail to account for city-level heterogeneity, with significant differences in resource endowments as well as institutional environments across cities, which may profoundly affect the impact of digital inclusive finance [4,22]. Finally, most analytical studies use static spatial models to examine the spatial spillover effects of digital inclusive finance, which fail to capture its dynamic evolutionary patterns that vary with the stage of development, policy adjustments, or market maturity, and it is difficult for static models to reveal their long-term trends and time-varying characteristics [23,24].
2.2. Research Hypothesis
This section theoretically examines the direct, indirect, and spatial spillover effects of digital financial inclusion on urban carbon intensity, alongside the formulation of relevant hypotheses. The conceptual framework is illustrated in Figure 3.
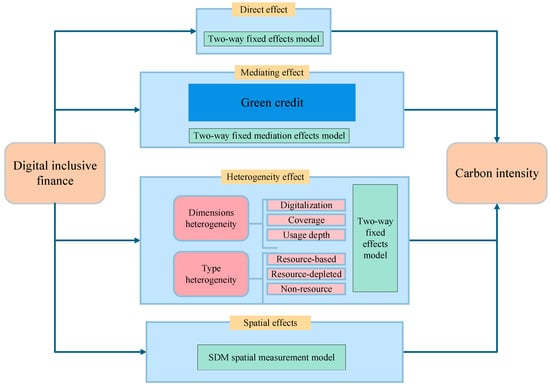
Figure 3.
The research framework in this study.
2.2.1. The Immediate Impact of Digital Inclusive Finance on Urban Carbon Intensity
By combing through the studies conducted by previous researchers, it was found that digital inclusive finance has an impact on urban carbon emissions. The expansion of digital financial inclusion serves as a key driver in reducing carbon intensity, mitigating environmental externalities, and fostering sustainable economic growth [5]. Its impact on urban carbon emissions manifests through two primary mechanisms. First, digital financial inclusion reduces transaction costs by enhancing the accessibility of trading platforms, thereby improving economic performance, resource allocation efficiency, and carbon intensity management [25,26].
Moreover, some scholars have proved how digital inclusive finance affects urban carbon intensity in terms of technical and industrial aspects. The utilization of digital platforms will reduce financial costs linked to carbon emissions trading, enhance the efficiency of the trading process, and promote industries to adopt eco-friendly practices, ultimately supporting a reduction of urban carbon emissions [27]. Second, the incorporation of digital technology into financial inclusion lowers the cost and energy consumption of financial services while improving their accessibility and reach [28]. Additionally, digital inclusive finance accelerates the growth of nascent sectors, including finance and information technology, which enhances the economic contribution of tertiary industries and facilitates the modernization of industrial structures. Both factors collectively reduce carbon intensity [29]. Drawing from these insights, Hypothesis 1 is formulated in the current research.
H1.
Intensity of urban carbon can be significantly curtailed through digital inclusive finance.
2.2.2. Indirect Effect of Digital Inclusive Finance on Urban Carbon Intensity
Scholars have conducted ample research on how digital inclusive finance indirectly affects urban carbon emissions in terms of industry and technology, and they have laid the groundwork for indirect impacts in terms of finance. Due to the limitations of traditional financial assistance mechanisms, financial institutions often rely on businesses and individuals to proactively apply for green credit. However, this approach is hindered by a lack of initiative and precision, which restricts the widespread adoption and progress of green credit policies, particularly for retail investors who struggle to access their benefits. The advancement of digital financial inclusion addresses these challenges by offering diverse platforms and channels for green credit policies [30]. Furthermore, using digital technology enhances accessibility and financial inclusion, thereby expanding the reach of green finance and incentivizing greater participation from businesses and individuals in green development initiatives [31].
Through the adoption of digital tools, financial organizations can efficiently collect and analyze large-scale data, enabling the precise identification of customer groups eligible for green credit and facilitating evidence-based adjustments to relevant policies [32]. Extensive scholarly research has demonstrated the carbon-reducing effects of green credit [33,34]. Additionally, green credit policies help small investors overcome financial barriers, thereby promoting the progress of environmentally sustainable technologies and supporting the reduction of carbon emissions in urban areas [35]. Based on these insights, the present study advances the articulation of Hypothesis 2.
H2.
Digital inclusive finance can facilitate the spread and advancement of green credit practices, thereby helping to reduce urban carbon intensity.
2.2.3. Spatial Spillovers of Digital Inclusive Finance on Urban Carbon Intensity
Existing research shows that the development of digital inclusive finance not only reduces the carbon intensity of the region but also has a significant impact on neighboring regions through spatial spillover effects. Digital financial inclusion transcends geographical and temporal limitations, fostering regional economic integration and enhancing financial collaboration across regions. This initiative not only contributes to poverty reduction at the local level but also generates beneficial impacts on adjacent areas, leading to significant mitigation outcomes [36]. First, interregional economic cooperation has intensified financial competition, incentivizing financial institutions to adopt more environmentally sustainable practices [37]. Beyond promoting the innovation and refinement of services in financial aspect, the improvement of digital inclusive finance at local community also serves as a valuable model and reference for surrounding regions [38].
Moreover, digital inclusive finance has facilitated the widespread adoption of green financial products in nearby regions, incentivizing enterprises to innovate in green technology [39]. Additionally, the rapid transfer of technologies among neighboring provinces may lead to a “siphon effect” or “diffusion effect” of carbon emissions, suggesting that geographical spillovers in carbon intensity could emerge with the advancement of inclusive funding through digital innovations [40]. Building on this analysis, introduces Hypothesis 3 as one of central proposition.
H3.
The impact of digital financial inclusive on urban carbon intensity exhibits spatial spillover effects.
3. Methods
The research steps of this study are presented in Figure 4; the specific steps are as follows:
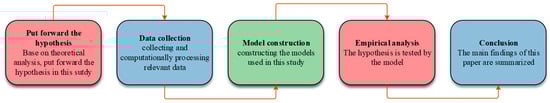
Figure 4.
The research steps of this study.
- Put forward the hypothesis. Grounded in theoretical analysis, this study put forward hypothesis about correlation and spatial heterogeneity among digital financial inclusion, green credit, and urban carbon intensity.
- Data collection. The research involves collecting and computationally processing relevant data to derive indices for digital financial inclusion, green credit development, and urban carbon intensity.
- Model construction. This research constructs three analytical frameworks: a direct effect model, a mediating effect model, and a spatial heterogeneity model.
- Empirical analysis. Based on the calculated data and models, the correlation and heterogeneity between digital financial inclusion, green credit, and urban carbon intensity are analyzed.
- Conclusion. Analyzing the model results and summarizing the main conclusions of this research.
This section delineates the selected variables, including the dependent, independent, control, and mediator variables. Furthermore, it provides an overview of two-way fixed effects model, mediation effects model, and spatial econometric model employed in this study. Finally, it specifies the data sources utilized for analysis.
3.1. Variable Selection
3.1.1. Dependent Variable
Carbon intensity (CI) is designated as the dependent variable, which, defined as the carbon dioxide equivalent emitted per unit of economic output, is a crucial metric for assessing the relationship between economic growth and carbon emissions in the developmental process of a region or economy. It serves as a pivotal indicator of the degree to which an economy is decarbonized and the efficiency with which energy is utilized. Carbon intensity is characterized by two attributes. On the one hand, it is indicative of the energy utilization efficiency of a particular economy; lower values indicate higher efficiency of energy conversion and utilization. Conversely, it is a crucial metric for evaluating the degree of decarbonization within an economic development model and serves as a primary indicator of the quality of economic growth.
Urban carbon emissions (CO2) are calculated using the approach proposed by the Intergovernmental Panel on Climate Change (IPCC).
where CO2 denotes the aggregate volume of carbon dioxide emissions. The term 44/12 denotes the conversion factor for transforming carbon into carbon dioxide. The subscript i signifies the selected energy type (excluding electricity). Additionally, Ki, , and represent the carbon emission coefficient and standard coal conversion coefficient of energy i and p type, and and donate end-use consumption of energy i and p type. Furthermore, indicates the proportion of thermal power in total electricity generation.
Furthermore, the approach proposed by Fang et al. [41] is employed to estimate the carbon intensity for each city. The Gross Domestic Product (GDP) was selected as the economic output indicator in this approach; the computation is expressed by Equation (2), as follows:
where CIit represents the natural logarithm of city’s annual carbon intensity, is a city’s annual carbon emissions, and signifies a city’s annual gross regional product.
3.1.2. Independent Variables
The Digital Inclusive Finance Index (DIF), developed by Peking University’s Digital Finance Research Center in collaboration with Ant Financial Services Group, is employed as the independent variable to measure digital inclusive finance level in each city [42]. The DIF index is highly comprehensive, encompassing a broad range of financial inclusion dimensions enabled by digital methods, including extensive coverage, widespread adoption, and deep integration of digital technologies.
3.1.3. Mediating Variable
In this study, the mediating variable is green credit (GC), building on the theoretical analysis in the preceding section. Each city’s entire credit allotted to environmental initiatives is divided by the total credit in the city to determine its measurement, using the natural logarithm. A higher value of this ratio reflects a more developed green credit sector in the city.
where GCit represents the natural logarithm of city’s annual green credit, ECrit is a city’s annual environmental credits, and Crit signifies a city’s annual credit.
3.1.4. Control Variable
In this research, specific variables were chosen to serve as controls for the analysis, based on prior research:
- Technological advancement (Tec), measured as the ratio of government tax revenue to expenditure on research and technology.
- Financial development (Fin), evaluated as the quotient of a city’s gross domestic product (GDP) relative to the aggregate deposits and loans held by its financial institutions.
- Population size (Pop), calculated as the natural logarithm of the city’s year-end population.
3.2. Model Construction
3.2.1. Two-Way Fixed Effects Model
A two-way fixed effects model was built to evaluate the direct influence of digital financial inclusion on carbon intensity in urban areas.
where CIit donates the natural logarithm of carbon intensity for city i in year t. DIFit shows the progress of financial inclusion in city i using digital methods during the course of year t. Controlit is the control variables. αi denotes the coefficient to be calculated, while cityi captures the individual fixed effects. The error term is represented by εit, while yeart accounts for the time fixed effects.
The two-way fixed-effects model is advantageous in that it eliminates disturbances to the estimates from factors in the city that remain constant over time. Additionally, it incorporates common shocks that fluctuate over time. This dual control mechanism enhances the precision of the model estimates and endows the findings with enhanced internal validity and causal explanatory power.
3.2.2. Mediation Effect Model
The mediation effect model is built in this paper to probe if digital inclusive finance can lower carbon intensity in urban areas by encouraging the growth of green credit:
where GCit represents green credit’s level in city i during year t. DIFit shows the progress of financial inclusion in city i using digital methods during the course of year t. Controlit is the control variables. βi and θi represent the coefficients to be estimated. The error term is represented by εit, while yeart accounts for the time fixed effects. The mediation effect model is a type of two-way fixed-effects model, so it has the same advantages as a two-way fixed-effects model.
3.2.3. Non-Static Spatial Model
The Spatial Durbin Model (SDM) with fixed effects is employed following the Lagrange Multiplier (LM), Wald, and Likelihood Ratio (LR) tests. As shown in Table 1, both “error” and “lag” terms of the Lagrange multiplier have demonstrated statistical significance, suggesting the presence of serial correlation within the dataset. Moreover, since the p-values of both the LM-error and LM-lag are below 0.05, which confirms the existence of both spatial lag and spatial error effects, this shows that there is a time lag effect and a spatial error effect in the impact of digital inclusive finance on the carbon emission intensity of cities, i.e., it cannot affect the carbon emission intensity of cities immediately, and it will have an impact on the carbon emission intensity of other cities. Consequently, the SDM model was selected for this study.

Table 1.
The Lagrange Multipliers (LM) test.
In Table 2, the empirical results of the Hausmann test are displayed. The Hausmann test is a key statistic used to determine the optimal model setting between fixed and random effects in panel data analysis. Moreover, the height of lgt_theta is significant and offers substantial evidence supporting the selection of the fixed effects model. This suggests that distinct categories of surface cities may influence the outcomes of the analysis. Consequently, the implementation of a fixed effects model can enhance the credibility of the results. Consequently, given the statistically significant findings, the fixed effects model was selected because it reliably generates unbiased and efficient estimates in this context. Furthermore, the model’s capacity to control for time-variant heterogeneity among individual units serves to enhance the robustness and reliability of the empirical analysis. The substantial discrepancy between the outcomes depicted in columns (1) and (2) indicates that disregarding the spatial lag term obscures the underlying relationship. The statistical significance of the spatial autoregressive coefficients (rho) justifies the construction of a spatial model.
Table 2.
The spatial Hausman test.
Table 3 presents a comprehensive comparison of model fit statistics across three competing specifications, with a particular focus on the Akaike Information Criterion (AIC) and Bayesian Information Criterion (BIC) values. The empirical outcomes reveal that the “both” model, which incorporates both individual-specific and time-specific fixed effects, consistently outperforms the alternatives. These findings strongly suggest that the two-way fixed effects model is the optimal choice for our analysis, as it effectively accounts for both unobserved heterogeneity across individual units and temporal variations affecting all units simultaneously. Furthermore, the alignment between the AIC and BIC criteria in identifying the “both” models as superior reinforces the robustness of model selection process.
Table 3.
The Likelihood Ratio (LR) test.
The econometric outcomes presented in Table 4 provide robust evidence of the spatial dependence structure in our analysis. Diagnostic tests indicate that both the Spatial Autoregressive Model (SAR) and the Spatial Error Model (SEM) demonstrate statistically significant spatial effects, as reflected by their Prob > chi2 values of less than 0.0001 (p < 0.0001). However, a key insight from these findings is the robustness of the Spatial Durbin Model (SDM), which remains unaffected by spatial dependence issues. This resilience stems from the SDM’s comprehensive specification, which simultaneously accounts for both spatially lagged dependent and independent variables. The findings demonstrate that when the Spatial Durbin Model (SDM) is employed to examine the spatial spillover effects of digital inclusive finance on urban carbon intensity, the model’s outputs are deemed plausible.
Table 4.
The Wald test.
The following are the non-static spatial model’s specifications:
In this model, CIit stands for city i carbon intensity in year t, while DIF donates digital inclusive finance. Control variables are abbreviated as Controlit. The spatially lagged regression coefficient, ρ, captures the extent to which neighboring units within the defined geographical framework influence each other in terms of carbon intensity. The regression coefficients for DIF and control variables are denoted by γ1 and γ2, respectively. The coefficient spatial interaction term for DIF and indicates reflects control variables’ spatial interaction term. W is the spatial weight matrix, yeart denotes time fixed effect, and cityi donates individual fixed effect, while the random perturbation term is provided by εit.
3.3. Data Description
The study draws on the following data sources:
- The primary data sources for carbon intensity (CI) include The China City Statistical Yearbook [43], The China Urban Construction Statistical Yearbook [44], Guidelines for Preparing Provincial Greenhouse Gas Inventories (Trial) [45], and other relevant online resources.
- The data for digital financial inclusion (DIF) are derived from the Beijing University Digital Inclusive Finance Index, covering the period from 2011 to 2020 [42].
- The mediating variable, green credit (GC), is sourced from The Almanac of China’s Finance and Banking [46], The China Statistical Yearbook on Science and Technology [47], and other pertinent professional publications.
- The control variable data are obtained from The China City Statistical Yearbook [43], The China Research Data Service Platform, and The Annual Statistical Report.
Due to the unavailability of data for certain cities and the challenges associated with accurately interpolating missing values during the statistical analysis, this study focuses on analyzing data from 247 urban areas in China spanning the period between 2011 and 2020. The selected timeframe offers a comprehensive representation of urban performance across various stages of development, encompassing diverse economic, social, and environmental indicators.
4. Discussion
This section begins with a regression analysis assessing the impact of digital inclusive finance (DIF) on carbon intensity (CI) in urban areas. Subsequently, robustness and heterogeneity tests were conducted to account for variations across different city types and levels of DIF. Following this, this study investigated the relationship between DIF and CI, with particular emphasis on the intermediary function of green credit (GC). Additionally, the spatial spillovers of DIF on CI were explored. All findings in this section are thoroughly analyzed and discussed.
4.1. Carbon Emission and DIF Calculation Results
The results of calculating the DIF index and carbon emissions for 247 cities in China are presented in Figure 5 and Figure 6, with the white regions indicating non-calculated cities. Figure 5 demonstrates that China’s DIF development underwent a substantial qualitative transition from 2011 to 2020, signifying that China has adopted the digital economy as a developmental trajectory. As illustrated in Figure 6, China’s carbon emissions underwent a period of sustained growth over the past decade. Despite certain initiatives implemented to mitigate these emissions, the overall trend of increasing carbon output has persisted.
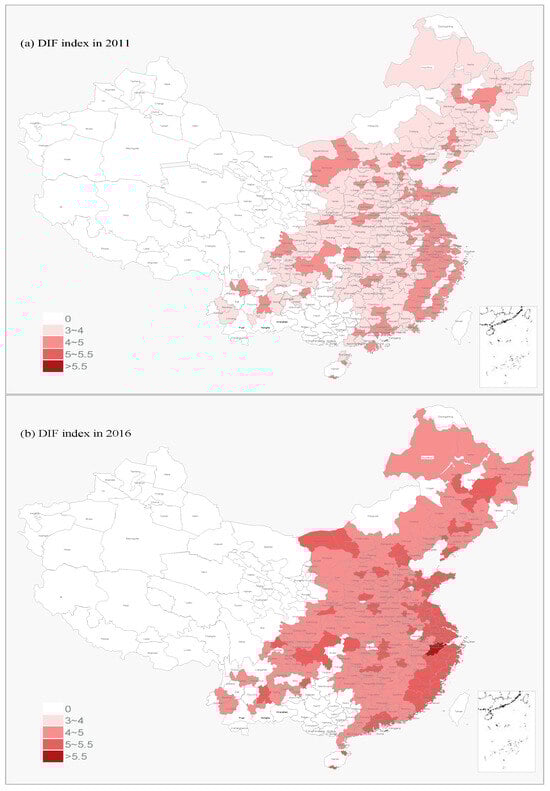
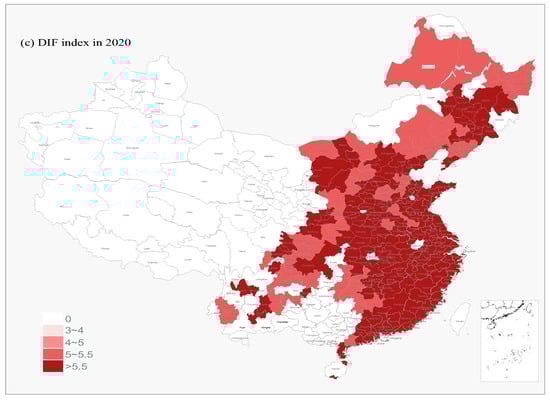
Figure 5.
Digital inclusive finance index heat map of 247 cities in China for the years 2011, 2016, and 2020.
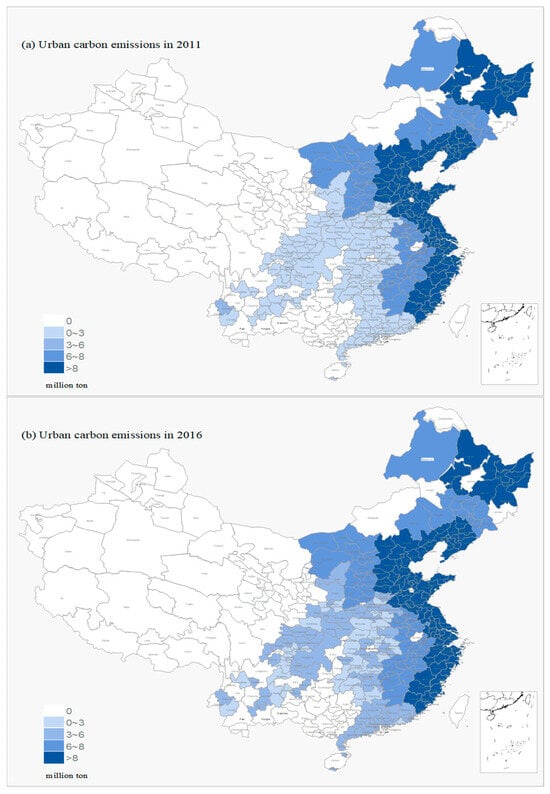
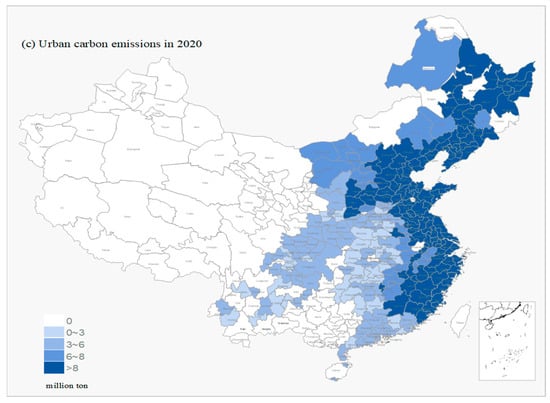
Figure 6.
Urban carbon emission heat map of 247 cities in China for the years 2011, 2016, and 2020.
4.2. Benchmark Regression Analysis
Table 5 displays the results of the benchmark regression analysis examining the impact of DIF on CI. Specifically, Column I presents the regression result without individual and time fixed effects or control variables. Despite this, the outcomes revealed a strongly inverse linkage between DIF and CI at the 1% level.
Table 5.
Benchmark regression of DIF and CI in urban areas.
Regression results with year and city fixed effects are presented in Columns II through V. To address possible endogeneity issues caused by unobserved or excluded variables, control variables were gradually incorporated. The findings support the hypothesis proposed in H1, demonstrating that enhancing financial inclusion through digital means significantly reduces CI. Furthermore, a statistically significant relationship between urban CI and several socioeconomic factors, including population size, financial development, and technological innovation, was observed at the 1% level. Specifically, urban CI tended to decrease as these factors improved.
The findings of the benchmark regression analysis demonstrate that the advancement of digital inclusive finance within the city has led to a substantial reduction in its carbon emission intensity. This suggests that the promotion of digital inclusive finance can stimulate economic growth while concurrently reducing carbon emissions. This outcome is consistent with the conclusions reported in scholarly studies [12,17].
4.3. Robustness Check
The advancement of DIF may influence CI, potentially incentivizing cities with higher CI to expedite the adoption of DIF. Consequently, endogeneity issues could emerge due to a bidirectional causal relationship between urban CI and DIF. This section aims to introduce a robustness testing approach by employing instrumental variables and altering the dependent variable.
Table 6 presents the outcomes of multiple robustness tests. Column I displays the findings when CI is substituted as the dependent variable. Columns II and III present regression results using lagged values of DIF over one and two periods, respectively. To minimize possible endogeneity issues caused by variables that were excluded from the analytical framework, Columns IV and V employ lagged values of CI over one and two periods as instrumental variables. The findings consistently support the reliability and stability of the regression analysis, demonstrating that DIF maintains a significant negative influence on urban CI.
Table 6.
Robustness check of DIF and CI in urban areas.
4.4. Heterogeneity Test
4.4.1. Heterogeneity Test of Different Dimensions of Digital Inclusive Finance
Digital financial inclusion can be examined from three dimensions: digitalization, coverage, and usage depth. This study extends existing research by investigating how these three dimensions influence carbon intensity (CI) in urban areas. As shown in Columns I, II, and III of Table 7, coverage significantly reduced CI at the 1% significance level. Similarly, both digitalization and usage depth exhibited significant inhibitory effects, with significance at the 10% level.
Table 7.
Heterogeneity test of different dimensions of DIF.
Coverage expansion has enabled more urban entities and individuals, especially those previously underserved by financial services, to access basic financial products and services. Advances in this dimension directly break the boundaries of geography and physical outlets, extending financial services to the community level and even achieving “last mile” coverage through mobile devices, thereby reducing the carbon intensity. Increased depth of use reflects the fact that a wider range of digital financial solutions are being adopted by a wide variety of entities and individuals in cities. This includes increased use of advanced financial services such as investment and wealth management, internet insurance, and digital lending. The continued push towards digitization has significantly reduced the cost of services through technological innovation. The application of technologies such as cloud computing, big data, and artificial intelligence has enabled financial institutions to scale their services at near-zero marginal cost, and these cost savings ultimately contribute to reducing carbon intensity.
4.4.2. Heterogeneity Test for Different City Types
Based on the “List of Resource-Exhausted Cities and the National Sustainable Development Plan for Resource-Based Cities (2013–2020)” issued by the Ministry of Natural Resources [48,49], this study classified cities into three distinct categories: non-resource cities, resource-depleted cities, and resource-based cities.
A heterogeneity analysis was performed based on this classification, with the findings detailed in Columns I, II, and III of Table 8. The outcomes reveal that a substantial inverse correlation existed between the CI and DIF. Specifically, the coefficient for resource-depleted cities was statistically insignificant, while that for resource-based cities was significant at the 10% level. On the contrary, non-resource cities’ coefficient exhibited the highest absolute value, with statistical significance at 1% level, indicating that CI in these cities is strongly influenced by DIF.
Table 8.
Heterogeneity test for different city types.
In non-resource cities, this phenomenon is mainly fueled by the prevalence of technology and service-oriented sectors, which foster a more flexible and diverse economic structure. Such a structure enables these cities to effectively improve the expansion of digital inclusive finance, thereby simplifying and enhancing obtain to funding options for enterprises, particularly micro, small, and medium-sized enterprises (MSMEs). These enterprises often face significant challenges in securing financing, which is typically expensive and difficult to obtain. DIF can alleviate these financial barriers by reducing costs and improving capital utilization efficiency. As a result, it stimulates investment in sustainable development and environmentally friendly innovation. Specifically, digital financial inclusion facilitates green finance projects by providing low-interest loans, credit services, and other financial products. These investments help reduce urban carbon emission intensity while enhancing resource efficiency.
Additionally, more MSMEs are being integrated into the green economy due to the adaptability and extensive reach of digital inclusive finance, which takes a substantial part in broader movement toward sustainable development. Although both resource-based and resource-depleted cities can benefit from digital inclusive finance, their heavy reliance on resource extraction and manufacturing, coupled with their relatively homogeneous economic structures, constrains the technology’s advancement.
Resource-based and resource-depleted cities can more effectively address climate change challenges and promote low-carbon development by enhancing economic diversification and expanding the scope and efficacy of digital inclusive finance. The significant inverse linkage between CI and DIF observed in non-resource cities emphasizes the essential importance of DIF in supporting green transitions and fostering sustainable growth. However, to fully leverage the capabilities of digital financial inclusion and drive their economies toward greener, low-carbon outcomes, resource-based and resource-depleted cities must implement structural reforms and secure legislative support.
4.5. Mediating Effects Analysis
The present study developed a mediation effect model to test hypothesis H2, employing a theoretical analysis framework. The empirical results are presented in Table 9. Firstly, the regression results in Column I indicate that the implementation of DIF had a direct inhibitory effect on CI in urban areas. This result verifies that digital financial development can effectively promote urban low-carbon transition. Subsequently, Column II examines the impact of DIF on GC development. Although the direction of the coefficients suggests that DIF may promote GC growth, the statistical significance was insufficient (p>0.1), indicating that the direct impact of digital finance on green credit has not yet fully emerged. It is noteworthy that the regression results in Column III, which incorporates both DIF and GC, demonstrate that after controlling for the level of GC development, the inhibitory effect of DIF on CI remains significant. Furthermore, the coefficient of GC exhibited a substantial negative relationship, suggesting that digital finance may indirectly reduce the carbon intensity of the city through the potential channel of fostering the green credit market. A synthesis of the results of the mediation effect test indicates that, although the direct effect dominates, DIF does have a transmission path that can indirectly inhibit urban carbon intensity by promoting the development of green credit. Consequently, the findings provide substantiation for Hypothesis H2, which posits that digital financial inclusion possesses the capacity to directly curtail urban carbon intensity while concurrently exerting an indirect mitigation effect through the promotion of green credit development. This finding provides new empirical evidence for understanding the mechanism of digital finance’s role in influencing carbon intensity, and it is an important revelation for improving the green financial policy system.
Table 9.
Mediating effects analysis of GC.
4.6. Spatial Effects Analysis
Theoretical analysis suggests that digital financial inclusion exists spatial spillover effects on carbon intensity in urban areas. To validate Hypothesis H3, this study employed dynamic spatial econometric modeling.
4.6.1. Construction of Spatial Weighting Matrix
Prior to analyzing the geographical dependencies across cities, it is essential to construct a spatial weight matrix. Given that the samples selected in this paper do not encompass all Chinese cities, there are map blank areas. The use of an adjacency matrix will produce boundary effects, and the inverse distance spatial matrix can be analyzed by choosing different attenuation parameters to produce the effect of approximate robustness test. This study utilized two types of spatial weight matrices: the geographical inverse distance weight matrix (W1) and the spatial inverse distance squared weight matrix (W2).
where dij represents the distance between the centroids of cities i and j. The coordinates φi and φj represent the latitude and longitude of the respective cities, while Δτ denotes the longitudinal difference between them. R is the Earth’s radius, because the earth is not a perfect sphere, but an approximate ellipsoid, with different standard models giving slightly different values for the radius. In this study, 6371 km given by the International Earth Reference System (IERS) was chosen as the R.
4.6.2. Spatial Autocorrelation Test
The overall geographical correlation between urban CI and DIF was assessed using the worldwide Moran’s I index. This is how it is computed:
where S2 represents sample variance, and xi and xj denote the observations in cities i and j. n indicates the number of units, and denotes the average of variable x. Wi donates the element of the spatial weight matrix W.
The global Moran’s I index for CI and DIF from 2011 to 2020 demonstrates a statistically significant positive geographical link. This indicates a strong spatial dependency between urban carbon intensity and digital financial inclusion. The corresponding global Moran’s I index for DIF and CI is detailed in Table 10.
Table 10.
The global Moran’s I index for CI and DIF.
Local spatial autocorrelation analysis that focuses on investigating the distribution patterns of individual attribute values within a heterogeneous spatial context. It quantifies the level of spatial correlation between a specific region and adjacent areas. The Local Moran’s I used in this analysis can be calculated using Equation (11):
The analysis of Moran scatter plots in Figure 7 and Figure 8 indicates that the Local Moran’s I for both CI and DIF in 2011 and 2020 are significantly greater than zero (I > 0), with corresponding p-values below the 0.1 significance level (p < 0.1). This demonstrates a statistically significant positive spatial autocorrelation for both indicators, reflecting distinct spatial clustering patterns. Moreover, a comparative investigation demonstrates a significant increase in the Local Moran’s I of CI and DIF from 2011 to 2020. This upward trend suggests a progressive intensification of spatial interdependencies between the two indicators over time, likely driven by deepened regional interactions or the cumulative effects of localized dynamic processes under spatial heterogeneity. These findings not only confirm the non-random spatial distribution of CI and DIF but also offer empirical insights for optimizing regional resource allocation and formulating differentiated management strategies.
Figure 7.
Moran scatter plot of carbon intensity and digital inclusive finance under the W1 matrix.
Figure 8.
Moran scatter plot of carbon intensity and digital inclusive finance under the W2 matrix.
4.6.3. Results of Spatial Measurement
Table 11 summarizes the geographic estimation results for CI and DIF. Notably, the coefficients of DIF under both spatial weight matrices were statistically significant at the 5% threshold and exhibited negative values. This finding further corroborates H1, suggesting that DIF significantly mitigates the expansion of urban CI.
Table 11.
Spatial Durbin model empirical results.
The interaction terms involving the two spatial weight matrices and DIF were statistically significant (p < 0.01). The negative interaction term coefficients indicate that the enhancement of digital financial inclusion not only reduces the local CI but also generates a significant emission reduction effect on neighboring cities through geographic proximity. This result corroborates the previous study [5]. The findings offer substantial support for H3, thereby confirming that the implementation of DIF can indeed produce significant geographic spillover effects. That is to say, an increase in the level of digital financial development in one city results in a decrease in carbon intensity in neighboring cities. This finding provides a significant foundation for the development of regionally coordinated emission reduction policies. It is recommended that this spatial spillover effect be amplified through the establishment of a cross-regional digital finance cooperation mechanism. This would promote regional low-carbon transformation more effectively.
5. Conclusions and Policy Implications
5.1. Conclusions
By analyzing panel data from 247 Chinese cities spanning the period 2011 to 2020, this study examined the impacts and geographical spillover effects of digital inclusive finance (DIF) on urban carbon intensity (CI). For this purpose, a two-way fixed effects model, a mediation effects model, and a dynamic Spatial Durbin Model were selected. Below is a summary of the main findings:
The DIF plays a pivotal role in mitigating urban CI. The DIF, with its distinctive techno-logical advantages and inclusivity, significantly promotes the dissemination and adoption of green credit practices, thereby exerting a positive influence on the reduction of urban CI. This transmission mechanism of “digital inclusion–green credit–carbon intensity reduction” provides a novel pathway for the low-carbon transformation of cities.
The heterogeneity analysis reveals that the inhibitory effect of DIF on urban CI is more pronounced in resource-based cities and non-resource-based cities. Furthermore, all three sub-indicators of DIF have a significant impact on CI, with the inhibitory effect of coverage being more pronounced than that of digitization and usage depth.
The spatial impact of DIF development on urban CI is statistically significant. Notably, the advancement of DIF not only reduces CI in metropolitan areas but also exerts a positive spillover effect by lowering CI in surrounding cities.
5.2. Policy Implications
Policymakers may refer to the following policy recommendations considering the findings of the study:
Firstly, the development of DIF and green credit is a significant strategy for mitigating urban CI. It is incumbent upon policymakers to expedite the development of a comprehensive financial infrastructure that facilitates the real-time monitoring, accounting, and dissemination of CI data, thereby ensuring the precise implementation of DIF. Green financial institutions must innovate green credit enhancement models and establish digital industry financing docking platforms. Utilizing big data to align financing needs, the or-generation prioritizes the provision of green credit for energy-saving technological reforms and clean energy projects of enterprises, ensuring the precise implementation of green credit.
Secondly, policymakers should develop differentiated policies based on realities. For resource-based and non-resource-based cities, the government should prioritize the ex-pension of digital technologies by increasing the availability of financial services and establishing a system that links carbon data with pricing policies. For resource-based cities, the establishment of a low-carbon transition financing fund can serve as a crucial strategy to address these challenges. Concurrently, the implementation of a structured develop-mental trajectory, characterized by an initial emphasis on “coverage first, depth follow-up”, has been initiated.
Finally, relevant organizations should promote city cooperation and strengthen co-operation on energy conservation and emission control policies. At the same time, they should promote knowledge sharing and organize regular information exchange meetings between cities to facilitate the exchange of low-carbon technologies and promote collaborative emission reduction actions.
As digital inclusive finance evolves, subsequent studies could expand the sample coverage to strengthen the representativeness of findings. While urban carbon emission intensity constitutes the core analytical focus, rural carbon patterns remain underexplored. Future work could systematically integrate rural data to enable cross-regional comparisons. Methodological refinements are needed to address temporal dynamics in digital finance development.
Author Contributions
Conceptualization, J.J., R.Z., and G.Z.; methodology, J.J., R.Z., and F.C.; validation, J.J. and G.Z.; formal analysis, J.J., R.Z., and F.C.; investigation, J.J. and R.Z.; resources, J.J. and G.Z.; data curation, R.Z. and F.C.; writing—original draft preparation, J.J., R.Z., and G.Z.; writing—review and editing, G.Z. and P.W.; visualization, R.Z.; supervision, G.Z and P.W.; project administration, J.J., G.Z., and P.W.; funding acquisition, J.J. and G.Z. All authors have read and agreed to the published version of the manuscript.
Funding
The present study was supported by Hebei Natural Science Foundation (Grant No. G2024402002), Hebei Social Science Foundation Project (Grant No. HB24ZT036), Science Research Project of Hebei Education Department (Grant No. SQ2024132 and No. ZD201903), Sports Technology Research Project of Hebei Province (Grant No. 2025CY27), Statistical Science Research Projects of Hebei Province (Grant No. 2023HY16), and Handan Philosophy and Social Science Planning Project (Grant No. 2024119).
Institutional Review Board Statement
Not applicable.
Informed Consent Statement
Not applicable.
Data Availability Statement
The data presented in this study are available on request from the corresponding author.
Conflicts of Interest
The authors declare no conflicts of interest.
Abbreviations
The following abbreviations are used in this manuscript:
| DIF | Digital inclusive finance |
| CI | Carbon intensity |
References
- Bevacqua, E.; Schleussner, C.F.; Zscheischler, J. A year above 1.5 °C signals that Earth is most probably within the 20-year period that will reach the Paris Agreement limit. Nat. Clim. Chang. 2025, 15, 262–265. [Google Scholar] [CrossRef]
- Yan, Y.; Zhang, H.; Zhang, M. Study on the Impact of Digital Financial Inclusion on Low-Carbon Agricultural Development in Guizhou Province—Empirical analysis based on two-way fixed effects model and mediated effects model. Procedia Comput. Sci. 2024, 242, 428–435. [Google Scholar] [CrossRef]
- Zhang, Y.; Qu, X. Can digital financial inclusion promote the coupling coordination between pollution reduction and low-carbon development? Evidence from China. Econ. Anal. Policy 2024, 82, 1113–1130. [Google Scholar] [CrossRef]
- Cheng, Q.; Zhao, X.; Zhong, S.; Xing, Y. Digital financial inclusion, resident consumption, and urban carbon emission in China: A transaction cost perspective. Econ. Anal. Policy 2024, 81, 1336–1352. [Google Scholar] [CrossRef]
- Wang, H.; Guo, J. Impacts of digital inclusive finance on CO2 emission from a spatial perspective: Evidence from 272 cities in China. J. Clean. Prod. 2022, 355, 131618. [Google Scholar] [CrossRef]
- Li, N.; Zhou, Y. Can digital financial development promote corporate green technology innovation? Int. Rev. Econ. Financ. 2024, 92, 1562–1582. [Google Scholar] [CrossRef]
- Ozili, P.K. Impact of digital finance on financial inclusion and stability. Borsa Istanb. Rev. 2018, 18, 329–340. [Google Scholar] [CrossRef]
- Allen, F.; Demirguc-Kunt, A.; Klapper, L.; Peria, M.S.M. The foundations of financial inclusion: Understanding ownership and use of formal accounts. J. Financ. Int. 2016, 27, 1–30. [Google Scholar] [CrossRef]
- Vives, X. Digital disruption in banking. Annu. Rev. Financ. Econ. 2019, 11, 243–272. [Google Scholar] [CrossRef]
- Yin, Z.; Gong, X.; Guo, P.; Wu, T. What drives entrepreneurship in digital economy? Evidence from China. Econ. Model. 2019, 82, 66–73. [Google Scholar] [CrossRef]
- Weina, D.; Gilli, M.; Mazzanti, M.; Nicolli, F. Green inventions and greenhouse gas emission dynamics: A close examination of provincial Italian data. Environ. Econ. Policy Stud. 2016, 18, 247–263. [Google Scholar] [CrossRef]
- Zhang, R.; Wu, K.; Cao, Y.; Sun, H. Digital inclusive finance and consumption-based embodied carbon emission: A dual perspective of consumption and industry upgrading. J. Environ. Manag. 2023, 325, 116632. [Google Scholar] [CrossRef] [PubMed]
- Xu, N. How population aging promotes carbon emission reduction in Chinese cities: The chain mediating role of industrial upgrading and energy conservation. J. Environ. Manag. 2024, 354, 120434. [Google Scholar] [CrossRef]
- Jiang, B.; Du, M.; Wang, D. Carbon emission trading, industrial structure upgrading and green development: Excess benefits of combined actions. Econ. Anal. Policy 2024, 82, 480–501. [Google Scholar] [CrossRef]
- Du, K.; Li, P.; Yan, Z. Do green technology innovations contribute to carbon dioxide emission reduction? Empirical evidence from patent data. Technol. Forecast. Soc. Chang. 2019, 146, 297–303. [Google Scholar] [CrossRef]
- Ali, U.; Guo, Q.; Nurgazina, Z.; Sharif, A.; Kartal, M.T.; Depren, S.K.; Khan, A. Heterogeneous impact of industrialization, foreign direct investments, and technological innovation on carbon emission intensity: Evidence from Kingdom of Saudi Arabia. Appl. Energy 2023, 336, 120804. [Google Scholar] [CrossRef]
- Wei, D.; Ahmad, F.; Chandio, A.A.; Khan, I. Digital financial inclusion role to promote renewable energy technology innovation in Chinese prefectural cities: Moderating role of environmental governance. Renew. Energy 2024, 237, 121704. [Google Scholar] [CrossRef]
- Lee, M.; Zhang, N. Technical efficiency, shadow price of carbon dioxide emission, and substitutability for energy in the Chinese manufacturing industries. Energy Econ. 2012, 34, 1492–1497. [Google Scholar] [CrossRef]
- Feng, S.; Chong, Y.; Yu, H.; Ye, X.; Li, G. Digital financial development and ecological footprint: Evidence from green-biased technology innovation and environmental inclusion. J. Clean. Prod. 2022, 380, 135069. [Google Scholar] [CrossRef]
- Wang, J.; Tian, J.; Kang, Y.; Guo, K. Can green finance development abate carbon emission: Evidence from China. Int. Rev. Econ. Financ. 2023, 88, 73–91. [Google Scholar] [CrossRef]
- Shan, S.; Genç, S.Y.; Kamran, H.W.; Dinca, G. Role of green technology innovation and renewable energy in carbon neutrality: A sustainable investigation from Turkey. J. Environ. Manag. 2021, 294, 113004. [Google Scholar] [CrossRef]
- Liu, Y.; Dong, K.; Jiang, Q. Assessing energy vulnerability and its impact on carbon emission: A global case. Energy Econ. 2023, 119, 106557. [Google Scholar] [CrossRef]
- Pei, P.; Zhang, S.; Zhou, G. Digital Inclusive Finance, Spatial Spillover Effects and Relative Rural Poverty Alleviation: Evidence from China. Appl. Spat. Anal. Policy 2024, 17, 1129–1160. [Google Scholar] [CrossRef]
- Sun, X.; Yu, T.; Yu, F. The Impact of Digital Financial Inclusion on Agricultural Mechanization: Evidence from 1869 Counties in China. China Econ. Trans. 2023, 6, 416–441. [Google Scholar] [CrossRef]
- Wang, H.; Li, Y.; Lin, W.; Wei, W. How does digital technology promote carbon emission reduction? Empirical evidence based on e-commerce pilot city policy in China. J. Environ. Manag. 2023, 325, 116524. [Google Scholar] [CrossRef]
- Xu, D.; Guo, D.; Yue, P.; Li, M. Household green consumption: Does digital inclusion matter? Int. Rev. Financ. Anal. 2024, 91, 102977. [Google Scholar] [CrossRef]
- Li, Z.; Yuan, B.; Wang, Y.; Qian, J.; Wu, H. The role of digital finance on the synergistic governance of pollution & carbon: Evidence from Chinese cities. Sustain. Cities Soc. 2024, 115, 105812. [Google Scholar] [CrossRef]
- Tao, Z.; Wang, X.; Li, J.; Wei, X. How can digital financial inclusion reduces relative poverty? An empirical analysis based on China household finance survey. Financ. Res. Lett. 2023, 58, 104570. [Google Scholar] [CrossRef]
- Xuan, S.; Ge, W.; Yang, P.; Zhang, Y. Exploring digital finance, financial regulations and carbon emission nexus: New insight from resources efficiency, industrial structure and green innovation in China. Resour. Policy 2024, 88, 104452. [Google Scholar] [CrossRef]
- Zhang, X.; Liang, D.; Zhang, S. The Impact of Digital–Financial Dual Pilot Policy on Carbon Emission Efficiency: Evidence from Chinese Cities. Land 2025, 14, 686. [Google Scholar] [CrossRef]
- Yang, S.; Dong, K.; Wang, J.; Taghizadeh-Hesary, F. Blessings or curses? Exploring the impact of digital technology innovation on natural resource utilization efficiency in China. Resour. Policy 2024, 98, 105319. [Google Scholar] [CrossRef]
- Wanof, M.I. Digital technology innovation in improving financial access for low-income communities. Technol. Soc. Perspect. 2023, 1, 26–34. [Google Scholar] [CrossRef]
- Zheng, W.; Zhang, L.; Hu, J. Green credit, carbon emission and high quality development of green economy in China. Energy Rep. 2022, 8, 12215–12226. [Google Scholar] [CrossRef]
- Zhang, M.; Li, X.; Pai, C.H.; Ding, H.; Zhang, X. Green credit and fossil fuel resource efficiency: Advancing sustainability in Asia. Resour. Policy 2023, 86, 104204. [Google Scholar] [CrossRef]
- Xu, B. Fostering green technology innovation with green credit: Evidence from spatial quantile approach. J. Environ. Manag. 2024, 369, 122272. [Google Scholar] [CrossRef] [PubMed]
- Lee, C.C.; Lou, R.; Wang, F. Digital financial inclusion and poverty alleviation: Evidence from the sustainable development of China. Econ. Anal. Policy 2023, 77, 418–434. [Google Scholar] [CrossRef]
- Guo, W.; Yang, B.; Ji, J.; Liu, X. Green finance development drives renewable energy development: Mechanism analysis and empirical research. Renew. Energy 2023, 215, 118982. [Google Scholar] [CrossRef]
- Guo, Q.; Wang, Y.; Dong, X. Effects of smart city construction on energy saving and CO2 emission reduction: Evidence from China. Appl. Energy 2022, 313, 118879. [Google Scholar] [CrossRef]
- Yue, H.; Zhou, Z.; Liu, H. How does green finance influence industrial green total factor productivity? Empirical research from China. Energy Rep. 2024, 11, 914–924. [Google Scholar] [CrossRef]
- Xu, B.; Lin, B. Green finance, green technology innovation, and wind power development in China: Evidence from spatial quantile model. Energy Econ. 2024, 132, 107463. [Google Scholar] [CrossRef]
- Fang, C.; Wang, S.; Li, G. Changing urban forms and carbon dioxide emission in China: A case study of 30 provincial capital cities. Appl. Energy 2015, 158, 519–531. [Google Scholar] [CrossRef]
- Guo, F.; Wang, J.; Wang, F.; Kong, T.; Zhang, X.; Cheng, Z. Measuring China’s digital financial inclusion: Index compilation and spatial characteristics. China Econ. Q. 2020, 19, 1401–1418. [Google Scholar] [CrossRef]
- National Bureau of Statistics (NBS). China City Statistical Yearbook; China Statistics Press: Beijing, China, 2023.
- National Bureau of Statistics (NBS). China Urban Construction Statistical Yearbook; China Statistics Press: Beijing, China, 2023.
- Ministry of Ecology and Environment of the People’s Republic of China (MEP). Guidelines for Compiling Provincial Greenhouse Gas Lists (Trial); Ministry of Ecology and Environment of the People’s Republic of China: Beijing, China, 2020.
- The People’s Bank of China (PBC). Almanac of China’s Finance and Banking; China Financial Publishing House: Beijing, China, 2023.
- National Bureau of Statistics (NBS). China Statistical Yearbook on Science and Technology; China Statistics Press: Beijing, China, 2023.
- Ministry of Natural Resources of the People’s Republic of China (MONR). National Sustainable Development Plan for Resource-Based Cities (2013–2020); Ministry of Natural Resources of the People’s Republic of China: Beijing, China, 2013.
- Ministry of Natural Resources of the People’s Republic of China (MONR). List of Resource-Exhausted Cities; Ministry of Natural Resources of the People’s Republic of China: Beijing, China, 2015.
Disclaimer/Publisher’s Note: The statements, opinions and data contained in all publications are solely those of the individual author(s) and contributor(s) and not of MDPI and/or the editor(s). MDPI and/or the editor(s) disclaim responsibility for any injury to people or property resulting from any ideas, methods, instructions or products referred to in the content. |
© 2025 by the authors. Licensee MDPI, Basel, Switzerland. This article is an open access article distributed under the terms and conditions of the Creative Commons Attribution (CC BY) license (https://creativecommons.org/licenses/by/4.0/).