Article

Spatio-Temporal Evolution and Identification of Obstacles to High-Quality Economic Development in the Yellow River Basin

1
College of Geography and Environment, Shandong Normal University, Jinan 250358, China
2
Center for Yellow River Civilization and Sustainable Development, Provincial-Ministerial Collaborative Innovation Center for Yellow River Civilization, Henan University, Kaifeng 475001, China
*
Author to whom correspondence should be addressed.
Sustainability 2025, 17(11), 4811; https://doi.org/10.3390/su17114811
Submission received: 22 April 2025 / Revised: 22 May 2025 / Accepted: 22 May 2025 / Published: 23 May 2025

Abstract

:
The Yellow River Basin (YRB) is a significant economic development region in China; however, it faces the challenge of underdeveloped economic levels, which impacts the sustainable development of the national economy. This study constructs an index system for high-quality economic development (HQED) based on five development concepts. The CRITIC method was utilized to comprehensively evaluate 78 prefecture-level cities in the YRB from 2000 to 2022. Techniques such as the Dagum Gini coefficient, exploratory spatial data analysis, Markov chain analysis, and the obstacle degree model were employed to investigate the temporal and spatial evolution of HQED levels and their associated obstacles in the YRB. The findings indicate a positive temporal trend in the HQED index, with increasing intra-group differences and overlapping issues among regions, while inter-group differences are decreasing. Nevertheless, the primary contradiction in the YRB continues to arise from inter-group disparities. Spatially, the development regions are predominantly centered around provincial capitals, exhibiting a pronounced “fault line” phenomenon and characteristic “spatial proximity”. In terms of evolutionary trends, the likelihood of each region maintaining its current state is relatively high; however, regions with higher-quality neighborhoods demonstrate a lower probability of stability and a greater likelihood of upward mobility. The positive impacts of high-quality neighborhoods outweigh the negative effects associated with low-quality areas. In terms of obstacles, factors such as sharing and coordination hinder progress in HQED in the YRB, with challenges related to coordination, innovation, and openness intensifying in recent years.

1. Introduction

The watershed serves as a vital component of Earth’s ecology and human civilization, possessing significance across multiple dimensions, including ecological, economic, social, and cultural aspects. It profoundly influences the global sustainable development process. The watershed economy, a distinct type of regional economy, is characterized by its strong integrity and high interconnectivity. Evidence from various countries demonstrates that watershed economies, especially those linked to major rivers, play a crucial strategic role in the broader context of national development [1]. In the contemporary era, promoting high-quality development of the watershed economy has emerged as a critical issue within the political economy of socialism with Chinese characteristics [2]. Effectively harnessing the economic potential of watersheds and enhancing economic cooperation and coordinated development in these regions are essential for fostering sustained growth and prosperity in the global economy. The Yellow River, due to its unique significance, has emerged as a vital symbol of both nature and culture for the Chinese nation. Investigating the HQED of the YRB reflects China’s proactive approach to sustainable economic development, Thus, promoting high-quality economic development in the Yellow River Basin is a vital pathway for achieving high-quality development in China’s economic framework. A comprehensive and objective evaluation of the study area is essential for improving its development quality. Nonetheless, the per capita income of residents in urban and rural areas across the nine provinces and autonomous regions of the YRB remains below the national average (Economic Reference Network, 2020). Therefore, achieving HQED in the YRB is crucial. In October 2021, the Central Committee of the Communist Party of China and the State Council issued the “Outline for Ecological Protection and High-Quality Development of the YRB”, which emphasizes that promoting HQED in this region is strategically necessary for enhancing cooperation across the basin, narrowing the North–South development gap, and improving people’s livelihoods (Economic Reference Network, 2021), and it is an inevitable requirement for realizing sustainable development. Additionally, the YRB, as a key core area for grain production in China, holds a significant strategic position in the country’s economic and social development (People’s Daily Online, 2020). Research on HQED has been a focal point, concentrating on four main aspects. First, concerning the connotation of HQED, early research predominantly focused on general issues related to economic development in the YRB. This research primarily examined the upgrading of China’s industrial structure [3], various economic development models, structural and dynamic forms [4], the new development pattern of mutual promotion between domestic and international markets [5], socio-economic well being [6], supply-side reforms, and the use of reform measures to stimulate economic growth [7,8]. Currently, academia has reached a broad consensus that high-quality development represents a comprehensive model characterized by the coordination and unity of economic, social, and ecological dimensions, emphasizing a people-centered approach aimed at shared development outcomes. The essence of HQED involves a shift in focus from quantity growth to efficiency enhancement, a transition in development pathways from scale expansion to structural optimization, and a change in development drivers from factor input-driven growth to innovation-driven growth [9,10]. Secondly, the factors influencing HQED encompass green technological innovation, financial structure, land use, digital productivity, social capital, the development of digital infrastructure, and environmental regulation [11,12,13,14,15,16,17]. Thirdly, regarding the construction of the indicator system, various methodologies are employed, including the use of total factor productivity, green total factor productivity, and labor productivity as proxy indicators for specific study areas [18,19,20]. Alternatively, the indicators may emphasize aspects such as “high-quality supply, demand, development efficiency, economic operation, and openness [21]”; “the structure, stability, welfare, resource utilization, environmental costs, and distribution of developmental outcomes [22]”; “the fundamentals of economic growth and social outcomes [23]”; and “high-quality supply, high-quality demand, development efficiency, structural optimization, economic stability, social benefits, and green development [24]”. Furthermore, Frolov and colleagues employed matrix analysis methods to merge annual productivity growth rates with per capita development indices, thereby establishing an evaluation framework for regional economic growth quality [25]. Additionally, Qi proposed a measurement framework for economic growth quality that encompasses multiple dimensions, including economic scale, development performance, industrial structure, and coordinated development [26]; however, the “Five Development Concepts” remain the primary evaluation model [27,28,29,30,31,32]. Finally, strategies for achieving HQED focus on several key areas: restructuring innovation and technological momentum, enhancing internal and external linkages, reducing regional disparities, optimizing green productivity, and addressing industrial “shortcomings” to refine the pathway toward HQED [33,34].
In summary, significant progress has been made in researching the levels of HQED; however, several limitations persist. (1) In terms of research content, comprehensive analyses over extended periods and across regions within the basin are relatively scarce, and studies on the obstacle factors hindering HQED are insufficient. (2) Concerning the weighting calculation of indicator systems, most studies rely on the entropy weight method and principal component analysis. The entropy weight method is mainly suitable for static research and is not conducive to temporal analyses, while principal component analysis often suffers from stability issues and missing data. Consequently, this study employs the CRITIC method, which comprehensively considers the variability and conflict among indicators, allowing for a more thorough reflection of each indicator’s importance, thus avoiding the limitations of focusing solely on variability or correlation. (3) Methodologically, there is limited application of spatial Markov chains, and the use of obstacle models to identify the factors obstructing HQED requires further refinement.
This study investigates HQED within the YRB, aiming to elucidate its intrinsic logic and provide both theoretical support and practical guidance for sustainable regional economic development. The specific research objectives are as follows. First, the CRITIC method will be employed to determine the weights of indicators, thereby accurately quantifying their importance in the evaluation system for HQED in the YRB. Second, the Dagum Gini coefficient and Moran’s I will be utilized to systematically analyze the temporal evolution characteristics and spatial distribution patterns of inter-regional differences in HQED levels among 78 prefecture-level cities from 2000 to 2022. Finally, the Markov chain model will facilitate an in-depth exploration of the spatio-temporal evolution trends of HQED while identifying key restrictive factors that impede this progress. The following primary research questions are posed: What temporal change patterns and spatial distribution characteristics do the inter-regional differences in HQED levels exhibit among the 78 prefecture-level cities in the YRB from 2000 to 2022? In the spatio-temporal evolution trends revealed by the Markov chain model, which factors emerge as core obstacles to HQED in the YRB? Through an extensive investigation of these questions, this study aims to achieve a precise understanding of the long-term context of HQED in the YRB, thereby providing a robust foundation for the scientific formulation of policies that align with the basin’s developmental rhythm and indicating pathways to overcome developmental bottlenecks and achieve coordinated regional economic growth.

2. Materials and Methods

2.1. Research Methods

2.1.1. Construction of the Indicator System for HQED in the YRB

High-quality economic development is a multidimensional and systematic evolutionary process, and its evaluation indicator system must integrate both conceptual transmission and practical guidance. This paper synthesizes and organizes the research conducted by various scholars regarding high-quality economic development in the Yellow River Basin, ultimately constructing a development framework tailored to the region’s economic needs [35,36]. The indicator system is presented in Table 1.
(1)
Innovative Capability: Innovation is a critical driving force behind economic growth and social progress. The level of human capital reflects the cultivation of talent for innovation, while the ratio of scientific and technological fiscal expenditures to local general public budget expenditures indicates the investment in innovation. The number of invention patents authorized per ten thousand people serves as a measure of a region’s innovation output.
(2)
Coordinated Capability: There exists a significant gap in economic and developmental levels between the upstream, midstream, and downstream areas of the YRB, as well as among different provinces. As such, collaborative development is essential to achieve regional coordination. The income and consumption disparity between urban and rural areas reflects the degree of urban–rural coordination in a region. The advanced industrial structure index and rationalization index provide insights into the level of industrial structure coordination.
(3)
Green Development Capability: As a crucial ecological protection zone, the YRB plays a vital role in the overall ecosystem, and its green development capability significantly impacts environmental quality and ecological balance. The industrial sulfur dioxide emissions per unit of GDP reflect the region’s pollution emission efficiency. Moreover, the proportion of energy-saving and ecological environmental protection expenditures in the fiscal budget highlights the government’s commitment to environmental protection in the YRB. Water consumption per unit of GDP indicates the utilization of water resources in the area, while the comprehensive utilization rate of industrial solid waste reflects resource recycling within the region. Finally, the green coverage rate of built-up areas signifies the sustainable development potential of the YRB’s environment.
(4)
Open and Shared Capability: Openness and sharing are essential pathways for establishing a mutually reinforcing dual cycle of domestic and international markets and are critical for enhancing a region’s competitiveness in economic development. The proportion of total goods imported and exported to GDP illustrates the region’s dependence on foreign trade. The actual utilization of foreign direct investment as a percentage of GDP reflects the region’s use of foreign capital. The number of hospital doctors per ten thousand people indicates the availability of healthcare resources, while the proportion of social security and employment spending within the fiscal budget reflects the social and employment support aspects of residents’ lives. Additionally, the number of broadband internet access users per ten thousand people, the per capita road area, and the gas coverage rate demonstrate the status of infrastructure development in the region.

2.1.2. CRITIC Method

The CRITIC method is an objective weighting technique that considers the comparative strength and conflict of properties. It is characterized by ease of computation, good data adaptability, strong interpretability, and high scalability. Consequently, this study employs the CRITIC method to accurately calculate the weights of each indicator. Zhao Jinhui employed the CRITIC method to investigate the coupled developmental characteristics of energy, environment, economy, and ecology in the Yellow River Basin [37], thereby facilitating a scientific evaluation of the HQED level in the YRB. The specific steps are outlined as follows.
Step 1: Standardization of Indicators: In this step, there are i prefecture-level cities and j indicators, where X i j ′ represents the standardized value of the j indicator for the i prefecture-level city.
Positive indicators are as follows:
X i j = x i j m i n x i j m a x x i j m i n x i j
Negative indicators are as follows:
X i j = m a x x i j x i j m a x x i j m i n x i j
Step 2: Calculate the variability of the indicators as follows:
x ¯ j = 1 n i = 1 n x i j
S j = i = 1 n x i j x ¯ j 2 n 1
Step 3: Calculate indicator conflict as follows:
R j = i = 1 p 1 r i j
This represents the correlation coefficient between indicators i and j.
Step 4: Calculate information quantity as follows:
C j = S j i = 1 p 1 r i j = S j × R j
The larger the value, the greater the role of the j-th evaluation indicator within the entire evaluation indicator system, and consequently, the greater its weight.
Step 5: Calculate weights.
The weight of the j-th indicator is given by
W j = C j j = 1 p C j

2.1.3. Dagum Gini Coefficient

The Dagum Gini [38] coefficient is a pivotal metric for assessing income distribution inequality. Compared to the traditional Gini coefficient, it offers clear advantages by allowing a more in-depth analysis of the underlying causes of economic development imbalances. This coefficient serves as a robust tool for examining disparities in economic development. This study employs the Dagum Gini coefficient to investigate spatial differences and specific sources of HQED in the YRB. The specific formula is as follows:
G = j = 1 k   h = 1 k   i = 1 n j   r = 1 n h   | y j i y h r | 2 n 2 y ¯
where G denotes the overall Gini coefficient, n represents the number of research areas, k indicates the number of regional divisions, and y ¯ is the average index of all prefecture-level cities within the region. Additionally, n designates the number of measured objects, y j i ( y h r ) denotes the value of any object within the measured area of j(h), and n j ( n h ) indicates the count of measured objects in the j(h) area.

2.1.4. Exploratory Spatial Data Analysis

This study utilizes exploratory spatial data analysis to compare correlations among regions, revealing the spatial differentiation characteristics of HQED levels in the YRB through global and local Moran’s indices.
(1)
Global autocorrelation. Global autocorrelation primarily assesses the overall spatial correlation and regional discrepancies during the HQED of the YRB [39]. Its calculation formula is as follows:
M o r a n s   I = i = 1 n j = 1 n W i j X i X ¯ X j X ¯ S 2 i = 1 n j = 1 n W i j
S 2 represents the discrete variance; X ¯ represents the mean; n is the number of prefecture-level cities; X i and Xj are the HQED indices of prefecture-level cities i and j, respectively; and Wij is the spatial weight matrix used, indicating the common boundary between spatial units i and j, with Wij assigned values of 1 or 0.
(2)
Local autocorrelation. Local autocorrelation primarily examines the spatial correlation of index changes within and between neighboring regions and, combined with visual processing, reveals the spatial heterogeneity of the changes in HQED levels in the YRB [40].
I i = X i X ¯ S 2 j = 1 m W i j X i X ¯
The meanings of all symbols are the same as those in Formula (9).

2.1.5. Markov Chain

Markov chains are widely used to describe the evolution of random variables over time [41]. Markov chains have two states. First, the traditional Markov chain. This study introduces a Markov transition probability model for analysis, discretizing continuous data into k types. Under conditions of both temporal and state discretization, a k × k transition probability matrix P is constructed to present the probability distribution and dynamic evolution of each category, thereby revealing the internal evolutionary trends and positional shifts in HQED in the YRB.
Second, the spatial Markov chain extends the traditional Markov chain into the spatial dimension, incorporating unique factors and characteristics. This approach decomposes the original k × k traditional Markov chain into k k × k matrices while integrating spatial interactions among states, thereby effectively demonstrating the dynamic changes in HQED levels in the YRB under spatial spillover effects.

2.1.6. Obstacle Degree Model

The obstacle factor model determines the obstacle degree of each indicator by calculating the factor contribution and deviation [42], thereby clarifying the primary constraints on the system. The formulas for calculation are
F i j = W j W i j
I i j = 1 X i j
O i j = F i j × I i j i = 1 n F i j × I i j
U i = i = 1 n i O i j
where X i j represents the standardized value of the indicator, F i j denotes the factor contribution of the j-th indicator at the i-th criterion layer, W i j represents the weight of the j-th indicator at the i-th criterion layer, W j represents the weight of the i-th criterion layer, and the weights of each indicator at the criterion layer are normalized. Here, O i j denotes the O value of the j-th indicator at the i-th criterion layer and U i represents the U value of the i-th criterion layer.

3. Results and Analysis

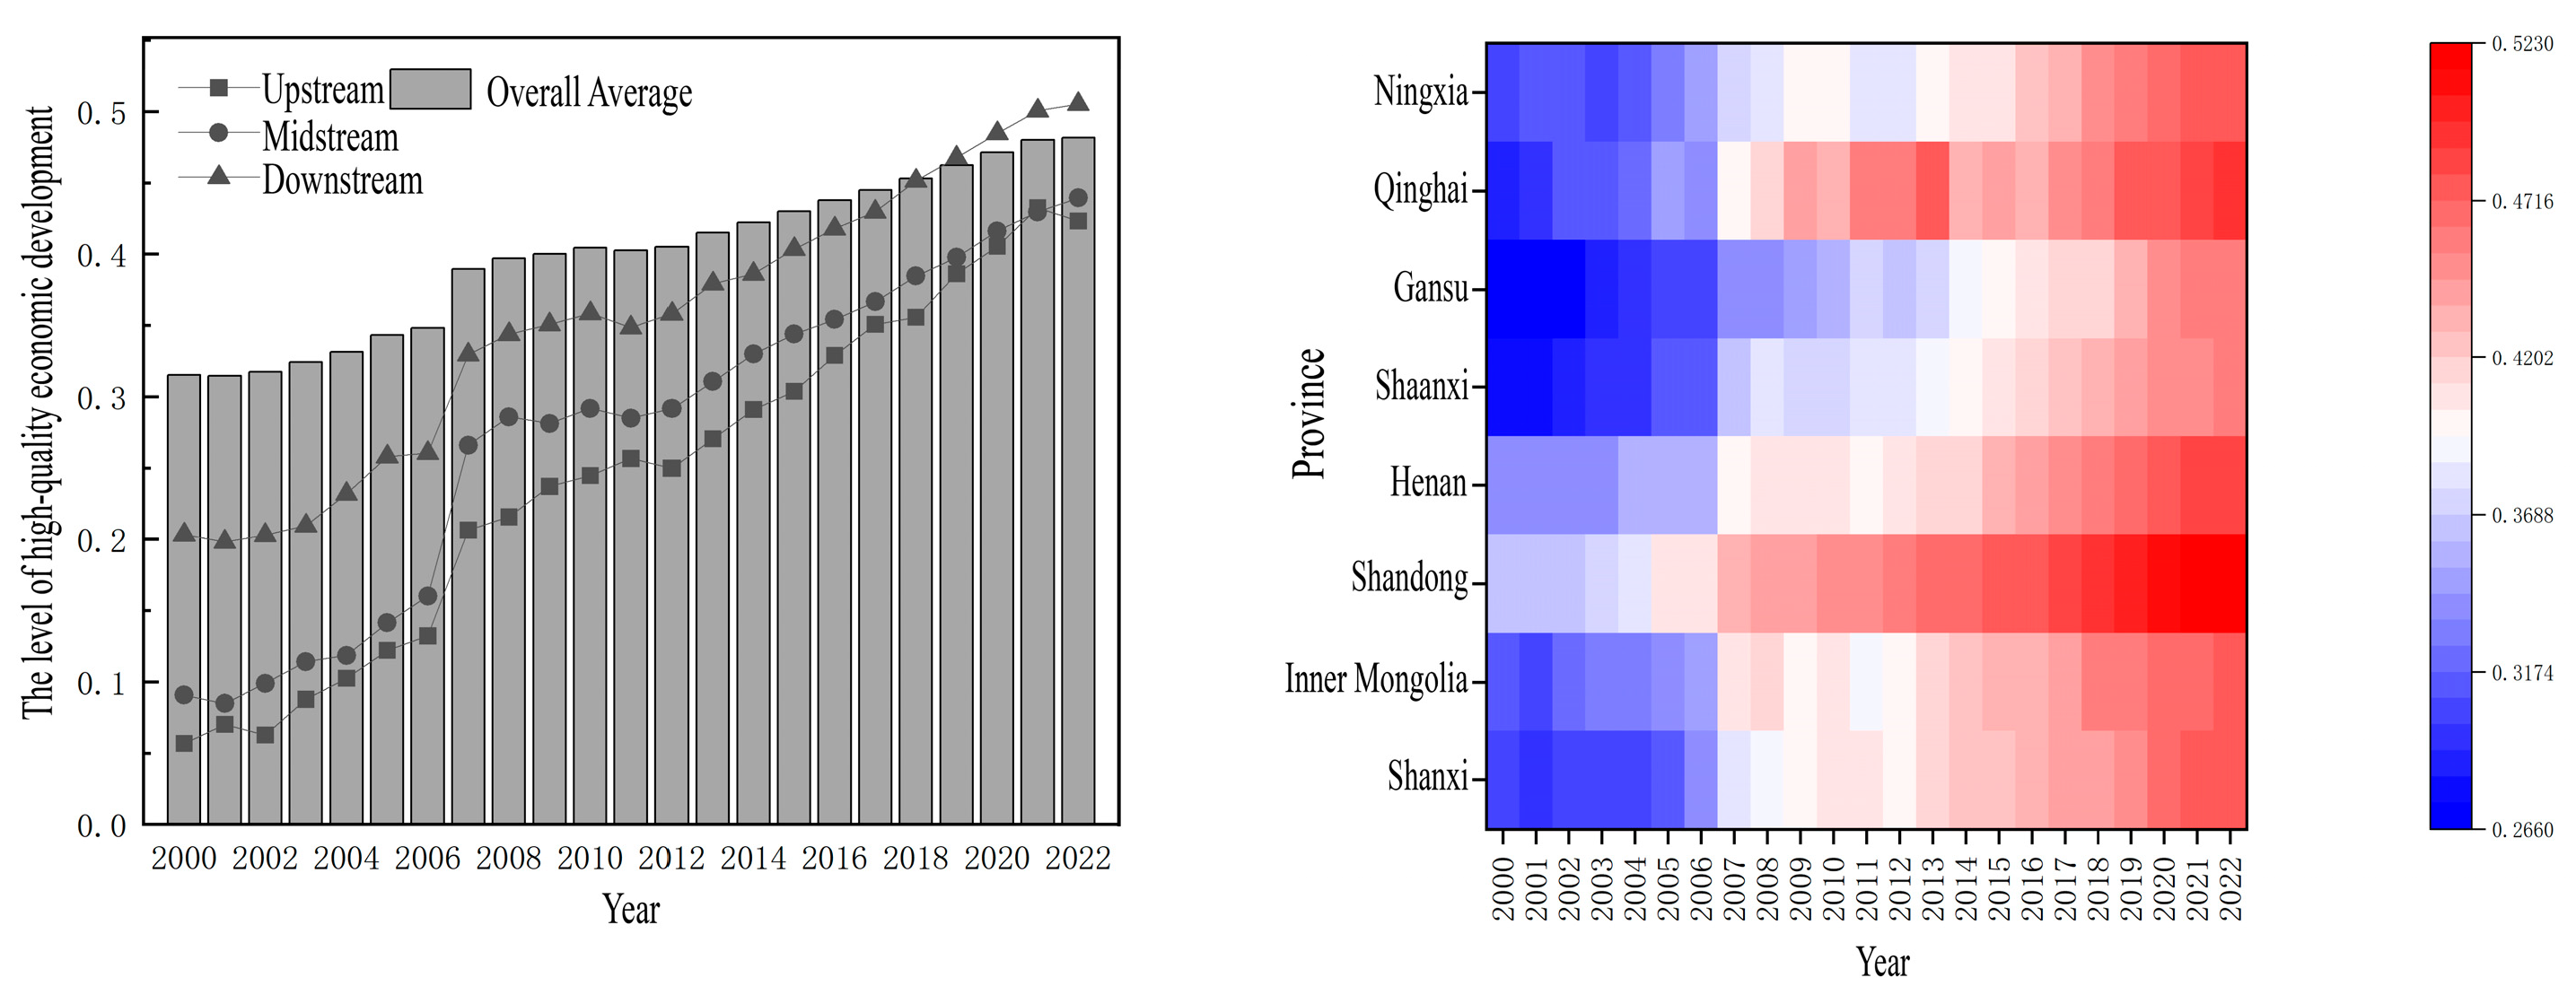
3.1. Temporal Evolution Characteristics of HQED in the YRB

3.1.1. Analysis of Differences in HQED Levels Across Different Dimensions in the YRB

To gain a more comprehensive understanding of the temporal evolution characteristics of HQED levels in the YRB, the development indices for the overall region, upstream, downstream, and each province were assessed, as shown in Figure 1. The results indicate that (1) from an overall average perspective, the high-quality development level index for the YRB increased from 0.315 in 2000 to 0.482 in 2022, with an average annual growth rate of 2.1%. Notably, the HQED level experienced significant growth in 2007. Although minor temporal fluctuations occurred during the study period, there remains an overall upward trend. This growth is attributed to the substantial promotion of the coal industry’s structural upgrades and infrastructure development around 2007. (2) In terms of regional dimensions, the high-quality economic development levels follow the order of downstream > midstream > upstream. However, regarding growth rates, the order is reversed, with increases of 65.82%, 59.01%, and 42.98% for the upstream, midstream, and downstream areas, respectively. This growth disparity primarily reflects the different stages of economic development in the YRB; the upstream region is accelerating its catch-up through resource transformation and ecological value realization, while the midstream region is forming new growth points through industrial restructuring. Furthermore, the differences between the midstream and upstream regions are gradually narrowing, and the gap with the downstream region is also decreasing. This indicates a growing national emphasis on ensuring that the benefits of development reach the population, and the implementation of this policy has been reinforced throughout the HQED of the YRB. (3) The heatmap analysis of changes across provinces shows significant improvements in HQED levels for all provinces. Shandong Province has consistently maintained a leading position among the provinces in the YRB. Inner Mongolia and Shanxi are at similar development stages, benefiting from their rich coal resources, which have provided advantages in economic development. The average ranking of HQED levels across provinces in the YRB is as follows: Shandong Province (0.4458), Henan Province (0.4066), Inner Mongolia Autonomous Region (0.3991), Shanxi Province (0.3916), Ningxia Hui Autonomous Region (0.3883), Shaanxi Province (0.3736), and Gansu Province (0.3613). Due to the limited availability of data for Qinghai Province, which only has data from Xining, it is excluded from the ranking. This situation has resulted in higher levels of high-quality economic development in the eastern provinces compared to the central and western provinces, which can be attributed to lower resource endowments, poor industrial structures, and inadequate infrastructure in those provinces.

3.1.2. Analysis of Inter-Regional Relative Differences in High-Quality Economic Development Levels in the YRB

This paper employs the Dagum Gini coefficient to measure regional differences in HQED within the YRB from 2000 to 2022. As shown in Figure 2, (1) in terms of changes in the Gini coefficient during the observational period, the Gini coefficients for the upstream, midstream, and downstream regions show a trend of fluctuation and decline. Overall, the Gini coefficient for the YRB decreased from 0.10 in 2000 to 0.05 in 2022, representing a 50% reduction. The reductions in the Gini coefficients for the upstream, midstream, and downstream areas are 56.07%, 45.26%, and 43.33%, respectively, with the upstream region experiencing the most significant narrowing of regional disparities. This improvement is a result of the national strategy of differentiated governance aimed at the upstream, midstream, and downstream regions. With HQED as the core focus, environmental improvements have stimulated green industries and deepened green principles. Moreover, enhanced regional cooperation and the establishment of inter-provincial collaboration mechanisms, along with the free flow of resources, have collectively facilitated a more balanced and coordinated development path for the YRB. (2) Analyzing the contribution rates and differences among the upstream, midstream, and downstream regions, the intra-group contribution rates and super-variable density contribution rates initially exhibit a trend of fluctuation followed by a gradual decline, peaking in 2017 before slowly decreasing. This suggests that internal disparities among regions are gradually widening, and the intersecting situations among different regions are becoming increasingly pronounced. In contrast, the inter-group contribution rates are steadily declining. Despite this, the contradictions in HQED in the YRB primarily stem from inter-group differences, which continue to impede HQED. The greatest disparities lie between the upstream and downstream regions, while the smallest differences are observed between the upstream and midstream areas. From 2000 to 2018, inter-regional differences have shown a noticeable decline, followed by a slower decrease in subsequent years. The gap trend between the upstream and midstream areas exhibits a “wave-like” pattern, with a moderate annual decline, while the decline trend in the midstream and downstream regions takes on an “M” shape, and the upstream and downstream trends display “W” shaped fluctuations. This circumstance may result from the implementation of integration policies in the YRB, which have reduced inter-regional disparities, yet the pronounced polarization among central provinces has constrained the developmental space of the weaker provinces, further widening internal regional gaps.

3.2. Spatial Differentiation Characteristics of HQED in the YRB

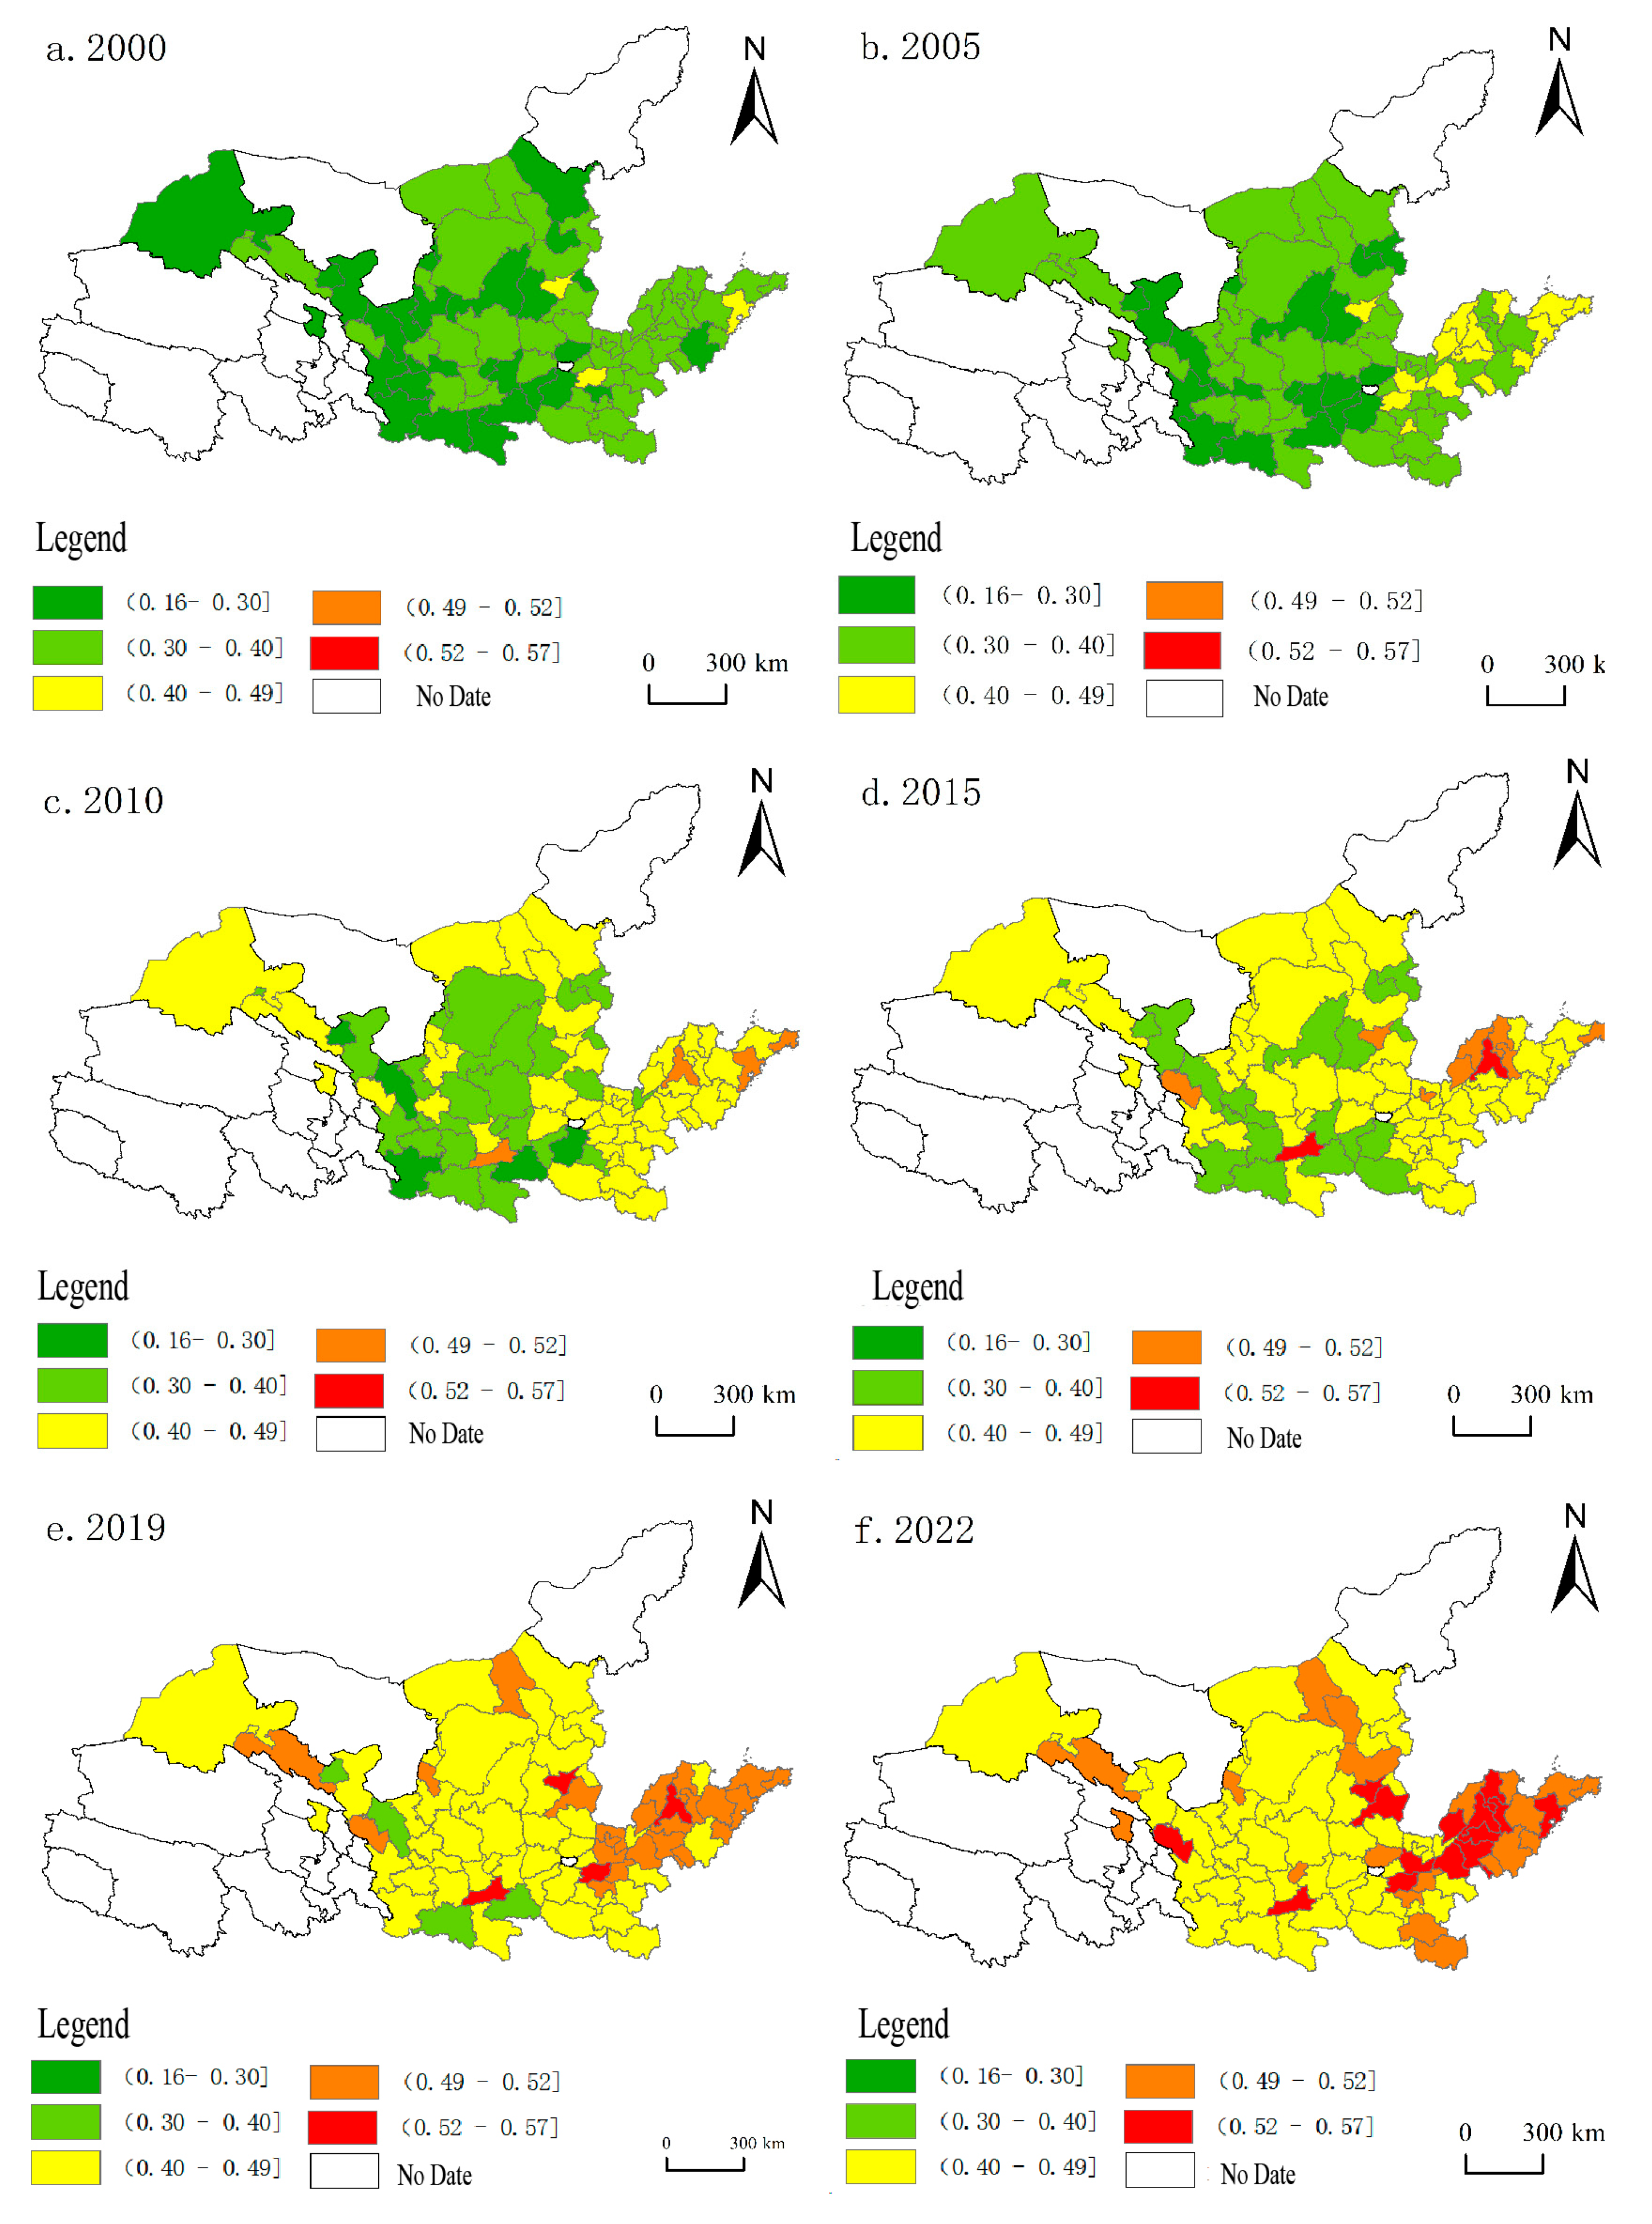
3.2.1. Spatial Differentiation Characteristics of HQED Levels in the YRB

To vividly illustrate the spatial differentiation of HQED levels in the YRB, this study uses the years 2000, 2005, 2010, 2015, 2019, and 2022 as time snapshots, employing ArcGIS 10.8.2 software for spatial visualization, as shown in Figure 3. The results indicate that, over time, the HQED levels in the YRB have gradually increased, generally revealing a development area centered around provincial capitals. There are significant disparities between the eastern and western regions, reflecting a spatial pattern characterized by “strength in the east and weakness in the west”. Additionally, the high-quality economic development in the YRB exhibits notable phenomena of “faults” and “spatial proximity”. This is due to the resource agglomeration effects of provincial capital cities, which create development zones centered around these capitals. The east–west disparity is primarily attributed to differences in natural resource conditions, industrial foundations, and infrastructure. The “fault” phenomenon results mainly from insufficient regional industrial coordination and differences in policy regions, while spatial proximity arises from the flow and agglomeration of factors and the interconnectedness of infrastructure in neighboring areas.
Specifically, in 2000, the HQED levels of Qingdao and Zhengzhou were leading. Subsequently, as the economy of the basin developed, Zhengzhou’s HQED level gradually dropped to the second tier, while Taiyuan and Qingdao maintained high development levels. By 2005, most prefecture-level cities in Shandong Province were at relatively high levels, exemplifying the “strength in the east and weakness in the west” situation. In 2010, Jinan rose to the top tier, maintaining a high-level status thereafter. However, the “fault” phenomenon was pronounced, as the comprehensive scores for Jinan, Qingdao, Weihai, and Xi’an all exceeded 0.49, while the scores for the underdeveloped western regions fell below 0.3. The year 2015 marked a stage of consolidation and enhancement in HQED for the YRB, with most prefecture-level cities entering a new development phase. The indices for most cities concentrated in the range of 0.4 to 0.49, indicating a more concentrated overall distribution and a gradual narrowing of regional development gaps. By 2019, the downstream regions continued to lead, reducing the number of lower-level cities to four. By 2022, high-level cities were primarily concentrated in the east, with regional disparities further narrowing. Overall, the level of development in the basin has significantly improved compared to 2000, benefiting from supportive national policies, technological innovation, and industrial development.

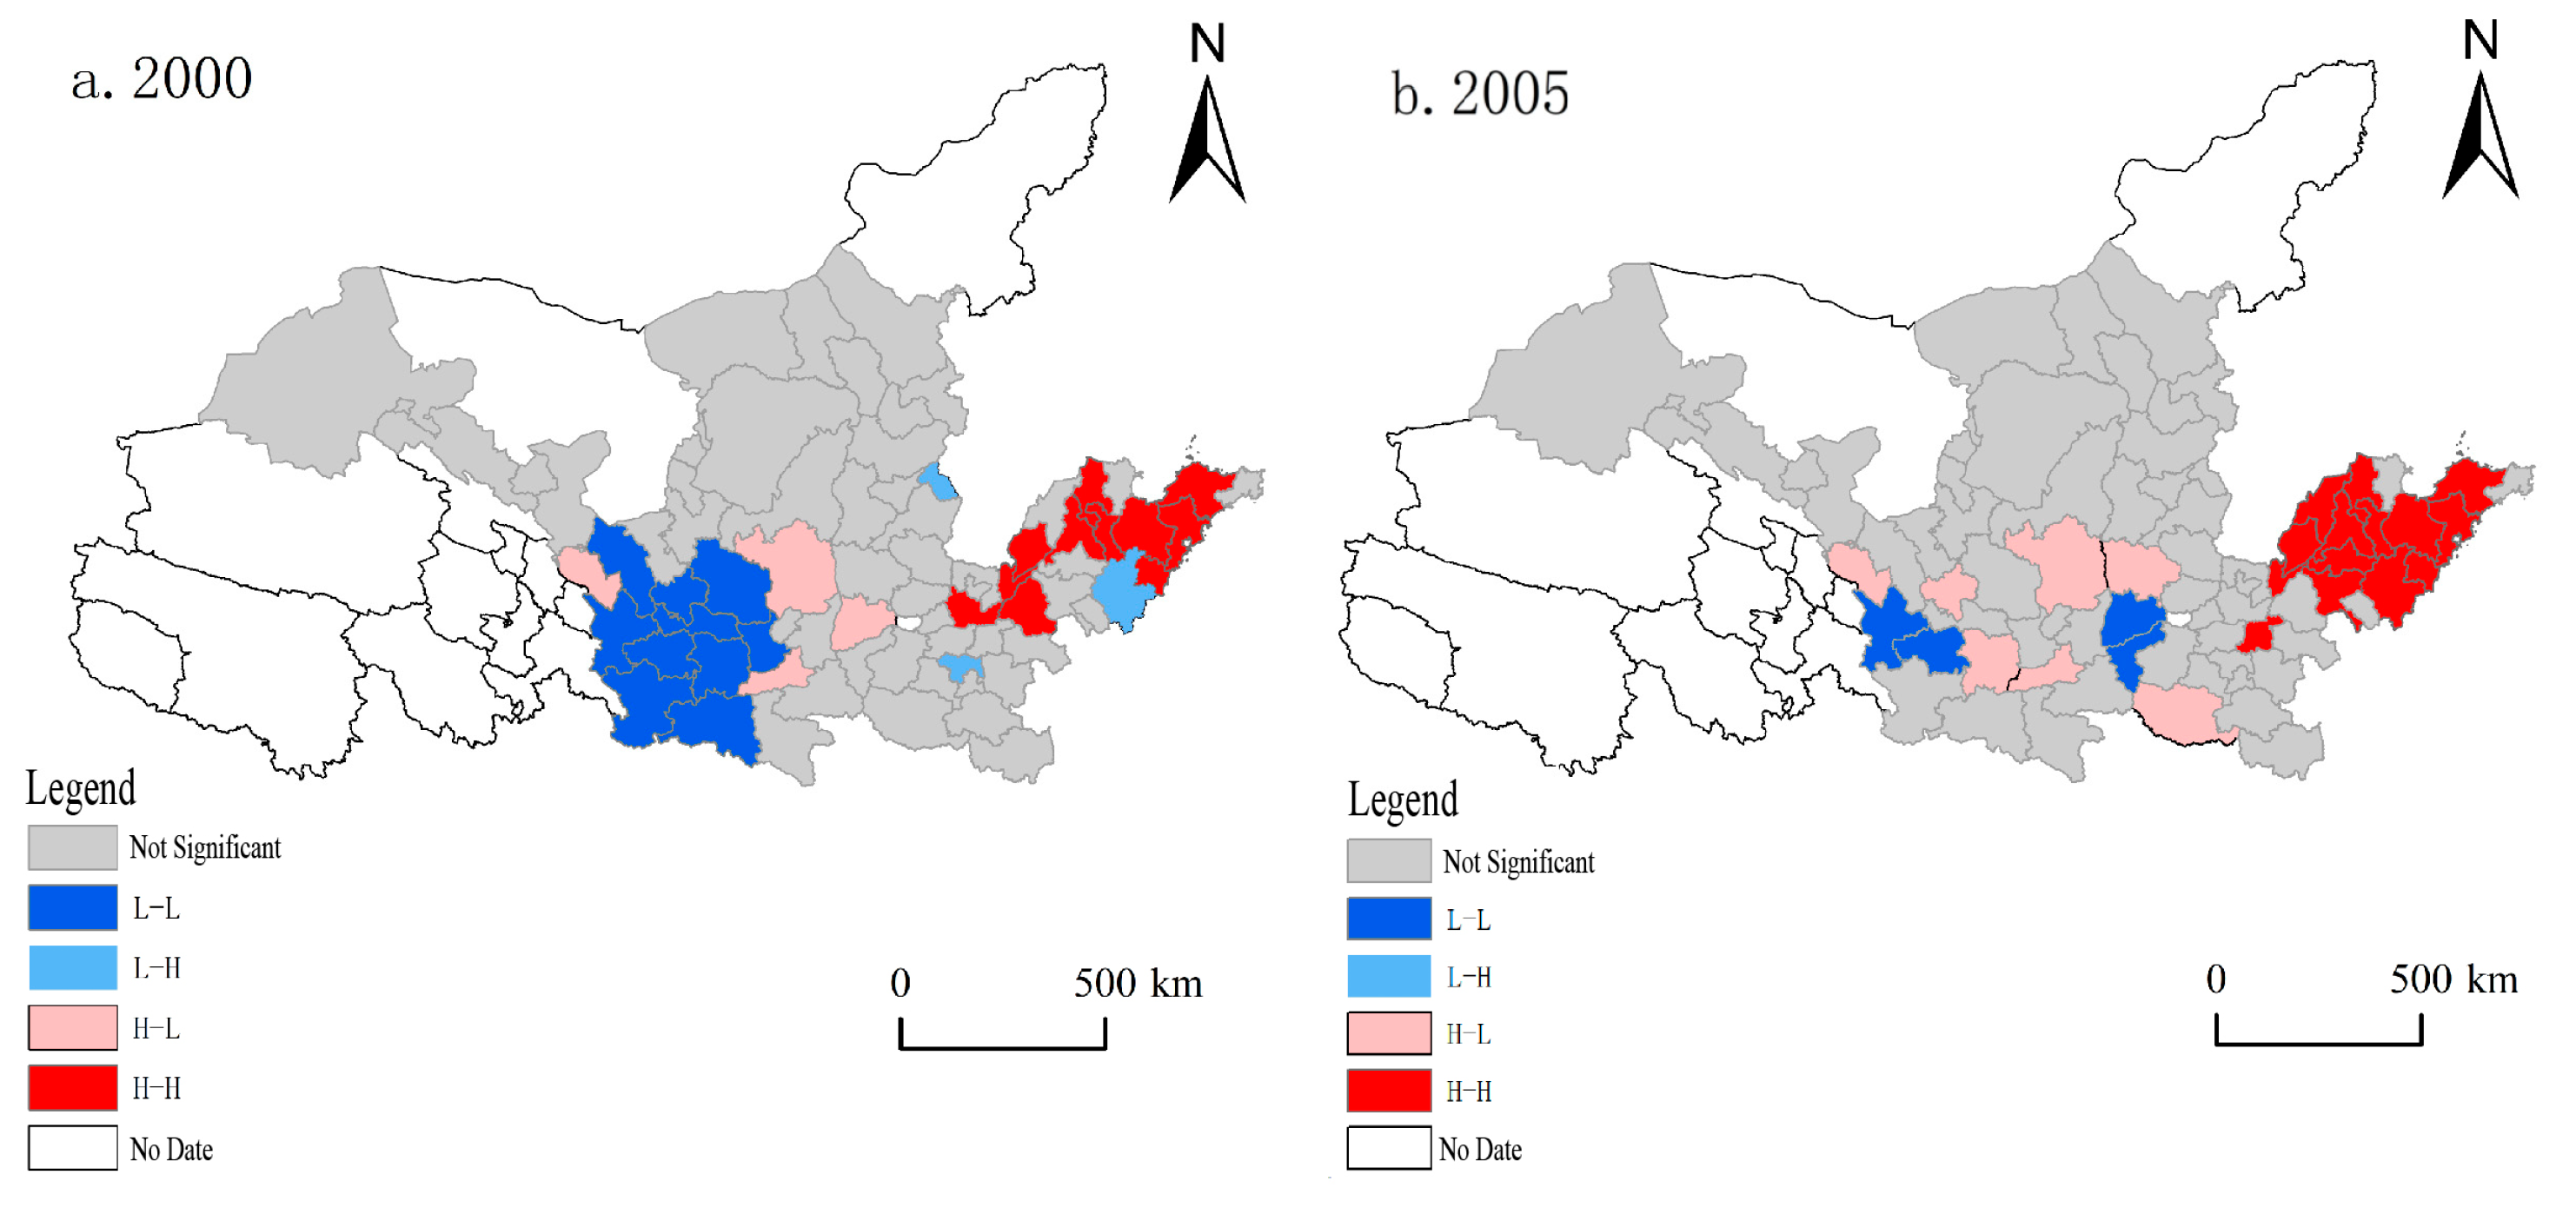
3.2.2. Spatial Correlation Characteristics of HQED Levels in the YRB

To identify the spatial differences in HQED within the YRB, this study utilized GeoDa software version 1.21 to assess the high-quality development levels from 2000 to 2022. The analysis yielded both global and local autocorrelation indices, allowing for an exploration of the internal spatial correlation characteristics and clustering patterns.
(1)
Spatial Correlation Characteristics Based on Global Autocorrelation
The global Moran’s I for the HQED levels in the YRB from 2000 to 2022 was calculated using GeoDa software, as shown in Table 2. The results indicate that during the study period, the global Moran’s I for the YRB consistently exceeded zero, demonstrating significant spatial clustering and a positive spatial relationship in the distribution of HQED levels. Furthermore, this relationship is significant at the 1% level, indicating a highly significant spatial correlation. This suggests that the indices of different regions are not randomly distributed, and there exists a notable spatial clustering effect between areas of high-quality and low-quality economic development. Additionally, it highlights the strong regional economic ties. Future policy formulation should consider spatial effects, fully leverage positive spatial correlations, and emphasize collaborative development in the YRB to achieve high-quality economic growth in the region.
(2)
Spatial Correlation Characteristics Based on Local Autocorrelation Indices
To further elucidate the spatial correlation characteristics of HQED levels in the YRB, GeoDa and ArcGIS software were employed to create spatial correlation maps of the development levels. A local autocorrelation analysis was conducted on the cross-sectional data for six years, revealing localized spatial clusters of HQED in certain areas, as shown in Figure 4. In the one H-H clustering area, from 2000 to 2022, the high–high clustering of HQED in the YRB remained relatively stable, primarily concentrated in Shandong Province. The development levels in these prefecture-level cities and their neighboring regions are comparatively high, forming a stable clustering area. This indicates that the downstream region, as the economic core of the YRB, continues to play a leading role. Notably, in 2022, the H-H clustering area included Kaifeng City in Henan Province. In the two H-L clustering areas, the number of high–low clustering areas initially increased and then decreased over time, starting as predominantly distributed in the central region in 2000. After 2010, these areas gradually shifted upstream, resulting in a band-like distribution by 2022. This shift is primarily attributed to the strengthening radiative effects of growth poles, leading production factors to diffuse into surrounding and upstream regions, facilitating economic development in the upstream areas, and reducing regional disparities, thereby decreasing the number of high–low clustering areas. In the two L-H clustering areas, the number of low–high clustering areas has been continuously decreasing. In 2000, L-H clustering was predominantly concentrated in Shandong and Shanxi provinces, followed by a reduction in fluctuations. This trend reflects the positive outcomes of high-quality development but also cautions against the potential suppression of growth poles’ radiative effectiveness due to excessive homogenization. In the future, it is essential to seek a dynamic balance between equity and efficiency to avoid a “low-level equilibrium trap”. In the four L-L clustering areas, the number of low–low clustering areas has also steadily decreased. In 2000, these areas were predominantly clustered in patches, mainly located in the Yin Chuan Plain in the upstream and the Lü Liang Mountain area in the midstream. Over time, this clustering became more dispersed, and by 2022, low–low clustering areas were mainly distributed in a band-like manner across Gansu Province and the Ning Xia Hui Autonomous Region. This indicates an overall improvement in regional economic development levels, effective regional coordinated development, optimization and upgrading of industrial structures, significant support from guiding policies, and enhanced development momentum and innovation capabilities.

3.3. Analysis of the Dynamic Evolution Trends of HQED in the YRB

To further predict the dynamic evolution direction and positional changes of HQED levels in the YRB, this study employs both traditional and spatial Markov chain transition matrices in MATLAB R2024a to conduct an analysis of the specified region. Based on the quantile method, the YRB is classified into four levels: I, II, III, and IV, representing low, relatively low, relatively high, and high levels, respectively, as shown in Table 3 and Table 4.

3.3.1. Temporal Evolution Trends of HQED Levels

The results from the traditional Markov chain model reveal the following characteristics of changes in HQED levels in the YRB. (1) A “club convergence” characteristic is observed, with the probability of cities maintaining their current status being the highest, exceeding 70%. Specifically, the probabilities for type I and type IV cities maintaining their status are greater, at 0.833 and 0.953, respectively, illustrating the clustering effect of “high-quality growth poles”. In contrast, the convergence probabilities for type II and type III cities are lower, at 0.728 and 0.756, respectively. This indicates that the development trend of high-quality economic levels in the YRB is expected to remain relatively stable for the foreseeable future. In the short term, there are no significant breakthrough signs in the high-quality development areas, while cities with lower development levels exhibit strong path dependency characteristics, suggesting that achieving leapfrog development will pose significant challenges over a certain period. (2) Some regions continue to experience fluctuations in development levels, with a higher probability of upward migration for types I, II, and III; however, a small number still show downward migration. This indicates that regional development remains unstable, necessitating vigilance in future efforts. It is essential to adapt to local conditions, adjust industrial structures, and continuously reduce disparities between regions to achieve overall HQED.

3.3.2. Spatial Evolution Trends of HQED Levels

To further investigate the impact of neighboring cities on the HQED levels of various prefecture-level cities, a global Moran’s I test was conducted on the indicators of HQED, as shown in Table 3. Subsequently, a spatial neighborhood matrix was introduced to establish the spatial Markov chain transition probability matrix, as presented in Table 4. The type of neighborhood influences HQED. Specifically, (1) the probability of maintaining stability decreases as neighborhood types increase. For instance, for type I, when the neighborhood types are II and III, the probabilities of maintaining its own type are 0.693 and 0.364, respectively. For type II, when the neighborhood types are III and IV, the probabilities of maintaining its own type are 0.701 and 0.579, respectively. (2) The probability of an upward transition may be higher, while the probability of a downward transition may be lower. For example, type II shows upward transition probabilities of 0.222, 0.290, and 0.368 when the neighborhood types are II, III, and IV, respectively. These probabilities exhibit a consistent increase, while the probabilities of a downward transition decrease. (3) The probabilities of regional development influences may vary, with positive effects from high-quality neighborhoods outweighing the negative effects from low-quality areas. When type II cities have type I neighborhoods, the probability of a downward transition is 0.068, while the probabilities of an upward transition for type III neighborhoods are 0.290 and 0.368, respectively. For type III cities, the probabilities of a downward transition are 0.091 and 0.172 when neighboring type I and II cities, respectively. However, when neighboring type IV cities, the probability of a downward transition is only 0.014. This indicates that higher-quality neighborhoods exert a positive pull on cities, while lower-quality neighboring cities have negative impacts. (4) The spatial Markov transition probability matrix obtained by incorporating the spatial adjacency matrix shows that, regardless of the neighborhood type, probabilities are generally highest along the diagonal. This suggests that achieving a leap in HQED in the YRB is challenging within a short timeframe, which is consistent with the conclusions drawn from the traditional Markov chain.

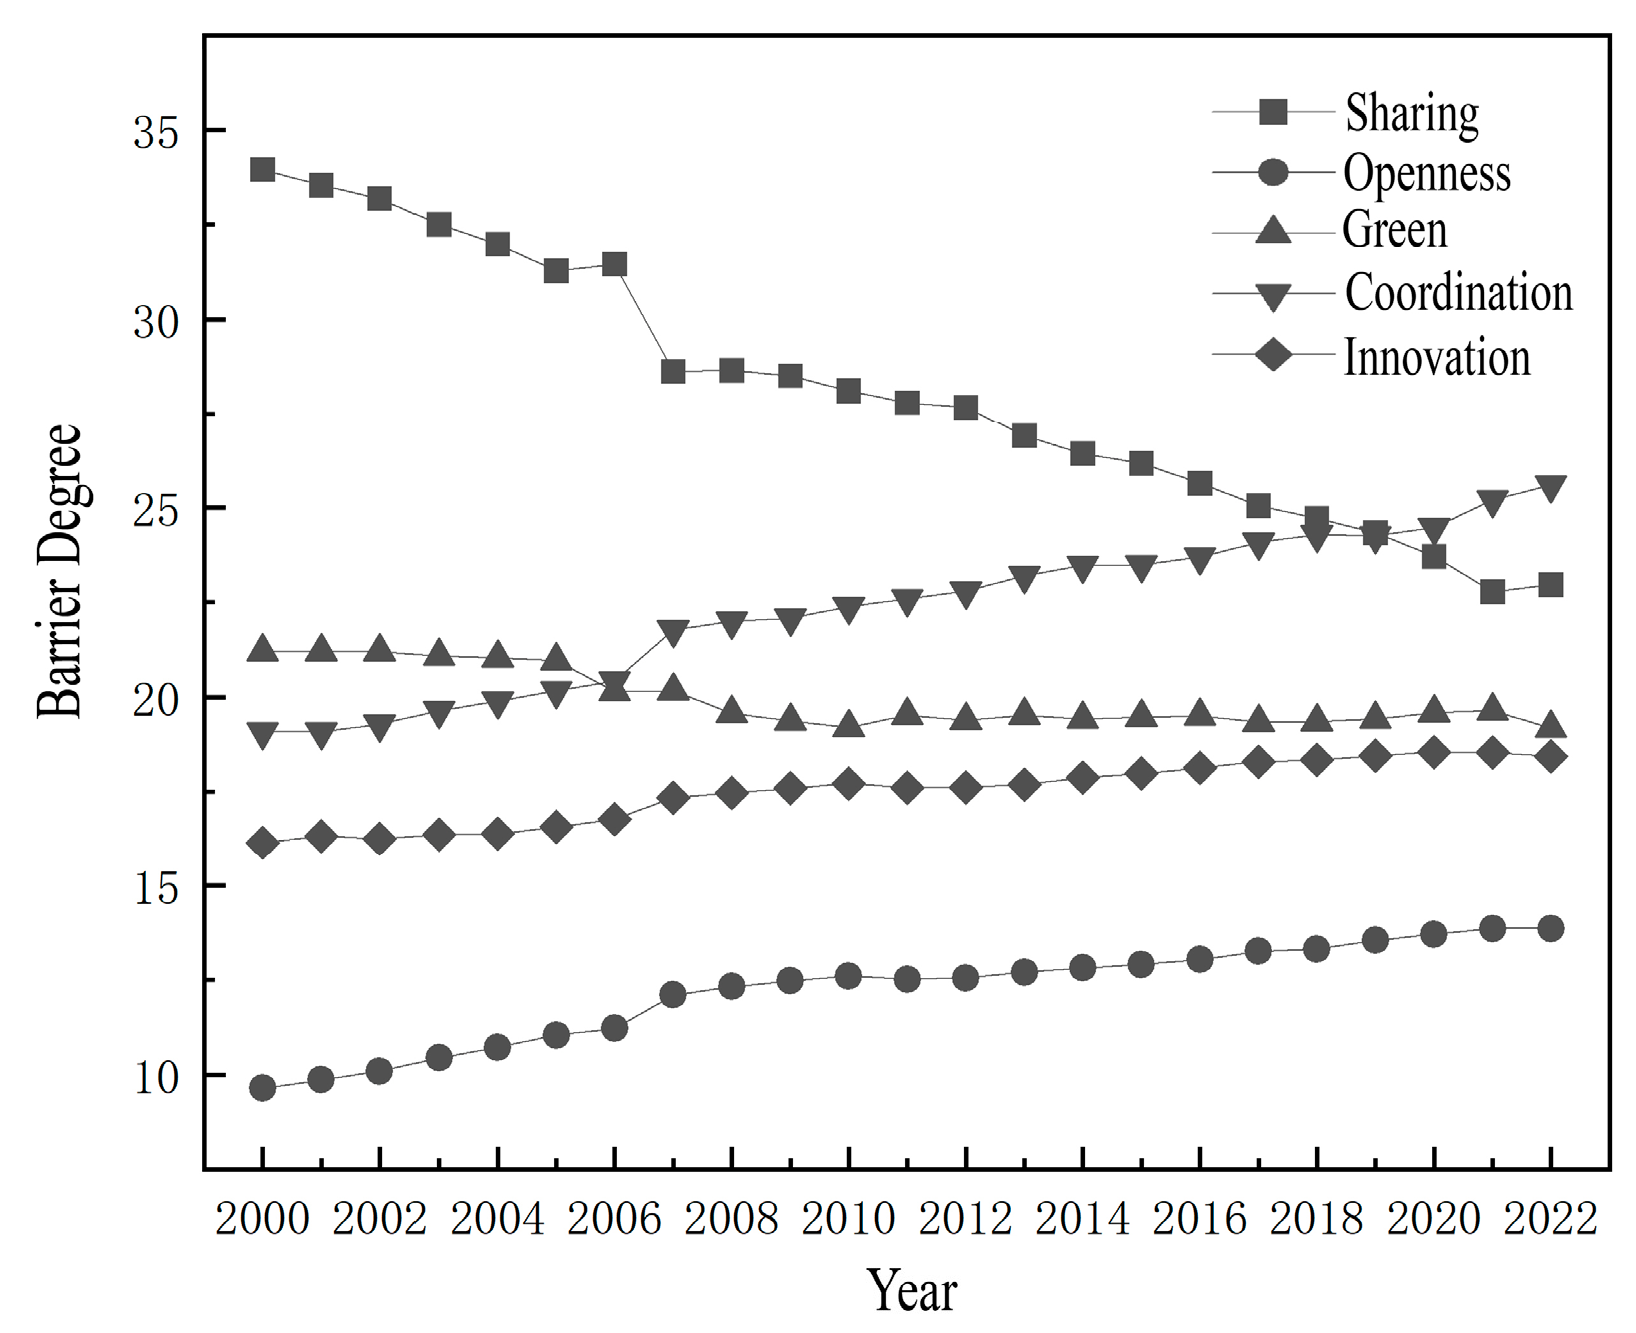
3.4. Barrier Factors to HQED Levels in the YRB

3.4.1. Criterion-Level Barrier Factors

Based on the barrier model, this study diagnoses the barrier factors affecting HQED in the YRB. SPSSAU software (https://spssau.com/index.html, accessed on 20 April 2025) performs normalization on the weights of the corresponding indicators at the criterion layer. The analysis of the results reveals that from 2000 to 2022, the average ranking of barrier factors among subsystems is as follows: sharing (0.281) > coordination (0.223) > greenness (0.193) > innovation (0.175) > openness (0.122), with the variations shown in Figure 5. Both sharing and greenness barriers show a declining trend, while those of coordination, innovation, and openness exhibit an increasing trend. Specifically, the sharing barrier decreased from 34% to 23%. Although the decline has gradually slowed in the past two years, it remains a notable shortfall within the system. The greenness barrier decreased from 21% to 11%, indicating substantial progress in ecological protection within the YRB. In contrast, the coordination, openness, and innovation barriers increased from 19% to 25%, from 10% to 14%, and from 16% to 18%, respectively. Despite the diminishing inter-regional disparities in HQED mentioned earlier, significant issues persist regarding the urban–rural divide and disparities in industrial structure within the region. If the barriers continue to rise unchecked, the region may fall into a “low-level equilibrium trap”, where regional convergence occurs superficially but resource allocation efficiency declines, leading to an imbalanced industrial structure and inequitable public services, which hampers talent mobility and labor employment, ultimately affecting the sustainable development of the regional economy and hindering overall HQED.

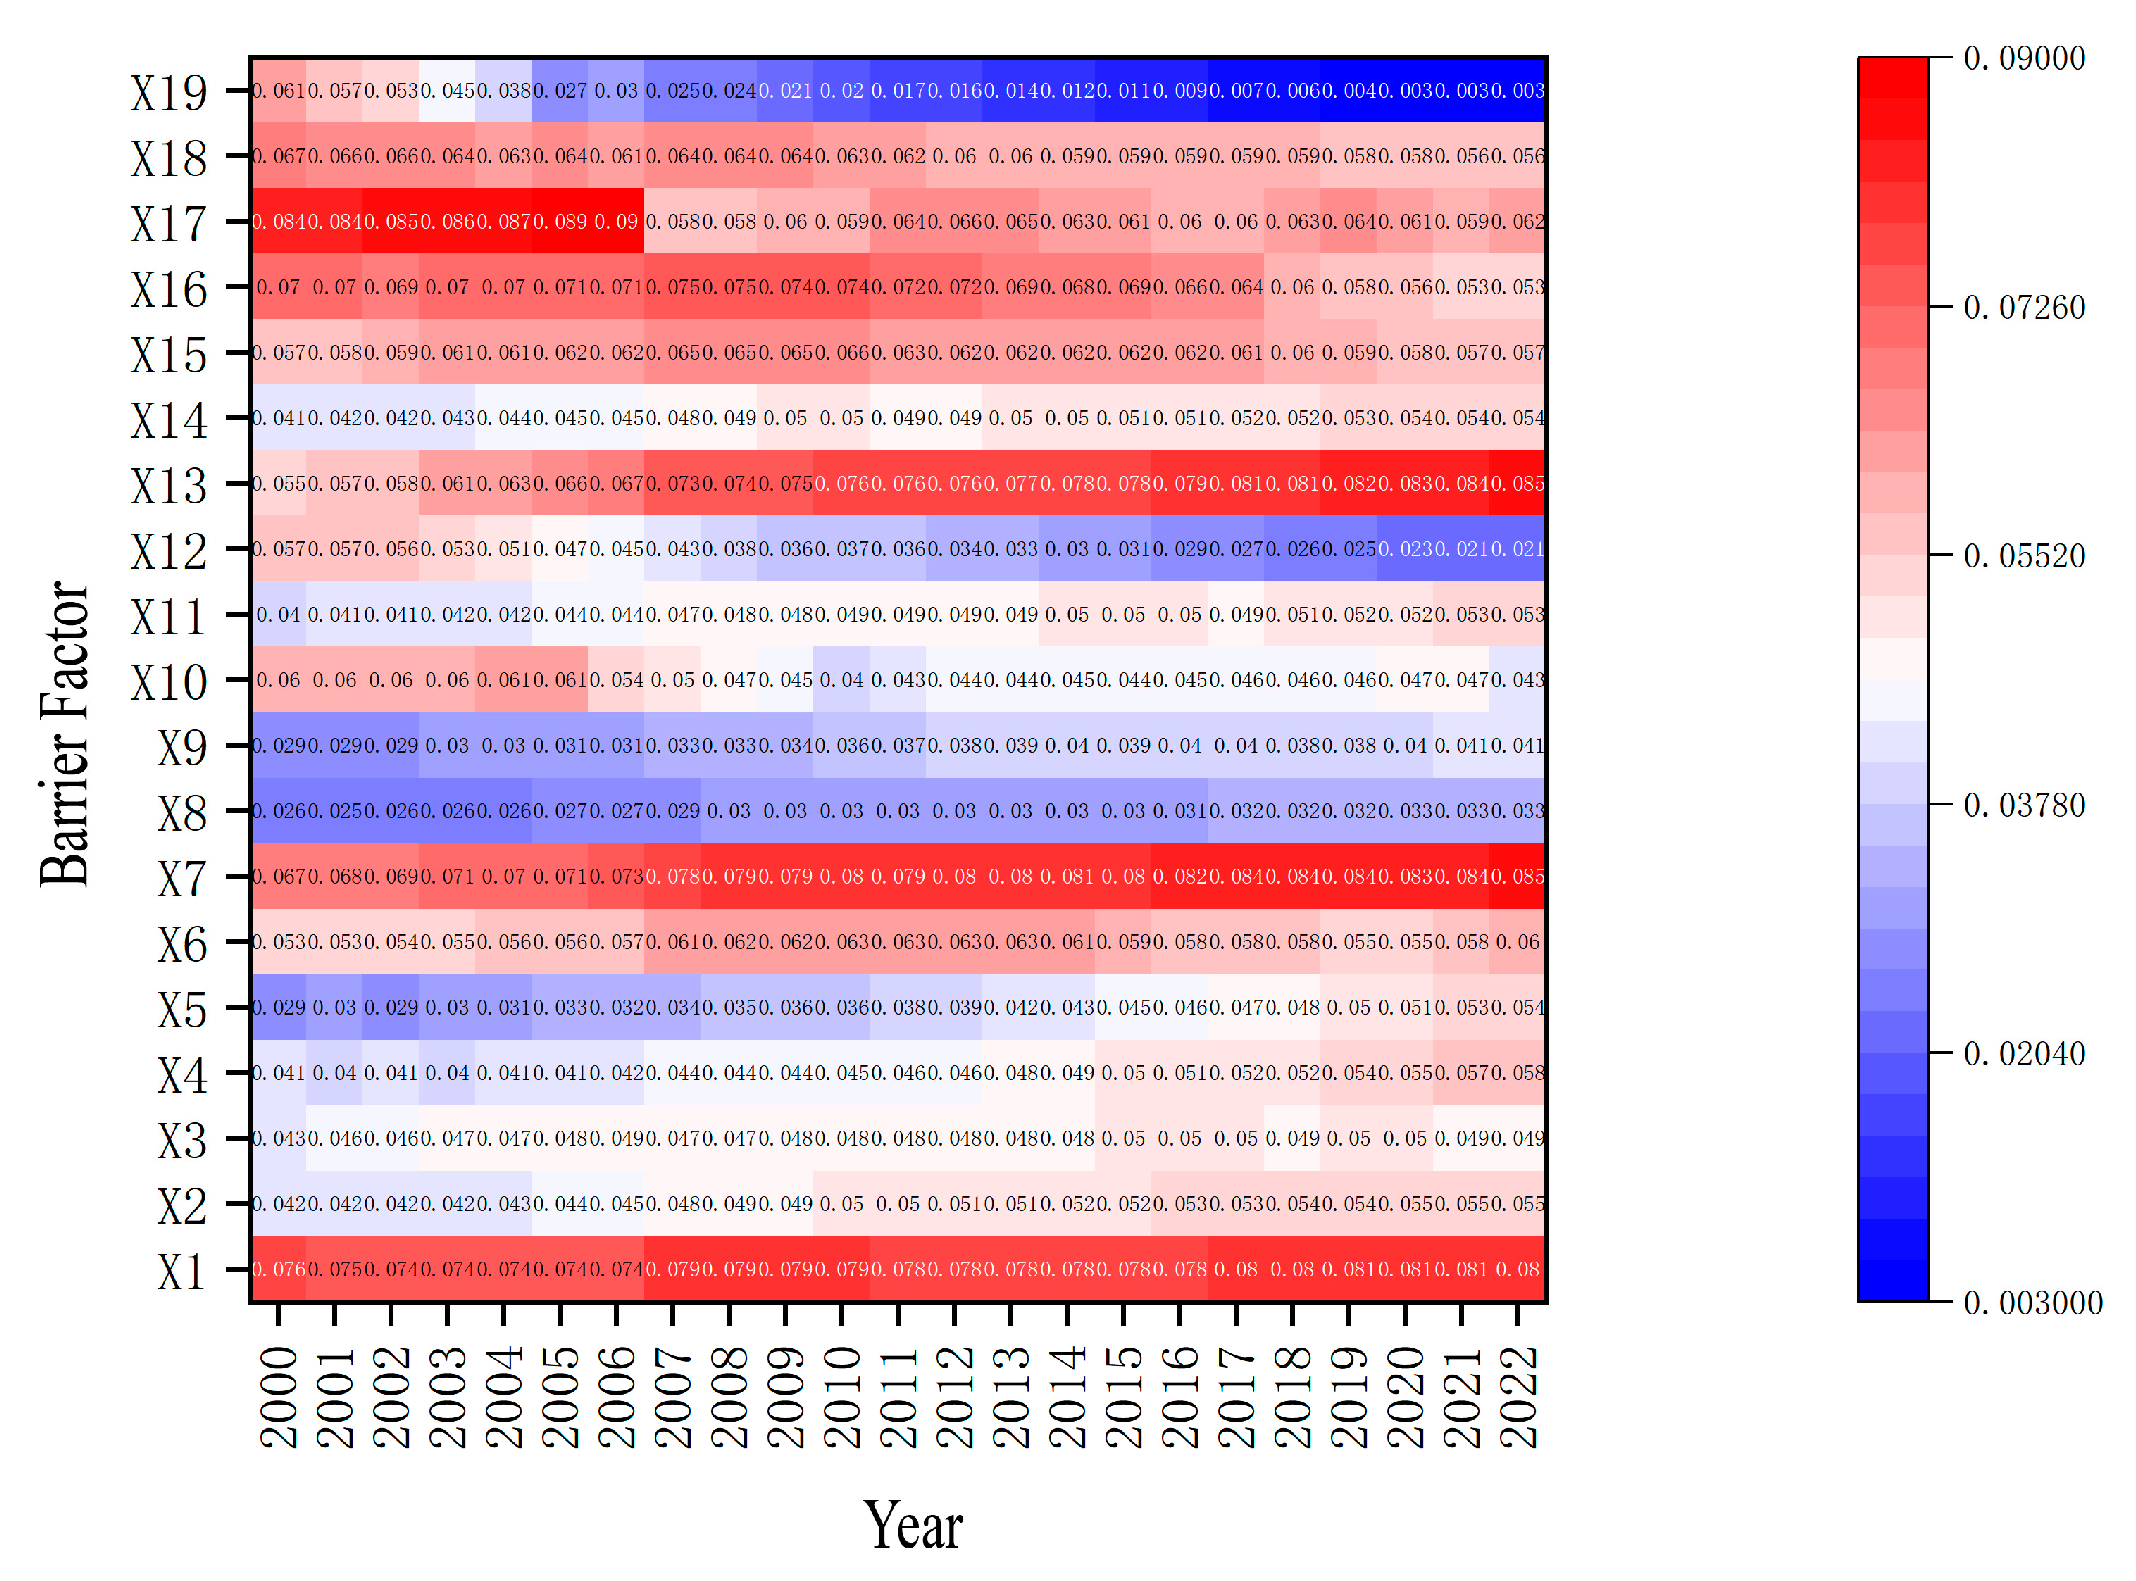
3.4.2. Indicator-Level Barrier Factors

Due to the large number of secondary indicators and samples, the average impact value is used to represent them, as shown in Figure 6. From 2000 to 2006, the primary barrier factors affecting HQED in the YRB were the proportion of social security and employment in fiscal expenditures, human capital levels, and per capita road area. From 2007 to 2008, the main barriers included human capital levels, rationalization of industrial structure, and the number of broadband internet users per ten thousand people. From 2009 to 2022, the main barrier factors shifted to the proportion of total goods imports and exports in GDP, human capital levels, and rationalization of industrial structure. The youth student population is a significant part of the labor market; it plays a crucial role in the conversion and application of scientific and technological achievements, serving as a reservoir of high-level talent with specialized skills. The level of human capital can objectively reflect the supply level of knowledge-based talent in the region. It is observed that the barrier degree related to human capital level has consistently remained high, necessitating increased investment in education, optimization of systems, talent attraction, improvement of incentives, health assurance, and creating a favorable environment for breakthrough. After 2008, the per capita road area and the number of broadband internet users per ten thousand people ceased to be significant barrier factors, primarily due to continuous improvement of infrastructure, technological advancement, and diversification of travel modes. Since the rationalization of industrial structure became a major barrier factor in 2007, it has exhibited an upward trend, indicating that the coordination and connectivity between industries face obstacles. The trend of trade dependency reflects similar challenges. Therefore, future efforts should focus on eliminating industrial barriers to innovation, openness, and industrial coordination to achieve coordinated development and facilitate HQED in the YRB.

4. Discussion

4.1. Comparison with Existing Research

This study reveals that HQED in the YRB exhibits significant temporal and spatial differentiation. The development levels in the upper reaches are relatively lagging, while the middle and lower reaches present more favorable developmental trends, resulting in high-value agglomeration areas centered around specific urban clusters in Shandong and low-value agglomeration areas in the western part of the basin. These findings are consistent with existing research that concludes the spatial imbalance of economic development in the YRB [43]. Regarding the identification of obstruction factors, this study finds that shared infrastructure construction, fragile ecological environments, and unreasonable industrial structures significantly restrict HQED in the basin. This aligns with the perspectives of previous scholars who noted that slow industrial transformation and significant ecological protection pressures impact economic development in the region [44].
Furthermore, this study employs spatial econometric models to conduct a detailed analysis of the spatial correlation of HQED, revealing significant spatial spillover effects between regions; specifically, the level of HQED in one area positively or negatively influences surrounding areas. This conclusion addresses the shortcomings of most previous studies, which primarily analyzed economic development from a static perspective and lacked exploration of spatial correlation mechanisms, thereby enhancing the understanding of the spatial evolution of HQED in the YRB.

4.2. Universality of Obstacles to HQED

Obstacles to HQED are prevalent throughout the YRB. An unreasonable industrial structure leads to inefficient resource utilization, with a considerable proportion of traditional high-energy-consuming and high-pollution industries. These industries not only consume substantial resources but also severely damage the ecological environment of the basin, hindering sustainable economic development. The fragile ecological environment exposes the basin to issues, such as soil erosion and water resource shortages, which restrict the developmental space for agriculture, industry, and other sectors while also increasing the costs of ecological restoration, thus affecting the quality and efficiency of economic development. However, these obstacles are not insurmountable. By optimizing the industrial structure and promoting a transition toward greener and higher-end industries, resource utilization efficiency can be improved, and negative environmental impacts can be mitigated. Strengthening ecological protection and restoration can enhance the ecological environment of the basin, creating favorable conditions for economic development. Reinforcing regional collaboration to achieve resource sharing and complementary advantages will help enhance the overall competitiveness of the basin. This indicates that, despite facing numerous challenges, HQED in the YRB can achieve coordinated economic and ecological development through sound policy guidance and effective development strategies.

4.3. Limitations of This Study and Future Prospects

This study systematically analyzes the spatio-temporal evolution and obstruction factors of HQED in the YRB; however, certain limitations remain. In terms of research scope, it primarily focuses on the basin as a whole, lacking in-depth exploration of the heterogeneous characteristics of different sub-regions, which may limit the applicability of the findings in specific areas. Regarding the selection of indicators, while a comprehensive evaluation index system for HQED has been constructed, data availability has restricted the inclusion of indicators that reflect emerging economic forms and social livelihood areas. This may prevent a complete and accurate measurement of the level of HQED. Regarding sample size, data for 2023 and 2024 cannot currently be updated due to limitations in data acquisition channels and statistical reporting periods for certain indicators.
Future research could explore the following aspects. First, refine the study of sub-regions within the basin to analyze the unique patterns and key obstacles to HQED in different areas, providing more precise bases for formulating differentiated policies. Second, strengthen the integration of multi-source data and utilize new technologies, such as big data and satellite remote sensing, to enhance evaluation indicators, improving the scientific rigor and accuracy of the research. Third, investigate the interaction mechanisms between obstruction factors and examine the dynamic effects of external policies and technological innovations on HQED, thereby offering more forward-looking and actionable recommendations for the development of high-quality economics in the YRB. Fourth, we will continue to monitor data dynamics. Following the release of the latest statistical information, we will promptly supplement and refine the relevant analysis.

5. Conclusions and Recommendations

5.1. Conclusions

This paper develops a high-quality economic indicator system for the YRB based on the five development concepts, employing the CRITIC method to assess the high-quality economic development levels of 78 prefecture-level cities within the basin. Additionally, it utilizes the Dagum Gini coefficient, spatial Markov chain, and obstacle model to elucidate the spatio-temporal evolution trends of high-quality economic development levels in the YRB and identify the primary obstacle factors. The conclusions are as follows. (1) In terms of temporal evolution, the high-quality economic development in the YRB aligns with national trends; although fluctuations in the high-quality economic development index were observed from 2000 to 2022, and a general upward trend remains evident. At the regional level, fluctuations among subsystems have increased, with the downstream region taking a leading position while the upstream region exhibits the fastest growth. From a provincial perspective, the development levels in the central and western regions lag behind, and regional disparities are gradually diminishing; however, the main challenge in the YRB continues to stem from inter-group differences. (2) From a spatial perspective, the overall pattern shows development areas centered around provincial capitals, with significant disparities between the eastern and western regions. High-quality economic development also exhibits noticeable “fault” phenomena and characteristics of “spatial proximity”. (3) Regarding the evolution trend, the overall situation of high-quality economic development from 2000 to 2022 has been relatively stable, with a high probability of regions maintaining their respective states. The higher the neighborhood type, the lower the likelihood of maintaining stability, while the probability of upward transitions may increase. The positive impact generated by high-quality neighborhoods surpasses the negative effects associated with low-quality areas. (4) Concerning obstacle factors, the hierarchy is as follows: sharing > coordination > green > innovation > openness. These obstacles hinder the HQED of the YRB.

5.2. Recommendations

Building on the research conducted above, we propose the following recommendations to effectively foster HQED, with the aim of contributing to the sustainable advancement of China’s economy.
(1)
Promote systematic coordination and reduce regional disparities. Grounded in the “growth pole theory” and “gradient transition theory” from regional economics, sustainable development policies for river basins can establish mechanisms for regional collaboration to dismantle institutional barriers hindering the flow of resources. Enhancing the regional planning legislative framework and inter-regional management system can lower transaction costs and facilitate the rational allocation of resources, such as labor and capital. The interaction of “institution—factor—industry” not only helps to narrow regional development gaps but also unleashes the spatial dividends of economic growth, thereby maximizing overall effectiveness. This approach fosters stable and moderately rapid growth of the Chinese economy and encourages the formation of a unified national market, offering theoretical support and practical pathways for achieving coordinated development.
(2)
Strengthen ecological compensation and green development mechanisms. Given the dual challenges of ecological protection and economic development in the YRB, it is crucial to establish and enhance the ecological compensation mechanism, promote the realization of ecological product value, and encourage regional green development. By employing instruments, such as ecological compensation and green finance, enterprises and local governments can be incentivized to actively engage in ecological protection, facilitating a virtuous interaction between economic development and ecological conservation. This concept not only emphasizes the scale of economic growth but also prioritizes growth quality and long-term benefits, providing a model for high-quality national economic development while promoting ecological civilization and sustainable development in China.
(3)
Deepen reforms and innovations in key areas. According to the “theory of institutional change” in new institutional economics, reforms to the socialist market economy can release market vitality through institutional innovation. Reforms in the science and technology sector can promote collaboration between academia and industry, enhance research and development investment intensity, improve patent conversion rates, and increase the contribution of new forms of productivity to economic growth. Reform initiatives in the YRB, particularly in areas such as the digital economy and green low-carbon initiatives, will yield practical experiences for market-oriented resource allocation and innovation-driven development nationwide, promoting the construction of a modern economic system.
(4)
Expand open cooperation and coordinated linkage. Development in the YRB is hindered by administrative barriers, resulting in sluggish resource movement. Drawing on regional integration theory, it is imperative to dismantle these administrative obstacles. Utilizing the “Belt and Road” initiative and positioning the YRB as a central axis, countries and regions along the route can collaborate to create a “Belt and Road” green economic corridor. By optimizing the business environment and facilitating the free flow of talent, capital, and technology, regional competitiveness can be enhanced. This policy recommendation carries significant implications for other inter-regional economic cooperation across the nation and contributes to the efficient allocation of resources and the advancement of HQED on a national scale.

Author Contributions

X.W.: conceptualization, methodology, data curation, writing—original draft preparation, and writing—review and editing; C.W.: conceptualization and writing—review and editing; Z.J.: writing—review and editing; G.Q.: writing—review and editing. All authors have read and agreed to the published version of the manuscript.

Funding

This study was supported by the Ministry of Education of the People’s Republic of China under the Key Research Base of Humanities and Social Sciences, “Research on the Spatial and Temporal Evolution and Development Mode of Ecological Civilization Construction in the Yellow River Basin” (Grant No. 22JJD790015); the Natural Science Foundation of Shandong Province, “Research on Spatial and Temporal Evolution and Optimization Countermeasures for the Spatial Structure of the Research on Spatial and Temporal Evolution and Optimization Countermeasures of the Spatial Structure of Shandong Peninsula City Cluster in the Context of Urban Shrinkage” (Grant No. ZR2024MD034); the Shandong Province Taishan Scholars’ Specialist Supporting Program Project (Grant No. 20240821).

Data Availability Statement

The data involved in this study are all from public data.

Acknowledgments

The authors would like to thank the editors and the three anonymous reviewers. Their constructive comments and suggestions have been very helpful for us to improve this article.

Conflicts of Interest

The authors declare no conflicts of interest.

Abbreviations

The following abbreviations are used in this manuscript:
YRBYellow River Basin
HQEDHigh-Quality Economic Development

References

  1. Song, J.J. Comparison and Prospect of Economic and Population Development in Seven Major River Basins. Nat. Resour. Econ. China 2023, 36, 14–20. [Google Scholar] [CrossRef]
  2. Yi, M. Research on the High-quality Development of China’s Basin Economy in the New Era—Analysis Based on Marxist Thought on Basin Economy. Contemp. Econ. Res. 2021, 2, 45–54. [Google Scholar]
  3. Ren, B.P.; Li, Y.M. On the Construction of Chinese High-quality Development Evaluation System and the Path of Its Transformation in the New Era. J. Shaanxi Norm. Univ. Philos. Soc. Sci. Ed. 2018, 47, 105–113. [Google Scholar] [CrossRef]
  4. Bei, J. Study on the “High-Quality Development” Economics. China Ind. Econ. 2018, 1, 163–180. [Google Scholar] [CrossRef]
  5. Liu, Z.B. Understanding the High-quality Development: Basic Features, Supporting Elements and Current Key-issues. Acad. Mon. 2018, 50, 39–45+59. [Google Scholar] [CrossRef]
  6. Zhao, J.B.; Shi, D. A Framework of China’s High-quality Economic Development. Res. Econ. Manag. 2019, 40, 15–31. [Google Scholar] [CrossRef]
  7. Geng, Y.; Sarkis, J.; Ulgiati, S.; Zhang, P. Measuring China’s Circular Economy. Science 2013, 339, 1526–1527. [Google Scholar] [CrossRef]
  8. Zhang, W.; Zhang, L.; Li, Y.; Tian, Y.; Li, X.; Zhang, X.; Mol, A.P.; Sonnenfeld, D.A.; Liu, J.; Ping, Z.; et al. Neglected environmental health impacts of China’s supply-side structural reform. Environ. Int. 2018, 115, 97–103. [Google Scholar] [CrossRef]
  9. Bain, P.G.; Kroonenberg, P.M.; Johansson, L.O.; Milfont, T.L.; Crimston, C.R.; Kurz, T.; Bushina, E.; Calligaro, C.; Demarque, C.; Guan, Y.; et al. Public views of the sustainable development goals across countries. Nat Sustain. 2019, 2, 819–825. [Google Scholar] [CrossRef]
  10. Mohanty, A.K.; Vivekanandhan, S.; Pin, J.M.; Misra, M. Composites from renewableand sustainable resources Challenges and innovations. Science 2018, 362, 536–542. [Google Scholar] [CrossRef]
  11. Li, Y.; Wu, M.S. Analysis of the Temporal and Spatial Coupling and Influencing Factors of Green Technological Innovation, Carbon Emission Reduction, and High-Quality Economic Development. Stat. Decis. 2023, 39, 77–81. [Google Scholar] [CrossRef]
  12. Gao, C.; Xie, Q.W.; Zheng, X.L. Financial Structure, Resource Allocation, and High-Quality Economic Development—A Study Based on Industry. J. Mod. Fin. 2025, 30, 44–55. [Google Scholar] [CrossRef]
  13. Ding, X.; Wu, Q.; Liu, X.; Tan, L.; Wang, J. Coupling and coordination degree of land use, high-quality economic development, and carbon emissions and influencing factors in China: An empirical study of 282 prefecture-level cities. Resour. Sci. 2022, 44, 2233–2246. [Google Scholar] [CrossRef]
  14. Wang, X. Digital New Quality Productivity, Digital New Quality Productivity, Domestic and International Circulation and High-quality Economic Development. Stat. Decis. 2024, 40, 17–22. [Google Scholar] [CrossRef]
  15. Guo, J.; Zhong, J.Y. Analysis of the Impact of Social Capital on High Quality Economic Development: Based on the perspective of environmental efficiency. Econ. Probl. 2023, 12, 73–80. [Google Scholar] [CrossRef]
  16. Zheng, P.Y.; Ren, D.W.; Niu, J.; Yang, G.H. Digital Infrastructure Construction, Allocation of Innovation Factors, and High-quality Economic Development. Stat. Decis. 2024, 40, 86–90. [Google Scholar] [CrossRef]
  17. Cheng, J.H.; Peng, X.J.; Li, J.Y.; Zhang, X.H.; Zhan, C. Transmission mechanism of the impact of environmental regulations on the high-quality economic development of the Yangtze River Economic Belt. Chin. J. Popul. Resour. Environ. 2024, 34, 126–136. [Google Scholar]
  18. Ma, R.; Zhang, J.; Wang, H.W. Do S&T Talents Contribute to High-quality Economic Development of China?—Empirical Test Based on Effect of S&T Talents on TFP. Res. Econ. Manag. 2019, 40, 3–12. [Google Scholar] [CrossRef]
  19. Li, P.; Fu, Y.F.; Zhang, Y.F. Can the Productive Service Industry Become New Momentum for China’s Economic Growth. China Ind. Econ. 2017, 12, 5–21. [Google Scholar] [CrossRef]
  20. Chen, M.H.; Zhang, X.M.; Liu, Y.X.; Zhong, C.Y. Dynamic Evolution and Trend Prediction of Green TFP Growth: An Empirical Study Based on Five Major City Clusters in China. Nankai Econ. Stud. 2020, 20–44. [Google Scholar] [CrossRef]
  21. Ma, R.; Luo, H.; Wang, H.W.; Wang, T.C. Study of Evaluating High-quality Economic Development in Chinese Regions. China Soft Sci. 2019, 7, 60–67. [Google Scholar]
  22. Chao, X.J.; Hui, K. Measurement of China’s Economic Growth Quality. J. Quant. Tech. Econ. 2009, 26, 75–86. [Google Scholar]
  23. Shi, B.; Ren, B.P. A Measurement of China’s Provincial Economic High Quality Development. Econ. Probl. 2018, 4, 1–6. [Google Scholar] [CrossRef]
  24. Liu, B.L.; Qin, W.J. Spatial Distribution and Dynamic Evolution of China’s High-quality Economic Development Level. China Soft Sci. 2022, 1, 62–75. [Google Scholar]
  25. Frolov, S.M.; Kremen, O.I.; Ohol, D.O. Scientific methodical approaches to evaluating the quality of economic growth. Act. Prob. Econ. 2015, 173, 393–398. [Google Scholar]
  26. Liang, Q.; Teng, J.Z. Financial development and economic growth: Evidence from China. China Econ. Rev. 2006, 17, 395–411. [Google Scholar] [CrossRef]
  27. Yang, Y.F.; Wang, Q. Research on construction of evaluation index system for high-quality development of regional economy in China in the New Era. China Soft Sci. 2024, S1, 182–190. [Google Scholar]
  28. Bu, W.; Liu, S.S.; Li, C.X. Measurement and Comparison of High-Quality Economic Development in Three Major City Clusters. Stat. Decis. 2024, 40, 103–107. [Google Scholar] [CrossRef]
  29. Hu, J.B.; Zhou, Z.K. Coordination of Carbon Intensity and High-Quality Economic Development for the Beijing-Tianjin-Hebei Urban Agglomeration under China′s Dual Carbon Goals. Geogr. Geo-Inf. Sci. 2024, 40, 116–123. [Google Scholar]
  30. Wang, S.W.; Chen, X.K. Measurement, Spatial Distribution and Dynamic Evolution of the High-quality Development Level of China’s Regional Economy. Stat. Decis. 2023, 39, 90–96. [Google Scholar] [CrossRef]
  31. Du, J.; Miao, C.H.; Xu, J.W.; Lyu, K.; Li, C. Spatial-temporal Pattern and Influencing Factors of High-quality Development in the Central Plains Urban Agglomeration. Econ. Geogr. 2025, 45, 67–76. [Google Scholar] [CrossRef]
  32. Sun, J.W.; Jiang, Z.; Hu, J.Y. Spatio-temporal evolution and driving factors of high-quality marine economic development in China. Acta Geogr. Sin. 2024, 79, 3110–3128. [Google Scholar]
  33. Li, M.X.; Ren, B.P. Comprehensive Evaluation and Path Selection of High-Quality Development in the New Era. Fin. Econ. 2019, 5, 26–40. [Google Scholar]
  34. Zhang, J.K.; Hou, Y.Z.; Liu, P.L.; He, J.W.; Zhuo, X. The Goals and Strategy Path of High-quality Development. J. Manag. World. 2019, 35, 1–7. [Google Scholar] [CrossRef]
  35. Sun, H.; Gui, H.; Yang, D. Measurement and evaluation of the high-quality of China provincial economic development. Zhejiang Soc. Sci. 2020, 8, 4–14. [Google Scholar]
  36. Chen, L.; Huo, C. The Measurement and Influencing Factors of High-Quality Economic Development in China. Sustainability 2022, 14, 9293. [Google Scholar] [CrossRef]
  37. Zhao, J.; Tian, L.; Ding, L.; Sun, H.; Li, P. Research on Energy-Environment-Economy-Ecology Coupling Development in the Yellow River Basin. E3S Web Conf. 2021, 267, 01003. [Google Scholar] [CrossRef]
  38. Dagum, C. A new approach to the decomposition of the Gini income inequality ratio. Empir. Econ. 1997, 22, 515–531. [Google Scholar] [CrossRef]
  39. Ma, X.D.; Hu, Y.; Huang, B. Spatial-temporal Characteristics and Influencing Factors of Rural Green Development in Jiangsu Province. Econ. Geogr. 2022, 42, 159–167. [Google Scholar] [CrossRef]
  40. Feng, X.H.; Qiu, S.Y. Measurement and Convergence of High-quality Economic Development in the Yangtze River Delta Cities. East China Econ. Manag. 2022, 36, 28–43. [Google Scholar] [CrossRef]
  41. Hu, S.; Jiao, S.; Zhang, X. Spatio-temporal evolution and influencing factors of China’s tourism development: Based on the non-static spatial Markov chain model. J. Nat. Resour. 2021, 36, 854–865. [Google Scholar] [CrossRef]
  42. Yang, X.; Feng, Z.; Chen, Y. Evaluation and obstacle analysis of high-quality development in Yellow River Basin and Yangtze River Economic Belt, China. Humanit. Soc. Sci. Commun. 2023, 10, 757. [Google Scholar] [CrossRef]
  43. Chen, Y.; Miao, Q.; Zhou, Q. Spatiotemporal Differentiation and Driving Force Analysis of the High-Quality Development of Urban Agglomerations along the Yellow River Basin. Int. J. Environ. Res. Public Health 2022, 19, 2484. [Google Scholar] [CrossRef] [PubMed]
  44. Feng, Z.; Chen, Y.; Yang, X. Measurement of Spatio-Temporal Differences and Analysis of the Obstacles to High-Quality Development in the Yellow River Basin, China. Sustainability 2022, 14, 14179. [Google Scholar] [CrossRef]
Figure 1. Distribution of HQED levels in the YRB from 2000 to 2022.
Sustainability 17 04811 g001
Figure 2. Gini coefficient of HQED levels in the YRB from 2000 to 2022.
Sustainability 17 04811 g002
Figure 3. Spatial differentiation patterns of HQED levels in the YRB from 2000 to 2022.
Sustainability 17 04811 g003
Figure 4. LISA clustering map of HQED levels in the YRB from 2000 to 2022.
Sustainability 17 04811 g004aSustainability 17 04811 g004b
Figure 5. Changes in barrier degrees of various subsystems of HQED levels in the YRB from 2000 to 2022.
Sustainability 17 04811 g005
Figure 6. Changes in barrier degrees of various barrier factors affecting HQED levels in the YRB from 2000 to 2022.
Sustainability 17 04811 g006
Table 1. Evaluation index system of the high-quality development level of the YRB economy.
Standardized LayerIndicator LevelIndicator PropertiesWeights
InnovationX1: Human capital level (persons)+0.0568
X2: Financial expenditure on science and technology/local general public budget expenditure (%)+0.0349
X3: Number of invention patents authorized for 10,000 people (pieces)+0.0332
CoordinationX4: Urban–rural income gap (%)0.0479
X5: Urban–rural consumption gap (%)0.0619
X6: Index of industrial advancement+0.0397
X7: Industrial rationalization index+0.0434
GreenX8: Industrial sulfur dioxide emissions per unit of GDP (kg/million yuan)0.0161
X9: Share of energy-saving (ecological) environmental protection expenditure in financial expenditure (%)+0.0264
X10: Comprehensive utilization rate of general industrial solid waste (%)+0.0762
X11: Water consumption per unit of GDP (10,000 cubic meters/million yuan)0.1056
X12: Greening coverage rate of built-up areas (%)+0.0667
OpennessX13: Total import and export of goods as a share of GDP (%)+0.0503
X14: Actual utilization of foreign direct investment/GDP (%)+0.0333
SharingX15: Number of hospital doctors per 10,000 people (persons)+0.05
X16: Internet broadband access users per 10,000 people (households per 10,000 people)+0.0518
X17: Road area per capita (m2/person)+0.0741
X18: Share of social security and employment expenditure in fiscal expenditure (%)+0.0532
X19: Gas penetration rate (%)+0.0786
“+” is a positive indicator, “−” is a negative indicator.
Table 2. Global Moran’s index of the level of HQED in the YRB, 2000–2022.
VintagesMoran’s Ip-ValueZ-ValueVintagesMoran’s Ip-ValueZ-Value
20000.29370.0014.104720120.36670.0014.9267
20010.270.0023.750620130.38680.0015.2331
20020.2950.0024.06520140.29830.0014.0103
20030.21910.0033.021220150.32020.0014.3319
20040.2720.0013.693720160.2730.0013.7246
20050.3160.0014.253720170.23930.0033.2487
20060.35290.0014.721720180.31740.0014.2822
20070.28750.0013.808620190.26160.0013.5601
20080.26520.0013.645520200.25640.0023.4293
20090.32180.0014.334420210.2470.0023.2811
20100.34420.0014.711920220.28780.0013.8462
20110.32360.0014.3213
Table 3. Time-shifted trends in the level of HQED in the YRB, 2000–2022.
t/(t + 1)IIIIIIIV
I0.8330.160.0070
II0.0480.7280.2180.007
III00.070.7560.173
IV000.0470.953
Table 4. Trend of the spatial shift in the level of HQED in the YRB, 2000–2022.
Neighborhoodt/(t + 1)IIIIIIIV
II0.9020.0880.0090
II0.0680.7960.1070.029
III00.0910.8180.091
IV0001
III0.6930.30700
II0.0570.7220.2220
III00.1720.7070.121
IV000.1940.806
IIII0.3640.63600
II0.0090.7010.290
III00.0320.7820.185
IV000.1020.898
IVI0100
II0.0530.5790.3680
III00.0140.740.247
IV000.0040.996
Disclaimer/Publisher’s Note: The statements, opinions and data contained in all publications are solely those of the individual author(s) and contributor(s) and not of MDPI and/or the editor(s). MDPI and/or the editor(s) disclaim responsibility for any injury to people or property resulting from any ideas, methods, instructions or products referred to in the content.

