Abstract
The value network of the high-tech park constitutes a value co-creation system where multiple entities facilitate knowledge transformation through interaction, thereby achieving collaborative innovation. The reasonable distribution of collaborative innovation benefits among various innovation entities is a critical factor in maintaining the motivation for innovation within the value network. This study examines the co-creation mechanism of the value network in high-tech parks from the perspective of knowledge innovation, with the aim of enhancing the efficiency of knowledge transfer and spillover among entities. Additionally, it seeks to establish a fairer and more rational benefit distribution framework to promote collaborative innovation and ensure the stable operation of the value network. Firstly, we identify the entities involved in value co-creation within the high-tech park. Subsequently, we analyze the roles and interrelationships of these entities within the value co-creation network. We determine the knowledge flow pathways by employing the shortest path method, and innovatively construct an MMPP/M/C queuing model to depict the processes of knowledge transfer and spillover among the entities engaged in value co-creation. We optimize and solve the queuing model using the matrix geometric method, deriving metrics such as the average queue length, average arrival rate, average waiting time, and service intensity under the steady state of the system, and verify the applicability and effectiveness of the model in the application of the high-tech park through empirical data. Finally, by integrating the improved Shapley value method, a benefit distribution model is constructed that incorporates five types of factors: contribution level, resource input, knowledge spillover effect, effort level, and risk undertaking. The rationality and operability of this model are validated through computational examples. Research findings indicate that the optimized queuing model enhances the efficiency of knowledge transfer and spillover among entities, while the refined benefit distribution mechanism effectively compensates entities with high contribution levels, substantial resource inputs, significant knowledge spillover effects, elevated effort levels, and high risk assumption levels. This provides both theoretical support and practical guidance for sustaining the long-term stable operation of the value network.
1. Introduction
Innovation has emerged as the core driver of sustainable development in the global economy. High-tech parks, serving as hubs for intellectual resources and technological elements, have attracted a concentration of premium innovation resources. These parks play a pivotal role in facilitating the efficient transformation of scientific achievements into productive forces, establishing themselves as primary platforms for technological advancement. The construction and development of China’s high-tech parks commenced in 1985. As China’s innovation process has deepened, these parks have evolved into the pioneering forefront of the nation’s scientific and technological innovation. In terms of spearheading technological innovation, aggregating innovative resources, facilitating the transformation of research outcomes, and cultivating innovative talents, high-tech parks have assumed an irreplaceable and pivotal role. Consequently, they have become a crucial driver for advancing regional scientific and technological innovation and development, as well as being a new pillar of economic growth [1,2].
Scientific and technological innovation is essentially a process of knowledge innovation [3]. The environment for enterprises to carry out knowledge innovation has undergone fundamental changes. It has become exceedingly challenging for enterprises to undertake the entire process of knowledge innovation and obtain all the necessary resources by their strength alone [4,5]. At each critical stage of promoting product or service innovation, enterprises proactively seek collaboration with other organizations. By facilitating the sharing of diverse information and the circulation of heterogeneous knowledge, not only has the effective transfer of value among different enterprises been realized, but more organizations have also been incentivized to engage in the process of knowledge innovation and value creation. Consequently, a mutually dependent and tightly collaborative value network is gradually established. Relying on the organic connection between the industrial chain and the value chain, enterprises in high-tech parks have constructed a value network characterized by interdependence and collaborative innovation. By integrating resources and leveraging complementary advantages, they collectively drive the sustainable development of the regional economy while striving to maximize regional value and ensure the continuous enhancement of long-term benefits. However, the existing studies remain limited in addressing the fairness of the mechanism for multi-initiative collaborative knowledge innovation and the distribution of benefits [6,7,8,9,10,11,12]. Specifically, how to enhance the speed of knowledge transfer and spillover within the value network of high-tech parks, as well as how to reasonably allocate the benefits generated from value network co-creation, are critical questions that require urgent attention. From the perspective of knowledge innovation, examining the optimization of knowledge transfer and spillover efficiency within high-tech parks’ value networks, along with their benefit distribution mechanisms, reveals their value co-creation mechanisms. This enhances knowledge utilization efficiency, refines benefit allocation frameworks, and effectively motivates all collaborative innovation entities within the park to achieve value co-creation. This study provides theoretical foundations and practical guidelines for sustaining innovation vitality and ensuring the value networks’ long-term stability. The subsequent literature review will further elucidate the existing research gaps and propose directions for improvement in this study.
2. Literature Review
2.1. Research Related to Knowledge Innovation
Knowledge innovation refers to the process of creating, acquiring, integrating, and applying knowledge in order to generate new ideas, concepts, technologies, products, services, or processes [13]. Knowledge innovation is an important factor in constructing regional competitive advantages and is also the source and foundation for realizing key core technological innovations and breakthroughs [14]. Many scholars have studied how to enhance the knowledge innovation capability of enterprises from the perspective of knowledge transfer and knowledge spillover.
Currently, scholars have explored various pathways for knowledge transfer to enhance the innovation capabilities of enterprises from multiple angles. Li and You used hierarchical regression analysis and the self-help (Bootstrapping) method to uncover the internal mechanism by which knowledge transfer enhances an enterprise’s innovation capability, mediated by absorptive capacity and moderated by network dependence [6]. Guo et al. further investigated the transmission mechanism through which knowledge transfer enhances enterprises’ knowledge innovation capabilities by fostering ambidextrous innovation from the perspective of the innovation network [7]. Among them, scholars have observed that optimizing the network structure can enhance the efficiency of knowledge transfer, thereby effectively promoting knowledge innovation [15]. Wang et al. found that enhancing the centrality and relationship strength of collaborative innovation networks can help to enhance knowledge transfer efficiency, which further improves the innovation performance of enterprises [16]. Wang et al. constructed a knowledge transfer model based on the individual knowledge potential and interrelationships, and put forward a solution algorithm and evaluation indexes for the optimal knowledge transfer paths [17]. However, the majority of these studies concentrate on knowledge flow within a single organizational type or between dyadic organizations, neglecting an in-depth examination of the characteristics of multi-agent collaborative knowledge flow in more complex innovation ecosystems. Additionally, while most existing studies emphasize the direct effects and mediating mechanisms of knowledge transfer, they provide limited insight into the micro-mechanisms underlying the knowledge transfer process.
Regarding the impact of knowledge spillover on knowledge innovation, the current academic circle is gradually shifting from understanding the one-way promoting effect to exploring the complex mechanism of action. Most studies generally emphasize the positive effect of knowledge spillover. For example, Wang and Liu confirmed the significant promoting effect of knowledge spillover on regional innovation through the ridge regression model and the system dynamics model [8]. Audretsch et al. further demonstrated the significant catalytic effect of the synergy between R&D investment and knowledge spillover on driving radical innovation [18]. However, with the advancement of in-depth research, the “moderate interval” theory proposed by Zheng and Liu has challenged this linear cognition, highlighting the nonlinear characteristics of the knowledge spillover effect—when the spillover intensity surpasses a critical threshold, its inhibitory impact on enterprises’ innovation incentives starts to become apparent [19]. This contradiction suggests that an optimal threshold exists for the effect of knowledge spillover. Therefore, how to strike a balance between knowledge spillover and enterprise knowledge innovation remains a topic worthy of in-depth exploration. Additionally, scholars have investigated the transmission mechanisms of knowledge spillover among various entities. Monjon and Waelbroeck have suggested that universities and research institutes spill over knowledge to firms through both formal cooperation and informal channels [9]. Hallin and Lind empirically distinguished two knowledge spillover mechanisms: unintentional knowledge transfer between MNCs’ subsidiaries and other competitors in the same region and intentional knowledge diffusion between MNCs’ subsidiaries and their local suppliers and customers [20]. Feng et al. employed the Spatial Durbin Model in their study and revealed that enterprise agglomeration in the Yangtze River Delta region significantly facilitates explicit knowledge spillover among technology-based small- and medium-sized enterprises [21]. Although research in this field continues to advance, it still encounters significant methodological challenges. The inherently implicit nature of knowledge spillover renders its process difficult to observe directly, thus complicating efforts to quantify the intensity of knowledge spillover. This limitation not only constrains the development of related theories but also affects the precision of policy recommendations.
2.2. Research Related to Value Network and Value Co-Creation
A value network is a complex value chain network system centered on user value, which deconstructs and integrates the traditional value chain and involves the dynamic value exchange process of tangible and intangible assets formed by customers, enterprises, suppliers, complementaries, and other stakeholders in value creation, distribution, transfer, and use [22,23,24,25,26,27]. Within the framework of the regional innovation system, scholars have conducted hierarchical modeling of the network structure of high-tech parks to better understand their organizational and relational dynamics. Li et al. constructed a high-tech park innovation network structure model that included core, sub-core, and supporting innovation network subsystems [10]. Xie and Hu refined the innovation network of national high-tech zones, covering four sub-networks of inputs, subjects, means, and outputs, which jointly promote knowledge creation, transformation, and application, and value realization [28]. Trunina and Ashourizadeh explored the strength of the linkage between different stages of enterprises’ development and stakeholders’ networks in the regional innovation system, with four high-tech enterprises in Zhongguancun, China, and Silicon Valley of the U.S.A. as the objects of research [29]. It is evident that the majority of existing studies on the network structure of high-tech parks focus on technological innovation, resulting in a relatively limited research dimension.
Value co-creation is the core driving force of value network construction which stimulates innovation by promoting the interaction and cooperation between each participant, thus realizing the sustainable growth of value and bringing lasting competitive advantages to the whole value network. Scholars have explored the internal mechanism and realization path of value co-creation from the perspective of resource interaction and integration. Chih et al. employed the service-dominant logic theory to investigate how service providers and clients collaboratively co-create value in professional service projects. The study revealed that knowledge transfer and interaction motivation serve as critical operational resources for effectively achieving value co-creation [11]. Ji et al. employed differential game theory to investigate how a technology innovation platform, scientific innovation layer, and support layer achieve value co-creation through dynamic optimization and coordination strategies under the influence of factors such as technology development and resource integration across different cooperation models. [30]. However, despite knowledge being an important factor for enterprises to realize value creation and acquisition in the value network [31,32], the mechanism of promoting knowledge transformation through its flow to realize knowledge innovation and drive value co-creation has not been fully explained, which provides an important breakthrough direction for future research.
2.3. Queueing Theory and Its Applications
Queuing theory, also known as the theory of stochastic service systems, is a theoretical research method focused on analyzing and optimizing congestion issues arising from stochastic factors [33]. It constructs a queuing model and employs mathematical methods to quantitatively and dynamically simulate the structure and behavior of an inherently complex queuing system. Subsequently, based on the various metrics of the queuing model, it rigorously characterizes the probabilistic behavior of the queuing system [34], thereby achieving optimal design and control of the system to either satisfy the requirements of service recipients or maximize the economic efficiency of the entire system. Currently, queuing theory methods have found extensive application in various fields, including healthcare [35,36], telecommunications [37,38], logistics [39,40], and transportation [41,42].
The fundamental components of a queuing system encompass the input process, queuing rules, and service facilities. The latter two collectively form the service system. The input process pertains to the arrival pattern of customers and how they enter the system. This includes the customer source (finite or infinite), the arrival type (individual or batch), and the inter-arrival time intervals (fixed or random). Queuing rules dictate the principles by which the system organizes the order of customers waiting for or receiving services when servers are occupied. Common queuing rules include first-come, first-served (FCFS) and last-come-first-served (LCFS). Service facilities refer to the resources that provide services to customers within the queuing system, such as the number of service counters (single or multiple), their arrangement (parallel, series, or hybrid), and the distribution of service times (fixed or random).
The Markov Modulated Poisson Process (MMPP) is a stochastic process model primarily utilized to describe random event flows with dynamically varying arrival rates. It is particularly suited for modeling traffic exhibiting burstiness, correlation, or time-varying characteristics. The MMPP comprises two key components: a continuous-time Markov chain and a Poisson process related to the state of this Markov chain. The state transition in the Markov chain determines the variation in arrival rates, while the Poisson process characterizes event arrivals within different states. In the MMPP, each state in the Markov process corresponds to a distinct Poisson arrival rate, and transitions between states occur based on predefined transition probabilities.
2.4. Research Related to Benefit Distribution
Reasonable and fair benefit distribution is a key factor affecting the sustainability of multi-party cooperation. As an important theoretical basis for solving the benefit distribution problem, cooperative game theory has been widely recognized and applied by scholars at home and abroad [43,44]. The Shapley value method, as a mathematical tool in cooperative game theory, has become an effective basis for solving the benefit distribution problem because of its simplicity in calculation and its ability to achieve fair and effective benefit distribution [45]. Scholars mainly adopt the Shapley value method to solve the benefit distribution problems in the fields of industry–university–research cooperation [46,47], supply chains [48,49], and cooperative alliance [44,50]. These studies highlight the evolving trend of transitioning from maximizing the interests of a single entity to fostering win–win cooperation among multiple stakeholders. As application scenarios become increasingly complex, particularly in dynamic environments like innovation ecosystems, future research should place greater emphasis on the adaptability and flexibility of distribution mechanisms to effectively address the diverse interest coordination requirements across various contexts.
With the advancement of in-depth research, scholars have identified significant limitations of the traditional Shapley value method in practical applications. Specifically, this method solely allocates benefits based on members’ marginal contributions without adequately accounting for other realistic factors, such as variations in resource input and levels of risk assumption. Consequently, its applicability becomes restricted in complex scenarios [51]. To overcome this limitation, scholars have started to explore the improved Shapley value method as a potential solution. Wang et al. incorporated three critical factors—resource input, risk sharing, and innovation capability—and applied an improved Shapley value approach to investigate the benefit distribution of mobile payment business models [52]. Zhou et al., by employing an improved Shapley value method and comprehensively considering factors such as contribution, risk, and cooperation mode, investigated the issue of revenue distribution in the agricultural e-commerce supply chain and proposed a fairer and more reasonable allocation strategy [12]. However, these studies still exhibit certain limitations. First, the majority of existing studies approach the issue from an economic perspective, introducing relevant factors such as input cost and risk sharing to improve the Shapley value method, yet they overlook the critical impact of the knowledge spillover effect on benefit distribution. Research has demonstrated that the knowledge spillover effect within alliances can substantially enhance the overall innovation performance of the alliance, reduce the learning costs for member enterprises, and foster technological synergy through the sharing of tacit knowledge [53]. Consequently, the influence of the knowledge spillover effect should also be incorporated into considerations of benefit distribution. Second, improvements to the Shapley value method predominantly focus on the model or calculation techniques, with limited attention given to enhancements tailored to the specific circumstances and requirements of the benefit distribution stakeholders.
2.5. Summary of the Literature
Knowledge innovation is a market-value-oriented system network process, and its realization hinges on collaboration and mutual benefit among participants within the value network [54]. The value network, as a knowledge system for knowledge production, circulation, and value realization [55], is capable of effectively integrating and allocating heterogeneous resources, and significantly enhancing the innovation ability and competitive advantage of network members through continuous knowledge flow [56,57]. In this process, the interaction and knowledge sharing among stakeholders facilitate the integration of multi-party knowledge, foster the achievement of collaborative innovation [58,59,60,61], and enable the transformation of innovation outcomes into actual market value through the value co-creation mechanism. It can be observed that the three components form an organic linkage mechanism of “knowledge innovation-driven, value network-supported, and value co-creation realized”. Specifically, the value network serves as a resource integration platform, knowledge innovation supplies the core driving force, and value co-creation transforms the outcomes of knowledge innovation into market value via collaborative mechanisms.
Through reviewing the literature, it is evident that, firstly, the existing research lacks a systematic investigation into the multi-agent collaborative knowledge innovation mechanism, particularly in terms of the micro-level mechanisms underlying the knowledge transfer process. Secondly, studies on value networks predominantly focus on network structures from the perspective of technological innovation, which imposes limitations on their research perspectives and neglects the value co-creation mechanism driven by knowledge innovation. Lastly, while the traditional Shapley value method has certain limitations in accounting for realistic factors such as resource input, the most improved Shapley value approaches tend to emphasize economic considerations and generally overlook the critical dimension of knowledge spillover effects.
In light of the aforementioned research gaps, this study makes the following improvements: First, it investigates the value co-creation mechanism of the high-tech park value network from the perspective of knowledge innovation, thereby addressing the lack of analysis on the knowledge-innovation-driven value co-creation mechanism within the multi-agent collaborative complex innovation systems in existing studies. Second, the MMPP/M/C queuing model is innovatively applied to depict the process of knowledge transfer and spillover, offering a novel approach to studying the dynamic micro-level mechanisms of these processes. Finally, the knowledge spillover effect is integrated into an improved framework of the Shapley value method, leading to the construction of a benefit distribution model for the high-tech park value network. This advancement overcomes the limitation of traditional methods that only consider marginal contributions and compensates for the insufficient attention given to the critical role of the knowledge spillover effect in current benefit distribution research.
To summarize, this paper centers on the co-creation mechanism of the value network in high-tech parks. It aims to enhance the efficiency of knowledge utilization and achieve a fair distribution of benefits by optimizing the processes of knowledge transfer, spillover, and benefit distribution within the value network of high-tech parks from the perspective of knowledge innovation. This optimization will drive all entities within the value network to collaboratively create value and ensure the long-term stable operation of the value network. Specifically, the paper first identifies the entities within the value network of high-tech parks and analyzes their roles and interrelationships in value co-creation. Subsequently, it employs the shortest path method to determine the pathways of knowledge transfer and spillover among various entities within the high-tech park. Based on this, an MMPP/M/C queuing model is constructed to quantitatively describe the process of knowledge transfer and spillover among entities, and the matrix geometric algorithm is utilized to optimize and solve the model. The practical feasibility of the model is validated through case examples. Finally, considering factors such as contribution level, resource input, knowledge spillover effect, effort level, and risk undertaking, a benefit distribution model based on the improved Shapley value method is developed. Its rationality is verified through case studies. By promoting knowledge innovation and ensuring equitable benefit distribution within the park, the proposed approach further facilitates collaborative value co-creation among all entities and ensures the sustainable operation of the value network.
3. Analysis of the Optimization of Knowledge Flow in the Value Network of High-Tech Parks from the Perspective of Knowledge Innovation
The research design of this chapter is as follows: Firstly, the entities of the value network in the high-tech park were identified and divided into four types of states (knowledge intermediary, R&D, manufacturing, and service) according to the attributes of the entities. Secondly, the path of knowledge flow among the entities was determined through the shortest path method. On this basis, the process of knowledge transfer and spillover was modeled as an MMPP/M/C queuing model. The knowledge which transferred and spilled among the entities was regarded as being the customers, and the knowledge transfer methods (online/offline) were regarded as the servers. The matrix geometric algorithm was used to solve the key indicators such as the average queue length, average arrival rate, waiting time, and service intensity in the steady state. Finally, a case study was conducted based on the empirical data of a high-tech park to verify the feasibility and validity of the model.
3.1. Analysis of Value Network Co-Creators in High-Tech Parks
The value network formed in high-tech parks is characterized by being innovation-driven [62] and having closer synergy among multiple entities [63] and a more distinctive technology orientation than traditional value networks [64]. The value network entities in high-tech parks are identified and categorized into four types: dominant entities, core entities, supportive entities, and driving entities. The dominant entities represented by enterprise R&D organizations and research institutes lead the value network’s technological innovation and R&D direction and provide new R&D results and technical support. The core entities such as the supply/manufacturers, logistics enterprises, sales enterprises, and inspection and testing organizations receive and implement the innovation solutions of R&D institutions, and interact and cooperate with various entities in manufacturing and sales to realize effective articulation within the value network. The supportive entities, such as business incubators, knowledge intermediaries, financial institutions, and the government, provide funds, tax incentives, and other support and assistance for the operation of the value network. As the driving entities, customers drive the innovation and development of the value network by putting forward their needs and feedback. From the perspective of knowledge innovation, the sales enterprises, customers, government, and financial institutions in the value network are not directly involved in the process of knowledge innovation, so the sales enterprises, customers, government, and financial institutions are not considered in the process of knowledge innovation.
According to the attributes of the entities, they can be categorized into four states: knowledge intermediary, R&D, manufacturing, and service. Knowledge intermediaries mainly take research institutes and enterprises as their primary service objects and provide technical support and services for transforming innovation results around research and development. Enterprise R&D organizations, research institutes, and enterprises such as equipment suppliers, manufacturers, and raw material/component suppliers carry out technology, product, and process development. Business incubators, inspection and testing organizations, logistics companies, etc., provide services such as the incubation of new ideas, inspection of products, logistics, and distribution, which help reduce costs, increase efficiency, and accelerate the process of knowledge innovation.
3.2. Construction and Solution of MMPP/M/C Queuing Model for Knowledge Innovation in High-Tech Parks
To enhance the efficiency of knowledge transfer and spillover, the shortest path method is employed to determine the optimal knowledge flow paths within the value network of a high-tech park. The knowledge transfer and spillover relationships among entities are modeled as a directed graph, where the nodes represent the entities and edges denote the knowledge transfer and spillover pathways. First, the relative knowledge transfer (spillover) rate between two entities is calculated by dividing the knowledge transfer (spillover) volume of one entity by the total knowledge transfer (spillover) volume between the two. Second, considering the knowledge transfer (spillover) rate as the path length, the respective path lengths in diagonal, parallel, and vertical directions from one entity to another are computed for each pair of entities. Finally, to maximize the overall value of knowledge transfer and spillover, the path with a relatively longer path length among all possible paths should be selected as the optimal knowledge transfer or spillover pathway. According to this process, the knowledge transfer and spillover path diagram in the value network of the high-tech park can be obtained (Figure 1).
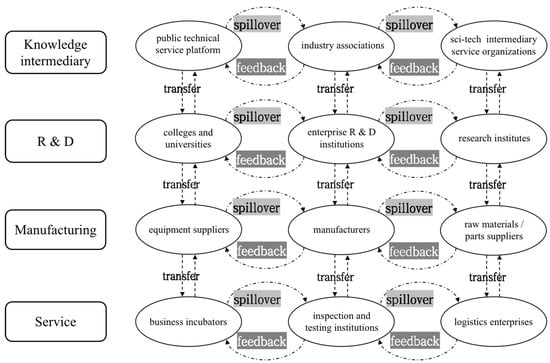
Figure 1.
Knowledge transfer and spillover paths in the value network of high-tech parks.
In the process of knowledge innovation, knowledge transfer and knowledge spillover facilitate knowledge transformation and utilization via the flow of knowledge, thereby generating the effects of knowledge innovation. Knowledge transfer emphasizes bidirectional knowledge flow, allowing both parties involved to effectively enhance their knowledge levels and stimulate innovative thinking by exchanging and sharing new knowledge according to their respective needs [65]. However, since knowledge transfer often does not stem from the conscious actions of the entity but is instead driven by various accidental factors or unconscious behaviors, it inherently possesses a certain degree of randomness. Activities within the value network of high-tech parks that are associated with knowledge innovation, such as technical consultation, R&D collaboration, and patent transformation, frequently display time-varying volatility. Meanwhile, the process of knowledge transfer and spillover in the four states of knowledge intermediary, R&D, manufacturing, and service is affected by many factors, such as knowledge characteristics [66], the amount of transferred knowledge [67], inter-subjective relationships [68], and environmental conditions [69]. Therefore, MMPP is used to describe the transfer and overflow process of knowledge with the change in an entities’ state, so that it can more accurately describe the dynamic change in knowledge between entities and determine the optimal knowledge transfer and overflow strategy. The behaviors of each entity in the value network of the high-tech park initiating knowledge transfer requests are mutually independent. The time intervals between consecutive requests follow a random distribution and lack a defined upper limit. The execution time for each knowledge transfer activity adheres to a negative exponential distribution. Knowledge transfer activities among the various entities within the value network of the high-tech park are conducted via both online and offline approaches, with earlier submitted knowledge transfer requests being processed on a priority basis. Therefore, the knowledge transfer and spillover process within high-tech parks can be modeled as an MMPP/M/C queuing system. In this context, the knowledge being transferred and spilled among the entities is treated as customers in the queuing system. The system comprises two service modes: online and offline, acting as the servers. The queuing discipline adheres to the first-come, first-served (FCFS) principle.
We construct a knowledge innovation MMPP/M/C queuing model of the value network in a high-tech park. We suppose that in the same type of state, the average arrival rates of knowledge are , , , and; there are two servers in the entire queuing system, namely the online mode and the offline mode; and the average service rate is . In the dissimilar state, the average knowledge spillover rate among entities from top to bottom are , , , , , and, and the average knowledge spillover rate among entities from bottom to top are , , , , , and . In brackets such as , , etc., the first digit, respectively, represents that there are 0 entities, 1 entity, and 2 entities’ knowledge entering the queuing system under the same state. The second digit represents the state to which the entities belong, and the states are knowledge intermediary, R&D, manufacturing, and service. Based on the above settings, we can construct a mathematical model, as shown in Figure 2.
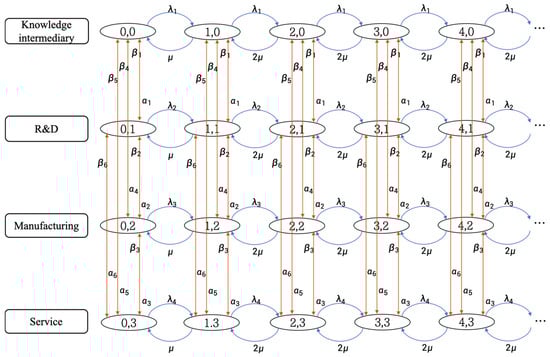
Figure 2.
Mathematical model of MMPP/M/C queuing for knowledge innovation in the value network of high-tech parks.
Due to the unique structure of the MMPP/M/C queuing model, its queue length and waiting time can only be determined using the matrix geometric method [70]. Consequently, the matrix geometric algorithm is employed to optimize and solve the MMPP/M/C queuing model for knowledge innovation within the high-tech park value network. We can derive the corresponding transition matrix from the knowledge transfer and overflow to each other in the four states in Figure 2. When the number of customers in the value network knowledge innovation queuing system exceeds four, the corresponding elements of the matrix are the same.
The sub-matrices , , , and are as follows:
The sub-matrices ,, and are as follows:
is the steady state distribution of customers in the MMPP/M/C queuing model for knowledge innovation in the value network, and there is an matrix that makes , and the normalized condition is , so we can obtain the following:
The average queue length for the knowledge innovation MMPP/M/C queuing model can be derived by Equation (11), where refers to the column vector where all elements are 1:
In analyzing the MMPP, the arrival rates of the four states of knowledge intermediary, R&D, manufacturing, and service are considered, which can more realistically reflect the process of knowledge innovation in the value network, so that the balance equation can be obtained:
, , , and are the probabilities for knowledge in the state of knowledge intermediary, R&D, manufacturing, and service, respectively. By using balance Equation (12), we can achieve ,, , and :
Then, we can obtain the average arrival rate :
Using the values of and , the waiting time of the MMPP/M/C queuing model for knowledge innovation can be derived by:
Using the values of and , the service intensity of the MMPP/M/C queuing model for knowledge innovation can be derived by:
3.3. Analysis of Numerical Example
This section serves as the practical validation of the aforementioned theoretical model. It applies the MMPP/M/C queuing model of knowledge innovation in high-tech parks to a real-world scenario using empirical data from a specific high-tech park. Specifically, the actual knowledge transfer and spillover volume of the high-tech park is collected through questionnaires as research data, thereby calculating the average knowledge arrival rate, average service rate, and average spillover rate as the input parameters of the model. Subsequently, by leveraging the MATLAB R2021a program, the constructed knowledge innovation MMPP/M/C queuing model is simulated and analyzed to derive key indicators such as the average queue length, average arrival rate, waiting time, and service intensity. This process validates the feasibility and effectiveness of the model in practical applications.
3.3.1. Data Acquisition
Taking a specific high-tech park as the research object and considering the actual cooperation and communication dynamics among the entities within the value network of the high-tech park, knowledge transfer and spillover activities primarily stem from six categories: the mobility of R&D talents; the implementation of communication activities; collaboration on R&D projects; patent creation; joint efforts in research reports and academic papers; and the establishment of enterprise, industry, and national standards. An online questionnaire was sent to technicians, R&D personnel, etc., who participated in or benefited from the knowledge innovation process within enterprises belonging to the four main states of the high-tech park (knowledge intermediary, R&D, manufacturing, and service) to collect the amount of knowledge transfer and spillover activities carried out among the relevant entities in the high-tech park. The structure of the questionnaire and the statistics of the number of questionnaires are as follows:
The first section of the questionnaire aims to gather basic enterprise information, such as the company name and the year it entered the high-tech park. The second section focuses on the execution of knowledge transfer and spillover activities. In this part, respondents are required to categorize their enterprises into one of the four primary states—knowledge intermediary, R&D, manufacturing, or service—based on their actual business operations. They must then further specify their business attributes by selecting a subcategory within the chosen state. Additionally, this section inquires in detail about whether the enterprise engages in knowledge exchanges with other entities in the areas of product or service innovation, and if so, through what specific channels knowledge is disseminated. These channels may include, but are not limited to, the mobility of R&D personnel, technical exchange events, collaborative R&D projects, patent inventions, co-authored research reports or academic papers, and participation in the development of corporate, industry, or national standards. Furthermore, the questionnaire also collects the volume of these knowledge exchange activities conducted annually.
Through the questionnaire survey, a total of 453 questionnaires were retrieved. During the questionnaire survey process, one of the enterprise R&D institutions carried out knowledge transfer and spillover activities with industry associations, research institutes, and universities. Therefore, the questionnaire of this enterprise R&D institution was counted as 1 copy, and the data were counted as 3 items. From the collation of 453 questionnaires, 2248 data entries were collected, with 2000 being valid, resulting in a data validity rate of 89%. The sum of the amounts of the six types of knowledge transfer and spillover activities carried out between the entities was the amount of knowledge transfer or knowledge spillover between them. The number of questionnaires across the 12 entity categories is shown in Table 1.

Table 1.
Number of questionnaires across 12 entity categories.
3.3.2. Calculation of Average Knowledge Arrival Rate and Average Service Rate
Taking the knowledge transfer process between entities in the R&D state as an example, the data quantities and knowledge transfer volumes are shown in Figure 3. The numbers within the boxes represent the data quantities, while the numbers on the horizontal arrows indicate the amount of knowledge transferred between entities.
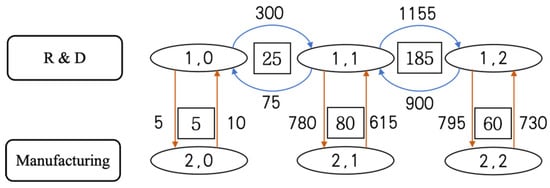
Figure 3.
Knowledge transfers, spillovers, and data volumes in R&D and manufacturing states.
The total knowledge transfer volume from to in the R&D state is:
The total knowledge transfer volume from to in the R&D state is:
The average knowledge arrival rate is:
Similarly, we can calculate the values of , ,. The average service rate is calculated as follows: first, we determine the proportion of each state’s data volume relative to the total data volume across all four states, then multiply this proportion by the corresponding value of that state, and finally sum all these products to obtain the result.
3.3.3. Calculation of the Average Knowledge Spillover Rates ,
Taking the knowledge spillover process between R&D and manufacturing states as an example, the data quantities and knowledge spillover volumes are shown in Figure 3. The numbers within the boxes represent data quantities, while the numbers on the vertical arrows indicate the amount of knowledge spilled over between entities.
The total knowledge spillover from the R&D state to the manufacturing state is:
The total knowledge spillover from the manufacturing state to the R&D state is:
The average knowledge spillover rates are:
Similarly, we can calculate the values of ,,,,,,,, and. By calculation, the values of all parameters in Figure 2 are shown in Figure 4.
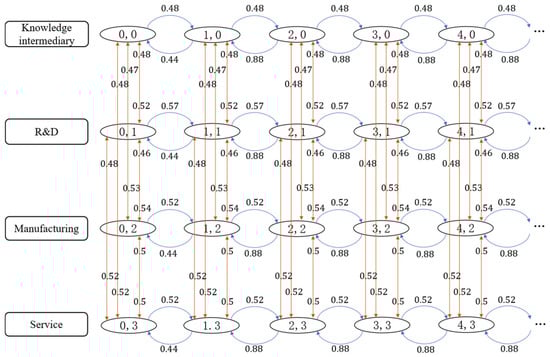
Figure 4.
Parameter values of the MMPP/M/C queuing model for knowledge innovation in the value network of high-tech parks.
3.3.4. Calculation of Average Queue Length, Average Arrival Rate, Average Waiting Time, and Service Intensity
According to the parameter values presented in Figure 4 and in conjunction with Formulas (2) through (8), the sub-matrices , , , and are calculated as follows:
The matrix can be obtained through the following operations:
The average queue length is calculated based on Formula (11).
According to Formulas (13)–(16), it is determined that and .
The average arrival rate is calculated based on Formula (17).
The average waiting time is calculated based on Formula (18).
The service intensity is calculated based on Formula (19).
After the calculation, the results indicate that the average queue length is 1.72, the average arrival rate is 0.52, the average waiting time is 3.29, and the service intensity is 0.59. Since the service intensity is less than 1, this suggests that the service capacity of both online and offline servers exceeds the demand for knowledge processing by the entity. Consequently, the queuing system for knowledge innovation in this high-tech park is stable. In the context of service allocation, each component has been utilized relatively fully and efficiently. Under the steady state of the system, the average queue length of 1.72 implies that the knowledge innovation entities in this high-tech park must absorb and integrate 1.72 units of knowledge flow before processing subsequent knowledge flows. The average arrival rate of 0.52 indicates that the daily knowledge transfer volume for the knowledge innovation entities within the high-tech park is 0.52 units of knowledge flow. The average waiting time of 3.29 suggests that it takes approximately 3.29 days for the knowledge innovation entities to digest and assimilate new knowledge after acquisition. Through model optimization and precise numerical computation, the aforementioned scheme enables the MMPP/M/C queuing model of value network knowledge innovation in this high-tech park to achieve global optimality.
4. Analysis of the Co-Creation Benefit Distribution in the Value Network of High-Tech Parks from the Perspective of Knowledge Innovation
4.1. Analysis of Influencing Factors of Benefit Distribution in Value Network
Industry–university–research, innovation networks, and strategic technology alliances promote product and service innovation and sustainable development through knowledge and technology sharing and cooperation, and their operation mechanism is similar to the value network of high-tech parks. By reviewing the relevant research in the literature [71,72,73,74], the influencing factors of benefit distribution are summarized into the following five points: (1) Contribution level: the theoretical basis of the Shapley value method is to allocate benefits according to the contribution level—the greater an entity’s contribution, the more benefits it receives. (2) Resource input, as a key factor, serves as the foundation for the operation of high-tech park value networks. Benefits should be allocated based on the amount of resources invested by each entity—the more resources an entity contributes, the greater the share of benefits it should receive. (3) Knowledge spillover effect: Knowledge serves as a critical force in the dynamics and negotiations within the value network. Benefit allocation should be determined by the magnitude of knowledge spillover from each entity. Entities with stronger knowledge spillover effects should be allocated greater benefits accordingly. (4) Effort level: to prevent entities from pursuing private interests at the expense of collective welfare, benefit allocation should be contingent upon the level of effort exerted—entities demonstrating greater effort should receive proportionally larger benefit shares. (5) Risk undertaking: given the varying types and degrees of risk assumed by entities within the value network, benefit allocation should be risk-proportional—entities undertaking greater risks should receive correspondingly larger benefit shares. The influencing factors of value network benefit distribution in high-tech parks are shown in Figure 5.
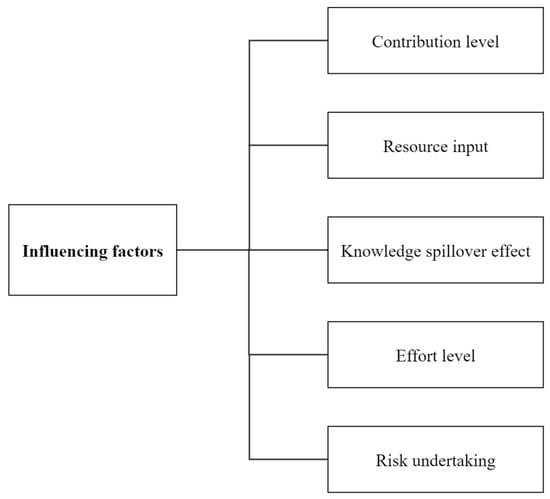
Figure 5.
Factors influencing benefit distribution in value co-creation networks of high-tech parks.
4.2. Construction of a Value Network Benefit Distribution Model Based on the Improved Shapley Value Method
4.2.1. Benefit Distribution Model Incorporating Resource Input Considerations
We assume that the value network of the high-tech park consists of entities with a maximum investment of resources, then let denote the cost value of entity investing in the -th resource. The cost values of the resource investments are converted into monetary terms by experts or third-party institutions, based on the resource inputs of all entities.
Taking all resources invested by the entities as evaluation indicators, experts conduct pairwise comparisons of these indicators using the “1–9 scale method” (as shown in Table 2) to construct a judgment matrix, which measures the relative importance among the indicators.
Table 2.
Criteria for the value of the 1–9 scale method.
We let denote the relative weight of each resource invested by entity . Thus, the total value of all resources invested by entity is given by:
The total co-created value of the high-tech park’s value network is denoted as. The resource investment proportion of entity is calculated by . Based on their respective resource contributions, the benefit allocated to each entity is denoted as , and then the calculation formula is:
4.2.2. Benefit Distribution Model Incorporating Knowledge Spillover Effect Considerations
The Analytic Hierarchy Process is used to calculate the relative importance of the knowledge spillover effect of the entities in the high-tech park’s value network, and the eigenvector is obtained. The relative weights of the entities in terms of knowledge spillover are , …, , respectively. denotes the relative importance of entity’s knowledge spillover effect.
The total co-created value of the high-tech park’s value network is denoted as . Based on the knowledge spillover effect of each entity, the benefits allocated to each entity are denoted as , and then the calculation formula is:
4.2.3. Benefit Distribution Model Incorporating Effort Level Considerations
The entities within the value network of a high-tech park collaborate through knowledge innovation. In the process of developing new products, services, and technologies, they may encounter unforeseen challenges and difficulties that were not initially anticipated. To address these issues, the entities must leverage their distinct advantages and invest greater effort into innovative collaboration, ensuring the successful completion of cooperative projects and maximizing benefits. Simultaneously, the entities engage in collaborative innovation guided by customer and market demands. By delivering an exceptional customer experience, they can expand market opportunities, enhance the sales performance, and enable the value network to achieve higher profitability. Therefore, the index system of effort level is constructed from the comprehensive consideration of the three aspects of innovation efforts, cooperation efforts, and service efforts, as shown in Figure 6.
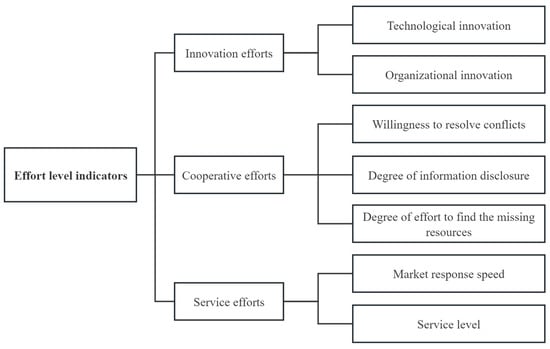
Figure 6.
Effort level indicators of entities in the value network of high-tech parks.
Innovation efforts are categorized into technological innovation and organizational innovation. Technological innovation refers to the efforts made by the entities to match with other technologies through the innovation of their technology. In high-tech parks, the collaborative innovation of the entity is used to integrate heterogeneous technologies and knowledge to achieve re-creation. In this process, the entity transforms and upgrades the original technology according to the demand target to promote the intercommunication and integration of multiple technologies. Organizational innovation refers to the efforts made by the entity to carry out organizational changes in terms of organizational structure, rules and regulations, and employee incentive systems. From the perspective of the enterprise interior, it is necessary to drive employees to enhance the awareness of innovation and create a good atmosphere for innovation, so as to enhance the enthusiasm for collaborative cooperation with external organizations.
Cooperation efforts are categorized into willingness to resolve conflicts, degree of information disclosure, and degree of effort to find the missing resources. The willingness to resolve conflicts is mainly reflected in the efforts made by the entities of the value network in the high-tech park to solve contradictions. During cooperation and communication among the entities, there may be differences in opinion and even conflicts. If both sides of these contradictions actively resolve them, it can ensure the stable development of the network relationship and improve the cooperation efficiency. The degree of information disclosure refers to the efforts made by the entities in establishing information exchange platforms, penalty systems for ineffective information disclosure, information disclosure management systems, etc. With the continuous upgrading of market demands and the accelerating changes in technologies, equipment, and processes, the entities in various fields should disclose their latest information in a timely and comprehensive manner to grasp the research direction and progress. The degree of effort to find the missing resources is mainly reflected in the efforts made by the entities in re-investing resources such as funds, equipment, and personnel, or seeking resource complementation from external members of the value network when dealing with sudden difficulties in cooperation. Seeking the needed resources in a timely manner can bring benefits for the advancement of innovation progress and the solution of problems.
Service efforts are categorized into market response speed and service level. Market response speed refers to the efforts made by the entities to promptly meet the dynamic market demands, shorten their value creation process, and ensure the on-time delivery, or even early delivery, of products and services. A fast market response speed can enhance the collaborative efficiency of multiple entities and improve the competitiveness of the overall value network. Service level refers to the efforts made by the entity in formulating service-standard management systems and improving the quality of after-sales services. High-quality service levels are conducive to increasing customer satisfaction and loyalty, improving the chances of secondary cooperation, and obtaining more profits.
Using the effort level indicators shown in Figure 6, we conduct a quantitative analysis of the effort level for each entity in the high-tech park’s value network. The combined Analytic Hierarchy Process (AHP) and fuzzy comprehensive evaluation method are employed to determine each entity’s effort level in the value co-creation process. First, we establish the evaluation, which is set as with corresponding assigned values of , respectively. Subsequently, the fuzzy comprehensive evaluation matrix for the entities’ effort level is derived by combining the weight vector with the fuzzy relation matrix. Finally, the comprehensive evaluation score for each entity in the high-tech park’s value network is calculated according to the formula .
The total co-created value of the high-tech park’s value network is denoted as , based on the effort level of each entity. The benefit allocated to each entity is denoted as then the calculation formula is as follows:
4.2.4. Benefit Distribution Model Incorporating Risk Undertaking Considerations
For industries engaging in collaborative innovation, the primary risks faced by entities stem from market promotion, core technologies, and partner reliability. The entities in the value network within high-tech parks integrate knowledge and technologies via collaborative cooperation aligned with market demands. Consequently, during the operation of the value network, risks related to market dynamics, cooperative relationships, and technological uncertainties are inevitable. Therefore, the index system of risk undertaking is constructed from the comprehensive consideration of the three aspects of market risk, cooperation risk, and technical risk, as shown in Figure 7.
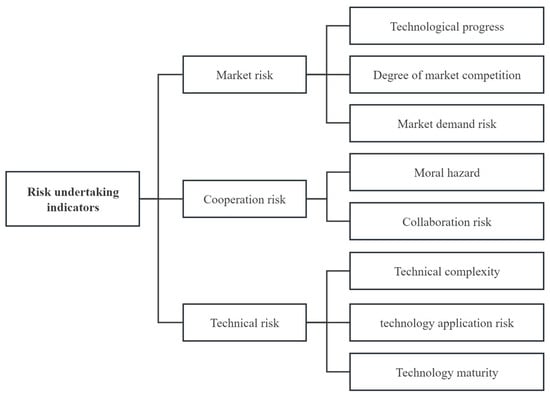
Figure 7.
Risk undertaking indicators of entities in the value network of high-tech parks.
Market risk is categorized into technological progress, degree of market competition, and market demand risk. The risks brought by technological progress refer to the risks that occur during the product research and development process due to technological innovation or the emergence of alternative technologies. Research and development achievements face the risk of technological backwardness or being eliminated before being put into the market. This may cause the product to lose technological competitiveness, and the previous research and development investment cannot be recovered. The risks brought by the degree of market competition refer to the risks of intensified competition caused by competitors carrying out similar research and development, or similar products flooding the market. This will compress the profit margin, dilute the market share, and weaken the ability of the entity of the value network to obtain excess returns through differentiated innovation. Market demand risk refers to the risk that the actual income after the product is launched does not match the expectations due to the dynamic changes in the demand in the target market. This will lead to the failure of the product’s market adaptability, cause overcapacity or an extended return period, and directly erode the cash flow and reinvestment ability of the entities of the value network.
Cooperation risk is categorized into moral hazard and collaboration risk. Moral hazard refers to the risk that individual entities in the value network may engage in behaviors that violate the cooperation contract or moral norms, such as unilateral default and fraud, driven by information asymmetry and egoism. This will undermine the trust basis among the entities and lead to the failure to achieve cooperation goals. Collaboration risk refers to the risk that differences among entities in terms of management methods, corporate culture, thinking patterns, or communication methods may trigger conflicts or reduce the willingness to collaborate, which will further lead to low cooperation efficiency and blocked innovation processes.
Technical risk is categorized into technical complexity, technology application risk, and technology maturity. The risks brought by technical complexity refer to the differentiated risks that the entities of the value network face due to the different degrees of complexity of the technologies they are responsible for. When a certain entity needs to make a major upgrade to the original technology, compared to an entity that only needs to make simple adjustments, it will face higher risks of extended research and development cycles and cost overruns. The technology application risk refers to the risk that the entity, during the process of technological research and development, and due to the difficulty of realizing the technology itself or external conditions’ restrictions, the final achievements cannot be transformed into marketable products as planned. This type of risk will lead to the formation of a “technical inventory” of research and development achievements, making it difficult to generate actual value. The risks brought by technological maturity refer to the risk differences arising from the different degrees of maturity of the technologies adopted in collaborative research and development. If the technology adopted by the entity is immature, has not been applied in previous innovation projects, or has a lower matching degree, it may face risks such as unstable technical performance or system compatibility.
Hypothetically, in the high-tech park’s value network co-creation, each entity should bear an equal risk proportion of ; however, in reality, the risks faced by each entity are different. Therefore, the actual risk undertaken by each entity is denoted as
Using the risk undertaking indicators shown in Figure 7, we conduct a quantitative analysis of the risk undertaking for each entity in the high-tech park’s value network. The combined Analytic Hierarchy Process (AHP) and fuzzy comprehensive evaluation method are employed to determine each entity’s risk undertaking in the value co-creation process. The specific steps are the same as the quantification process of the effort level. We determine the fuzzy comprehensive evaluation matrix of the entity, calculate the final risk undertaking evaluation score of entity i according to the formula , and normalize the result, i.e., . The difference between the actual risk undertaken and the average risk undertaken is:
We let the benefit relative to be denoted as , and the calculation formula is:
When , , the benefits of the entity increase proportionally based on the score exceeding the average degree of risk undertaking. When , , the benefits of the entity decrease proportionally based on the score falling below the average degree of risk undertaking.
4.2.5. Benefit Distribution Model Incorporating Multiple Factors
In the value network co-creation benefit distribution process of high-tech parks, the four influencing factors—contribution level, resource input, knowledge spillover effect, and effort level—play varying roles. Using the Analytic Hierarchy Process (AHP), the weights of these influencing factors are calculated and denoted as .
denotes the allocation received by the -th member under cooperation , and is calculated by the following formula:
The benefit distribution model incorporating the influencing factors of contribution level, resource input, knowledge spillover effect, effort level, and risk undertaking is formulated as follows:
4.3. Analysis of Numerical Example
4.3.1. Benefit Distribution in the Value Network Based on the Shapley Value Method
There are four enterprises which act as the entities of the value network of a certain high-tech park, belonging to knowledge intermediary institutions, R&D enterprises, manufacturing enterprises, and service enterprises, respectively, and referred to as A, B, C, and D, respectively. The set includes subsets such as , ,,,, ,, ,, ,, , , ,, and . Here, represents the scenario where no enterprise participates in the project collaboration, so RMB. The subsets ,,, and indicate that A, B, C, and D conduct research and development independently without collaborating with other enterprises. The subsets ,, ,, , and represent pairwise collaborations between A, B, C, and D. The subsets , , , and denote collaborations among any three of A, B, C, and D. Finally, represents the joint collaboration of all four enterprises, A, B, C, and D.
The profit amounts for companies A, B, C, and D under three different cooperation scenarios—non-cooperation, partial cooperation, and full cooperation—are as follows: 000000 RMB, 000000 RMB, RMB, RMB, RMB, RMB, RMB, RMB, RMB, RMB, RMB, 000,000 RMB, RMB, and RMB. According to the calculation, the distribution of benefits of A, B, C, and D based on the Shapley value method is shown in Table 3.
Table 3.
Calculated values of the Shapley value method for enterprise A (unit: CNY 10k).
According to Table 3, we can obtain the benefit distribution of A based on the contribution level by the calculation: RMB. Similarly, the calculated profit allocations for B, C, and D based on their contribution level are CNY 16,750,000, CNY 12,583,400, and CNY 9,083,300, respectively.
4.3.2. Benefit Distribution in the Value Network Based on the Improved Shapley Value Method
- Benefit distribution considering resource inputs
Assuming that A, B, C, and D invest a total of four resources, namely capital, venue, equipment, and talent, all resources are compared two by two according to Table 2, and the weights are calculated using hierarchical analysis and pass the consistency test. According to Formula (20), we calculate the value of the resources invested by each enterprise, as shown in Table 4.
Table 4.
Enterprise resource allocation status.
According to Equation (21), the distribution of benefits among enterprises according to resource inputs is derived:
- 2.
- Benefit distribution considering knowledge spillover effect
With reference to A, B, C, and D’s scientific research investment and capacity, the number of patents owned, the willingness to share knowledge, and the innovation ability of R&D employees, according to the scoring criteria in Table 2, the experts score the knowledge spillover effect of A, B, C, and D, and is calculated by using the Analytic Hierarchy Process.
Assuming , the distribution of benefits across enterprises according to the knowledge spillover effect is derived according to Equation (22):
- 3.
- Benefit distribution considering effort level
Taking enterprise A as an example, the second-level indicators of A’s effort level are scored by experts to determine the degree of affiliation. First of all, the first-level comprehensive evaluation of A is conducted to derive the fuzzy evaluation matrices , , and for innovation efforts, cooperative efforts, and service efforts:
According to the criteria in Figure 6 and Table 2, the experts score the secondary indicators of effort level and use hierarchical analysis to find out the relative weights among the indicators:
The vectors of the combined evaluation of innovation efforts, cooperative efforts, and service efforts are derived:
Second-level integrated evaluations are conducted based on the results of the first-level integrated evaluations.
, , and are used as the fuzzy relationship matrices for the comprehensive evaluation of A’s effort level:
The primary weight of the effort level indicators is:
A’s comprehensive evaluation vector for effort level is:
A’s effort level composite score is:
We can similarly derive that:
Based on Equation (23), the distribution of benefits across enterprises according to effort level is derived:
- 4.
- Benefit distribution considering risk undertaking
According to the indicators in Figure 7 and referencing the calculation process of the effort level scores, the scores for the actual risk assumed by each entity are determined and subsequently normalized. We assume that the actual proportion of risk taken by A, B, C, and D is 0.12, 0.36, 0.32, and 0.2, respectively. The average proportion of risk taken by A, B, C, and D is 0.25. According to Equations (24) and (25), the difference in the risk taken by each enterprise, as well as the corresponding value of the return, are found.
- 5.
- Benefit distribution considering multiple factors
According to Figure 5, the relative importance of contribution level, resource input, knowledge spillover effect, and effort level are scored by five experts according to the scoring criteria in Table 2, and the relative weights between the indicators are found out using the Analytic Hierarchy Process, which are , , , and , respectively.
Based on Equation (27), the corrected values of the distribution of benefits are derived:
As shown in Table 5, after the improved distribution of benefits, B and C achieve an increase of CNY 7,155,129 and CNY 3,214,625.28, respectively. A and D achieve a decrease of CNY 6,291,172.14 and CNY 4,078,582.14, respectively, and part of the decreasing value of the benefits of A and D is made up for with the increase in B and C’s benefits. This indicates that A is the smallest in terms of contribution level, resource input, knowledge spillover effect, effort level, and risk undertaking compared to the other enterprises, and therefore has the largest decrease in the benefits of improvement and the smallest amount of benefits distributed. B gives the most in all aspects, and therefore receives the most benefits and has the largest increase in the value of the benefits of improvement.
Table 5.
Comparison of the results of the distribution of benefits (unit: CNY).
5. Conclusions and Implications
5.1. Conclusions and Discussion
From the perspective of knowledge innovation, the entities of value network co-creation in high-tech parks and their mutual relationships are identified. The shortest path method is adopted to determine the paths of knowledge transfer and spillover in the value network of high-tech parks. On this basis, the MMPP/M/C queuing model for knowledge innovation in high-tech parks is constructed. The matrix geometric algorithm is utilized to optimize and solve this model, and the average queue length, average arrival rate, average waiting time, and service intensity in the steady state of the queuing model are calculated. Through empirical analysis, the validity and applicability of this queuing model in the process of knowledge innovation in high-tech parks are proven. Subsequently, a benefit distribution model based on the improved Shapley value method is constructed based on the factors of benefit distribution in the value network co-creation of high-tech parks, such as contribution level, resource input, knowledge spillover effect, effort level, and risk undertaking. Through numerical examples, it is proved that it can better reflect the benefit compensation for the entities with a high contribution level, more resource input, strong knowledge spillover effect, high effort level, and more risk undertaking in the process of knowledge innovation, which is conducive to driving the value co-creation of the value network in high-tech parks and maintaining the long-term stable operation of the value network. Next, the research findings will be further analyzed and discussed in detail.
Firstly, this paper emphasizes the core driving role of R&D entities in innovation, as well as the key supporting functions of knowledge intermediary entities and service entities in the transformation of achievements and the collaboration of the industrial chain. Together, they confirm the key role of the division of labor and synergy among multiple entities in the innovation ecosystem, which coincides with the research by Zhang et al. and Lian [75,76]. Compared to existing studies, this paper particularly emphasizes the important role of manufacturing entities in the innovation network, that is, manufacturing entities not only undertake the key function of transforming R&D achievements into actual products, but also promote the iterative upgrading of technology through feedback from production practice.
Secondly, this paper describes the process of knowledge transfer and spillover within the value network of the high-tech park based on the MMPP/M/C queuing model and solves the model using the matrix geometric algorithm. To further verify the optimization and practicality of the MMPP/M/C queuing model, the performance of the MMPP/M/C queuing model and other queuing models (such as the M/M/C queuing model) in the knowledge innovation queuing system of the high-tech park can be compared, with a focus on the average queue length, average arrival rate, average waiting time, and the service intensity, so as to explore and prove the applicability and effectiveness of the MMPP/M/C model in improving the knowledge utilization rate of the high-tech park and promoting the knowledge innovation process of the high-tech park. This also provides a direction for further research work in the future.
Finally, considering that each entity has differences in terms of contribution level, resource input, knowledge spillover effect, effort level, and risk undertaking, a benefit distribution model based on the improved Shapley value method is constructed. The results show that the allocated benefits of knowledge intermediary entities and service entities decrease, while the allocated benefits of R&D entities and manufacturing entities increase. This indicates that, considering multiple factors, part of the benefits of knowledge intermediary entities and service entities should be compensated to R&D entities and manufacturing entities. This echoes the research of Liu et al. and Sun; that is, R&D entities and manufacturing entities undertake more of the responsibilities of technology R&D, resource integration, and risk assumption in the innovation ecosystem [77,78].
5.2. Management Insights and Recommendations
In terms of value network co-creation entities, firstly, communication between entities should be strengthened through the exchange and learning of new knowledge and technology as well as the discussion and solution of innovation problems. This will be conducive to enhancing the efficiency of knowledge transfer and spillover, and ensuring the smooth promotion of innovation projects. Secondly, it strengthens the leading role of the dominant entities in knowledge innovation, fully utilizes their information and technological advantages, and promotes the introduction and sharing of innovative resources. Finally, the rights and responsibilities of co-creation entities should be clarified to facilitate the implementation of the work and provide a basis for the distribution of benefits.
With regard to knowledge transfer and spillover, firstly, high-tech parks should continuously strengthen IPR exchanges and raise enterprises’ awareness of respecting and protecting IPR. Second, high-tech parks should continue to strengthen IPR protection, enhance judicial protection, create a favorable atmosphere for IPR protection, and promote the sharing of innovation resources among entities in the value network.
With regard to the distribution of benefits, firstly, at the initial stage of the establishment of the cooperative relationship, the entities need to negotiate and formulate a benefit distribution agreement to constrain the default behavior of the entities, and to lay the foundation for the effective operation of the benefit distribution mechanism. Second, according to the actual situation, the initial benefit distribution plan should be revised based on the contribution level, resource input, knowledge spillover effect, effort level, risk undertaking, and other factors of the entities in the value network to make the benefit distribution more fair and reasonable.
5.3. Research Contributions
Firstly, this study expands the research perspective of value networks in high-tech parks; traditional research mainly studies the structure and mechanism of innovation networks in high-tech parks from the perspective of technological innovation, while this paper studies the structure and driving mechanism of value networks in high-tech parks from the perspective of knowledge innovation. Secondly, it enriches the research on the transfer and spillover of knowledge among the entities of the value network, expands the application field of queuing theory, builds the MMPP/M/C queuing model for knowledge innovation in the high-tech park, and solves it by using the matrix geometric method, to improve the knowledge utilization rate in the value network of the high-tech park and guide the entities of the value network to effectively create value. Finally, it expands the theory and research methods of benefit distribution in the value network co-creation of high-tech industrial parks. Most previous studies focused on the benefit distribution mechanisms of supply chains and enterprise alliances. This paper focuses on the benefit distribution mechanism when the entities of high-tech parks form a value network, and takes the knowledge spillover effect into consideration, proposing an improved benefit distribution plan for the value network co-creation of high-tech parks, and provides a reference basis for the benefit distribution of value network co-creation in high-tech parks.
5.4. Research Limitations and Prospects
Firstly, the co-creation mechanism of the value network in high-tech parks from the perspective of knowledge innovation is explored. In the future, the research perspective can be further enriched to gain more comprehensive research findings. Secondly, the amount of knowledge transfer is reflected indirectly based on the volume of knowledge transfer and spillover activities between the entities. Therefore, the amount of knowledge transferred cannot be accurate and objective. In future research, the types of knowledge transfer and spillover activities between enterprises in high-tech parks should be systematically counted. Through further interviews, it is necessary to identify whether enterprises have obtained innovation-related knowledge in knowledge activities and then determine whether to include the knowledge activities in the statistical scope. Finally, in terms of the benefit distribution mechanism, although the current research has considered key factors such as contribution level, resource input, knowledge spillover effect, effort level, and risk undertaking, more realistic influencing factors can still be incorporated to make the research conclusions more practical and guiding.
Author Contributions
Conceptualization, L.Q.; methodology, L.Q. and H.Z.; software, H.Z. and Y.L.; investigation, L.Q., H.Z. and Y.L; model, L.Q., H.Z. and Y.L; writing—original draft preparation, L.Q., Y.L. and H.Z.; writing—review and editing, L.Q. and H.Z. All authors have read and agreed to the published version of the manuscript.
Funding
This research received no external funding.
Institutional Review Board Statement
Not applicable.
Informed Consent Statement
Not applicable.
Data Availability Statement
The original contributions presented in this study are included in the article. Further inquiries can be directed to the corresponding author.
Acknowledgments
We express our gratitude to all the participants for their valuable cooperation in data collection for this study.
Conflicts of Interest
The authors declare no conflicts of interest.
References
- Wang, J.J.; Zhou, J. Establishment of National High-Tech Zones, Agglomeration of Innovation Factors, and Regional Innovation Performance. Stat. Decis. 2024, 40, 184–188. [Google Scholar]
- Liu, C. Core Carrier Cultivation of Regional Innovation-Driven Development—A Case of Guangdong Huizhou Zhongkai High-Tech Zone. Sci. Technol. Manag. Res. 2016, 36, 88–93+98. [Google Scholar]
- Ma, H.D.; Wu, J. Research on Enterprise Knowledge Innovation System Based on Regional Innovation Agglomeration. Sci. Technol. Prog. Policy 2012, 29, 161–164. [Google Scholar]
- Liu, W.; Xu, S.H. Literature Review on Collaborative Knowledge Innovation. J. Intell. 2009, 28, 131–134+163. [Google Scholar]
- Liu, J.B.; Li, C.M. Study on Interest Coordination Mechanisms of Enterprise Collaborative Knowledge Innovation. Sci. Technol. Prog. Policy 2011, 28, 83–87. [Google Scholar]
- Li, S.W.; You, Z.J. Impact of Knowledge Transfer on Innovative Capacity: Moderating Mediating Effects of Absorptive Capacity and Network Reliance. Sci. Technol. Manag. Res. 2020, 40, 17–24. [Google Scholar]
- Guo, T.; Xing, L.; Huang, Y. Study on the Influence of Knowledge Transfer of Innovation Network on Firm’s Innovation Performance—The Intermediary Role of Ambidextrous Innovation. Sci. Technol. Prog. Policy 2017, 34, 114–119. [Google Scholar]
- Wang, Y.J.; Liu, X.Q. Impact of Knowledge Spillover on Regional Innovation: An Analysis Based on Innovation Policies. Sci. Res. Manag. 2024, 45, 68–78. [Google Scholar]
- Monjon, S.; Waelbroeck, P. Assessing Spillovers from Universities to Firms: Evidence from French Firm-Level Data. Int. J. Ind. Organ. 2003, 21, 1255–1270. [Google Scholar] [CrossRef]
- Li, L.; Lan, T.; Zheng, L. Construction of the Innovation Network System Structure Model in High-Tech Zones and Analysis of Innovation Mechanisms. Soc. Sci. 2006, 62–65. Available online: https://kns.cnki.net/kcms2/article/abstract?v=IVqNFfq6ZnKWGKvMkF5OPniuz9tP0JJCq7w_2VQDGzZqmV9RN90rNYCa4FEmYVyhVoWFzZEwEz8kxszSWpIVrPLNKwbjWDvKoqWi1m2hjOGMIGbt38qg26gPqh4N8caNkTOYviNoBWdy10xE3oNJ5Fbjg1zeny2RrWVdkeq4AIxbEKH--F9qPw==&uniplatform=NZKPT&language=CHS (accessed on 20 April 2025).
- Chih, Y.-Y.; Zwikael, O.; Restubog, S.L.D. Enhancing Value Co-Creation in Professional Service Projects: The Roles of Professionals, Clients and Their Effective Interactions. Int. J. Proj. Manag. 2019, 37, 599–615. [Google Scholar] [CrossRef]
- Zhou, X.; Chi, L.; Li, J.; Xing, L.; Yang, L.; Wu, J.; Meng, H. A Study on Revenue Distribution of Chinese Agricultural E-Commerce Supply Chain Based on the Modified Shapley Value Method. Sustainability 2024, 16, 9023. [Google Scholar] [CrossRef]
- Yan, S.S. On the Connotations and Their Relationship of Knowledge Creation and Knowledge Innovation. Stud. Sci. Sci. 2010, 28, 1148–1152. [Google Scholar]
- Wang, L.; Qu, G.N.; Juan, R. An Analysis of the Knowledge Innovation Ecosystem to Handle the “Stranglehold” Challenges: The Core Challenges, Theory Construction and Realization Path. Sci. Res. Manag. 2022, 43, 94–102. [Google Scholar]
- Yang, Y.B.; Hu, H.H. Network Architecture and Knowledge Transfer. Sci. Sci. Manag. S.& T. 2008, 123–127. [Google Scholar]
- Wang, F.; Su, Q.; Zhang, Z. The Influence of Collaborative Innovation Network Characteristics on Firm Innovation Performance from the Perspective of Innovation Ecosystem. Kybernetes 2024, 53, 1281–1305. [Google Scholar] [CrossRef]
- Wang, X.; Wang, J.; Zhang, R. The Optimal Feasible Knowledge Transfer Path in a Knowledge Creation Driven Team. Data Knowl. Eng. 2019, 119, 105–122. [Google Scholar] [CrossRef]
- Audretsch, D.B.; Belitski, M.; Chowdhury, F. Knowledge Investment and Search for Innovation: Evidence from the Uk Firms. J. Technol. Transf. 2024, 49, 1387–1410. [Google Scholar] [CrossRef]
- Zheng, L.L.; Liu, D.S. Digital Economy, Knowledge Spillover and Enterprise Innovation. J. Stat. Inf. 2024, 39, 42–55. [Google Scholar]
- Hallin, C.; Holmström Lind, C. Revisiting the External Impact of Mncs: An Empirical Study of the Mechanisms Behind Knowledge Spillovers from Mnc Subsidiaries. Int. Bus. Rev. 2012, 21, 167–179. [Google Scholar] [CrossRef]
- Feng, S.H.; Liao, H.; Zhu, P.F. Spatial Knowledge Spillover Effect of Technology-Based Smes in the Yangtze River Delta. East China Econ. Manag. 2024, 38, 40–54. [Google Scholar]
- Feng, L.J.; Du, J.Y.; Wang, J.F.; Yue, J.J. The Evolution Path of Latecomer Firms’ Value Network from the Perspective of Disruptive Innovation. Stud. Sci. Sci. 2019, 38, 175–183. [Google Scholar]
- Allee, V. Reconfiguring the Value Network. J. Bus. Strategy 2000, 21, 36–39. [Google Scholar] [CrossRef]
- Allee, V. Value Network Analysis and Value Conversion of Tangible and Intangible Assets. J. Intellect. Cap. 2008, 9, 5–24. [Google Scholar] [CrossRef]
- Hong, J.; Chen, S.F. Analysis of Dynamic Game on Actors in Value Net. J. Ind. Eng. Eng. Manag. 2004, 127–130. Available online: https://kns.cnki.net/kcms2/article/abstract?v=_uHp55J8LtDl6pvyS33q1HlWb7CR2bdzU4lbGf1jvne1AHJcoyL7viz4Zuu8DGHa6GybTfbZb14Uk-Swboon0XGE8hLfaMeXS36becrzftnZa8XQ_I6f2PUoc6GamqN9rZsh1qP14vqtzzzugcjnKjzPWAAWqUtGoAuHqeez0nn76SqpGOdKBT6_qF40MBAI&uniplatform=NZKPT&language=CHS (accessed on 20 April 2025).
- Wang, Q. Business Model Innovation Based on the Reconfiguration of Value Network. China Ind. Econ. 2011, 79–88. [Google Scholar] [CrossRef]
- Lissillour, R.; Cui, Y.; Guesmi, K.; Chen, W.; Chen, Q. Value Network and Firm Performance: The Role of Knowledge Distance and Environmental Uncertainty. J. Knowl. Manag. 2024, 28, 44–68. [Google Scholar] [CrossRef]
- Xie, J.L.; Hu, S.H. Research on the ‘Dual-Four’ Structure and Element Correlations in the Innovation Networks of National High-Tech Zones. Mod. Manag. 2014, 45–47. [Google Scholar]
- Trunina, A.; Ashourizadeh, S. Business Model-Network Interactions: Comparative Case Studies from Zhongguancun and Silicon Valley. Technol. Soc. 2021, 65, 101600. [Google Scholar] [CrossRef]
- Ji, H.; Zou, H.; Liu, B. Research on Dynamic Optimization and Coordination Strategy of Value Co-Creation in Digital Innovation Ecosystems. Sustainability 2023, 15, 7616. [Google Scholar] [CrossRef]
- Liu, G.L.; Feng, L.C.; Liu, J. Research on Corporate Value Creation and Capture—Based on Value Networks. Study Explor. 2016, 124–127. [Google Scholar]
- Wang, S.X.; Zhang, M.Y.; Guo, Q. Value Network’s Evolution and Value Network Structure’s Upgrade of Enterprise. China Ind. Econ. 2014, 93–106. [Google Scholar]
- Meng, Y.K. Fundamentals and Applications of Queueing Theory; Tongji University Press: Shanghai, China, 1989. [Google Scholar]
- Lu, C.L. Queueing Theory; Beijing University of Posts and Telecommunications Press: Beijing, China, 1994. [Google Scholar]
- Xie, S.; Rieders, M.; Changolkar, S.; Bhattacharya, B.B.; Diaz, E.W.; Levy, M.Z.; Neyra, R.C. Enhancing Mass Vaccination Programs with Queueing Theory and Spatial Optimization. Front. Public Health 2024, 12, 1440673. [Google Scholar] [CrossRef] [PubMed]
- Erfaneh, G.; Sogand, S.G.; Amir, A.; Fariborz, J. A Novel Mathematical Optimization Model for a Preemptive Multi-Priority M/M/C Queueing System of Emergency Department’s Patients, a Real Case Study in Iran. IISE Trans. Healthc. Syst. Eng. 2022, 12, 305–321. [Google Scholar]
- Deepa, V.; Haridass, M. Simulation Analysis of a Base Station Using Finite Buffer M/G/1 Queueing System with Variant Sleeps. Methodol. Comput. Appl. Probab. 2023, 25, 80. Available online: https://kns.cnki.net/kcms2/article/abstract?v=IVqNFfq6ZnLKGRvkBiCTS0Waz7K2MRO_6uXEZHtquAThcbSCQX7vMSJYeCr59JFmKNDGHdpPAVenn-Z5YaM8IvSxxxSP9x0PF6W8F1XV6LOBVA589_Me4D2uhfn1KsziqGzC0p-T9N-K7kB4VdFSjY9gU8TOQOaeD1dcb3LJpn07CRUyagZPW_hshqBYwqvEtcVScImQgKsSdahCRfml6KLbixEh_rW5YvtEVw9l7ig=&uniplatform=NZKPT&language=CHS (accessed on 24 April 2025). [CrossRef]
- Makeeva, E.; Kochetkova, I.; Alkanhel, R. Retrial Queueing System for Analyzing Impact of Priority Ultra-Reliable Low-Latency Communication Transmission on Enhanced Mobile Broadband Quality of Service Degradation in 5g Networks. Mathematics 2023, 11, 3925. [Google Scholar] [CrossRef]
- Zhang, X.; Ahmed, R.R. A Queuing System for Inert Construction Waste Management on a Reverse Logistics Network. Autom. Constr. 2022, 137, 104221. [Google Scholar] [CrossRef]
- Hong, W.; Xu, Z.; Liu, W.; Wu, L.; Pu, X. Queuing Theory-Based Optimization Research on the Multi-Objective Transportation Problem of Fourth Party Logistics. Proc. Inst. Mech. Eng. Part B J. Eng. Manuf. 2021, 235, 1327–1337. [Google Scholar] [CrossRef]
- Elbaum, Y.; Novoselsky, A.; Kagan, E. A Queueing Model for Traffic Flow Control in the Road Intersection. Mathematics 2022, 10, 3997. [Google Scholar] [CrossRef]
- Dudin, A.N.; Dudina, O.S.; Dudin, S.A.; Kostyukova, O.I. Optimization of Road Design Via the Use of a Queueing Model with Transit and Local Users and Processor Sharing Discipline. Optimization 2022, 71, 3147–3164. [Google Scholar] [CrossRef]
- Jiang, X.H.; Wang, L.F.; Fan, X.Y. Benefit Distribution Mechanism of Cross-Organizationaltechnological Innovation Based on Cooperative Game. Sci. Technol. Manag. Res. 2021, 41, 185–198. [Google Scholar]
- Zhang, K.; Lu, H.; Wang, B. Benefit Distribution Mechanism of a Cooperative Alliance for Basin Water Resources from the Perspective of Cooperative Game Theory. Sustainability 2024, 16, 6729. [Google Scholar] [CrossRef]
- Wei, X.C.; Li, W.T. Research on Profit Distribution in Supply Chain Alliances Based on an Improved Shapley Value Method. Stat. Decis. 2010, 53–55. [Google Scholar]
- Yu, X.H.; Sun, H.X.; Shi, Y.D.; Zhou, H. Imputation of Industry-University-Institute Cooperationenterprises in the Fuzzy Expected Values. Oper. Res. Manag. Sci. 2016, 25, 258–263. [Google Scholar]
- Wu, S.Q. Profits Allocation of University-Industry-Science Partnership Based on Knowledge Supply Chain. Sci. Technol. Manag. Res. 2012, 32, 4–6+21. [Google Scholar]
- Li, C.; Cao, B.; Zhou, Y.-W.; Cheng, T.C.E. Pricing, Coalition Stability, and Profit Allocation in the Pull Assembly Supply Chains under Competition. OR Spectr. 2023, 45, 977–1011. [Google Scholar] [CrossRef]
- Timmer, J.; Borm, P.; Tijs, S. On Three Shapley-Like Solutions for Cooperative Games with Random Payoffs. Int. J. Games Theory 2004, 32, 595–613. [Google Scholar] [CrossRef]
- Alonso Pedrero, R.; Pisciella, P.; Crespo del Granado, P. Fair Investment Strategies in Large Energy Communities: A Scalable Shapley Value Approach. Energy 2024, 295, 131033. [Google Scholar] [CrossRef]
- Wang, Y.H.; Tian, P.Y.; Deng, B.C.; Rong, N.N. Benefit Distribution Model of “the Belt and Road”Ppp Project Based on Modified Interval Fuzzy Shapley Value. Oper. Res. Manag. Sci. 2021, 30, 168–175. [Google Scholar]
- Wang, X.F.; Wu, Y.L.; Huang, Y. Research on the Benefit Distribution of Dynamic Alliance Enterprisemobile Payment Business Model Based on Cooperative Game. Oper. Res. Manag. Sci. 2017, 26, 29–38. [Google Scholar]
- Zhou, H.H.; Bao, H.L. Research on the Profit Distribution among Technological Innovation Alliance Based on Improved Shapley Value. Sci. Technol. Manag. Res. 2012, 32, 109–112. [Google Scholar]
- Ye, J.F.; Li, Z.F. Study on Determinants of Knowledge Innovation Capacity in Industrial Clusters. Stud. Sci. Sci. 2006, 624–628. [Google Scholar]
- Yu, D.H.; Rui, M.J. Study on the Knowledge Flowing Based on the Modular Network Organizations. Nankai Bus. Rev. 2007, 11–16+28. [Google Scholar]
- Pan, X.; Song, M.L.; Zhang, J.; Zhou, G. Innovation Network, Technological Learning and Innovation Performance of High-Tech Cluster Enterprises. J. Knowl. Manag. 2019, 23, 1729–1746. [Google Scholar] [CrossRef]
- Vătămănescu, E.-M.; Mitan, A.; Andrei, A.G.; Ghigiu, A.M. Linking Coopetition Benefits and Innovative Performance within Small and Medium-Sized Enterprises Networks: A Strategic Approach on Knowledge Sharing and Direct Collaboration. Kybernetes 2022, 51, 2193–2214. [Google Scholar] [CrossRef]
- Ramaswamy, V.; Gouillart, F. Building the Co-Creative Enterprise. Harv. Bus. Rev. 2010, 88, 100–109. [Google Scholar]
- Prahalad, C.K.; Ramaswamy, V. Co-Creation Experiences: The Next Practice in Value Creation. J. Interact. Mark. 2004, 18, 5–14. [Google Scholar] [CrossRef]
- Meng, Q.M.; Mei, Q. Research on the Interaction and Innovation Mechanism between Technology Service Industries and Manufacturing Enterprises: A Perspective of Knowledge Transfer and Innovation. Sci. Technol. Prog. Policy 2011, 28, 72–74. [Google Scholar]
- Hong, Y.; Li, Q. The Mechanism of Knowledge Transfer Based on Actors’ Multidimensional Interaction in Industry-University-Research Institute Cooperation. Stud. Sci. Sci. 2018, 36, 857–867. [Google Scholar]
- Kong, Q.; Li, R.; Peng, D.; Wong, Z. High-Technology Development Zones and Innovation in Knowledge-Intensive Service Firms: Evidence from Chinese a-Share Listed Firms. Int. Rev. Financ. Anal. 2021, 78, 101883. [Google Scholar] [CrossRef]
- Zhang, G.A. A Mode Study on Fusion Effect in the Development of High-Tech Park in China. China Soft Sci. 2009, 176–186. [Google Scholar]
- Sun, Q.; Liu, J.J. Coupling Mechanism and Empirical Analysis of National High-Tech Zones and High-Tech Industries. Forum Sci. Technol. China 2024, 97–108. [Google Scholar]
- Ibidunni, A.S. Cross-Border Knowledge Transfer and the Innovation Performance of Developing Economy Small and Medium Enterprises: A Moderated Mediation Effect of Industry Networks and Localization of Knowledge. Technol. Forecast. Soc. Change 2024, 208, 123702. [Google Scholar] [CrossRef]
- Zhang, Q.; Liu, R.J.; Yang, J.Y. Analysis of Factors Affecting Knowledge Transfer Performance. Stud. Sci. Sci. 2019, 37, 311–319. [Google Scholar]
- Fang, Y.T.; Wang, Z.L. Analysis of the Influence Factors of Knowledge Transfer in Enterprise from the Perspective of “Dual Circulation”. Sci. Technol. Manag. Res. 2022, 42, 151–157. [Google Scholar]
- Swap, W.; Leonard, D.; Shields, M.; Abrams, L. Using Mentoring and Storytelling to Transfer Knowledge in the Workplace. J. Manag. Inf. Syst. 2001, 18, 95–114. [Google Scholar] [CrossRef]
- Ruan, P.N.; Luan, M.X.; Wei, Y.F.; Liu, X.Y. The Influencing Factors of Knowledge Transfer in Innovation Network: A Meta-Analysis. Sci. Technol. Prog. Policy 2019, 36, 7–14. [Google Scholar]
- Jia, Y.; Zhang, Z.G.; Xu, T. Improving the Performance of Mmpp/M/C Queue by Convex Optimization–a Real-World Application in Iron and Steel Industry. IEEE Access 2020, 8, 185909–185918. [Google Scholar] [CrossRef]
- Zhang, Z.S.; Gao, P. A Study on Cooperative Innovation and Benefit Distribution Mechanism of Science and Technology Finance Ecosystem. Macroeconomics 2019, 9, 47–57+66. [Google Scholar]
- Zhang, B.S.; Zhang, Q.P. Research on Profit Allocation Mechanism of Members’ Knowledge Cooperation in Tacit Knowledge Flow Network. Chin. J. Manag. Sci. 2016, 24, 87–92. [Google Scholar]
- Yue, Y.C.; Huo, G.Q. Research on the Interest Conflicts and Game between the Stakeholders of Innovation Consortium. Stud. Sci. Sci. 2024, 42, 1088–1097+1120. [Google Scholar]
- Jiang, X.; Wang, L.; Cao, B.; Fan, X. Benefit Distribution and Stability Analysis of Enterprises’ Technological Innovation Cooperation Alliance. Comput. Ind. Eng. 2021, 161, 107637. [Google Scholar] [CrossRef]
- Zhang, Z.H.; Li, R.Z.; Zhao, B. Research on Benefit Distribution Mechanism of the Collaborative Innovation Center under the Multi-Body Participation—A View of Collaborative Innovation Center under the Dominance of Colleges and Universities. Sci. Technol. Prog. Policy 2016, 33, 25–29. [Google Scholar]
- Lian, J.W. Research on Innovation Spillover of Enterprise Research Institutes Embedded in High-Tech Zone Innovation Network—A Case Study of Xinchang High-Tech Industrial Park. Sci. Technol. Prog. Policy 2016, 33, 8–13. [Google Scholar]
- Liu, J.T.; Ning, L.J.; Gao, Q.F. Digital Innovation Ecosystem: Connotation, Characteristics and Operating Mechanism. Sci. Technol. Manag. Res. 2023, 43, 13–22. [Google Scholar]
- Sun, W.D. Research on the Construction of Innovation Ecosystem, Value Co-Creation and Governance of Technology-Based Small and Medium-Sized Enterprises in Science and Technology Park. Contemp. Econ. Manag. 2021, 43, 14–22. [Google Scholar]
Disclaimer/Publisher’s Note: The statements, opinions and data contained in all publications are solely those of the individual author(s) and contributor(s) and not of MDPI and/or the editor(s). MDPI and/or the editor(s) disclaim responsibility for any injury to people or property resulting from any ideas, methods, instructions or products referred to in the content. |
© 2025 by the authors. Licensee MDPI, Basel, Switzerland. This article is an open access article distributed under the terms and conditions of the Creative Commons Attribution (CC BY) license (https://creativecommons.org/licenses/by/4.0/).