Article

A Material Flow Analysis of Electric Vehicle Lithium-ion Batteries: Sustainable Supply Chain Management Strategies

1
Resource Recirculation Research Division, National Institute of Environmental Research, Incheon 22689, Republic of Korea
2
Emerging Waste to Resource Research Division, National Institute of Environmental Research, Incheon 22689, Republic of Korea
3
Program in Circular Economy Environmental System, Graduate School, Inha University, Incheon 22212, Republic of Korea
*
Author to whom correspondence should be addressed.
Sustainability 2025, 17(10), 4560; https://doi.org/10.3390/su17104560
Submission received: 8 April 2025 / Revised: 7 May 2025 / Accepted: 8 May 2025 / Published: 16 May 2025

Abstract

:
The increasing adoption of electric vehicles (EVs) has highlighted the need for sustainable lithium-ion battery (LIB) management. This study presents a material flow analysis (MFA) of EV LIBs in the Republic of Korea (RoK), using both a mass-based MFA and a substance flow analysis (SFA). The analysis defines 33 systems and 170 flows across the manufacturing, consumption, discharge and collection, and treatment stages, based on national statistics and data from 11 commercial facilities. In 2022, about 72,446 t of EV LIBs entered the consumption stage through new vehicle sales and battery replacements. However, domestic recovery was limited, as approximately 76.5% of used EVs were exported, reducing the volume of batteries available for recycling. The SFA, focusing on nickel (Ni), cobalt (Co), manganese (Mn), and lithium (Li), showed recovery rates of 69% for Ni, 80% for Co, 1% for Mn, and 80% for Li. Mn was not recovered because its low market price made the recovery process economically impractical. Additional losses occurred from the incineration of separators containing black mass and lithium discharged through wastewater. These findings offer data-driven insights to improve recovery efficiency, guide policy, and enhance the circularity of EV LIB management in the RoK.

1. Introduction

The global transportation sector is heavily dependent on fossil fuels, such as diesel and gasoline, and the resultant carbon emissions are the main contributors to climate change [1,2]. Accordingly, various policies and technologies have been applied to reduce fossil fuel consumption and carbon emissions globally, and electric vehicles (EVs) have been highlighted as promising alternatives to respond to climate change issues [3].
As EVs have become widely supplied, their battery demand has rapidly increased. Specifically, the global EV battery demand has risen more than tenfold, from approximately 50 GWh in 2016 to approximately 550 GWh in 2022 [4], and is expected to reach a maximum of 5400 GWh by 2030 [5]. The batteries used for EVs are mainly lithium-ion batteries (LIB), which include precious metals such as lithium (Li), nickel (Ni), cobalt (Co), and manganese (Mn). However, supply chain instability has become a major issue because the supply chains for these metals are concentrated in certain countries [6]. For instance, approximately 69% of the global supply of Co is produced in the Democratic Republic of Congo, and 80% of the Li is produced in Australia and Chile [7]. This centralization of resource supply chains results in price volatility and political risk, and effective resource management and recycling strategies are pivotal for the sustainable use of EV LIBs [8].
Material flow analysis (MFA) has been widely applied as an important analytical tool to ensure the sustainable management of EV LIBs. MFA helps utilize resources efficiently and minimizes environmental impacts by quantitatively tracking the pathways of materials within a system (e.g., resources, products, and waste) [9]. MFA plays an important role in identifying material flows throughout the life cycle of EV LIBs and provides essential data for the development of recycling and resource recovery strategies, as well as environmental and policy impact assessments [10,11,12].
According to the International Energy Agency (IEA), the global battery recycling capacity by 2030 is expected to be dominated by China (75%), followed by the United States (10%), the European Union (5%), the Republic of Korea (RoK, 5%), and other countries (5%) [13,14]. Although geographically small, the RoK plays a significant role in the global electric vehicle lithium-ion battery (EV LIB) supply chain [15]. It is a major producer of battery cells, cathode materials, and precursors, and is also emerging as a key hub for recycling infrastructure [4].
However, most existing material flow analyses (MFAs) have focused on China, the United States, and Europe [16,17]. Existing studies provide limited insight into the RoK’s unique context, particularly in terms of policies, collection systems, and processing infrastructure. In addition, most previous MFAs focus solely on the end-of-life (EoL) stage and often overlook substantial manufacturing-phase waste, including defective cells, cathode scraps, and rejected modules [16,17,18].
To address these gaps, this study presents a comprehensive life-cycle MFA of EV LIBs in the RoK. The analysis covers the stages of manufacturing, consumption, discharge, and treatment. It also incorporates waste generated during battery production and evaluates both the recovery efficiency and utilization rates of recycled products, focusing on key valuable metals such as Ni, Co, Mn, and Li. Based on primary industrial data and national statistics, this study supports policy development and contributes to international strategies for sustainable battery resource management.

2. Materials and Methods

2.1. Material Flow Analysis (MFA) Method

2.1.1. Target Items and Scope

The initial target materials for the MFA conducted in this study included the waste generated in manufacturing facilities, such as waste cells and waste cathode materials, as well as EV LIBs. EV LIBs encompass both LIBs assembled on EVs and individual unassembled LIBs. These initial target materials undergo various transformations during treatment, interact with auxiliary materials, such as water and chemicals, and eventually produce recycled products, waste, and wastewater. Thus, in this study, the flows of the initial target materials were analyzed, and the flows of auxiliary material input for the treatment and the generated outputs were analyzed. The spatiotemporal scope of this study was limited to the RoK for 2022.
Unlike previous studies, this study explicitly includes the waste generated during the manufacturing phase to increase the completeness of the analysis. This comprehensive approach enables the holistic evaluation of the resource consumption and environmental impacts associated with the entire life cycle of EV LIBs.

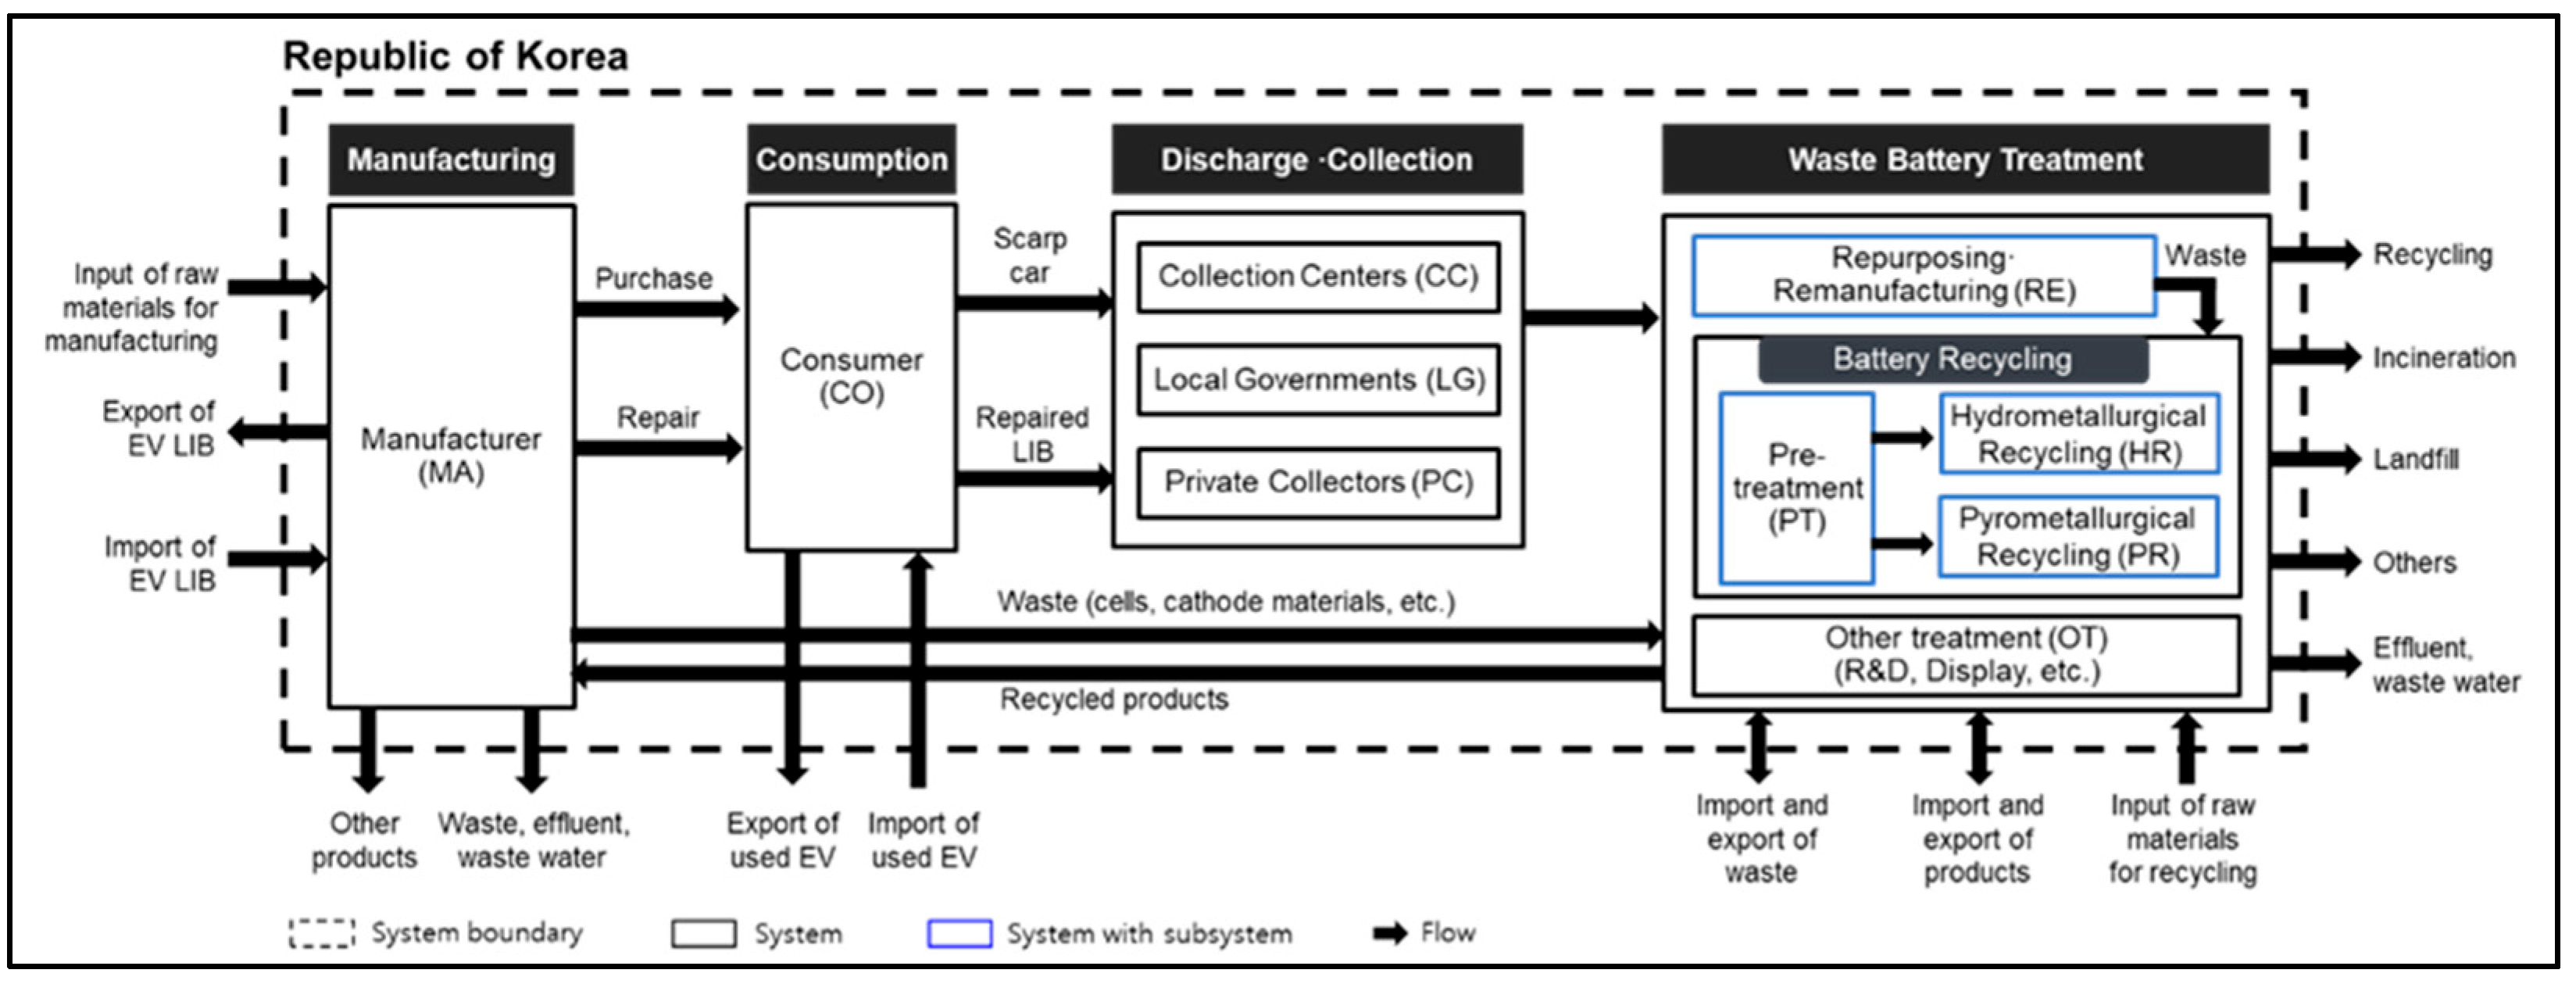
2.1.2. System Boundary

The system boundary of the MFA encompasses four main phases in the RoK, as shown in Figure 1: manufacturing, consumption, discharge and collection, and treatment. The manufacturing phase includes all secondary battery manufacturers, EV importers, and sellers except for lead acid battery manufacturers. The consumption phase encompasses EV purchases and EV LIB repairs owing to malfunctions. In the discharge and collection phase, agencies such as central collection centers (CC), local governments (LG), and private collectors (PC) perform activities such as the collection, storage, performance evaluation, and sale of EV LIBs. The treatment phases are divided into repurposing/remanufacturing (RE), pretreatment (PT), hydrometallurgical recycling (HR), pyro-metallurgical recycling (PR), and other treatments (OT). RE, PT, and HR include subsystems for the detailed treatment phase. The scope of OT refers to EV LIBs used for exhibition and research purposes.
Since this study focused on the physical and chemical conversion of EV LIBs, systems that did not affect the material properties, such as EV dismantling facilities, were excluded. In this study, 33 systems and 170 flows were defined, and the corresponding details are described in Supporting Information (SI) Section S1.

2.1.3. Quantification Method for Material Flow

The recovery rates of valuable metals in a given system were evaluated using Equation (1).
R m = i r e c o v e r y ( C m , i × F i ) i i n p u t ( C m , i × F i ) × 100 ( % )
where R m is the recovery rate of valuable metal m (%); i represents each individual flow, r e c o v e r e d refers to the set of flows resulting in recovered materials from the system; i n p u t refers to the set of input flows into the system; C m , i is the concentration (wt.%) of valuable metal m in flow i ; and F i is the total mass of flow i .
To avoid duplicate calculations, the input of the entire treatment process was calculated using the amount of initial target waste that was newly input. For example, crushed materials recovered from the pretreatment process, such as black mass moving to a hydrometallurgical recycling process, were excluded from the new inputs.
The MFA was conducted using STAN software (version 2.7, TU Wien, Vienna, Austria), which adopts a static modeling approach. This software allows for consistent material balance calculations while accounting for uncertainty in flow data [19]. In this study, uncertainty was quantified through Gaussian error propagation implemented in STAN, with standard deviations assigned to each flow based on available data sources.
The main sources of uncertainty included differences in operational conditions across facilities, time lags in data reporting, reliance on secondary national statistics for certain flows, and conservative assumptions applied where direct data were unavailable. These components were systematically incorporated into the model to ensure coherence and transparency in the interpretation of material flow results.

2.2. Data Collection and Assumptions

2.2.1. Data Collection Method

The data for the MFA encompass survey data on EV LIB treatment facilities, data from the sampling and analysis of input and output materials, statistical data related to manufacturing, consumption, discharge and collection, treatments associated with EV LIBs, and data from previous studies. The data collected for the MFA were categorized into primary data (directly collected data) and secondary data (data from the literature and statistical data) based on their sources and reliability. The list of data used for the MFA per cycle stage is presented in Table 1.
Primary data were collected directly from EV LIB treatment sites in the RoK from July to November 2024 through a survey and analysis of the collected samples. The survey included the facility’s status, treatment capacity, waste inputs and outputs, recycled product outputs, additive inputs, and difficulties. Of the 15 EV LIB treatment facilities nationwide, the 11 participating facilities represented approximately 90% of the national reuse and remanufacturing volume, 58% of the pretreatment volume, and 61% of the hydrometallurgical recycling volume, ensuring that the data are representative at the national scale.
Secondary data were obtained from previous studies, government reports, and industry statistics, and the most recent data were prioritized to quantify flows within the system boundary.

2.2.2. Analysis Items and Methods

The analysis items in the SFA were Ni, Co, Mn, and Li, and 34 samples were collected from 11 waste treatment facilities across the RoK for quantitative analysis. The Ni in the waste was analyzed using inductively coupled plasma optical emission spectroscopy (ICP-OES, PerkinElmer, Waltham, MA, USA) according to the YS/T 1342.1 [39] analysis method. The Co in the waste was analyzed using flame atomic absorption spectrometry (FAAS, PerkinElmer, Waltham, MA, USA) according to the YS/T 1342.2 [40] analysis method. The contents of Mn and Ni in the waste were analyzed using YS/T 1229.3 [41]. The contents of Ni and Mn in the wastewater were analyzed using FAAS according to ES 04400.1e [42], and those of Co and Li were analyzed using ICP-OES according to the ISO 11885:2007 [43] analysis method.
All analyses were performed in triplicate under identical conditions, and the average values were calculated with standard deviations reported for the reliability of the results. A list of the collected samples and the analysis results can be found in SI Section S3.

2.2.3. Assumptions

The MFA was performed based on extensive data ranging from the manufacturing to the treatment of EV LIBs. However, because it is difficult to directly quantify some material flows, reasonable assumptions, which are explicitly described in Section S4, were applied.

3. Results and Discussion

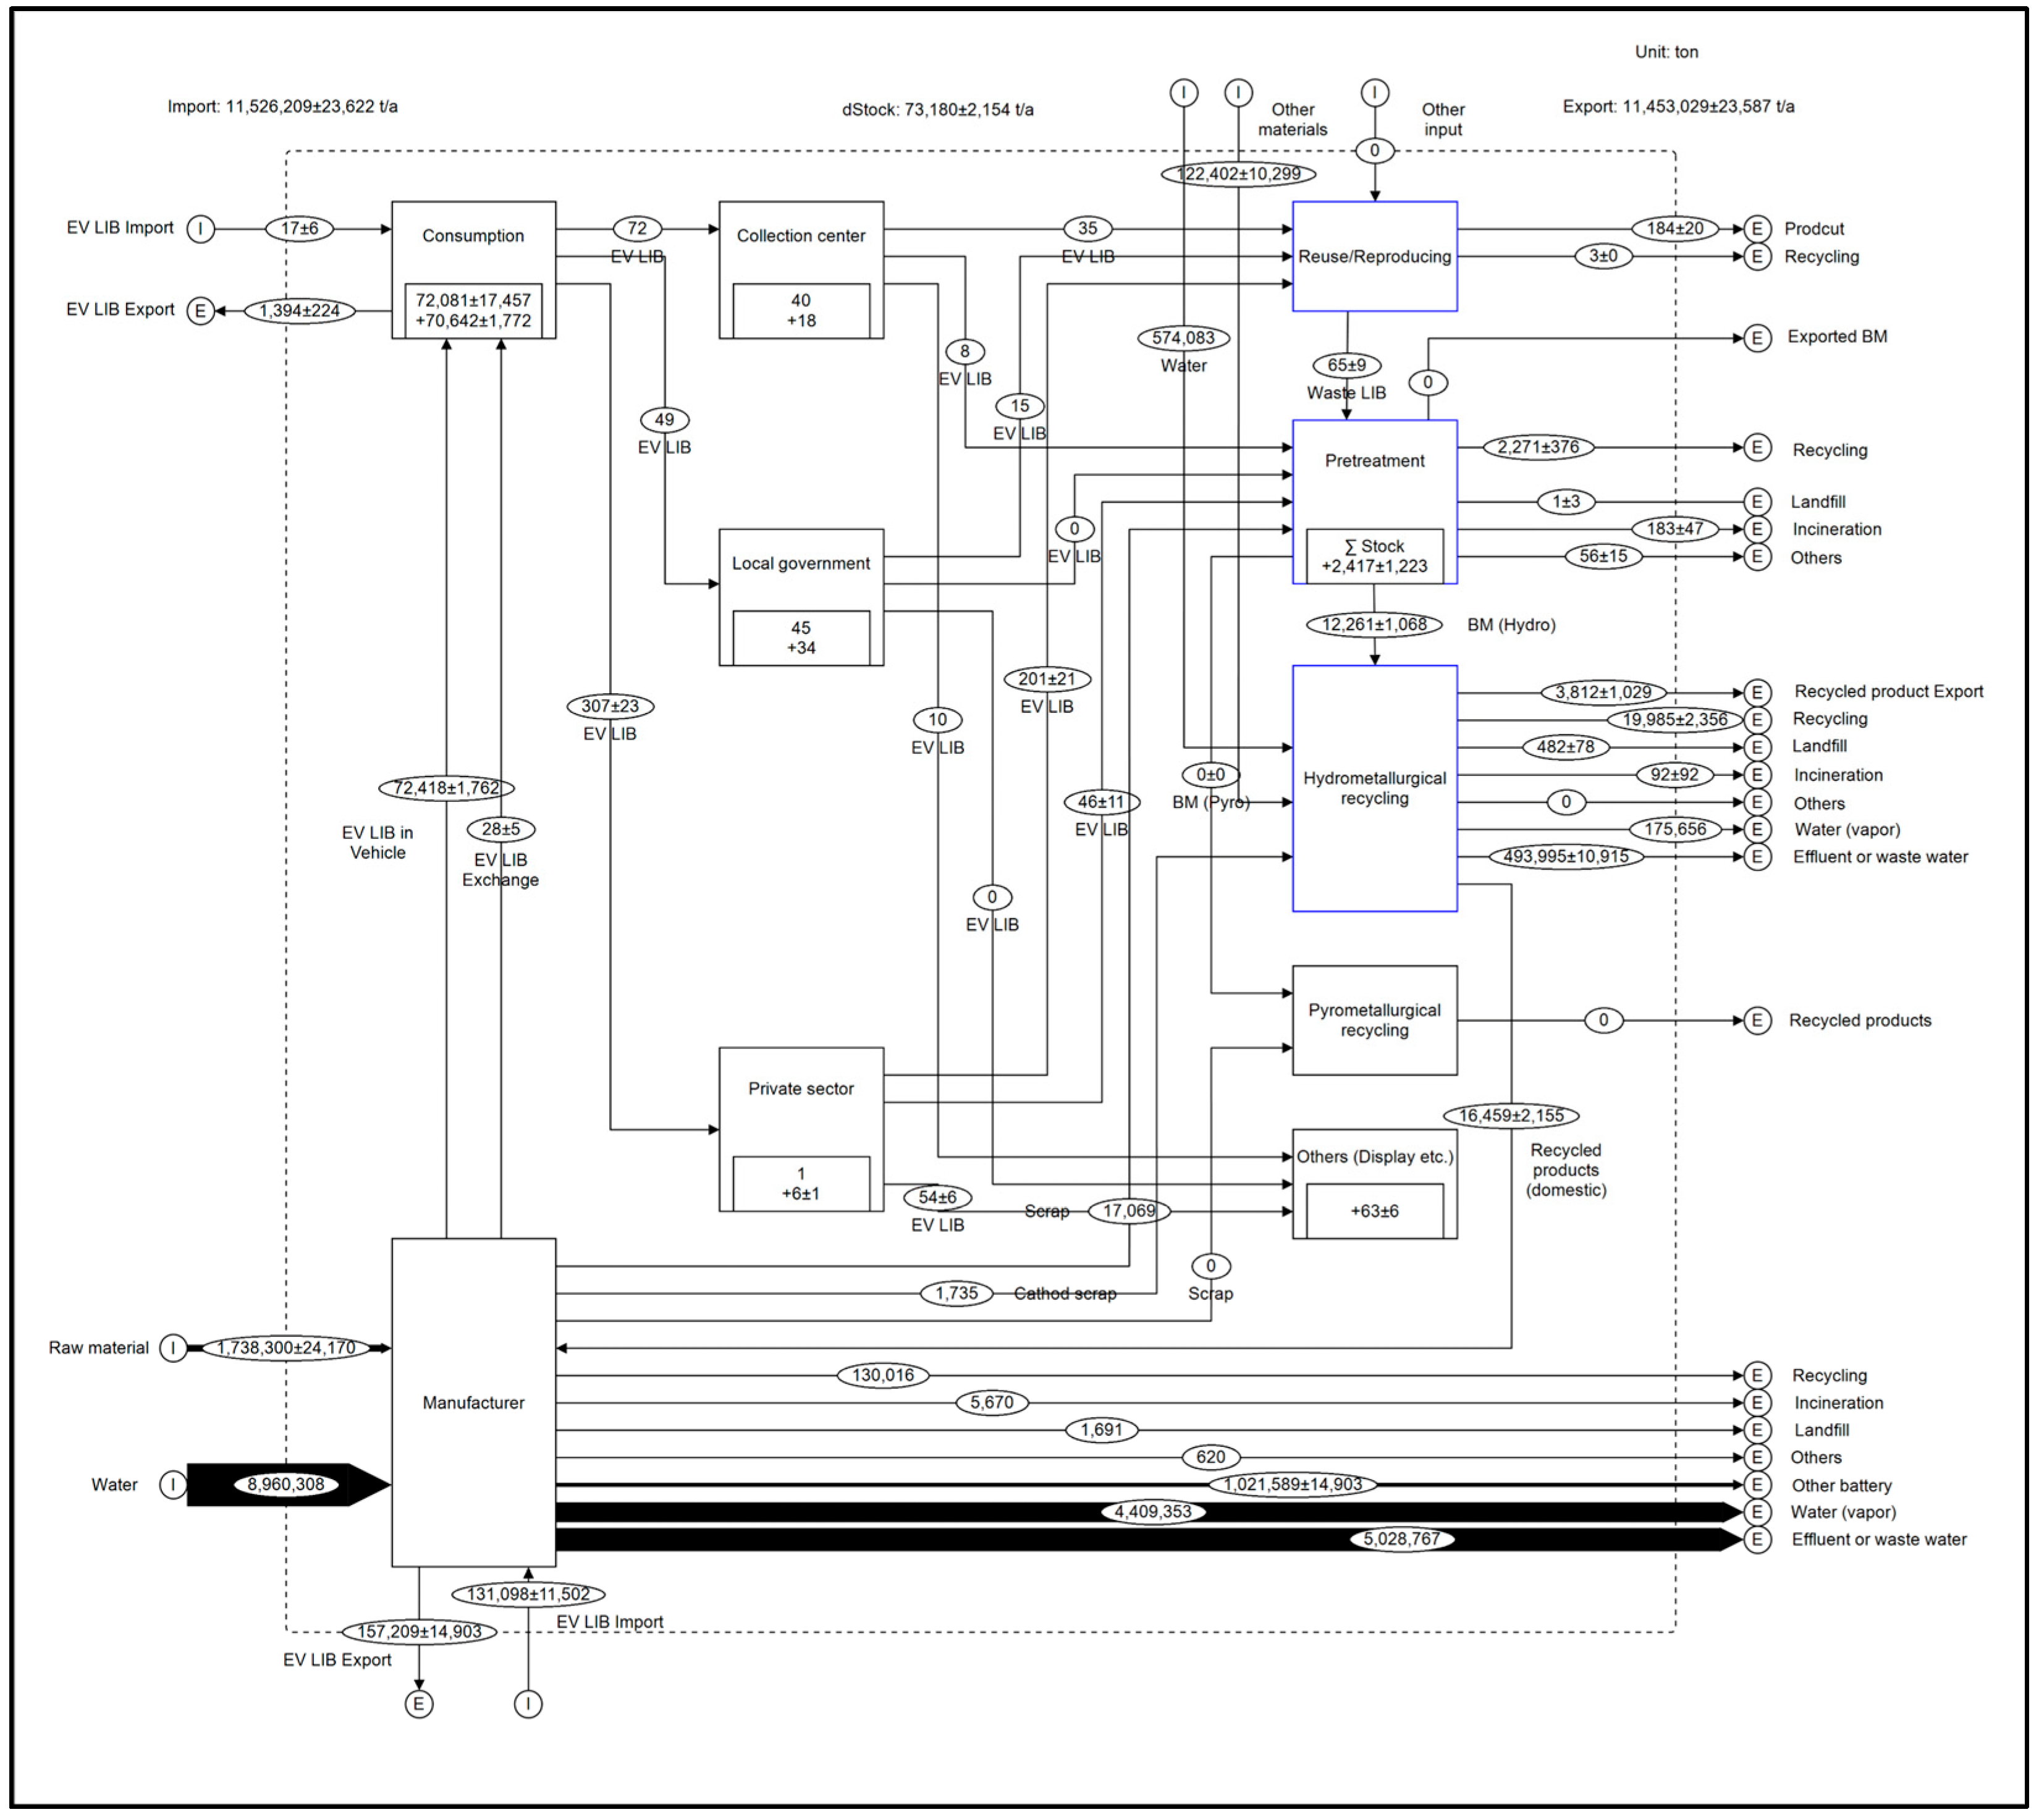
3.1. Mass-Based Material Flow Analysis for Electric Vehicle Lithium-ion Batteries

Figure 2 shows the results of the mass-based MFA, showing the entire process from the manufacturing to the treatment of EV LIBs in the RoK. As of 2022, the total input into the system is 11,526 kt, the total output is 11,453 kt, and the total accumulation amount is 73 kt.

3.1.1. Manufacturing Stage

As of 2022, the total volume of LIBs manufactured in MP in the RoK was analyzed to be 1120 ± 43 kt, of which EV LIBs were assessed to be 99 ± 28 kt. The volumes of EV LIBs imported and exported to the RoK were 131 ± 12 kt and 157 ± 15 kt, respectively. The volumes of imported and exported EV LIBs were 99 kt and 64 kt, respectively. The volumes of EV LIBs imported and exported as part of completed vehicles were assessed to be 32 ± 12 kt and 93 ± 15 kt, respectively. These findings indicate that the RoK plays a major role as a battery producer in the EV LIB supply chain and as an exporter of completed vehicles that utilize imported EV LIBs.
In addition to its role as a key manufacturing and trade hub, the RoK also generates a significant amount of waste during the battery production process. In 2022, more than 18,800 t of waste, including defective cathode materials and waste cells, were generated at secondary battery manufacturing facilities. Unlike previous MFA studies, such as those by Bruno and Fiore (2023) and Shafique et al. (2023), which primarily focused on end-of-life batteries, this study includes waste from the production phase within the analytical scope [17,44]. By addressing upstream material losses, the analysis provides a more comprehensive view of resource inefficiencies and offers deeper insight into the structural challenges facing the circularity of EV LIBs.

3.1.2. Consumption Stage

As of 2022, the number of EV LIBs input into the consumption system due to the sale of EVs and the repair of EV LIBs was 72,446 ± 1790 t. Among them, lithium iron phosphate (LFP) batteries accounted for approximately 12.7% (8962 ± 28 t), and nickel cobalt manganese (NCM) or nickel cobalt aluminum (NCA) batteries accounted for the remaining 87.3%. Although LFP batteries are not manufactured in the RoK, the increased collection of Tesla vehicles with LFP batteries has contributed to the higher share of LFP batteries in the RoK. Considering that the average consumption lifetime of EV LIBs is 10–12 years, most LFP batteries remain in the consumption phase and will be discharged as waste in the future [45]. The volume of EV LIBs discharged from the consumption phase was found to be 1822 t, of which approximately 76.5% were exported to other countries as used vehicles and were not collected in the RoK. Such factors hinder battery recycling and resource recovery opportunities in the RoK and undermine the stability of the battery supply chain.
In this context, it is important to note that this study estimates the average consumption lifespan of EV LIBs based on empirical deregistration and battery replacement data in Korea. This contrasts with previous studies that rely on dynamic MFA frameworks and assumed lifespan distributions. For instance, Shafique et al. (2022) and Kamran et al. (2022) applied Weibull distributions with theoretical shape and scale parameters to project retirement flows over time [16,46]. While dynamic models are useful for long-term scenario analyses, they are often sensitive to parameter assumptions and lack alignment with actual failure data. Similarly, Bruno and Fiore (2023) assumed fixed 10-year lifespans without verification against observed usage patterns in the EU [17].
By contrast, the static MFA applied in this study reflects the real-world conditions of battery usage in the RoK. Although this approach does not capture long-term uncertainty, it improves the accuracy of end-of-life flow quantification in the reference year. As a result, it provides a reliable baseline for evaluating the current recycling capacity, identifying policy gaps, and designing short-term intervention strategies.

3.1.3. Discharge Collection Stage

As of 2022, EV LIBs discharged from the consumption phase will be collected by CCs, LGs, and PCs, with a total collection volume of 428 t. Among these, 58 t were stored in CCs and LGs and were not effectively treated, resulting in a cumulative storage volume of 288 t by 2022.
The stored EV LIBs were found to be relatively lighter than those sent for treatment. According to CC data, the average weight of EV LIBs sold for treatment was 324 kg, whereas the average weight of the stored EV LIBs was 237 kg (See SI Section S5 for detailed data). In general, lighter EV LIBs may be less attractive for market transactions because of their lower energy storage capacity, and smaller EV LIBs may face difficulties in market distribution.
Of the 428 t of collected EV LIBs, 370 t of EV LIBs were transferred for the treatment phase, of which 68% went to repurposing and remanufacturing processes. For repurposing and remanufacturing, EV LIBs must be safely certified, with a certification cost of approximately USD 450 per pack. EV LIBs with large capacities have lower certification costs than those with small capacities. Therefore, economic incentives are required to promote the repurposing and remanufacturing of small EV LIBs.

3.1.4. Treatment Stage

In the RoK, EV LIBs and waste generated during manufacturing are treated through repurposing, remanufacturing, pretreatment, and hydrometallurgical recycling processes. The MFA results for the treatment stages can be found in Figure 3. In 2022, there was no commercial-scale dry recycling process operating in the RoK.

Mass-Based MFA: Repurposing and Remanufacturing Process

The MFA results of the repurposing and remanufacturing processes are shown in Figure 3a. Approximately 26% of the 201 t of EV LIBs introduced into the process were excluded because they did not meet the criteria for repurposing and remanufacturing. This is mainly due to a design limitation in which the failure of a single cell results in the disposal of the entire module.
Waste hierarchy prioritizes reduction, reuse, recycling, energy recovery, and disposal. As repurposing and remanufacturing, which are equivalent to reuse, have less environmental impact than recycling, they should be prioritized in waste management. Therefore, technological improvements are required to reduce the waste generated during repurposing and remanufacturing.

Mass-Based MFA: Pretreatment Process

The pretreatment process serves two main purposes: to recover electrical components, such as battery management systems (BMSs), aluminum, copper, and black mass, and to remove interfering substances, such as electrolytes, to increase the recovery of valuable metals in hydrometallurgical recycling. To this end, the pretreatment process consisted of detailed processes such as electrical discharge, dismantling, crushing, heat treatment, and sorting/separation, as shown in Figure 3b.
As of 2022, the total volume of material input in the pretreatment process was 17,188 t, of which 99% was determined to be waste (e.g., waste cathode materials or waste cells) generated by secondary battery manufacturers, not EV LIBs. This implies that the number of EV LIBs disposed of after use is limited, despite the rapid growth of the EV market.
Pretreatment companies have pointed out that dismantling is a major challenge. As the design of EV LIBs has become more complicated and diverse, their compatibility with previous dismantling methods has decreased, requiring more time and higher costs. For example, the latest battery designs, such as Tesla’s 4680 cylindrical cells, BYD’s blade battery packs, and CATL’s cell-to-pack technology, improve safety and space efficiency. However, they also make it difficult to automate and standardize the dismantling process, which contributes to longer times and higher costs for dismantling [47].
EV LIBs contain electrolytes such as propylene carbonate, dimethyl carbonate, and ethylene carbonate [48,49]. The flammability of these materials presents a fire hazard during the pretreatment process and can hinder material recovery during hydrometallurgical recycling [50]. During the heat treatment (300–400 °C), the electrolyte and binder are volatilized and decomposed. The generated gases are adsorbed by activated carbon or captured by scrubbers, producing 2268 t of electrolyte and binder byproducts. These byproducts generate large quantities of waste-activated carbon or wastewater that cannot be effectively recovered or reused, leading to potential resource losses. Therefore, it is essential to develop resource recovery strategies for these materials.

Mass-Based MFA: Hydrometallurgical Recycling Process

In the hydrometallurgical recycling process, there is no standardized process owing to the unique technology applied by the operator; however, the MFA results based on the commonalities of the three surveyed facilities are shown in Figure 3c.
As of 2022, it will be possible to recover Ni, Co, Mn, and Li from previous hydrometallurgical recycling processes; however, Mn will not be recovered. This is because the prices of Ni, Co, Mn, and Li in 2022 are 25,604 USD/ton, 63,598 USD/ton, 1563 USD/ton, and 69,169 USD/ton, respectively, indicating that the price of Mn is lower than that of other minerals [51].
As of 2022, the main chemical inputs in the hydrometallurgical recycling process were analyzed as sodium hydroxide (3.96 ± 0.93 t 30% NaOH/ton input waste), and sulfuric acid (3.69 ± 0.79 t 70% H2SO4/ton input waste). Notably, sulfuric acid is overconsumed during the leaching stage. A minimum of 2.0 kg of sulfuric acid is required to dissolve 1 kg of input waste [52], and 2.55 ± 0.52 kg of sulfuric acid was consumed in the leaching process evaluated in this study, showing an excessive usage of approximately 20%.
The excessive usage of chemicals not only increases operating costs but also generates additional environmental burdens, such as hazardous waste and wastewater discharge. It is essential to develop optimized process conditions for hydrometallurgical recycling to increase resource efficiency and minimize environmental impact.

3.2. Substance Flow Analysis for Electric Vehicle Lithium-ion Batteries

This section presents the results of a substance flow analysis (SFA) focusing on two key aspects: (1) the recovery rates of valuable metals (Ni, Co, Mn, and Li) across different treatment processes, and (2) the extent to which recycled products are reintegrated into the manufacturing of EV LIBs in the RoK. The findings provide insights into both the efficiency of current recycling practices and the degree of circularity achieved within the domestic EV LIB supply chain.

3.2.1. Substance Flow Analysis of Recovery Rates During the Treatment Process

Table 2 presents the recovery rates of valuable metals per treatment process according to the SFA. The rates were 69% for Ni, 80% for Co, 1% for Mn, and 80% for Li (See SI Section S6 for the SFA results of each valuable metal). The recovery rates for the three key treatment processes—repurposing and remanufacturing, pretreatment, and hydrometallurgical recycling—were analyzed separately, and limitations and improvements were discussed.

SFA: Repurposing and Remanufacturing Process

The recovery rates of valuable metals (Ni, Co, Mn, and Li) in the repurposing and remanufacturing processes were determined to be approximately 70%. The main factor limiting the recovery rate in this process is the structural design of EV LIBs; if one cell in the module fails, the entire module must be discarded as discussed earlier in the treatment stage (see Section 3.1.4). Thus, an improvement in the EV LIB design and optimization of the dismantling method are crucial for achieving a higher recovery rate of valuable metals in this process.

SFA: Pretreatment Process

The recovery rate of the valuable metals (Ni, Co, Mn, and Li) in the pretreatment process was approximately 99%, implying that the materials were retained at a relatively high level. The pretreatment process effectively transfers the majority of valuable metals to hydrometallurgical recycling, but 30–40% of the valuable metals in the secondary waste generated in the pretreatment process are incinerated, which triggers a resource loss problem. The primary secondary wastes generated during the pretreatment process include copper, aluminum, plastics, and electrical parts. The separator contained a large black mass enriched with valuable metals. The contents of Ni, Co, Mn, and Li in the separator were found to be 6.1 ± 5.1%, 0.7 ± 0.1%, 0.6 ± 0.4%, and 1.4 ± 0.2%, respectively; it was analyzed that more than 90% of the incinerated valuable metals originated from the separator (see SI Section S3). Therefore, it is important to develop technologies that can effectively sort black masses using separators.

SFA: Hydrometallurgical Recycling Process

The recovery rates of Ni, Co, and Li from hydrometallurgical recycling were approximately 70%, 80%, and 80%, respectively, while Mn was not recovered. As shown in Figure 4, these commercial-scale results are significantly lower than the recovery rates reported in laboratory and pilot-scale studies, which often exceed 90% under controlled conditions [53,54,55,56,57]. This discrepancy reflects key differences between experimental and industrial settings, such as variability in waste composition, the presence of impurities, and limited process control. In particular, impurities such as aluminum (Al), iron (Fe), and copper (Cu), which originate from current collectors and casings, interfere with the selective separation of valuable metals and reduce the overall recovery rate [58,59,60].
Mn was not recovered because its low market value makes extraction economically unfeasible in commercial operations. Of the 571 t of Mn input into the hydrometallurgical recycling process, 544 t remained in the sludge and were not further treated. Although the sludge could be recycled, no practical recovery pathway for Mn was implemented. According to Brückner et al. (2020), industrial recycling processes generally prioritize the recovery of high-value metals such as Co, Ni, and Li, while Mn is often neglected or only partially separated through mechanical pretreatment [61]. Furthermore, although recovery targets in industry often exceed 95%, actual performance may fall below 50%, depending on input material characteristics and process limitations [62].
In addition to Mn, Li loss during hydrometallurgical recycling is also significant. Of the 695 t of Li input into the process, 129 t (approximately 18.6%) were discharged in liquid effluents. This underscores the urgent need to improve wastewater treatment and develop selective Li recovery technologies. Enhancing the recovery of both Mn and Li is essential for achieving a circular economy in the EV LIB supply chain.

3.2.2. Utilization of Recycled Products in Electric Vehicle Lithium-ion Battery Manufacturing

The utilization of recycled products in EV LIB manufacturing plays a crucial role in strengthening supply chain resilience and reducing reliance on primary raw materials. In this study, recycled products are quantified based on the amount of recovered valuable metals, specifically Ni, Co, Mn, and Li, within their respective recovered compounds. For instance, if cobalt is recovered in the form of cobalt sulfate, its recycled content is assessed based on the cobalt content within cobalt sulfate. Table 3 presents the domestic utilization of recycled products in the RoK as of 2022.
Recycled product utilization is evaluated using two key indicators: recycled product substitution potential and usage rate. The substitution potential refers to the total production of recycled products, encompassing both domestic consumption and exports. It represents the maximum possible domestic utilization if all produced recycled products were retained for internal use. Conversely, the usage rate is determined based on the volume of recycled products directly consumed within the domestic battery manufacturing sector.
In 2022, the usage rates of recycled Ni, Co, and Li in domestic LIB production were 8.9 ± 3.4%, 9.1 ± 1.5%, and 4.4 ± 0.5%, respectively. However, no recycled Mn was utilized, as Mn recovery did not occur within this period. These results indicate that while certain valuable metals are reintegrated into LIB manufacturing, the overall integration of recycled products remains limited, highlighting the challenges in achieving a fully circular battery supply chain.
Under the EU Battery Regulation, mandatory minimum recycled content requirements will be enforced from 2031, specifying 6% Ni, 16% Co, and 6% Li, with further increases by 2036 to 15% Ni, 26% Co, and 12% Li [63]. Compliance with these regulations will be critical for maintaining access to the EU market, necessitating an expansion of the RoK’s recovery and utilization of recycled products.

3.3. Policy and Technical Strategies for a Sustainable EV LIB Supply Chain

Based on the results of the mass-based MFA and SFA, this study proposes three focused strategies to enhance the circularity, recovery performance, and reintegration of critical materials in the EV LIB supply chain in the RoK. These strategies respond directly to empirical bottlenecks identified in the analysis, including limited Mn and Li recovery, low domestic utilization rates, and a lack of legal or technical standards for recycled products.

3.3.1. Policy Incentives and Regulatory Targets

This study reveals that Korea’s EV LIB recycling system faces structural challenges in both collection and recovery performance. While several international studies, including those by Bruno and Fiore (2023) and Shafique et al. (2023), project high-efficiency circular systems by 2030, these projections are often based on assumptions that diverge from the current realities in Korea [17,44]. In practice, significant material leakage persists due to the export of used vehicles, the exclusion of manufacturing-stage waste from regulation, and the absence of an integrated collection framework. These factors limit access to recyclable materials and weaken the foundation for domestic circularity.
In addition, the actual utilization of recovered materials in EV LIB manufacturing remains limited. In 2022, the recycled content rates were 8.9 ± 3.4% for Ni, 9.1 ± 1.5% for Co, and 4.4 ± 0.5% for Li, falling short of the EU Battery Regulation targets for 2036 [63]. This highlights a critical gap between domestic performance and international expectations.
To address this issue, this study proposes a phased regulatory roadmap to increase the use of recycled materials, beginning with modest targets for 2025–2031 and progressing toward full alignment with EU standards by 2036, as shown in Table 4. Supporting policy instruments such as tax incentives, preferential procurement, and certification programs should be introduced to stimulate market demand and ensure compliance. Strengthening both regulatory and economic mechanisms is essential to advance material circularity in Korea’s battery industry.

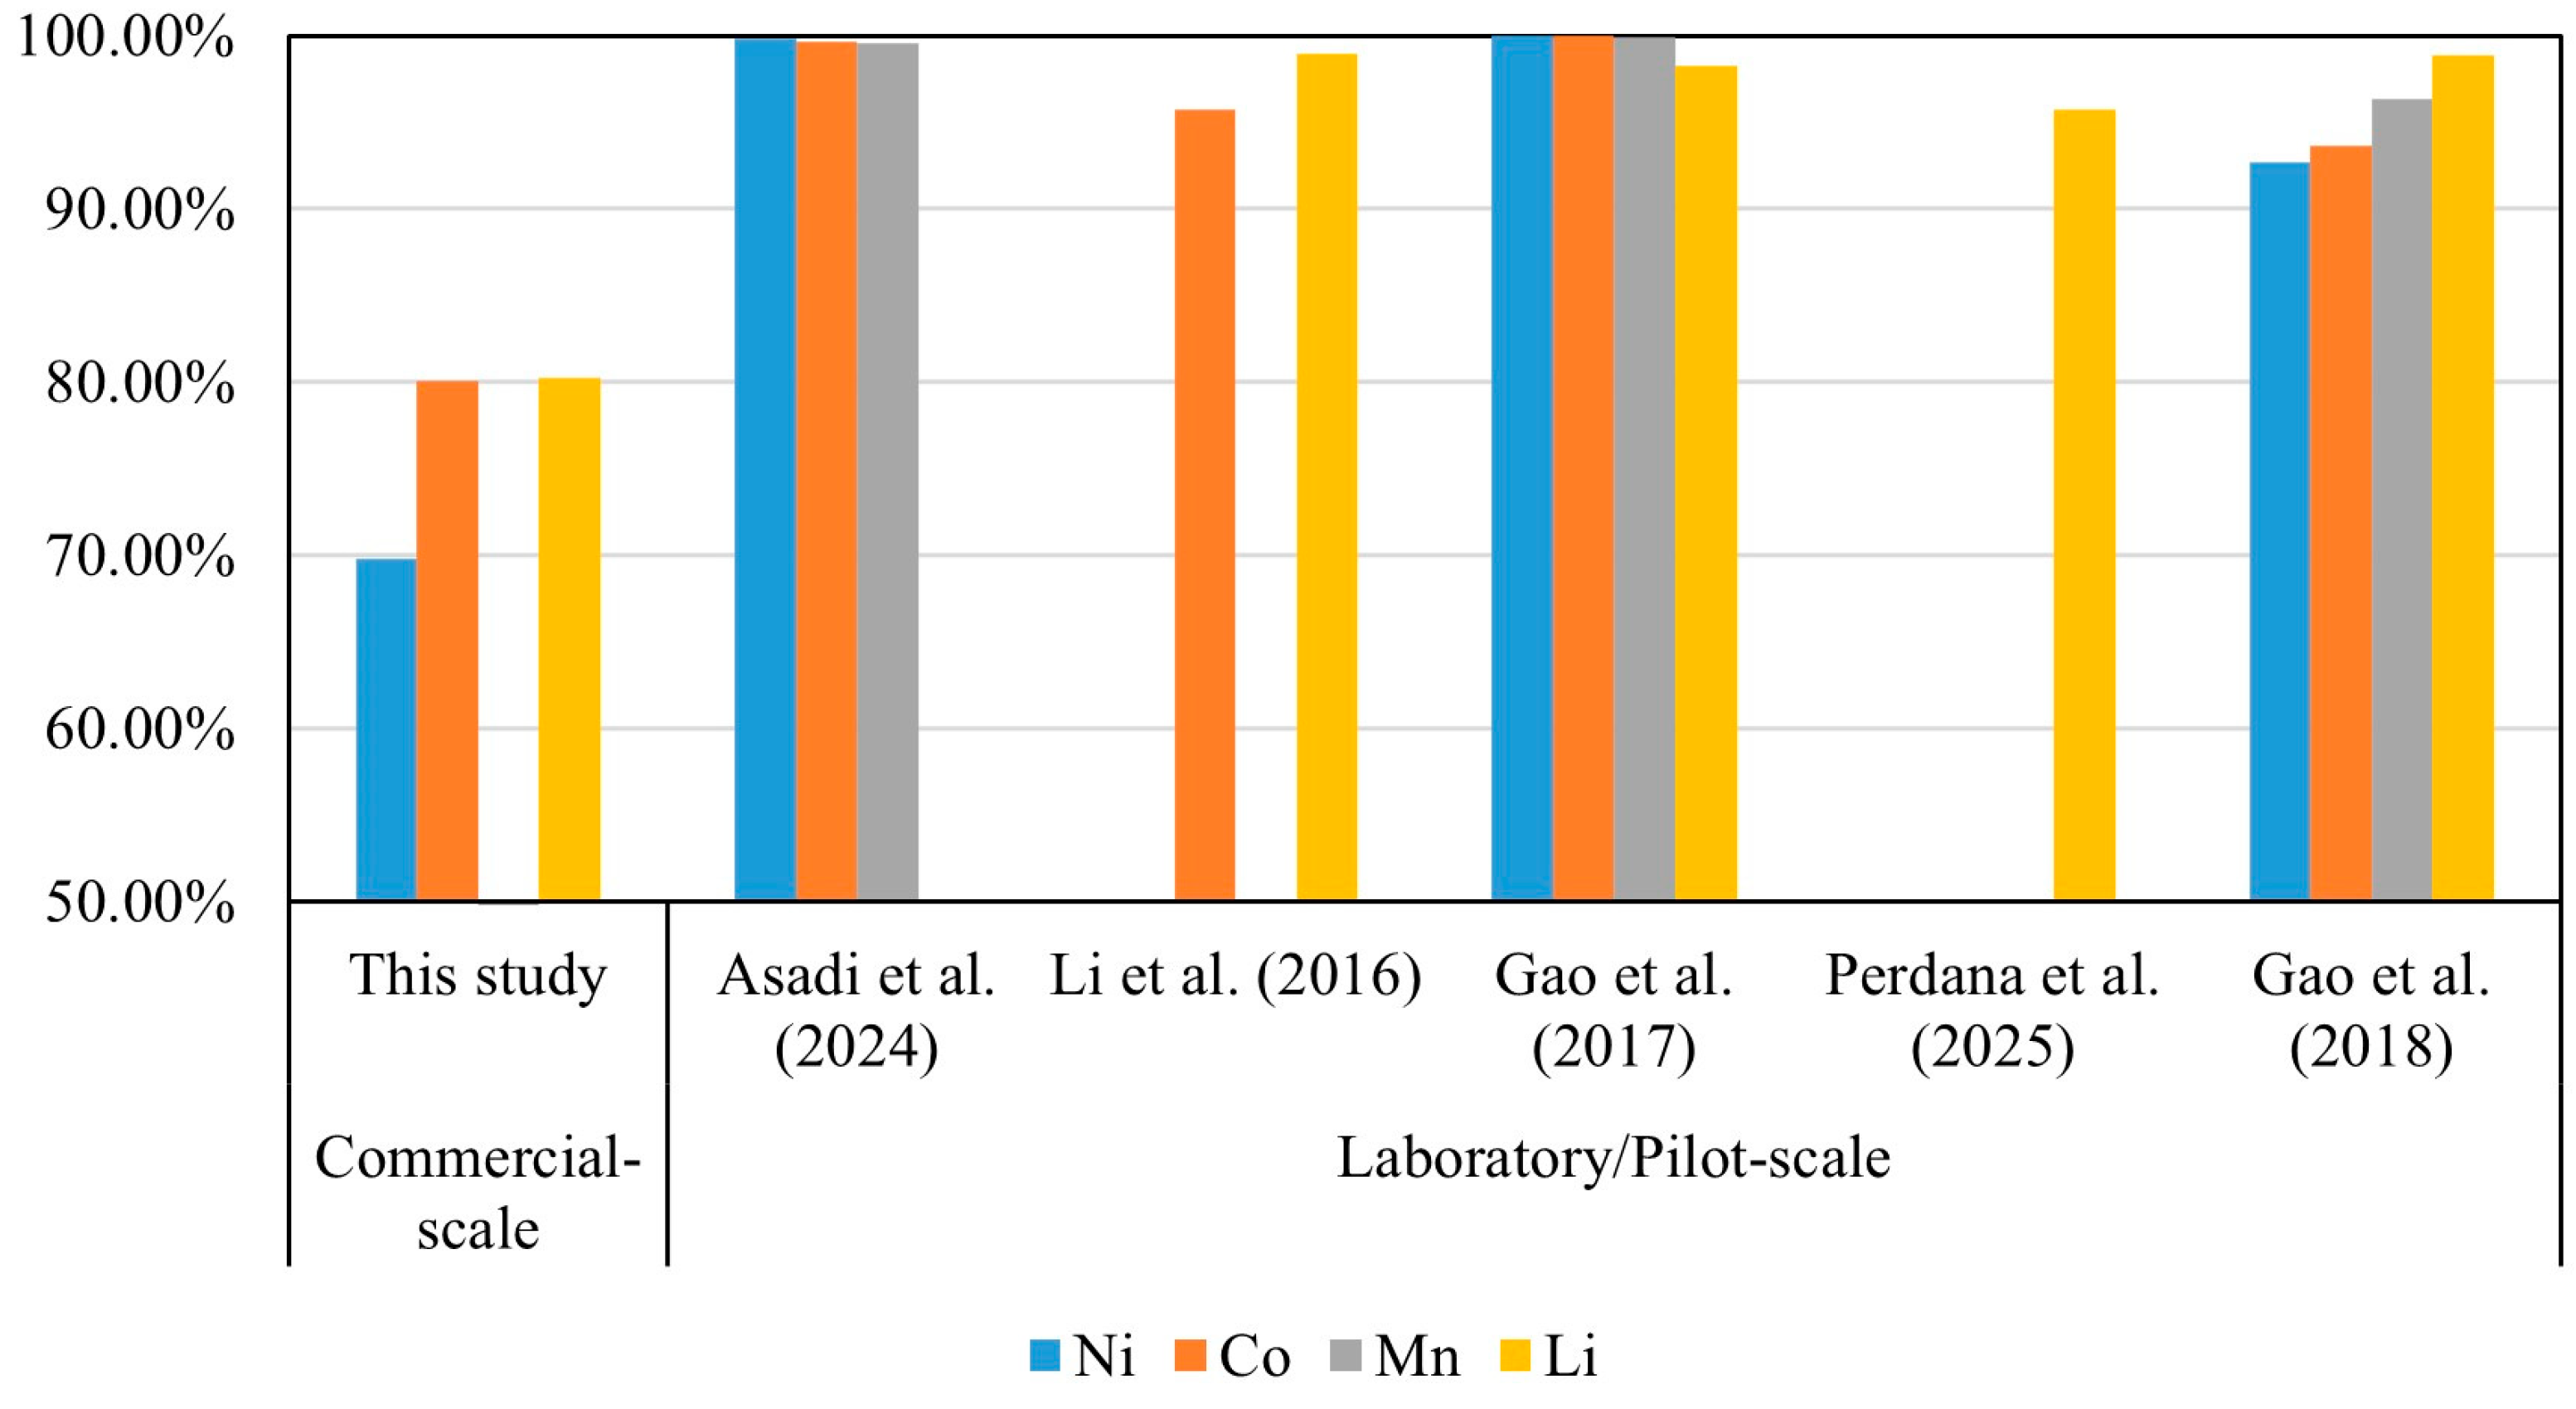
3.3.2. Technical Standards for Recovery Rates

The efficiency and reliability of metal recovery from spent EV LIBs depend not only on the choice of recycling technology but also on the quality of the input materials. In hydrometallurgical processes, black masses with elevated levels of impurities, including Al, Fe, and Cu, can reduce recovery yields and increase processing costs, as discussed in Section 3.2.1. These impurities interfere with selective leaching and solvent extraction, complicating the separation of valuable metals, including Ni, Co, and Li [64,65,66].
To overcome these technical limitations, the establishment of national standards for black mass quality is essential. These standards should specify maximum allowable concentrations of impurities and minimum thresholds for target metals to ensure consistent material quality for downstream processing. For example, China recently adopted its first national standard (GB/T 45203-2024) [67], which classifies black masses based on battery chemistry and defines specific criteria for metal content, impurity limits, and moisture control.
Implementing a similar certification and grading system in the Republic of Korea would enable more predictable processing outcomes, reduce refining inefficiencies, and strengthen alignment with international trade and environmental standards. Such measures would also support the long-term development of a high-integrity recycling supply chain for EV LIBs.

3.3.3. Process Optimization for Mn and Li Recovery

This study identified significant losses of Mn and Li in the current hydrometallurgical recycling system. Mn was not recovered at all, primarily due to its low market value and the lack of process integration for its separation. Furthermore, 18.6% of the Li input was lost through wastewater discharge, reflecting inefficiencies in aqueous-phase separation.
Rather than developing entirely new technologies, it is more appropriate at this stage to focus on optimizing existing hydrometallurgical processes to improve economic feasibility and recovery performance. For Mn, process adjustments such as improved pH control, impurity management, and selective extraction conditions could enhance recovery without major technological overhauls [68]. For Li, optimization of electrodialysis systems and the integration of zero-liquid-discharge (ZLD) technologies could substantially reduce losses to wastewater [69]. Recent studies have demonstrated that bipolar membrane electrodialysis is effective in recovering LiOH and H2SO4 from lithium sulfate solutions, offering a pathway for closed-loop recycling [70,71,72].
These improvements are essential not only for increasing material circularity but also for aligning with future market requirements and reducing the environmental footprint of EV LIB recycling operations.

4. Conclusions

This study presents a data-driven material flow and SFA of EV LIBs in the RoK. The results highlight critical structural limitations in the current recycling framework. In 2022, approximately 72,446 t of EV LIBs entered the consumption phase, yet 76.5% of used vehicles were exported without battery recovery, leading to a substantial loss of recyclable materials. The overall recovery rates were 69% for Ni, 80% for Co, 1% for Mn, and 80% for Li. Furthermore, 18.6% of Li input was lost through wastewater discharge. The actual utilization rates of recovered metals in new battery production remained far below international expectations, with only 5.5% for Ni, 7.6% for Co, and 3.9% for Li as of 2022. These figures fall significantly short of the EU Battery Regulation targets for 2036, which require 15% for Ni, 26% for Co, and 12% for Li.
These inefficiencies originate from three key sources identified through the empirical analysis. First, insufficient policy instruments and weak enforcement contribute to the low reintegration rate of battery materials into domestic recycling loops. Although a nationwide collection system exists in the Republic of Korea, a substantial portion of end-of-life EVs are exported prior to battery recovery, resulting in significant resource loss. To address these issues, a phased regulatory roadmap should be introduced to gradually increase the use of recycled materials in EV LIB manufacturing. This roadmap should be accompanied by tax incentives, preferential public procurement, and certification programs designed to strengthen market demand and promote regulatory compliance.
Second, the absence of technical standards for black mass quality undermines metal recovery performance. Elevated levels of Al, Fe, and Cu in collected materials reduce the efficiency of hydrometallurgical processing and complicate selective extraction. The establishment of national standards specifying impurity thresholds and minimum metal content would enhance downstream predictability, improve processing efficiency, and facilitate international alignment.
Third, significant losses of Mn and Li occur during the hydrometallurgical recycling process because Mn is not recovered due to its low economic value, and Li is partially lost through wastewater discharge owing to the low efficiency of aqueous-phase recovery. Rather than introducing entirely new technologies, optimizing existing hydrometallurgical systems offers a practical solution. Improvements such as enhanced pH control for Mn and the adoption of bipolar membrane electrodialysis for Li can significantly reduce metal losses and support closed-loop recycling.

Supplementary Materials

The following supporting information can be downloaded at: https://www.mdpi.com/article/10.3390/su17104560/s1, Supporting Information for A Material Flow Analysis of Electric Vehicle Lithium-ion Batteries: Sustainable Supply Chain Management Strategies.

Author Contributions

Conceptualization, H.-J.C.; Methodology, H.-J.C. and D.H.; Software, H.-J.C.; Validation, H.-J.C.; Formal analysis, M.K. and H.J.R.; Investigation, H.-J.C. and H.J.R.; Resources, D.H.; Data curation, M.K.; Writing—original draft, H.-J.C.; Writing—review & editing, H.-J.C., D.H. and Y.-S.Y.; Supervision, Y.-S.Y., Y.-Y.K. and T.-W.J.; Project administration, Y.-Y.K. and T.-W.J. All authors have read and agreed to the published version of the manuscript.

Funding

This work was supported by a grant from the National Institute of Environmental Research (NIER), funded by the Ministry of Environment (ME) of the Republic of Korea (NIER-2024-01-01-068).

Institutional Review Board Statement

Not applicable.

Informed Consent Statement

Not applicable.

Data Availability Statement

Data supporting the findings of this study are available from the corresponding author upon reasonable request.

Acknowledgments

This study was supported by Post-Doctoral Fellowships Program of National Institute of Environmental Research, Republic of Korea.

Conflicts of Interest

The authors declare no conflicts of interest.

References

  1. Colombo, C.G.; Borghetti, F.; Longo, M.; Yaici, W.; Miraftabzadeh, S.M. Decarbonizing transportation: A data-driven examination of ICE vehicle to EV transition. Clean. Eng. Technol 2024, 21, 100782. [Google Scholar] [CrossRef]
  2. Littlejohn, C.; Proost, S. What role for electric vehicles in the decarbonization of the car transport sector in Europe? Econ. Transp. 2022, 32, 100283. [Google Scholar] [CrossRef]
  3. Lah, O. Decarbonizing the transportation sector: Policy options, synergies, and institutions to deliver on a low-carbon stabilization pathway. Wiley Interdiscip. Rev. Energy Environ. 2017, 6, e257. [Google Scholar] [CrossRef]
  4. Alšauskas, O.; Connelly, E.; Huismans, M.; Jenness, E.; Copier, J.J.; Le Marois, J.B.; Lombardo, T.; McDonagh, S.; O’Riordan, V.; Petropoulos, A. Global EV Outlook 2024: Moving Towards Increased Affordability; International Energy Agency: Paris, France, 2024. [Google Scholar] [CrossRef]
  5. IEA. Annual Battery Demand by Application and Scenario, 2023 and 2030; IEA: Paris, France, 2024; Available online: https://www.iea.org/data-and-statistics/charts/annual-battery-demand-by-application-and-scenario-2023-and-2030 (accessed on 29 August 2024).
  6. Habib, K.; Hamelin, L.; Wenzel, H. A dynamic perspective of the geopolitical supply risk of metals. J. Cleaner Prod. 2016, 133, 850–858. [Google Scholar] [CrossRef]
  7. Tan, J.; Keiding, J.K. Mapping the cobalt and lithium supply chains for e-mobility transition: Significance of overseas investments and vertical integration in evaluating mineral supply risks. Resour. Convserv. Recycl. 2024, 209, 107788. [Google Scholar] [CrossRef]
  8. Yang, Z.; Huang, H.; Lin, F. Sustainable electric vehicle batteries for a sustainable world: Perspectives on battery cathodes, environment, supply chain, manufacturing, life cycle, and policy. Adv. Energy Mater. 2022, 12, 2200383. [Google Scholar] [CrossRef]
  9. Allesch, A.; Brunner, P.H. Material flow analysis as a decision support tool for waste management: A literature review. J. Ind. Ecol. 2015, 19, 753–764. [Google Scholar] [CrossRef]
  10. Choi, H.J.; Hwang, D.; Yoon, Y.S.; Jeon, T.W.; Rhee, S.W. Applying Material Flow Analysis for Sustainable Waste Management of Single-Use Plastics and Packaging Materials in the Republic of Korea. Sustainability 2024, 16, 6926. [Google Scholar] [CrossRef]
  11. Liu, W.; Li, X.; Liu, C.; Wang, M.; Liu, L. Resilience assessment of the cobalt supply chain in China under the impact of electric vehicles and geopolitical supply risks. Resour. Policy 2023, 80, 103183. [Google Scholar] [CrossRef]
  12. Xiong, X.; Zeng, X.; Zhang, Z.; Pell, R.; Matsubae, K.; Hu, Z. China’s recycling potential of large-scale public transport vehicles and its implications. Commun. Eng. 2023, 2, 56. [Google Scholar] [CrossRef]
  13. Baum, Z.J.; Bird, R.E.; Yu, X.; Ma, J. Lithium-ion battery recycling—Overview of techniques and trends. ACS Energy Lett. 2022, 7, 712–719. [Google Scholar] [CrossRef]
  14. Buisson, E.; Dhir, S.; Hegarty, A.; Hwang, G.; Kim, Y.Y.; Michaels, K.C.; Bredariol, T.d.O.; Pospiech, R.; Raboca, J. Recycling of Critical Minerals: Strategies to Scale up Recycling and Urban Mining—World Energy Outlook Special Report; International Energy Agency: Paris, France, 2023; Available online: https://www.iea.org/reports/recycling-of-critical-minerals (accessed on 29 August 2024).
  15. Chen, H.; Yu, J.; Liu, X. Development strategies and policy trends of the next-generation vehicles battery: Focusing on the international comparison of China, Japan and South Korea. Sustainability 2022, 14, 12087. [Google Scholar] [CrossRef]
  16. Shafique, M.; Rafiq, M.; Azam, A.; Luo, X. Material flow analysis for end-of-life lithium-ion batteries from battery electric vehicles in the USA and China. Resour. Convserv. Recycl 2022, 178, 106061. [Google Scholar] [CrossRef]
  17. Bruno, M.; Fiore, S. Material flow analysis of lithium-ion battery recycling in Europe: Environmental and economic implications. Batteries 2023, 9, 231. [Google Scholar] [CrossRef]
  18. Rosenberg, S.; Kurz, L.; Huster, S.; Wehrstein, S.; Kiemel, S.; Schultmann, F.; Reichert, F.; Wörner, R.; Glöser-Chahoud, S. Combining dynamic material flow analysis and life cycle assessment to evaluate environmental benefits of recycling—A case study for direct and hydrometallurgical closed-loop recycling of electric vehicle battery systems. Resour. Convserv. Recycl. 2023, 198, 107145. [Google Scholar] [CrossRef]
  19. Cencic, O.; Rechberger, H. Material flow analysis with software STAN. J. Environ. Eng. Manag. 2008, 18, 3–7. [Google Scholar]
  20. Korea Environment Corporation. Waste Discharge and Treatment Performance Report (2022); Allbaro Operation Division, Korea Environment Corporation: Incheon, Republic of Korea, 2023; Available online: https://www.allbaro.or.kr (accessed on 7 May 2025).
  21. Financial Supervisory Service. Annual Report. 2023. Available online: https://dart.fss.or.kr/main.do (accessed on 29 August 2024).
  22. National Institute of Environmental Research. National Pollution Source Survey (2022). 2023. Available online: https://wems.nier.go.kr/ (accessed on 21 March 2024).
  23. Korea Ministry of Land, Infrastructure and Transport. Total Registered Motor Vehicles. 2024. Available online: https://stat.molit.go.kr/portal/cate/statMetaView.do?hRsId=58 (accessed on 29 August 2024).
  24. Korea International Trade Association. Import and Export by Item. 2024. Available online: http://stat.kita.net/stat/cstat/peri/itme/TiemList.screen (accessed on 21 March 2024).
  25. Danawa. Autombile Encyclopedia. 2024. Available online: https://auto.danawa.com/auto/ (accessed on 31 May 2024).
  26. Statista. Market Share of Different Types of Electric Vehicles Cathode Chemistries in 2020 with a Forecast for 2025 Through 2050. 2021. Available online: https://www.statista.com/statistics/1248519/distribution-of-different-electric-vehicle-batteries-on-theglobal-market/ (accessed on 21 March 2024).
  27. Korea Environmental Corporation. Circular Resources Information Center: Electric Waste Battery from Vehicle; Korea Environment Corporation: Incheon, Republic of Korea, 2024. [Google Scholar]
  28. Korea Environmental Corporation. Collection Performance for Waste Battery from Electric Vehicle (2022); Korea Environment Corporation: Incheon, Republic of Korea, 2024. [Google Scholar]
  29. Korea Environmental Corporation. Performance for Eco-Assurance System of Electrical and Electronic Equipment and Vehicles (2018–2022); Korea Environment Corporation: Incheon, Republic of Korea, 2023. [Google Scholar]
  30. Korea Insurance Development Institute. Repair Rate for EV LIB; Korea Insurance Development Institute: Seoul, Republic of Korea, 2024. [Google Scholar]
  31. Korea Environmental Corporation. Allbaro System Performance (2022); Korea Environmental Corporation: Incheon, Republic of Korea, 2024. [Google Scholar]
  32. Korea Ministry of Environment. Waste Generation and Treatment Status 2022. 2023. Available online: https://library.me.go.kr/#/search/detail/5912624 (accessed on 11 August 2023).
  33. Trade Statistics Service. Statistics by Transaction Name. 2024. Available online: https://www.bandtrass.or.kr/theme/name.do?command=THE006View&viewCode=THE00601 (accessed on 2 October 2024).
  34. Korea Environmental Corporation. Performance Report on Export and Import Waste (2022). 2024. (Not publicly available).
  35. Korea Environmental Corporation. LIB Capacity and Weight by EV Type. 2024. (Not publicly available).
  36. Electric Vehicle Database. All Electric Vehicles. 2024. Available online: https://ev-database.org/ (accessed on 8 October 2024).
  37. Winjobi, O.; Dai, Q.; Kelly, J.C. Update of Bill-of-Materials and Cathode Chemistry addition for Lithium-ion Batteries in GREET 2020; Argonne National Laboratory: Lemont, IL, USA, 2020. [Google Scholar]
  38. Korea Ministry of Economy and Finance. Exchange Rate. 2023. Available online: https://www.index.go.kr/unity/potal/main/EachDtlPageDetail.do?idx_cd=1068 (accessed on 3 October 2024).
  39. YS/T 1342.1; Method for Chemical Analysis of Waste Batteries—Part 1: Determination of Nickel Content. Ministry of Industry and Information Technology of the People’s Republic of China: Beijing, China, 2019.
  40. YS/T 1342.2; Method for Chemical Analysis of Waste Secondary Battery—Part 2: Determination of Cobalt Content. Ministry of Industry and Information Technology of the People’s Republic of China: Beijing, China, 2019.
  41. YS/T 1229.3; Methods for Chemical Analysis of Crude Nickel Hydroxide—Part 3: Determination of Copper, Cobalt, Manganese Calcium, Zinc, Iron, Aluminum, Lead, Arsenic and Cadmium Contents. Ministry of Industry and Information Technology of the People’s Republic of China: Beijing, China, 2018.
  42. ES 04400.1e; Test Methods for Water Quality—Metals: Flame Atomic Absorption Spectrometry. National Institute of Environmental Research: Incheon, Republic of Korea, 2024.
  43. ISO 11885:2007; Water quality—Determination of Selected Elements by Inductively Coupled Plasma Optical Emission Spectrometry (ICP-OES). International Organization for Standardization: Geneva, Switzerland, 2007.
  44. Shafique, M.; Akbar, A.; Rafiq, M.; Azam, A.; Luo, X. Global material flow analysis of end-of-life of lithium nickel manganese cobalt oxide batteries from battery electric vehicles. Waste Manag. Res. 2023, 41, 376–388. [Google Scholar] [CrossRef]
  45. Fallah, N.; Fitzpatrick, C. How will retired electric vehicle batteries perform in grid-based second-life applications? A comparative techno-economic evaluation of used batteries in different scenarios. J. Cleaner Prod. 2022, 361, 132281. [Google Scholar] [CrossRef]
  46. Kamran, M.; Raugei, M.; Hutchinson, A. A dynamic material flow analysis of lithium-ion battery metals for electric vehicles and grid storage in the UK: Assessing the impact of shared mobility and end-of-life strategies. Resour. Conserv. Recycl. 2021, 167, 105412. [Google Scholar] [CrossRef]
  47. Ma, X.; Azhari, L.; Wang, Y. Li-ion battery recycling challenges. Chem 2021, 7, 2843–2847. [Google Scholar] [CrossRef]
  48. Hammami, A.; Raymond, N.; Armand, M. Lithium-ion batteries: Runaway risk of forming toxic compounds. Nature 2003, 424, 635–636. [Google Scholar] [CrossRef] [PubMed]
  49. Kirchhofer, M.; von Zamory, J.; Paillard, E.; Passerini, S. Separators for Li-ion and Li-metal battery including ionic liquid based electrolytes based on the TFSI- and FSI- anions. Int. J. Mol. Sci. 2014, 15, 14868–14890. [Google Scholar] [CrossRef] [PubMed]
  50. Werner, D.M.; Mütze, T.; Peuker, U.A. Influence of cell opening methods on electrolyte removal during processing in lithium-ion battery recycling. Metals 2022, 12, 663. [Google Scholar] [CrossRef]
  51. Korea Mineral Resource Information Service. Mineral Prices. 2025. Available online: https://www.komis.or.kr/ (accessed on 20 January 2025).
  52. Rinne, M.; Aromaa-Stubb, R.; Elomaa, H.; Porvali, A.; Lundström, M. Evaluation of hydrometallurgical black mass recycling with simulation-based life cycle assessment. Int. J. Life Cycle Assest. 2024, 29, 1582–1597. [Google Scholar] [CrossRef]
  53. Asadi, A.; Kang, D.; Harandi, H.B.; Jung, J.C.Y.; Sui, P.C. Utilization of lithium sulphate electrodialysis for closed-loop LIB recycling: Experimental study and process simulation. Sep. Purif. Technol. 2024, 343, 126989. [Google Scholar] [CrossRef]
  54. Li, J.; Wang, G.; Xu, Z. Environmentally-friendly oxygen-free roasting/wet magnetic separation technology for in situ recycling cobalt, lithium carbonate and graphite from spent LiCoO2/graphite lithium batteries. J. Hazard Mater. 2016, 302, 97–104. [Google Scholar] [CrossRef] [PubMed]
  55. Gao, W.; Zhang, X.; Zheng, X.; Lin, X.; Cao, H.; Zhang, Y.; Sun, Z.H.I. Lithium carbonate recovery from cathode scrap of spent lithium-ion battery: A closed-loop process. Environ. Sci. Technol. 2017, 51, 1662–1669. [Google Scholar] [CrossRef]
  56. Perdana, I.; Aprilianto, D.R.; Fadillah, F.A.; Fadli, R.; Petrus, H.T.B.M.; Astuti, W.; Muflikhum, M.A.; Oktaviano, H.S.; Fathoni, F.; Raihan, E.; et al. Lithium recovery from mixed spent LFP-NMC batteries through atmospheric water leaching. Sci. Rep. 2025, 15, 2591. [Google Scholar] [CrossRef]
  57. Gao, W.; Song, J.; Cao, H.; Lin, X.; Zhang, X.; Zheng, X.; Zhang, Y.; Sun, Z. Selective recovery of valuable metals from spent lithium-ion batteries—Process development and kinetics evaluation. J. Clean Prod. 2018, 178, 833–845. [Google Scholar] [CrossRef]
  58. Kim, S.; Bang, J.; Yoo, J.; Shin, Y.; Bae, J.; Jeong, J.; Kim, K.; Dong, P.; Kwon, K. A comprehensive review on the pretreatment process in lithium-ion battery recycling. J. Cleaner Prod. 2021, 294, 126329. [Google Scholar] [CrossRef]
  59. Park, S.; Kim, D.; Ku, H.; Jo, M.; Kim, S.; Song, J.; Yu, J.; Kwon, K. The effect of Fe as an impurity element for sustainable resynthesis of Li [Ni1/3Co1/3Mn1/3] O2 cathode material from spent lithium-ion batteries. Electrochim. Acta 2019, 296, 814–822. [Google Scholar] [CrossRef]
  60. Wu, J.; Xiao, L.; Shen, L.; Ran, J.J.; Zhong, H.; Zhu, Y.R.; Chen, H. Recent advancements in hydrometallurgical recycling technologies of spent lithium-ion battery cathode materials. Rare Met. 2024, 43, 879–899. [Google Scholar] [CrossRef]
  61. Brückner, L.; Frank, J.; Elwert, T. Industrial recycling of lithium-ion batteries—A critical review of metallurgical process routes. Metals 2020, 10, 1107. [Google Scholar] [CrossRef]
  62. Niese, N.; Pieper, C.; Arora, A.; Xie, A. The Case for a Circular Economy in Electric Vehicle Batteries; Boston Consulting Group: Boston, MA, USA, 2020; Available online: https://www.bcg.com/publications/2020/case-for-circular-economy-in-electric-vehicle-batteries (accessed on 27 March 2025).
  63. Regulation (EU) 1542/2023. Concerning Batteries and Waste Batteries, Amending Directive 2008/98/EC and Regulation (EU) 2019/1020 and Repealing Directive 2006/66/EC; European Parliament, Council of the European Union: Bruxelles, Belgium, 2023; Available online: https://data.europa.eu/eli/reg/2023/1542/oj (accessed on 29 August 2024).
  64. Wang, J.H.; Wang, Y.; Guo, Y.Z.; Liu, C.W.; Dan, L.L. Electrochemical characterization of AlPO4 coated LiNi1/3Co1/3Mn1/3O2 cathode materials for high temperature lithium battery application. Rare Met. 2021, 40, 78–83. [Google Scholar] [CrossRef]
  65. Zhang, R.; Meng, Z.; Ma, X.; Chen, M.; Chen, B.; Zheng, Y.; Yao, Z.; Vanaphuti, P.; Bong, S.; Yang, Z.; et al. Understanding fundamental effects of Cu impurity in different forms for recovered LiNi0.6Co0.2Mn0.2O2 cathode materials. Nano Energy 2020, 78, 105214. [Google Scholar] [CrossRef]
  66. Zhang, R.; Zheng, Y.; Vanaphuti, P.; Liu, Y.; Fu, J.; Yao, Z.; Ma, X.; Chen, M.; Yang, Z.; Lin, Y.; et al. Valence effects of Fe impurity for recovered LiNi0.6Co0.2Mn0.2O2 cathode materials. ACS Appl. Energy Mater. 2021, 4, 10356–10367. [Google Scholar] [CrossRef]
  67. GB/T 45203-2024; Recycled Black Powder for Lithium-ion Batteries. The Standardization Administration of the People’s Republic of China: Beijing, China, 2024.
  68. Shi, P.; Yang, S.; Wu, G.; Chen, H.; Chang, D.; Jie, Y.; Fang, G.; Mo, C.; Chen, Y. Efficient separation and recovery of lithium and manganese from spent lithium-ion batteries powder leaching solution. Sep. Purif. Technol. 2023, 309, 123063. [Google Scholar] [CrossRef]
  69. Panagopoulos, A.; Giannika, V. Decarbonized and circular brine management/valorization for water & valuable resource recovery via minimal/zero liquid discharge (MLD/ZLD) strategies. J. Environ. Manag. 2022, 324, 116239. [Google Scholar] [CrossRef]
  70. Song, Y.; Zhao, Z. Recovery of lithium from spent lithium-ion batteries using precipitation and electrodialysis techniques. Sep. Purif. Technol. 2018, 206, 335–342. [Google Scholar] [CrossRef]
  71. Keller, A.; Hlawitschka, M.W. Recovery of excess sulfuric acid in the lithium-ion batteries recycling process. Sep. Purif. Technol. 2024, 341, 126965. [Google Scholar] [CrossRef]
  72. Masindi, V.; Foteinis, S.; Renforth, P.; Ndiritu, J.; Maree, J.P.; Tekere, M.; Chatzisymeon, E. Challenges and avenues for acid mine drainage treatment, beneficiation, and valorisation in circular economy: A review. Ecol. Eng. 2022, 183, 106740. [Google Scholar] [CrossRef]
Figure 1. System boundary of the material flow analysis. The system consists of four stages: manufacturing, consumption, discharge and collection, and treatment of waste batteries. Abbreviations: electric vehicle (EV), lithium-ion battery (LIB).
Sustainability 17 04560 g001
Figure 2. Mass-based material flow analysis results for EV LIBs in the Republic of Korea (2022). The dashed box represents the system boundary, the black box represents the system, and the blue box represents the system including a subsystem. Arrows indicate the flow of materials, where ‘I’ represents inputs (imports), ‘E’ represents outputs (exports), and ‘?’ indicates unknown quantities that could not be quantified in this study. Abbreviations: electric vehicle (EV), lithium-ion battery (LIB), black mass (BM).
Sustainability 17 04560 g002
Figure 3. Material flow analysis by treatment process for electric vehicle lithium-ion batteries in the Republic of Korea (2022): (a) repurposing and remanufacturing processes; (b) pretreatment processes; and (c) hydrometallurgical recycling processes. The dashed box represents the system boundary, while the black box represents the system. Arrows indicate the flow of materials, where ‘I’ represents inputs (imports) and ‘E’ represents outputs (exports). Abbreviations: electric vehicle (EV), lithium-ion battery (LIB), black mass (BM).
Sustainability 17 04560 g003
Figure 4. Comparison of recovery rates for Ni, Co, Mn, and Li across commercial-scale (this study) and laboratory-scale studies [53,54,55,56,57]. The figure illustrates the gap between real-world and controlled-environment recovery rates.
Sustainability 17 04560 g004
Table 1. Data sources for the material flow analysis of electric vehicle lithium-ion batteries by life cycle. Abbreviations: electric vehicle (EV); lithium-ion battery (LIB); lithium iron phosphate (LFP).
Life CycleNo.Type of DataData QualityReferences
Manufacturing1-1Waste generation and treatmentSecondary data
(National statistics)
[20]
1-2Product salesSecondary data
(Industrial report)
[21]
1-3Evaporation, wastewater generationSecondary data
(National statistics)
[22]
Consumption2-1EV registration and scrappingSecondary data
(National statistics)
[23]
2-2Import and export of used EVsSecondary data
(Industrial report)
[24]
2-4EV salesSecondary data
(Industrial statistics)
[25]
2-5EV market shareSecondary data
(Industrial statistics)
[26]
Discharge and
Collection
3-1EV LIB collection and sales at central collection centers and local governmentsSecondary data
(National statistics)
[27]
3-2Information on EV LIB bidding companiesSecondary data
(National statistics)
[28]
3-3Scrap performance of vehicles containing LFP batteriesSecondary data
(National statistics)
[29]
3-4Repair rate for EV LIBsSecondary data
(National statistics)
[30]
Waste battery treatment4-1Waste generation and treatment performanceSecondary data
(National statistics)
[31,32]
4-2Input materials for recycling, waste generation, recycled productsPrimary data
(Survey)
-
4-3Valuable metal content (concentration) in waste (wastewater)Primary data
(Sampling and analysis)
-
4-4Evaporation, wastewater generationSecondary data
(National statistics)
[22]
4-5Import and export of black massSecondary data
(National statistics)
[33]
4-6Performance report on export and import wasteSecondary data
(National statistics)
[34]
Common
(unit conversion factors, etc.)
6-1Tolerance weight and LIB weight by EVSecondary data
(National report, industrial data)
[25,35,36]
6-2Component materials by LIB typeSecondary data
(Previous study)
[37]
6-3Exchange rateSecondary data
(National statistics)
[38]
Table 2. Substance flow and recovery rate analysis of EV LIBs by treatment stage. The total values are based on the new input volume to prevent the duplicate accumulation of material flows. Abbreviations: repurposing and remanufacturing (RE); pretreatment (PT); hydrometallurgical recycling (HR).
Valuable MetalTreatment TypeInput (ton)Output (ton)Recovery Rate (B/A)
Waste (A)Recycled Products (B)Secondary WasteWastewater
RecyclingIncinerationLandfillOthers
NiRE322210000069.2%
PT22842256131104098.8%
HR277219368156150169.8%
Total2822195882817154169.4%
CoRE1284000069.0%
PT3483442100098.9%
HR51941798120180.4%
Total531425101220180.1%
MnRE1073000069.5%
PT3963932100099.2%
HR5710548122000.0%
Total5817550222001.1%
LiRE752000069.6%
PT5695623301098.9%
HR695557710012980.2%
Total7065621040112979.6%
Table 3. Production and utilization of recycled products in EV LIB manufacturing in the Republic of Korea (2022). Abbreviations: electric vehicle (EV); lithium-ion battery (LIB).
Valuable MetalAmount of Valuable Metals Used in Domestic EV LIB Manufacturing [A (ton)]Production and Utilization of Recycled Products
Recycled Product Production [B (ton)]Domestic Consumption of Recycled Products [C (ton)]Potential Substitution Rate of Recycled Products [B/A (%)]Domestic Utilization Rate of Recycled Products [C/A (%)]
Ni12,325 ± 43721936 ± 2931101 ± 16215.7 ± 6.18.9 ± 3.4
Co4565 ± 2259417 ± 111416 ± 1109.1 ± 1.59.1 ± 1.5
Mn3684 ± 28320 ± 00 ± 00.0 ± 0.00.0 ± 0.0
Li2697 ± 562557 ± 240119 ± 5120.6 ± 2.54.4 ± 0.5
Table 4. Proposed mandatory utilization targets for recycled products in EV LIBs in the Republic of Korea (2022–2036). Abbreviations: electric vehicle (EV); lithium-ion battery (LIB).
Valuable MetalBaseline (2022)Short-TermLong-Term
202520272029203120322033203420352036
Ni5.5%--5.5%6.0%7.8%9.6%11.4%13.2%15.0%
Co7.6%8.5%11.0%13.5%16.0%18.0%20.0%22.0%24.0%26.0%
Li3.9%4.2%4.8%5.4%6.0%7.2%8.4%9.6%10.8%12.0%
Disclaimer/Publisher’s Note: The statements, opinions and data contained in all publications are solely those of the individual author(s) and contributor(s) and not of MDPI and/or the editor(s). MDPI and/or the editor(s) disclaim responsibility for any injury to people or property resulting from any ideas, methods, instructions or products referred to in the content.

