Abstract
The Yangtze River Economic Belt, a key growth driver in China, faces energy-carbon challenges. Analyzing the impact of industrial restructuring on energy transition and emission reduction is crucial for its low-carbon transformation. This study first analyzed the spatiotemporal patterns of carbon emissions, energy intensity, and energy structure decarbonization across YREB provinces from 2005 to 2021, then quantified the impacts of industrial upgrading on these dimensions by using a spatial Durbin model with panel data, revealing spatial heterogeneity and mechanisms. Results show that: (1) a U-shaped relationship exists between industrial upgrading and both energy intensity and energy structure decarbonization, while it significantly lowers regional emissions; (2) heterogeneity analysis indicates the emission reduction effects of industrial upgrading intensify toward downstream regions, with energy transition being pivotal for mid-upstream mitigation. Accordingly, region-specific strategies are proposed: upstream areas should prioritize high-carbon energy substitution, ecological compensation, and technological support; midstream regions should adopt targeted policies for green industrial relocation and energy efficiency enhancements to accelerate upgrading; downstream areas should leverage innovation incentives and service-driven industrial restructuring. This study provides theoretical foundations for tailored regional strategies and actionable insights for achieving the YREB’s low-carbon development goals.
1. Introduction
The Industrial Revolution boosted rapid global economic growth, creating an unprecedented era of prosperity. However, despite its significant economic benefits, rising pollution levels and surging energy consumption have increasingly undermined the global economy’s capacity for sustainable development and socially equitable progress [1,2,3]. Consequently, the transformation to a sustainable, low-carbon economic structure has become an urgent concern for the world [4,5,6]. As the global second-biggest economy, China today contributes roughly a third of the world’s yearly emissions of carbon dioxide [7]. To promote global sustainable development, the Chinese government has established a two-phase climate action roadmap: peaking carbon emissions by 2030 followed by comprehensive carbon neutrality attainment by 2060. China’s economic trajectory is shifting from a phase of rapid expansion to one marked by low-carbon and high-quality growth [8,9,10], placing greater demands on the restructuring of its energy structure. China’s prosperity is currently challenged by significant obstacles, including a high baseline of carbon emissions, a coal-dominated energy mix, and massive overall energy consumption. Therefore, advancing the establishment of a long-term mechanism for the green energy transition is essential to overcoming resource and environmental constraints and promoting sustainable economic growth.
Numerous academics have recently studied different energy transitions and emission reduction measures in the context of China’s economic growth. Some research concentrates on particular sectors, exploring how the production pattern [11] and technological innovation [12] influence energy use and carbon emissions. For instance, Zhang et al. [13] estimate the energy use and carbon emissions during building projects’ construction and operation stages based on machine learning techniques, offering useful examples for reducing emissions and conserving energy in the industry. Other studies focus on how national industrial development influences energy utilization or carbon emissions, often using industry-level energy efficiency or carbon efficiency as key indicators [14,15]. In particular, some scholars [16,17] have examined the impact of industrial upgrading on energy use and carbon emissions, arguing that although such restructuring promotes area economic progress, it also directly influences the composition and effectiveness of energy utilization. Energy consumption is intrinsically linked to carbon emissions. According to Fan et al. [18], industrial transformation is a key driver of changes in energy usage patterns, and promoting a rational industrial structure is essential for achieving China’s carbon reduction targets and enhancing its low-carbon and green development framework. Furthermore, China’s 20th National Congress report underlined promoting green and low-carbon economic and social development, which is a critical pathway to achieving high-quality growth. It emphasized that optimizing industrial and energy structures constitutes an essential means of attaining this goal. Therefore, investigating how upgrading industrial structures affects regional energy transition and low-carbon growth, as well as clarifying the mechanisms and development patterns among them, is of great significance. It can provide important guidance for optimizing the path of energy transition, easing regional emission reduction pressures, and advancing low-carbon economic growth.
The Yangtze River Economic Belt (YREB) serves as a pivotal engine for China’s economic growth. As one of the three major national strategies for optimizing economic development patterns and spatial restructuring, it occupies a strategically vital position in the regional development framework. Spanning eastern, central, and western China, the YREB integrates provinces along the basin into an internationally significant inland economic corridor. It serves as a hub of integrated regional development and a pilot zone of ecological civilization, with distinct regional advantages. By 2021, although it represented only 22% of China’s territory, it generated 46.14% of the national GDP and housed 43.3% of its people [19], showing great development potential. However, the region also exhibits a higher intensity of energy consumption and carbon emissions. In 2017, the YREB was responsible for 41.1% of China’s total energy consumption and 44% of its total carbon emissions. It faces significant challenges in meeting carbon peaking and carbon neutrality targets while maintaining a high-quality economy [20,21,22]. Therefore, promoting industrial structure upgrading to transform energy consumption patterns and effectively decoupling economic growth from carbon emissions have become critical pathways for resolving this contradiction [23]. The 2016 Yangtze River Economic Belt Development Plan Outline emphasized innovation-driven industrial upgrading to promote energy structure adjustments and decarbonization. The 2021 Yangtze River Economic Belt Urban Coordinated Development Capability Index called for integrated efforts to improve the ecological environment, implement localized emission reduction plans based on regional conditions, and establish a coordinated and complementary spatial framework for carbon reduction. These initiatives aim to enhance resource deployment, optimize the industrial structure, shift industrial development toward low energy-consumption sectors, and steadily advance the region’s green transition process [24,25].
This study addresses key questions regarding current trends in energy transition and carbon emissions in the Yangtze River Economic Belt, focusing on how industrial upgrading drives these processes and identifying areas for improvement. The main contributions are as follows: (1) It examines the spatiotemporal patterns and determinants of energy transition and carbon emissions in the 11 provinces and municipalities of the YREB from 2005 to 2021, measuring energy transition from both the total energy consumption volume and the low-carbon level of the energy consumption structure. (2) A spatial Durbin panel regression model is used to analyze the direct effects of industrial upgrading on energy consumption and energy structure decarbonization. (3) This study integrates industrial upgrading, energy transition, and carbon emissions into a unified framework to examine the underlying mechanisms linking industrial restructuring to carbon emissions, addressing a gap in existing research. (4) It analyzes regional heterogeneity across the YREB’s upstream, midstream, and downstream areas, providing insights for developing region-specific carbon reduction policies. Nevertheless, while this research offers valuable insights into the dynamics of energy transition and carbon emissions across the entire YREB, it also faces limitations. The research relies on provincial-level data, which may overlook finer-grained variations at the municipal and industry levels.
This paper proceeds as follows: Section 2 reviews the relevant literature. Section 3 outlines the theoretical hypotheses and research objectives. Section 4 describes the research methodology, model construction, and data sources. Section 5 analyzes the spatiotemporal characteristics of carbon emissions, energy consumption, and energy structure transition in the YREB, and presents the empirical results based on the spatial panel model. Section 6 provides a discussion and future outlook, and Section 7 concludes the study with policy implications.
2. Literature Review
Reducing carbon emissions through industrial structural upgrading has become a key topic in recent scholarly research. On the one hand, some scholars have empirically demonstrated that factors such as industrial structure upgrading have driven a continuous decline in carbon emission intensity [26,27]. Existing literature can be broadly categorized into three methodological approaches: First, studies grounded in the Environmental Kuznets Curve (EKC) theory and environmental impact models—such as LMDI, IPAT, and STIRPAT—examined the impact of industrial structure on carbon emissions. For instance, Wang et al. [28] and Dong et al. [29] demonstrated that intelligent industrial upgrading influences carbon emissions both directly and indirectly through green technological progress and resource reallocation. Lu et al. [30] used an extended STIRPAT model and InVEST’s ecosystem carbon sink estimation to identify industrial restructuring as a key driver of emission reduction across provinces in the Yangtze River Basin. Similarly, Zhan et al. [31] confirmed the substantial inhibitory influence of industrial structure on carbon reduction by employing the Kaya identity, LMDI decomposition, and system dynamics to the Beijing–Tianjin–Hebei region. Additionally, Wu et al. [32] used a spatial Durbin model to assess the impact of industrial upgrading on the carbon balance in the Yangtze River Economic Belt, finding more pronounced effects in midstream and downstream regions. Cai et al. [33] further identified a moderating effect of industrial structural upgrading on carbon emissions. Second, efficiency-based studies quantify the effect of industrial upgrading on carbon performance. For instance, Sun et al. [34] used a Super-EBM to assess how structural rationalization and advancement narrow regional disparities in carbon emission efficiency. The third approach utilizes machine learning methods. Using a random forest model, Yu et al. [35] analyzed the carbon intensity of the construction sector and highlighted the contributions of industrial upgrading, technological advancement, and the clean energy transition to future carbon mitigation. Furthermore, research on industrial collaboration and agglomeration reveals their role in enhancing resource allocation efficiency and reducing emissions. Li et al. [36] used a spatial Durbin model to identify an inverted U-shaped relationship between the co-agglomeration of manufacturing and producer services and high-quality development. He et al. [37], based on the SBM model, calculated Green TFP efficiency of the Yangtze River Delta urban agglomeration (YRD) and demonstrated that such co-agglomeration reduces emissions through enhanced ecological-economic efficiency.
However, in practice, industrial restructuring reduces carbon emissions by reshaping patterns of energy consumption [38,39]. For instance, Tao et al. [40] confirmed that structural upgrading improves local energy efficiency. Thus, energy consumption serves as a key mediating factor in the correlation between industrial upgrading and the release of carbon. Existing studies have predominantly treated either industrial structure or energy use as mediating variables. According to Zhao et al. [41] and Wang et al. [42], industrial structural adjustment indirectly lowers emissions by improving energy efficiency. In their study of industrial transformation and upgrading demonstration zones, Li et al. [43] found that inefficient industrial structures increase fossil fuel dependence, while green innovation and better resource allocation help curb carbon intensity. Feng et al. [44] demonstrated the combined impact on carbon reduction through a dual mediation path involving energy low-carbon restructuring and industrial structure upgrading. Some scholars have examined the topic with a focus on regional energy endowment conditions, arguing that energy-dependent industries act as positive mediators of emissions [45]. Others have developed multi-objective industrial optimization models constrained by energy use and carbon reduction goals [46,47]. To evaluate the effects of interregional industrial structure optimization in the YRD on economic growth, energy consumption, and carbon emissions, Zhu et al. [48] employed SBM efficiency analysis, confirming its effectiveness in emission control. Building on these insights, this study further explores the direct mechanisms linking industrial restructuring and energy transition and evaluates their impact on carbon emissions, thereby filling a critical research void in current academic research.
Previous research on energy consumption has primarily focused on urbanization [49,50], economic development [51], and household consumption [52], discussing overall energy use and efficiency across land, economic, population, and ecological dimensions [53,54]. Recently, scholars have shifted attention toward how the energy consumption structure functions, emphasizing that fostering clean energy use [55] and decarbonizing energy structures [56] are critical for carbon emission reduction. In order to correctly depict the link between total energy consumption and carbon emissions throughout urbanization, highlighting localization distinctions, Yao et al. [57] developed an “inverse N-shaped” curve in place of the traditional “inverse U-shaped” curve. Liu et al. [58] demonstrated that transforming the energy consumption structure significantly lowers emissions in renewable energy demonstration municipalities. Zhu et al. [59] applied system dynamics to analyze data from seven industrial sectors in China, showing that optimizing energy consumption structure stimulates tertiary sector demand, making it a necessary step in the energy transition. Furthermore, some studies have examined both energy consumption and carbon emissions, focusing on total energy use and structural changes during the energy transition. Xu et al. [60] decomposed energy consumption into “total amount” and “structure”, evaluating the feasibility of China’s targets for reducing carbon emissions. Fan et al. [61] and Yin et al. [62] developed a low-carbon indicator that considers both total and structural effects, revealing their negative impact on carbon emissions. Therefore, both total energy consumption and changes in energy structure are crucial in understanding the transition of energy consumption patterns [63,64].
Overall, although a substantial body of research has examined the individual relationships between industrial upgrading, energy transition, and carbon emissions, or combinations of these factors, studies that integrate all three into a unified analytical framework remain scarce. Additionally, there is still room for further exploration of these topics within the boundaries of the YREB. Therefore, this research will focus on the YREB region, investigating the effects of industrial structure upgrading on energy transition from the perspectives of total energy consumption and energy structure transformation, as well as the underlying mechanisms of carbon emissions, and offer recommendations for regional emission-lowering policies.
3. Theoretical Mechanism and Research Hypothesis
3.1. Direct Impact of Industrial Structure Upgrading on Energy Transition
Improving industrial structures is essential to advancing the energy transition. Theoretically, the reorganization of the industrial structure of the YREB should decrease the proportion of high-energy-consuming businesses in the initial stages of the upgrading process. Furthermore, government policies promoting regional industrial upgrading and emission reduction measures can significantly reduce overall energy consumption. However, accelerated expansion of manufacturing capacity may result in higher energy consumption as industrial upgrading and regional development progress. According to the rebound effect [65], improvements in energy efficiency and lower energy costs often stimulate businesses or consumers to increase production or consumption, which in turn increases energy use, partially offsetting energy savings. Moreover, given the uneven development and untapped potential of the YREB, industrial improvement may shift toward energy-intensive and heavy industries. Even with advanced technologies, this shift may result in a rise in overall energy demand, thereby raising energy intensity. The influx of businesses and population into the region may also heighten demand for infrastructure such as transportation and electricity, further exacerbating energy consumption [66]. Additionally, while the transition from coal to electricity or other clean energy sources may occur, the rapid growth in electricity demand might end up in a general rise in energy use. According to energy substitution theory [67], the use of clean energy does not necessarily result in a reduction in total energy consumption, especially when emerging industries demand significant electricity consumption. Thus, at certain stages of industrial upgrading, energy consumption may increase regionally. Concerning the shift to low-carbon energy, industrial transformation in early and mid-phases drives innovation and curbs high-carbon fuel reliance. However, economic growth pressures and the rising share of manufacturing industries may stimulate the use of high-carbon energy, negatively impacting the overall progress toward cleaner energy consumption structure. Once the industrial structure reaches a certain stage, as technology advances and the adoption of clean energy sources becomes more widespread, the positive effects will gradually outweigh the negative ones, ultimately achieving the goal of decarbonizing energy consumption. Guided by the theoretical frameworks above, we present the following hypotheses:
H1:
Industrial structure upgrading exhibits a U-shaped relationship with energy consumption intensity, initially decreasing and then increasing.
H2:
Industrial structure upgrading exhibits a U-shaped relationship with the decarbonization of the energy consumption structure, initially hindering and later facilitating the transition.
3.2. Impact of Industrial Structure Upgrading on Carbon Emissions Under the Industrial Structure Upgrading—Energy Transition—Carbon Emission Framework
We argue that industrial structure upgrading is key to reducing carbon emissions. In the early stage of industrial upgrading, while the decarbonization of energy consumption initially decreases, the overall reduction in energy consumption intensity leads to a suppression of carbon emissions. As industrial upgrading efforts intensify, regional progress spurs a growth in overall energy consumption. However, as technology marches on and clean energy sources gain traction, we are seeing a considerable drop in reliance on high-carbon energy, and the decarbonization of energy consumption increases significantly. As a result, although total energy consumption may rise, overall carbon emissions continue to be suppressed [68]. Moreover, given the considerable disparities in resource availability, industrial makeup, and overall development stages across the upper, middle, and lower reaches of the YREB, the resulting effects on carbon emissions are anything but uniform. According to spatial economics theory, regions with different industrialization levels and resource availabilities exhibit heterogeneous responses to industrial restructuring. This reflects local economic structures, technological progress, and energy consumption patterns [69]. For example, the downstream basin area is currently undergoing a pivotal phase of industrial transformation, where impacts on emission reduction are most pronounced. The midstream region, which connects upstream and downstream operations, is a key area for government-led industrial upgrading, while the upstream region may still rely on traditional industries, thus delaying the effect of decreased emissions. Hence, we present the following hypotheses:
H3:
Industrial structure upgrading consistently exerts a major negative impact on regional carbon emissions.
H4:
Regional disparities exist in the impact of industrial structure enhancement on carbon emissions, showing greater influence in downstream and midstream sectors.
This study, based on the measurement of carbon emissions, energy utilization, and industrial upgrading, focuses on the design of key indicators and the construction of research models to examine the relationship between industrial upgrading, energy consumption, and carbon emissions. Based on the findings, it analyzes the spatiotemporal characteristics of carbon emissions, energy consumption, and energy transition in the YREB. It further explores impacts and underlying mechanisms of industrial upgrading on regional energy intensity, energy decarbonization, and carbon emissions. Additionally, it provides heterogeneity analysis and differentiated policy recommendations. Figure 1 provides a visual roadmap of the research framework.
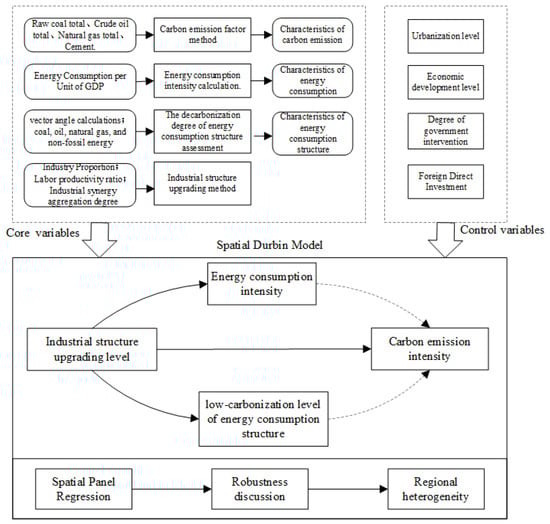
Figure 1.
The research framework.
4. Materials and Methods
4.1. Core Variable
4.1.1. Carbon Emissions Accounting
Utilizing the approach outlined in the 2006 IPCC National Greenhouse Gas Inventory Guidelines [70], this research assesses the carbon emissions associated with primary energy sources within the YREB—spanning raw coal, crude oil, natural gas, and cement manufacturing. This approach has been widely adopted in national and regional carbon accounting studies [71,72]. The accounting method is shown in Equations (1) and (2):
where denotes the energy consumption of source i, denotes its corresponding carbon emission factor, is its net calorific value, reflects its carbon content per unit of energy produced, accounts for the oxidation efficiency of carbon during combustion, serves as the carbon to conversion factor. Data are sourced from China Energy Statistical Yearbook, the China Emission Accounts and Datasets (CEADs).
To account for variations in population across regions when comparing carbon emissions, this research employs per capita carbon emissions () as an indicator of regional carbon emission levels. It is extensively utilized for assessing the regional emission reduction policy effectiveness and in cross-regional comparative studies [73,74].
4.1.2. Energy Consumption Accounting
According to the work of [75,76], energy consumption intensity (E) is a frequently used metric to assess the primary energy consumption in various nations and areas. It is expressed by the energy consumption per unit of GDP. The rational integration of different energy demands across industries occurs as industrial structures continuously adjust and upgrade. In particular, economic activity tends to shift from energy-intensive industries (e.g., heavy manufacturing) to low-energy-consuming sectors such as services and high-tech industries, significantly impacting energy consumption intensity [77]. Therefore, this study selects energy consumption intensity to measure the overall energy consumption.
4.1.3. Decarbonization Level of Energy Consumption Structure Accounting
To describe the transition of energy consumption patterns from carbon-intensive sources to those that are low-carbon or even carbon-neutral, we adopt the indicator of low-carbonization level of energy consumption structure (), which is constructed using a vector angle approach, as proposed by Tang et al. [78] and further applied in energy transition assessments by Wan et al. [79]. This method captures changes in the internal structure of energy types based on their differences in the carbon content. Equation (3) presents the formula:
where is a spatial vector derived from the energy consumption’s carbon content. Four types of energy sources, including coal, oil, natural gas, and non-fossil energy, were selected. The consumption proportions of each type form the components of the spatial vector . Using the basic unit vectors as the reference vector, is the component. The angles between and are calculated (See Equation (3)). Objective weighting is employed, to sum up all the angles, providing an indicator that reflects the level and changes in the low-carbonization of the energy consumption structure. As per Equation (4), when the energy consumption structure transitions from carbon-intensive to greener options, the angle increases. A larger indicates a higher degree of decarbonization in the energy consumption structure. is the weight.
4.1.4. Industrial Structure Upgrading Accounting
Industrial structure upgrading generally refers to the evolution of an economy across primary, secondary, and ultimately advanced service-oriented and high-tech sectors, thereby enhancing productivity, promoting innovation, and achieving low-carbon development [80,81]. This process helps shift industrial composition from high-energy-consuming sectors to more sustainable, low-energy industries, thereby making it easier to disconnect economic progress from the carbon emissions problem [82]. Moreover, the rational allocation of industries facilitates the efficient reallocation of production factors, enhances energy productivity, and accelerates the transition toward sustainable and eco-friendly technologies [83].
Based on Petty–Clark’s Law, which posits that the economic share of the tertiary sector increases as economies develop, we define the industrial upgrading level () [84], denotes the GDP percentage attributed to the industry, as shown in Equation (5).
to ensure robustness, we also employ the labor productivity proportion among service and manufacturing sectors () to represent the changes in industrial production factors [26], as shown in Equation (6). Additionally, we incorporate the degree of industrial synergy aggregation () [85,86,87], as shown in Equations (7) and (8).
where the number of workers in the manufacturing and service sectors are denoted by and , and and represent the output values.
where M and S represent the manufacturing and productive service sectors, respectively. , reflect location quotients entropy nationwide. , , and q are the amount of staff members in i industry of province j, the total amount of staff members of all industries in province j, the total amount of staff members in the i industry nationwide and total number of employees nationwide, respectively.
4.2. Control Variables
Based on relevant research, the following covariates that affect energy transition and carbon emissions were selected:
- Urbanization level (u): extensive research has explored urban growth’s impact on carbon output, suggesting that as urban areas expand, the impact on energy consumption may be positive, negative, uncertain, or follow an inverted U-shaped pattern [88,89]. Therefore, we use the urban population percentage as the urbanization metric.
- Economic development level (): energy demand in both consumption as well as production may rise with the increase in regional economic development, subsequently escalating carbon output [90,91]. Hence, GDP is used to indicate an area’s economic production.
- Degree of government intervention (): government action is key to promoting local industrial development and formulating carbon reduction policies [92,93]. We measure government involvement in socioeconomic activities via the proportion of local fiscal outlays relative to provincial GDP.
- Foreign direct investment (): foreign direct investment substantially influences the overall emissions in China [94,95]. We measure it using FDI inflows.
4.3. Spatial Correlation Test
Spatial autocorrelation testing, including both global and local assessments, is vital for analyzing spatial data dependence. The most frequently employed method for measuring global spatial autocorrelation is Moran’s I, proposed by Moran [96], which evaluates whether the spatial organization of a given quantity exhibits clustering, dispersion, or randomness. Moran’s I values range from −1 to 1, where positive values signify an obvious correlation, negative values reflect a negative correlation, and a value of zero suggests there’s no autocorrelation. The formula is shown in Equation (9):
here, n reflects the amount of urban cities, is for city i and is for city j. reflects the average property, while indicates the variance. The spatial weight matrix is denoted by .
The local Moran’s I, originally proposed by Anselin [97], builds upon global spatial autocorrelation to further explore localized spatial clustering patterns. This method helps identify spatial hotspots, coldspots, and outliers, enabling more nuanced interpretations of regional spatial heterogeneity. The formula is shown in Equation (10):
4.4. Model Setting
4.4.1. The Spatial Durbin Model
Prior studies about industrial structure [98,99], energy consumption [100] and carbon emissions [101] have highlighted their spatial interdependencies. Wang et al. [102] examined how economic digitalization influences spatial patterns of emissions using a Spatial Durbin Model and Moran’s I. Miao et al. [103] applied spatial regression to investigate the spatial linkages among energy use, economic progress, and sustainability. When explanatory as well as response variables may display spatial characteristics, the use of spatial econometric models, as opposed to traditional OLS methods, is valuable in overcoming errors resulting from neglecting sample spatial correlation and heterogeneity [104]. Given the ongoing advancement of regional integration in the YREB—where neighboring provinces increasingly affect each other’s industrial and economic activities—spatial econometric models that take into consideration both time and space effects are particularly well-suited for this study. Wang et al. [105], in evaluating the industrial upgrading’s effect on emission, identified significant spatial lag and error effects. In contrast to the Spatial Autoregression model (SAR) and Spatial Error model (SEM), the Spatial Durbin model (SDM) exhibits superior unbiasedness [106]. Its standard form is shown in Equation (11):
In this model, Y represents the dependent factor (e.g., E, , C), X is the explanatory variable (e.g., , other control variables). and represent coefficients, and serve as the spatial effects and temporal effects, respectively. is a random error term. W is a spatial weight matrix.
In this study, two categories of weight matrices are employed: 1. Geographic distance matrix : the matrix reflects the geographic distance between regions and employs provincial coordinates’ latitudes and longitudes to determine interregional distances. 2. Adjacency distance matrix : this matrix reflects the adjacency relationships between regions, assigning 1 to neighbors and 0 to non-adjacent areas. The formula is shown in Equation (12).
4.4.2. Measurement Model
The Influence of Industrial Structure on Energy Consumption Patterns
In order to explore the direct effects of China’s industrial upgrading on overall energy consumption and the decarbonization of energy structure, we established regression formulas for the general effect of energy consumption (See Equation (13)) as well as the structural effect (See Equation (14)) based on the aforementioned SDM basic model:
here, indicates the province, while denotes the years spanning 2005 to 2021. E is total energy consumption. represents the degree of regional industrial structure upgrading. To address the potential non-linear relationship, we introduced a square term of industrial upgrading . is the variable’s coefficient.
Equation (14) captures a structural impact of energy transition through the low-carbonization index of the energy structure . It considers the influences of regional energy consumption E, industrial structure , and its square term . is the variable’s coefficient. To ensure the stability of variables, we initially logarithmically transformed all of the variables above.
The Influence of Industrial Structure and Energy Consumption Patterns on Carbon Emissions
To further validate the dual effects of industrial advancement on the energy consumption transformation and their overall influence on carbon emissions, we incorporate carbon emissions, industrial structure upgrading, and energy consumption into a unified research framework. The following econometric panel model was employed for illustration:
where, represents the per capita carbon emissions, serves as the coefficient. The control variables set in Equations (13)–(15) are used to mitigate estimation biases due to omitted variables [99,100], including urbanization, economic development, government intervention, and foreign investment.
4.5. Data Source and Description
The study period of 2005 to 2021 was selected for the following reasons. First, 2005 launched China’s 11th Five-Year Plan, which introduced national targets for energy efficiency and emission control, making it a critical starting point for assessing energy transition and carbon reduction. Second, due to the completeness and accessibility of data, the period from 2005 to 2021 provides comprehensive coverage of economic and energy-related indicators across the YREB. It corresponds to the full policy cycle and thus holds significant analytical value.
This study selects a balanced panel dataset spanning 2005–2021, encompassing 11 YREB provincial-level administrative regions. The energy data used to calculate carbon emissions, the intensity of energy consumption and the energy consumption decarbonization index are derived from CEADs and the China Energy Statistical Yearbook. Other social-economic data are derived from the China National Bureau of Statistics of China, China Statistical Yearbook, as well as the EPS database. Absent values were supplemented via interpolation approaches, and GDP-related figures were deflated using 2005 as the base year. Table 1 displays summary statistics for the main variables. As shown, there were significant variations in energy intensity and emissions from 2005 to 2021, which suggests that further progress is needed in industrial optimization and coordination.

Table 1.
Description of variables.
5. Results
5.1. Analysis of Carbon Emission and Energy Utilization Characteristics
5.1.1. Carbon Emission Characteristics
Figure 2a shows the annual changes in carbon emissions across YREB’s 11 provinces. From 2005 to 2021, emissions exhibited an overall upward trend, ranging from 1.94 to 9.27 tons per capita. Growth was rapid before 2013 but slowed afterward, driven by key policies such as the 2012–2013 Air Pollution Prevention and Control Action Plan, carbon trading pilots, industrial relocation, increased clean energy adoption, and the establishment of a carbon accounting system in 2011. Regionally, Shanghai, Zhejiang, Jiangsu, Anhui, and Guizhou maintained higher per capita emissions throughout the study period. Analysis suggests that coastal and industrially advanced provinces like Shanghai and Zhejiang experienced higher emissions due to rapid urbanization and energy-intensive industries. Meanwhile, regions such as Guizhou (upstream) faced challenges associated with resource dependence, where the trade-off between “high-carbon development inertia” and “low-carbon transition demands” slowed down their decarbonization efforts.
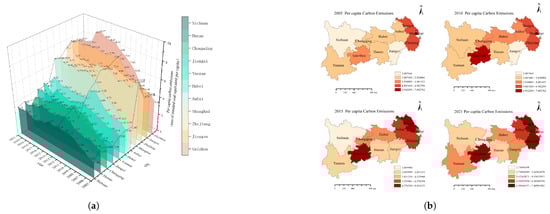
Figure 2.
The per capita carbon emissions of the YREB’s 11 provinces. (a) Time trend. (b) Spatial trend.
As shown in Figure 2b, per capita carbon emissions followed a core-to-periphery diffusion pattern, with Shanghai, Zhejiang, Jiangsu, Anhui (downstream), and Guizhou (upstream) as emission hubs. The higher emissions in the upstream provinces are attributed to their reliance on traditional and ongoing industrial transfers in these areas, highlighting the need for a more robust ecological compensation mechanism to support the low-carbon transition in resource-dependent regions. In contrast, the middle-stream transition zone has relatively lower emissions. These dynamics underscore the challenges faced by different regions in balancing economic growth with sustainable, low-carbon development.
5.1.2. Energy Consumption Intensity Characteristics
Figure 3 shows the temporal–spatial variation in energy consumption intensity among the 11 provinces. From 2005 to 2021, energy consumption intensity generally followed a rise-and-fall pattern, peaking around 2013–2016. The energy consumption intensity of each year presents a gradient decline from upstream to downstream. By 2021, energy intensity had significantly declined in most regions, except for Guizhou and Yunnan, which remained in a high-energy consumption state. It is attributed to the fact that the downstream Yangtze River Delta, with its higher economic development and industrial upgrading, has improved regional energy productivity growth and efficiency improvements in key industries. In the midstream, industrial relocation has led to a slower decline in energy intensity compared to downstream regions, as industries in these areas are still undergoing transition and technological upgrades. Meanwhile, the analysis suggests areas with high energy consumption such as Yunnan and Guizhou reflect strong energy dependence and a high proportion of energy-intensive industries, thus facing huge challenges in energy transformation.
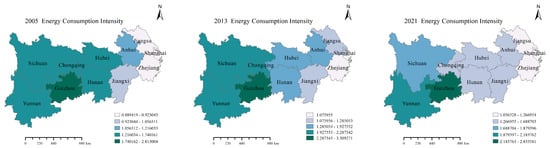
Figure 3.
The energy consumption intensity of the YREB’s 11 provinces in 2005, 2013, 2021.
5.1.3. The Decarbonization Level of Energy Consumption Structure Characteristics
Figure 4 illustrates a spatiotemporal variation in the decarbonization transition in energy consumption across the YREB. Throughout the research timeframe, all regions showed a steady increase in low-carbonization level of energy structure, indicating a rising share of non-fossil energy and a significant decline in carbon-containing energy consumption, showing a continuous progress in decarbonization. Zhejiang, Shanghai, Jiangsu, and the Sichuan-Chongqing region have formed efficient decarbonization clusters, while Yunnan, Guizhou, and Jiangxi lag behind in the decarbonization transition. The analysis suggests that coastal industrialized regions have a higher level of industrial upgrading, with strong awareness of technological advancement and clean energy adoption. By contrast, the Sichuan-Chongqing region has significant clean energy substitutes, such as hydropower. Meanwhile, regions like Yunnan and Guizhou are highly reliant on coal, resulting in weaker energy decarbonization.
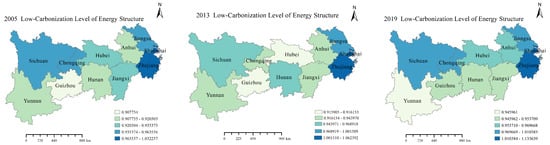
Figure 4.
The LCL of the energy structure of the YREB’s 11 provinces in 2005, 2013, 2021.
5.2. Analysis of Spatial Correlation
We conducted a spatial autocorrelation analysis of energy consumption, energy structure decarbonization levels, and carbon emissions among various areas to further examine their spatial clustering patterns. This study considers the Moran’s I calculation with geographical distance and adjacency distance weights. Table 2 displays Moran’s I values and their significance. Examining the results, energy intensity, the low-carbonization level of energy consumption structure, and per capita carbon emissions passed the significance test. Specifically, the statistical values for energy intensity ranged from 0.34 to 0.55, and for the low-carbonization level of energy consumption structure, the statistical values ranged from 0.20 to 0.42, indicating robust and pronounced spatial dependence. The statistical values for per capita carbon emissions exhibited a positive correlation that varied between 0.14 and 0.40.
Table 2.
The Moran’s I.
The spatial impact is clearer with geographic distance weighting. Figure 5 shows Moran’s I scatter plots based on geographical distance weights for the years 2005 and 2021. It can be observed that most provinces show clusters of both high and low values in energy intensity, low-carbonization level of energy consumption structure, and carbon emissions. Hence, employing spatial econometric models for the subsequent analysis is imperative.
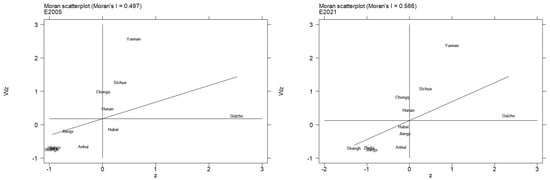
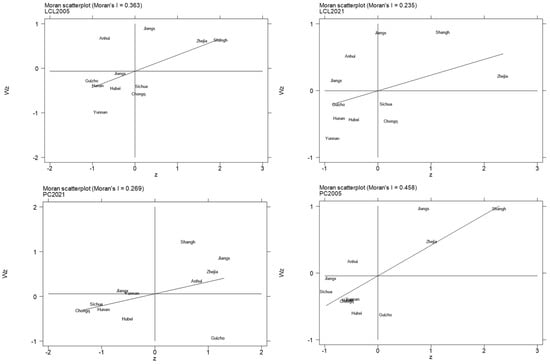
Figure 5.
Moran’s I distribution in 2005 and 2021.
5.3. Spatial Regression Results
In this part, we examine the relationships among factors through spatial regression. Firstly, after determining the basic form of the SDM, we use the Hausman test to determine if these measurement models should adopt the fixed or random effect. This study considers the Hausman test under two distance weights, as shown in Table 3. The results indicate that we can toss out the null hypothesis at the 1% significance threshold for both total and structural effect models of energy consumption, suggesting the fixed effects model should be adopted for regressions. In contrast, the Hausman statistic is negative for the carbon emissions model, supporting the application of random effects.
Table 3.
Model test settings.
To construct a valid spatial panel model, LM tests and Wald tests are performed again on the spatial measurement model data determined after the pattern is established. This method helps further evaluate whether the selected spatial econometric model’s parameter estimates are reasonable. LM tests and Wald tests for both scenarios comparing SAR and SEM models are summarized in Table 3. It can be observed that, whether under the geographical distance or spatial adjacency weight matrix, LM tests as well as Wald tests for the fixed effects model of total energy consumption and structural effects can remove the null hypothesis at the 1% threshold. Meanwhile, for the random effects model of carbon emissions, both LM tests and Wald tests can remove the null hypothesis at a 1% threshold. Therefore, the SDM cannot degenerate into SAR and SEM. Through these two tests, the rationale and accuracy of using the Spatial Durbin model are established.
The specific regression results are presented in Table 4. The advancement of industrial structure exhibits a U-curve relationship with total energy consumption intensity, which can be seen in column (1) of Table 4. This result implies that the regional energy consumption intensity continuously decreases as the industrial structure evolves. It begins to promote energy consumption in the region after reaching a certain level of industrial structure restructuring. Unlike the traditional inverted U-shaped relationship, this unique U-shaped pattern can be credited to the specific development context and regional features of the YREB. As a strategic corridor, the YREB has experienced a pressing need for rapid upgrading in the last ten years. While the state has promoted the development of underdeveloped regions, it has also strengthened environmental regulations in more economically advanced areas, driving industrial revolution and innovation. This results in a quick shift transformation during the early stages of industrial upgrading, with technological advancements and industrial clustering accelerating the process, which has greatly reduced the share of high-carbon industries, improved energy efficiency, and optimized resource coordination, thereby significantly lowering energy consumption. In the second phase of industrial upgrading, energy consumption increases due to several factors. First, the vast geographic scope of the YREB means that regions are at different stages of upgrading. In some areas, energy-intensive industries continue to expand, while urbanization and population influx drive up resource and infrastructure energy consumption. Second, as industrial upgrading enters a period of stable economic growth, emerging industries drive capacity growth and energy efficiency improvements, further promoting energy consumption. Additionally, the YREB’s abundant resources and widespread use of alternative energy may lead to higher energy consumption. These factors highlight the positive impact of the second phase of industrial upgrading on energy consumption. Consequently, prioritizing energy conservation and lower emissions measures is paramount in this stage.
Table 4.
Spatial regression results.
In Table 4, column (2) examines the regression of industrial upgrading on the low-carbonization level of energy consumption from a structural effect perspective, revealing a U-shaped impact. The analysis reveals that the improvement of industrial structure in the YREB indeed positively impacts the decarbonization of energy consumption. For example, industrial upgrading has facilitated the transformation of energy-intensive industries, enabling resource-dependent inland areas to break free from traditional economic constraints, and driving a shift toward technology-intensive, low-energy-consuming sectors in the traditional sectors. However, the YREB’s progression is imbalanced. In regions with incomplete industrial transformation and economic growth pressures, such as less-developed inland areas and the early stages of industrial upgrading in coastal areas, the rebound effect of improved energy efficiency significantly stimulates producers to generate more demand for high-carbon energy consumption. This negatively impacts the decarbonization of the energy consumption structure. The analysis suggests that during initial industrial upgrading, the adverse effect on energy consumption decarbonization significantly exceeds the benefits. As industrial upgrading progresses and the low-carbon energy-based production system matures, along with the growing technological spillovers in developed regions and the industrial transfer strategy, the negative impact gradually diminishes while the positive effects increase. This dynamic makes decoupling economic growth from carbon emissions increasingly achievable.
The results in column (3) indicate the industrial structure upgrading consistently suppresses carbon emissions, while energy consumption intensity and the low-carbonization level of the energy consumption structure, respectively, increase and decrease emissions. We can draw the following conclusions regarding the mechanism of industrial upgrading’s impact on carbon emissions combining the two curves of industrial upgrading on total energy consumption and structural effects discussed earlier. Specifically, in the early stages of industrial restructuring, the significant decrease in total energy consumption resulting from industrial upgrading offsets the influence of structural effects despite an increase in carbon content in the energy consumption structure. The net effect is the reduction in emissions at the stage. As industrial advancement progresses, the low-carbon level of the energy consumption structure continues to improve. Although the rapid expansion of emerging industries’ production capacity to drive economic growth significantly increases overall energy consumption, the large-scale implementation of clean and renewable energy solutions are helping to mitigate this environmental impact [101]. Under the dual effects of total energy usage as well as the shifting energy composition, carbon output continues to decrease. It suggests that the decarbonization trend in industrial upgrading positively impacts carbon emissions, balancing industrial development, economic growth, and emissions. Ultimately, the shift of regional production practices supports the gradual realization of high-quality development in the YREB. This conclusion underscores the significant potential for the sustainable economic growth of a region, indicating that, despite potential negative effects on energy consumption and structural decarbonization during industrial upgrading, the process still contributes to overall emission reduction and guides the region toward a greener, lower-carbon future.
In summary, the mechanism of industrial upgrading in terms of carbon emissions is complex. Results of regression using an adjacency distance weight matrix, as shown in columns (4)–(6), are generally compatible with the results using the geographical distance mentioned. This reaffirms the intrinsic mechanism by which industrial upgrading affects carbon emissions by transforming energy consumption patterns. This analysis provides a profound understanding of the impact of industrial advancement on emissions, exploring dual effects of energy consumption pattern transformation at different stages. This result also highlights the positive influence of the trend towards low-carbonization on carbon emissions.
5.4. Robustness Discussion
We tested different scenarios by replacing key variables (RV), incorporating lagged indicators (LI), and introducing additional factors (LF) to strengthen the dependability of spatial regression outcomes. The results are shown in Table 5. All subsequent analyses employ the geographical distance-based regression method, given that the model performed better with the geographical distance matrix.
Table 5.
Regression results.
Firstly, we substituted the level of industrial hierarchy upgrading () with the level of industrial factor upgrading () to highlight changes in labor factor proportions during the shift from lower to higher industrial structure levels (see columns (1)–(3)).
Secondly, we explored fixed-effects regression with a one-period lag for all indicators to address endogeneity concerns (see columns (4)–(6)).
Finally, we introduced the consideration of the industrial synergy aggregation factor () on emissions (column (7)). Findings confirm the stability of the fixed-effects regression, revealing industrial clustering’s positive influence on carbon emissions. Analysis suggests that industrial clustering in the YREB primarily involves the agglomeration of productive service industries and manufacturing sectors. It proves beneficial for lowering carbon emissions through several mechanisms, such as the rational allocation of industrial resources, improved technical efficiency, and shared infrastructure. However, its negative effects include the excessive concentration of production factors and the potential lag of the service sector in meeting the manufacturing industry’s production demands, leading to a relatively large increase in pollutant emissions. Overall, this results in a net promotion of emissions. Therefore, it is believed that the YREB’s industrial synergy emission reduction mechanism should be specifically implemented and improved.
The analysis and regression above validate the model’s robustness.
5.5. Regional Heterogeneity
Due to the vastness of the Yangtze River Basin, notable disparities in industrial organization and energy utilization exist among the upstream, midstream, and downstream areas. To better analyze how industrial restructuring affects carbon emissions across different regions, we divided the YREB into three zones: upstream (Chongqing, Sichuan, Yunnan, and Guizhou), midstream (Jiangxi, Hubei, and Hunan), and downstream (Shanghai, Jiangsu, Zhejiang, and Anhui). We aim to explore each area’s variations in how industrial upgrading affects carbon emissions by independently examining each section. The results in Table 6 show that the effects of energy use and industrial structure upgrading on emission intensity exhibit significant regional heterogeneity across the YREB. However, overall, carbon emissions are generally suppressed. Specifically, the significance of industrial restructuring increases from upstream to downstream, with the upstream region showing the weakest influence. The weak impact of industrial upgrading on emissions in upstream regions is essentially a complex result of the interplay among regional development gradients, industrial transfer paths, as well as institutional environments. Firstly, the upstream regions mainly serve as the receiving end of industrial transfer in the river basin’s division of labor, characterized by a high-carbon development model. Secondly, their industrial upgrading mainly involves processing stages of the industrial chain, such as the assembly of servers at the Guizhou big data center, while high-value-added stages like research and development, design, and others are still concentrated downstream. Therefore, the decrease in emission intensity per unit of output remains limited. Furthermore, coal consumption in the upstream provinces shows a dependency inertia, and there is insufficient clean energy consumption. The delayed energy transition undermines the effectiveness of emission reductions achieved through industrial structure modernization. Additionally, upstream regions are constrained by development gradients, with inadequate technological innovation and policy tool coverage. The ecological value cannot be fully marketized, industrialization is delayed, and the region remains dependent on resource-based endowments, adding more resistance to de-industrialization during the phase of industrial advancement.
Table 6.
Heterogeneity analysis of per capita carbon emission.
Conversely, midstream and downstream regions are at a crucial stage of transformation and upgrading, showing a high sensitivity of emissions to industrial upgrading levels. Midstream regions are notably influenced by policy and market-driven dynamics. For example, Hubei’s carbon trading market pilot program covers key enterprises, significantly improving energy efficiency. Additionally, green entry standards for industries taking over industrial transfers in the region have been raised (e.g., Jiangxi prohibits projects with energy consumption intensity exceeding the industry average). This has led to effective synergy between industrial upgrading and policies. Meanwhile, the downstream areas have advanced innovative technology, with green technologies growing steadily, and the penetration of the cconomic digitalization strengthening. Simultaneously, the regional environmental regulation intensity index is relatively high, which forces enterprises to achieve emission reduction transformation through technological substitution rather than end-of-pipe treatment.
Additionally, as industrial transfer mainly occurs in the downstream regions, the industries being transferred are relatively underdeveloped (such as resource processing and labor-intensive industries), leading to a substantial bump in carbon output in the receiving areas. Therefore, every unit improvement in the low-carbon level of the energy consumption structure will significantly impact carbon emissions in upstream and midstream areas. The impact of energy consumption intensity on emissions is most pronounced in upstream and midstream areas. However, in downstream areas, where industrial upgrading is at a more advanced stage, the effect of energy consumption on carbon output is more limited.
Based on this, we believe that the upstream regions currently should decrease reliance on carbon-intensive energy. This can be achieved by improving ecological carbon offset mechanisms, accelerating the use of hydropower and clean energy, developing low-carbon economies to replace traditional resource-based industries, and promoting energy transitions in towns to accelerate low-carbon development and enter a reasonable industrial upgrading process. The midstream regions need to reduce energy use, and given the current development context, industrial upgrading should be promoted reasonably. Policies such as improving the carbon market linkage system and carbon budgets for industrial transfers should be implemented, and advanced manufacturing clusters and green circular economies should be cultivated. The downstream regions are now in the latter phase of industrial progress, with industrial upgrading crucial for achieving emission reductions. Therefore, efforts should be made to strengthen digital-enabled manufacturing, transition to productive services, and utilize fiscal and tax incentives along with market-based regulatory measures. Moreover, regional heterogeneity highlights the challenges posed by varying development levels within the YREB, emphasizing the necessity of strengthening inter-regional cooperation. By facilitating the sharing of resources, technologies, and knowledge, energy transition can be accelerated, and sustainable economic growth promoted. For example, service-oriented cities in downstream regions can collaborate with midstream and upstream areas to transfer low-carbon technologies and facilitate the green migration of industries. Furthermore, cross-regional cooperation can align policy objectives, fostering more coordinated low-carbon transition strategies and minimizing redundant efforts. This underscores the importance of enhancing urban cooperation and industrial collaboration to advance low-carbon growth throughout the YREB.
6. Discussion
6.1. Findings and Correlations
This study reexamines the significance of industrial advancement and energy transformation in facilitating sustainable development in the context of carbon emissions. This study first examines the spatial and temporal distribution of carbon emissions, energy consumption, and energy decarbonization across the YREB, drawing on calculations of carbon output, energy intensity, energy decarbonization level, and industrial upgrading. Then, using a provincial panel dataset from the YREB spanning 2005 to 2021, we apply the Spatial Durbin Model to investigate the interconnection mechanism between industrial upgrading, total energy consumption, the low-carbon transformation of energy structure, and emission level. Our study yields several key findings:
The research identifies a “U-shaped” impact of industrial upgrading on both energy consumption intensity and the decarbonization of the energy consumption structure. Specifically, regarding energy intensity, our study reaches similar conclusions to those of Huang et al. [39] and Tao et al. [40], showing that industrial upgrading enhances energy efficiency and reduces energy consumption. However, the production capacity expansion as well as rising demand may partially or fully offset these energy savings. However, this study identifies a nonlinear, stage-dependent effect of industrial upgrading on energy consumption in the YREB, where it initially suppresses consumption before subsequently promoting it. This effect resembles the inverted N-shaped curve observed by Yao et al. [57], differing from the conventional inverted U-shaped curve found in prior studies. We attribute this difference to the region’s unique historical and developmental characteristics, including rapid industrialization and urbanization, imbalanced resource endowments, and the coexistence of both traditional high-carbon and emerging low-carbon industries. Regarding the transition of energy consumption structure, much like the research by Tao et al. [41], our study suggests that industrial upgrading drives energy structure transformation but is accompanied by an “energy rebound effect”. Once the flow of innovation elements surpasses a particular threshold, the low-carbon transformation effect strengthens. However, our study further characterizes and derives a U-shaped correlation curve between industrial upgrading and energy structure. We argue that as industrial upgrading progresses, the positive impact of changes in energy consumption patterns gradually outweighs the negative rebound effect, resulting in the energy consumption low-carbon index first decreasing and then increasing. This highlights the regional positive shift towards low-carbon development. Therefore, initial industrial upgrading must balance economic development with lowering emissions. Focus should be placed on increasing technological investments, raising the proportion of renewable and green energy, and facilitating energy transformation. In a later stage, when the industrial upgrading is more advanced, the focus should shift to promoting innovation in energy-saving services, establishing carbon budget mechanisms, and implementing relevant policies to further reduce energy consumption.
Fan et al. [61] also explored the influence of industrial upgrading on energy intensity, energy structure, and carbon emissions within a unified framework, addressing spatial heterogeneity. However, our study further uncovers the underlying mechanisms of carbon emission reduction by examining the comprehensive effects of industrial upgrading at different stages on energy intensity and energy structure transformation—an angle not thoroughly explored in previous research. Results show that, in the early stages, industrial structural changes lead to a reduction in the low-carbonization level of the energy structure, but overall emissions are reduced because of the overall decrease in energy use. As industries continue to optimize and low-carbon energy sources become more widely adopted, the energy consumption pattern gradually shifts towards high-quality development, maintaining a significant suppression effect on emissions. These findings were confirmed after multiple robustness checks. Furthermore, it also demonstrates that the incomplete industrial synergy elements in the study area have a detrimental effect on emission reduction. Thus, the YREB should accelerate industrial upgrading and adjustments based on the region’s development status, as this is critical to the emission reduction process. Additionally, the government’s strategies for industrial synergy in emission reduction must be targeted and tailored to specific industries.
Finally, our research offers a thorough examination of regional heterogeneity in the upstream, midstream, and downstream areas. Consistent with Yuan et al. [69], we find that the downstream region shows the most significant impact of industrial upgrading on emissions. As a region with advanced industrialization, its energy transition exerts a more moderate effect on emissions. This impact increases from downstream to upstream, which underscores the importance of industrial upgrading in decoupling economic growth from carbon emissions in various regions. Furthermore, this work contributes to the discussion of ecological equity by revealing how internal development disparities within the YREB either hinder or facilitate observed patterns. Specifically, the midstream and downstream regions, undergoing critical industrial transformation, rely on policy and technological innovation as the main drivers. Conversely, the upstream areas, with lower industrial capacity and higher environmental costs, require policies such as ecological compensation, financial aid, technology transfer, and infrastructure development to ensure equitable participation in the low-carbon transition. While prior research has primarily focused on national-level transitions, this study highlights the importance of regional differences and posits that urban cooperation and industrial collaboration within regions are essential for maximizing emission reduction potential. For example, service-oriented cities in downstream areas can collaborate with midstream and upstream regions to transfer low-carbon technologies and facilitate green industrial migration. Such collaboration reduces redundant efforts and generates synergistic effects for regional emission reductions. These findings offer valuable insights for developing tailored carbon reduction policies in specific regions.
6.2. Future Research Directions
(1) Since the research relies on provincial statistics, it may not fully capture the internal disparities in energy consumption and carbon emissions within regions. Future research could refine the analysis using city or industry-level data within the YREB, expanding heterogeneity analysis to encompass dimensions including industrial types, technology advancement, and policy implementation. In addition, the study period is limited to 2005–2021 due to data availability. Future research could extend the temporal scope as more recent data become available. (2) This study highlights the imbalance in regional industrial development. Future studies should look more closely at the role of urban cooperation and industrial collaboration in facilitating the low-carbon transition of the YREB. It would be valuable to investigate how cities and industries can enhance technology, resource, and knowledge sharing through collaboration, providing useful insights for regional sustainable development. (3) To mitigate the negative impacts of industrial upgrading on regional equity, future studies could delve into the effectiveness of ecological compensation mechanisms in supporting regions facing significant environmental and economic challenges, like the upstream areas of the YREB.
7. Conclusions
7.1. Research Conclusions
Our research analyzes the spatiotemporal distribution of regional industrial upgrading, energy transition, and carbon emissions based on provincial statistics of the YREB spanning 2005 to 2021. Utilizing the SDM model, it underscores the pivotal influence of industrial upgrading on energy consumption patterns and carbon emission trends in the YREB. Key conclusions include: (1) Carbon emissions and energy decarbonization have demonstrated a general upward trend, with higher values observed in both upstream and downstream regions. Energy intensity initially rises and then declines, progressively decreasing from upstream to downstream. (2) A U-shaped correlation exists between industrial upgrading and energy consumption, initially lower energy consumption, but later, production expansion, increased energy demand, along with the rebound effect, result in a rise in total energy consumption. (3) The relationship between industrial upgrading and energy structure decarbonization follows a U-shaped pattern. Initially, the positive effects of industrial upgrading (such as technological progress and clean energy use) are outweighed by negative effects (such as reliance on high-carbon energy during early economic stages), inhibiting decarbonization. Over time, the positive effects surpass the negative ones, facilitating energy structure decarbonization. (4) Heterogeneity analysis indicates that emission reduction effects of industrial upgrading are more noticeable in the midstream, as well as downstream regions, where energy transition is crucial to reducing emissions. Therefore, emission reduction strategies should be region-specific, accounting for local development and resource conditions.
7.2. Research Implications
Conclusions of this paper offer critical guidance to policymakers and industry leaders for promoting low-carbon development in the YREB. Firstly, from the perspective of different stages of industrial upgrading, in early and mid-stages, the level of decarbonization in energy structure needs to be improved. Efforts should concentrate on expanding the clean, alternative energy utilization and prioritizing the reduction in dependency on carbon-intensive sectors. In the industrial upgrading’s later stages, as energy consumption continues to rise, the focus should shift to promoting innovative energy-saving strategies and regulations to slow the growth of energy consumption. Secondly, regarding regional distribution differences, upstream areas are constrained by regional development gradients, industrial transfer pathways, and institutional environments. Efforts should focus on reducing reliance on high-carbon energy, strengthening ecological compensation, and providing technological support. In midstream areas, where policy and market forces are strong, the focus should be on responding to policies that accelerate energy use and industrial upgrading while raising the green standards for industrial transfer. Downstream areas, currently undergoing critical stages of transformation, should prioritize innovation incentives and the shift toward the service industry. Furthermore, strengthening the coordination among regional cities and industries is conducive to the overall emission reduction process. These strategies are crucial for achieving the carbon peak and carbon neutrality goals of the YREB.
7.3. Policy Recommendations
The subsequent policy suggestions are presented:
- Vigorously promote industrial structure upgrading and foster synergy among industries. Industrial restructuring propels a profound transformation in energy structure, crucial for local economic development decoupled from carbon emissions. It is suggested that the government should incentivize companies to invest in technology, enhance efficiency, and drive industries towards greater intelligence and sophistication. In addition, improving fiscal incentives and tax policies to boost the competitiveness of the companies is also necessary. In exploring industrial synergy for emission reduction, it is believed that the government is able to guide optimized industrial layout and facilitate interdepartmental, cross-industry collaboration mechanisms. It is also believed that a more significant carbon emission reduction can be achieved through jointly formulating carbon reduction goals and plans, leveraging the spatial effects of industrial synergy clustering, facilitating effective spatial circulation of resources, and addressing resource mismatches.
- Accelerate the pace of optimizing the energy structure, paying attention to potential energy rebound effects and ensuring a smooth energy transition. In terms of energy utilization, we emphasize the importance of enhancing energy efficiency. The government is supposed to intensify efforts to improve energy efficiency and incentivize firms to use sustainable energy and advanced technology to decrease per-product energy use. Furthermore, focusing on the negative impacts of energy rebound effects is necessary. Such as regular assessments and monitoring of implemented energy-saving measures to ensure their anticipated effects, formulations of comprehensive energy policies covering technological innovation, markets, and value drive sustainable energy development and lower overall consumption. Additionally, the government ought to foster broad implementation of eco-friendly energy sources by policy guidance and market incentives, especially in emerging industries. Moreover, establishing energy harmony in the YREB and optimizing the allocation of energy resources can reduce energy waste.
- Tailor policies based on local conditions, strengthen the effective empowerment of the industry–energy structure upgrading on carbon emissions across different times and spaces. The mechanisms for inhibiting carbon emissions vary at different stages of industrial advancement, and the impact of inhibiting emissions has significant regional differences in the YREB. This means that provinces should tailor strategies for high-quality industrial development based on their unique characteristics. For example, developed downstream regions with advanced industrial upgrading should capitalize on their high-tech industries, accelerate the shift from manufacturing to services, and implement energy-saving measures to mitigate rebound effects. Additionally, they can drive industrial upgrading in midstream and upstream regions through innovation and capacity spillovers. Midstream regions, currently in a critical phase of industrial transformation, should optimize their energy mix and strengthen market mechanisms. By leveraging existing industrial infrastructure, they can foster innovation clusters and set higher environmental standards for industrial transfers to ensure sustainable growth. Upstream regions should reassess their industrial resource structure and development strategies while prioritizing ecological protection. Strengthening ecological compensation mechanisms, enhancing emission reduction policies, and strategically utilizing limited resources will be key to accelerating energy transition and industrial upgrading.
Author Contributions
S.G.: conceptualization, methodology, software, data curation, writing—original draft, writing—review and editing. X.Y.: conceptualization, writing—review and editing, supervision. All authors have read and agreed to the published version of the manuscript.
Funding
This work is financially supported by the National Natural Science Foundation of China [Grant No. 42071278]; the Fundamental Research Funds for the Central Universities [Grant No. B230207002]; and Key Projects of Jiangsu Social Science Foundation [Grant No. 21GLA006].
Institutional Review Board Statement
Not applicable.
Informed Consent Statement
Not applicable.
Data Availability Statement
Data will be made available upon reasonable request.
Acknowledgments
We appreciate all the researchers who provided information and assistance for this study.
Conflicts of Interest
The authors declare no conflicts of interest.
Abbreviations
| SDM | the Spatial Durbin Model |
| RV | Replacing Key Variables |
| LI | Incorporating Lagged Indicators |
| LF | Introducing Additional Factors |
References
- Zheng, J.; Wu, S.; Li, S.; Lei, Y.; Li, L.; Fan, X. Role of Global Value Chain Changes in Decoupling CO2 Emissions from Economic Growth in Chinese Provinces. Struct. Chang. Econ. Dyn. 2025, 72, 193–208. [Google Scholar] [CrossRef]
- Ali, M.; Xiaoying, L.; Mehmood, S.; Khan, M.A.; Oláh, J. Assessing the Impact of FDI, CO2 Emissions, Economic Growth, and Income Inequality on Renewable Energy Consumption in Asia. Energy Strategy Rev. 2025, 58, 101653–101671. [Google Scholar] [CrossRef]
- Habimana Simbi, C.; Yao, F.; Zhang, J. Sustainable Development in Africa: A Comprehensive Analysis of GDP, CO2 Emissions, and Socio-Economic Factors. Sustainability 2025, 17, 679. [Google Scholar] [CrossRef]
- Yan, J.; Jie, Q. Mechanisms of Policy Intervention for China’s Transformation of the Low-Carbon Economy. J. Clean. Prod. 2025, 487, 144550. [Google Scholar] [CrossRef]
- Ma, Z.; Zhang, P. Myth of the Digital Economy: Can It Continually Contribute to a Low-Carbon Status and Sustainable Development? Environ. Impact Assess. Rev. 2025, 110, 107688–107697. [Google Scholar] [CrossRef]
- Yu, C.; Jin, H. Labor Agglomeration, Industrial Structure Upgrading and Low-Carbon Economic Development. Financ. Res. Lett. 2025, 74, 106703–106710. [Google Scholar] [CrossRef]
- Dong, B.; Zhang, Z.; Zhou, C. Towards a Just Chinese Energy Transition: Socioeconomic Considerations in China’s Carbon Neutrality Policies. Energy Res. Soc. Sci. 2025, 119, 103855–103866. [Google Scholar] [CrossRef]
- Huang, C.; Guo, J.; Zhang, Z.; Li, N.; Zhu, A.; Liu, Y.; Chen, X.; Sun, B. Indirect Economic Benefits of Energy Consumption Changes under China’s Carbon Neutrality Goal. Energy 2025, 317, 134692–134705. [Google Scholar] [CrossRef]
- Jiang, W.; Sun, Y. Which Is the More Important Factor of Carbon Emission, Coal Consumption or Industrial Structure? Energy Policy 2023, 176, 113508. [Google Scholar] [CrossRef]
- Zhang, L.; Zhang, J. Evaluation and Promotion Path of High-Quality Development in the Chinese Construction Industry under the Context of Carbon Neutrality. Environ. Dev. Sustain. 2024, 2024, 1–32. [Google Scholar] [CrossRef]
- Zheng, J.; Shi, J.; Lin, F.; Hu, X.; Pan, Q.; Qi, T.; Ren, Y.; Guan, A.; Zhang, Z.; Ling, W. Reducing Manufacturing Carbon Emissions: Optimal Low Carbon Production Strategies Respect to Product Structures and Batches. Sci. Total Environ. 2023, 858, 159916. [Google Scholar] [CrossRef]
- Zhao, Q.; Jiang, M.; Zhao, Z.; Liu, F.; Zhou, L. The Impact of Green Innovation on Carbon Reduction Efficiency in China: Evidence from Machine Learning Validation. Energy Econ. 2024, 133, 107525. [Google Scholar] [CrossRef]
- Zhang, X.; Sun, J.; Zhang, X.; Wang, F. Assessment and Regression of Carbon Emissions from the Building and Construction Sector in China: A Provincial Study Using Machine Learning. J. Clean. Prod. 2024, 450, 141903. [Google Scholar] [CrossRef]
- Ouyang, X. Energy Efficiency Performance of the Industrial Sector: From the Perspective of Technological Gap in Different Regions in China. Energy 2021, 214, 118865. [Google Scholar] [CrossRef]
- Hu, S.; Yuan, Z.; Wang, A. Improving Carbon Emission Efficiency in Chinese Manufacturing: A Study Considering Technological Heterogeneity and Noise. Energy 2024, 291, 130392. [Google Scholar] [CrossRef]
- Zhu, B.; Shan, H. Impacts of Industrial Structures Reconstructing on Carbon Emission and Energy Consumption: A Case of Beijing. J. Clean. Prod. 2020, 245, 118916. [Google Scholar] [CrossRef]
- Zeng, S.; Li, T.; Wu, S.; Gao, W.; Li, G. Does Green Technology Progress Have a Significant Impact on Carbon Dioxide Emissions? Energy Econ. 2024, 133, 107524. [Google Scholar] [CrossRef]
- Fan, G.; Zhu, A.; Xu, H. Analysis of the Impact of Industrial Structure Upgrading and Energy Structure Optimization on Carbon Emission Reduction. Sustainability 2023, 15, 3489. [Google Scholar] [CrossRef]
- Liu, L.; Yang, Y.; Liu, S.; Gong, X.; Zhao, Y.; Jin, R.; Duan, H.; Jiang, P. A Comparative Study of Green Growth Efficiency in Yangtze River Economic Belt and Yellow River Basin between 2010 and 2020. Ecol. Indic. 2023, 150, 110214. [Google Scholar] [CrossRef]
- Yang, X.; Ran, G. Factors Influencing the Coupled and Coordinated Development of Cities in the Yangtze River Economic Belt: A Focus on Carbon Reduction, Pollution Control, Greening, and Growth. J. Environ. Manage. 2024, 370, 122499. [Google Scholar] [CrossRef]
- Han, D.; Sun, P.; Bi, C.; Shi, Z. Whether the Development Strategy of the Yangtze River Economic Belt Can Achieve the Double Welfare Effects of Synergistic Governance of Pollution Control and Carbon Reduction? Urban Clim. 2024, 56, 102083–102099. [Google Scholar] [CrossRef]
- Wang, W.; Yang, G. Sustainable Carrying Capacity: Integrating SDGs to Assess Evidence of Sustainable Development: A Case Study of the Yangtze River Economic Belt in China. J. Clean. Prod. 2025, 486, 144569. [Google Scholar] [CrossRef]
- Wang, X.; Shen, Y.; Su, C. Spatial - Temporal Evolution and Driving Factors of Carbon Emission Efficiency of Cities in the Yellow River Basin. Energy Rep. 2023, 9, 1065–1070. [Google Scholar] [CrossRef]
- Yang, Z.; Duan, J.; Fan, N. Towards Carbon Neutrality: The Decoupling Effect of Industrial Restructuring and Non-Fossil Energy Substitution on Carbon Emissions. Energy 2024, 308, 132787–132797. [Google Scholar] [CrossRef]
- Li, K.; Qi, S.; Shi, X. Environmental Policies and Low-Carbon Industrial Upgrading: Heterogenous Effects among Policies, Sectors, and Technologies in China. Technol. Forecast. Soc. Chang. 2023, 191, 122468–122484. [Google Scholar] [CrossRef]
- Bai, T.; Qi, Y.; Li, Z.; Xu, D. Digital Economy, Industrial Transformation and Upgrading, and Spatial Transfer of Carbon Emissions: The Paths for Low-Carbon Transformation of Chinese Citie. Ournal Environ. Manag. 2023, 344, 118528. [Google Scholar] [CrossRef]
- Hu, L.; Yuan, W.; Jiang, J.; Ma, T.; Zhu, S. Asymmetric Effects of Industrial Structure Rationalization on Carbon Emissions: Evidence from Thirty Chinese Provinces. J. Clean. Prod. 2023, 428, 139347–139361. [Google Scholar] [CrossRef]
- Wang, L.; Chen, Q.; Dong, Z.; Cheng, L. The Role of Industrial Intelligence in Peaking Carbon Emissions in China. Technol. Forecast. Soc. Chang. 2024, 199, 123005. [Google Scholar] [CrossRef]
- Dong, M.; Wang, G.; Han, X. Impacts of Artificial Intelligence on Carbon Emissions in China: In Terms of Artificial Intelligence Type and Regional Differences. Sustain. Cities Soc. 2024, 113, 105682. [Google Scholar] [CrossRef]
- Lu, Y.; Chen, S. Exploring the Realization Pathway of Carbon Peak and Carbon Neutrality in the Provinces around the Yangtze River of China. J. Clean. Prod. 2024, 466, 142904. [Google Scholar] [CrossRef]
- Zhan, J.; Wang, C.; Wang, H.; Zhang, F.; Li, Z. Pathways to Achieve Carbon Emission Peak and Carbon Neutrality by 2060: A Case Study in the Beijing-Tianjin-Hebei Region, China. Renew. Sustain. Energy Rev. 2024, 189, 113955. [Google Scholar] [CrossRef]
- Wu, R.; Yu, G.; Cao, Y. The Impact of Industrial Structural Transformation in the Yangtze River Economic Belt on the Trade-Offs and Synergies between Urbanization and Carbon Balance. Ecol. Indic. 2025, 171, 113165–113177. [Google Scholar] [CrossRef]
- Cai, Z.; Ding, X.; Zhou, Z.; Han, A.; Yu, S.; Yang, X.; Jiang, P. Fiscal Decentralization’s Impact on Carbon Emissions and Its Interactions with Environmental Regulations, Economic Development, and Industrialization: Evidence from 288 Cities in China. Environ. Impact Assess. Rev 2025, 110, 107681. [Google Scholar] [CrossRef]
- Sun, Z.; Sun, Y.; Liu, H.; Cheng, X. Impact of Spatial Imbalance of Green Technological Innovation and Industrial Structure Upgradation on the Urban Carbon Emission Efficiency Gap. Stoch Env. Res Risk Assess 2023, 37, 2305–2325. [Google Scholar] [CrossRef]
- Yu, Z.; Kanwal, Q.; Wang, M.; Nurdiawati, A.; Al-Ghamdi, S.G. Spatiotemporal Dynamics and Key Drivers of Carbon Emissions in Regional Construction Sectors: Insights from a Random Forest Model. Clean. Environ. Syst. 2025, 16, 100257–100270. [Google Scholar] [CrossRef]
- Li, X.; Liu, Y. The Economic Spillover Effect of the Collaborative Agglomeration between Manufacturing and Producer Services. Sustainability 2024, 16, 5343. [Google Scholar] [CrossRef]
- He, W.; Li, Y.; Meng, X.; Song, M.; Ramsey, T.S.; An, M. Will Green Technological Progress Help Industrial Collaborative Agglomeration Increase Regional Carbon Productivity: Evidence from Yangtze River Delta Urban Agglomerations. Environ. Dev. Sustain. 2024, 26, 26019–26046. [Google Scholar] [CrossRef]
- Tao, W.; Weng, S.; Chen, X.; ALHussan, F.B.; Song, M. Artificial Intelligence-Driven Transformations in Low-Carbon Energy Structure: Evidence from China. Energy Econ. 2024, 136, 107719. [Google Scholar] [CrossRef]
- Huang, C.; Lin, B. The Impact of Digital Economy on Energy Rebound Effect in China: A Stochastic Energy Demand Frontier Approach. Energy Policy 2025, 196, 114418. [Google Scholar] [CrossRef]
- Tao, M.; Poletti, S.; Wen, L.; Sheng, M.S. Modelling the Role of Industrial Structure Adjustment on China’s Energy Efficiency: Insights from Technology Innovation. J. Clean. Prod. 2024, 441, 140861. [Google Scholar] [CrossRef]
- Zhao, J.; Jiang, Q.; Dong, X.; Dong, K.; Jiang, H. How Does Industrial Structure Adjustment Reduce CO2 Emissions? Spatial and Mediation Effects Analysis for China. TEnergy Econ. 2022, 105, 105704. [Google Scholar] [CrossRef]
- Wang, P.; Xu, X. Green Finance and Energy Efficiency Improvement: The Role of Green Innovation and Industrial Upgrading. Innov. Green Dev. 2025, 4, 100200. [Google Scholar] [CrossRef]
- Li, B.; Tu, Y.; Liu, J. Impact of Industrial Transformation and Upgrading Demonstration Zones on Carbon Emissions Intensity in Resource-Based Cities. J. Environ. Plann. Manage. 2025, 68, 1037–1056. [Google Scholar] [CrossRef]
- Feng, Y.; Gao, Y.; Meng, X.; Shi, J.; Shi, K.; Hu, S.; Jia, F. The Impacts of Casual Environmental Regulation on Carbon Intensity in China: Dual Mediating Pathways of Energy Low-Carbon Reconstitution and Industrial Structure Upgrading. Environ. Res. 2023, 238, 117289–117302. [Google Scholar] [CrossRef]
- Dong, Z.; Ding, H.; Yu, X.; Zhou, D. Analyzing the Dynamic Effect of Energy Endowment-Demand Distortion on Sustainable Development: Insights from China’s Regional Disparity. J. Environ. Manage. 2024, 366, 121647. [Google Scholar] [CrossRef]
- Hou, X.; Ji, J. A Multi-Objective Optimization Approach for Interprovincial Carbon Emission Reduction in China: Considering Industrial Structure and Ownership Attributes. J. Environ. Manage. 2025, 373, 123646–123663. [Google Scholar] [CrossRef]
- Shen, L.; Yuan, Q.; He, Q.; Jiang, P.; Ji, H.; Shi, J. Simulation and Pathway Selection for China’s Carbon Peak: A Multi-Objective Nonlinear Dynamic Optimization Approach. Sustainability 2025, 17, 154. [Google Scholar] [CrossRef]
- Zhu, B.; Zhang, T. The Impact of Cross-Region Industrial Structure Optimization on Economy, Carbon Emissions and Energy Consumption: A Case of the Yangtze River Delta. Sci. Total Environ. 2021, 778, 146089. [Google Scholar] [CrossRef]
- Gao, X.; Luo, X.; Liu, X. Thresholds to Rural Energy Transition: The Multistage Effects of Urbanization on the Rural Household Energy Consumption Structure. Energy 2025, 315, 135121–135137. [Google Scholar] [CrossRef]
- Tian, J.; Abbasi, K.R.; Radulescu, M.; Jaradat, M.; Barbulescu, M. Reevaluating Energy Progress: An in-Depth Policy Framework of Energy, Urbanization, and Economic Development. Energy Policy 2024, 191, 114196–114210. [Google Scholar] [CrossRef]
- Zhao, D.; Yuan, J.; Fu, S.; Song, Y.; Wang, Y.; Liu, Y.; Zhang, J. Does Economic Growth Stimulate Energy Consumption? New Evidence from National and Regional Levels in China. J. Popul. Resour. Environ. 2023, 21, 60–70. [Google Scholar] [CrossRef]
- Wang, L.; Zhang, H.; Xia, M.; Ma, J. Can Chinese Household Consumption Become More Energy Efficient? Analysis Based on Input–Output and Demand System Models. Energy Econ. 2025, 141, 108116. [Google Scholar] [CrossRef]
- Ma, X.; Li, C.; Kang, Q.; Chen, D.; Sun, Q. Rural Household Nonagricultural Income and Energy Transition: Evidence from Central China. Energy Policy 2024, 188, 114099. [Google Scholar] [CrossRef]
- Song, X.; Adam, N.A.; Manzoor, Z.; Mirzaliev, S.; Ullah, M.; Xabibullayev, D.; Diang, Y. Examining Household Energy Efficiency in China: Socioeconomic Influences and Policy Recommendations. Sustain. Futur. 2025, 9, 100504. [Google Scholar] [CrossRef]
- Kurniawan, T.A.; Liang, X.; Goh, H.H.; Dzarfan Othman, M.H.; Anouzla, A.; Al-Hazmi, H.E.; Chew, K.W.; Aziz, F.; Ali, I. Leveraging Food Waste for Electricity: A Low-Carbon Approach in Energy Sector for Mitigating Climate Change and Achieving Net Zero Emission in Hong Kong (China). J. Environ. Manage. 2024, 351, 119879. [Google Scholar] [CrossRef]
- Wang, Y. A Novel Structure Adaptive New Information Priority Grey Bernoulli Model and Its Application in China’s Renewable Energy Production. Renew. Energy 2025, 239, 122052. [Google Scholar] [CrossRef]
- Yao, Y.; Shen, Y.; Liu, K. Investigation of Resource Utilization in Urbanization Development: An Analysis Based on the Current Situation of Carbon Emissions in China. Resour. Policy 2023, 82, 103442. [Google Scholar] [CrossRef]
- Liu, C.; Tang, C.; Liu, Y. Does the Transformation of Energy Structure Promote Green Technological Innovation? A Quasi–Natural Experiment Based on New Energy Demonstration City Construction. Geosci. Front. 2024, 15, 101615. [Google Scholar] [CrossRef]
- Zhu, H.; Cao, S.; Su, Z.; Zhuang, Y. China’s Future Energy Vision: Multi-Scenario Simulation Based on Energy Consumption Structure under Dual Carbon Targets. Energy 2024, 301, 131751. [Google Scholar] [CrossRef]
- Xu, G.; Schwarz, P.; Yang, H. Adjusting Energy Consumption Structure to Achieve China’s CO2 Emissions Peak. Renew. Sustain. Energy Rev. 2020, 122, 109737. [Google Scholar] [CrossRef]
- Fan, J.; Wang, J.; Qiu, J.; Li, N. Stage Effects of Energy Consumption and Carbon Emissions in the Process of Urbanization: Evidence from 30 Provinces in China. Energy 2023, 276, 127655. [Google Scholar] [CrossRef]
- Yin, K.; Shen, X. Spatial Effects of New Quality Productivity on the Low-Carbon Transformation of Energy Consumption Structure—Evidence from Provincial Data in China. Sustainability 2025, 17, 2091. [Google Scholar] [CrossRef]
- Peng, Y.; Liao, H.; Wang, F.; Ye, H. Optimal Path of China’s Economic Structure and Energy Demand to Carbon Neutrality. Energy Econ. 2025, 141, 108046–108058. [Google Scholar] [CrossRef]
- Feng, Y.; Yan, T.; Zhang, C.; Zhang, Z.; Pan, Y. Assessing the Internal Nexus of Energy Transition at the Global Level: Insights from Triple Aspects of Scale, Structure, and Efficiency. Energy 2025, 320, 135039–135058. [Google Scholar] [CrossRef]
- Cansino, J.M.; Ordóñez, M.; Prieto, M. Decomposition and Measurement of the Rebound Effect: The Case of Energy Efficiency Improvements in Spain. Appl. Energy 2022, 306, 117961. [Google Scholar] [CrossRef]
- Khezri, M.; Heshmati, A.; Khodaei, M. Environmental Implications of Economic Complexity and Its Role in Determining How Renewable Energies Affect CO2 Emissions. Appl. Energy 2022, 306, 117948. [Google Scholar] [CrossRef]
- Nundy, S.; Ghosh, A.; Mesloub, A.; Albaqawy, G.A.; Alnaim, M.M. Impact of COVID-19 Pandemic on Socio-Economic, Energy-Environment and Transport Sector Globally and Sustainable Development Goal (SDG). J. Clean. Prod. 2021, 312, 127705. [Google Scholar] [CrossRef] [PubMed]
- Hassan, Q.; Viktor, P.J.; Al-Musawi, T.; Mahmood Ali, B.; Algburi, S.; Alzoubi, H.M.; Khudhair Al-Jiboory, A.; Zuhair Sameen, A.; Salman, H.M.; Jaszczur, M. The Renewable Energy Role in the Global Energy Transformations. Renew. Energy Focus 2024, 48, 100545. [Google Scholar] [CrossRef]
- Yuan, L.; Li, R.; Wu, X.; He, W.; Kong, Y.; Ramsey, T.S.; Degefu, D.M. Decoupling of Economic Growth and Resources-Environmental Pressure in the Yangtze River Economic Belt, China. Ecol. Indic. 2023, 153, 110399. [Google Scholar] [CrossRef]
- Liu, H.; Yin, W.; Yan, F.; Cai, W.; Du, Y.; Wu, Y. A Coupled STIRPAT-SD Model Method for Land-Use Carbon Emission Prediction and Scenario Simulation at the County Level. Environ. Impact Assess. Rev. 2024, 108, 107595. [Google Scholar] [CrossRef]
- Dong, Y.; Zhao, Y.; Zhang, J.; Liu, P. Development of a Framework of Carbon Accounting and Management on the Township Level in China. J. Environ. Manage. 2022, 318, 115609. [Google Scholar] [CrossRef]
- Nguyen, D.K.; Huynh, T.L.D.; Nasir, M.A. Carbon Emissions Determinants and Forecasting: Evidence from G6 Countries. J. Environ. Manage. 2021, 285, 111988. [Google Scholar] [CrossRef]
- Tang, K.; Yang, G. Does Digital Infrastructure Cut Carbon Emissions in Chinese Cities? Sustain. Prod. Consum. 2023, 35, 431–443. [Google Scholar] [CrossRef]
- Ren, Y.-S.; Ma, C.-Q.; Apergis, N.; Sharp, B. Responses of Carbon Emissions to Corruption across Chinese Provinces. Energy Econ. 2021, 98, 105241. [Google Scholar] [CrossRef]
- Xie, W. Q,; Gao, K.; Yu, J.F. Digital economy, industrial structure upgrading and carbon emissions. Stat. Decis. 2022, 38, 114–118. [Google Scholar] [CrossRef]
- Li, Y.; Lin, Y.; Su, B. Analysis of China’s Energy Consumption and Intensity during the 13th Five-Year Plan Period. Energy Policy 2025, 198, 114433. [Google Scholar] [CrossRef]
- Qu, C. Research on the Spatial and Temporal Impact of Commercial Banks’ Spatial Agglomeration on PM2.5 Pollution in China. Energy Environ. 2024, 958305X241238326. [Google Scholar] [CrossRef]
- Tang, X.; Lv, C.; An, K. Development Levels of Low-Carbon Economy at Provincial Scales in China(in Chinese). Resour. Science. 2011, 33, 612–619. [Google Scholar]
- Wan, Y.; Sheng, N.; Wei, X.; Su, H. Study on the Spatial Spillover Effect and Path Mechanism of Green Finance Development on China’s Energy Structure Transformation. J. Clean. Prod. 2023, 415, 137820. [Google Scholar] [CrossRef]
- Zheng, J.; Yuan, B.; Wu, J.; Chen, S. The Impact of Manufacturing Agglomeration on Green Development Performance: Evidence from the Yangtze River Economic Belt in China. J. Clean. Prod. 2024, 471, 143407. [Google Scholar] [CrossRef]
- Li, R.; Luo, Y. Green Credit and Regional Industrial Structure Upgrading: Evidence from China. Financ. Res. Lett. 2024, 65, 105472. [Google Scholar] [CrossRef]
- Ling, L.; Chen, X.; Zhao, X. Energy Inequality and Carbon Emission Efficiency: From the Perspective of Environmental Regulation. Environ. Dev. Sustain. 2024, 2024, 1–28. [Google Scholar] [CrossRef]
- Liang, S.; Wang, P.; Jia, C.; Zhu, J. Studying Green Financing, Factor Allocation Efficiency, and Regional Productivity Growth in Renewable Energy Industries. Renew. Energy 2023, 214, 130–139. [Google Scholar] [CrossRef]
- Lv, K.; Pan, M.; Huang, L.; Song, D.; Qian, X. Can Intellectual Property Rights Protection Reduce Air Pollution? A Quasi-Natural Experiment from China. Struct. Chang. Econ. Dyn. 2023, 65, 210–222. [Google Scholar] [CrossRef]
- Zhang, R.; Gao, Q.; Gao, K. Impact of Marine Industrial Agglomeration on the High-Quality Development of the Marine Economy—A Case Study of China’s Coastal Areas. Ecol. Indic. 2024, 158, 111410. [Google Scholar] [CrossRef]
- Tian, Y.; Zhang, Y.; Zhang, T.; Zhu, Y. Co-Agglomeration, Technological Innovation and Haze Pollution: An Empirical Research Based on the Middle Reaches of the Yangtze River Urban Agglomeration. Ecol. Indic. 2024, 158, 111492–111508. [Google Scholar] [CrossRef]
- Ding, J.; Liu, B.; Shao, X. Spatial Effects of Industrial Synergistic Agglomeration and Regional Green Development Efficiency: Evidence from China. Energy Econ. 2022, 112, 106156. [Google Scholar] [CrossRef]
- Wu, Y.; Zong, T.; Shuai, C.; Jiao, L. How Does New-Type Urbanization Affect Total Carbon Emissions, per Capita Carbon Emissions, and Carbon Emission Intensity? An Empirical Analysis of the Yangtze River Economic Belt, China. J. Environ. Manag. 2024, 349, 119441. [Google Scholar] [CrossRef]
- Ma, D.; Yan, Y.; Xiao, Y.; Zhang, F.; Zha, H.; Chang, R.; Zhang, J.; Guo, Z.; An, B. Research on the Spatiotemporal Evolution and Influencing Factors of Urbanization and Carbon Emission Efficiency Coupling Coordination: From the Perspective of Global Countries. J. Environ. Manag. 2024, 360, 121153. [Google Scholar] [CrossRef]
- Zhang, X.; Cheng, K.; Zou, Z.; Wang, Z. The Effect of Digital Economy Development on Carbon Emission Reduction—an Empirical Analysis Based on 80 Countries of the Belt and Road Initiative. Sustainability 2025, 17, 883. [Google Scholar] [CrossRef]
- Zhao, J.; Chen, W.; Liu, Z.; Liu, W.; Li, K.; Zhang, B.; Zhang, Y.; Yu, L.; Sakai, T. Urban Expansion, Economic Development, and Carbon Emissions: Trends, Patterns, and Decoupling in Mainland China’s Provincial Capitals (1985–2020). Ecol. Indic. 2024, 169, 112777. [Google Scholar] [CrossRef]
- Xiang, Y.; Cui, H.; Bi, Y. The Impact and Channel Effects of Banking Competition and Government Intervention on Carbon Emissions: Evidence from China. Energy Policy 2023, 175, 113476. [Google Scholar] [CrossRef]
- Liu, L.; Wang, Z.; Xu, J.; Zhang, Z. Green Baton: How Government Interventions Advance Green Technological Innovation. Environ. Dev. Sustain. 2023, 25, 11121–11152. [Google Scholar] [CrossRef]
- Zhao, J.; Pan, J.; Xie, X.; Su, M. Green Outward Foreign Direct Investment and Host Country Environmental Effects: The Home Country’s Carbon Emission Reduction System Is Crucial. Energy 2024, 290, 130182. [Google Scholar] [CrossRef]
- Liu, H.; Tang, X.; Fu, J.-Y. Do Foreign Institutional Investors Curb Carbon Emissions? Evidence from an Emerging Economy. Res. Int. Bus. Financ. 2025, 74, 102665. [Google Scholar] [CrossRef]
- Moran, P.A.P. Notes on Continuous Stochastic Phenomena. Biometrika 1950, 37, 17–23. [Google Scholar] [CrossRef]
- Anselin, L. Local Indicators of Spatial Association—LISA. Geogr. Anal. 1995, 27, 93–115. [Google Scholar] [CrossRef]
- Zhang, Z.; Chi, L.; Wu, J.; Zhu, M.; Shen, C. Industrial Clustering and Environmental Pollution: Spatial-Temporal Dynamics and Driving Factors of China’s Feed Processing Industry. J. Clean. Prod. 2025, 498, 145173. [Google Scholar] [CrossRef]
- Xiang, W. Spatiotemporal Evolution Characteristics and Spillover Effects of Carbon Emissions from Public Building in China: The Tertiary Industry Perspective. Environ. Impact Assess. Rev. 2024, 106, 107545. [Google Scholar] [CrossRef]
- Du, M. Spatial Effects of the Market-Based Energy Allocation on Energy Efficiency: A Quasi-Natural Experiment of Energy Quota Trading. Energy 2025, 318, 134902. [Google Scholar] [CrossRef]
- Jin, W. Urban-Rural Carbon Emission Differences in China’s Urbanization: Spatial Effects and Influencing Factors. Environ. Pollution 2025, 366, 125423. [Google Scholar] [CrossRef] [PubMed]
- Wang, C. Spatial and Temporal Evolution Patterns and Spatial Spillover Effects of Carbon Emissions in China in the Context of Digital Economy. J. Environ. Manag. 2025, 373, 123811. [Google Scholar] [CrossRef] [PubMed]
- Miao, Y. Why Fossil Fuels Stifle Green Economic Growth? An Environmental Management Perspective in Assessing the Spatial Spillover Impact of Energy Consumption in South Asia. J. Environ. Manage. 2025, 373, 123471. [Google Scholar] [CrossRef] [PubMed]
- Chen, H.; Yi, J.; Chen, A.; Peng, D.; Yang, J. Green Technology Innovation and CO2 Emission in China: Evidence from a Spatial-Temporal Analysis and a Nonlinear Spatial Durbin Model. Energy Policy 2023, 172, 113338. [Google Scholar] [CrossRef]
- Wang, Z. Can Digital Transformation Affect Coal Utilization Efficiency in China? Evidence from Spatial Econometric Analyses. Resour. Policy 2024, 91, 104940. [Google Scholar] [CrossRef]
- Djemo, C.R.T.; Eita, J.H. Modelling Foreign Exchange Rate Co-Movement and Its Spatial Dependence in Emerging Markets: A Spatial Econometrics Approach. Empir. Econ. 2024, 66, 979–1011. [Google Scholar] [CrossRef]
Disclaimer/Publisher’s Note: The statements, opinions and data contained in all publications are solely those of the individual author(s) and contributor(s) and not of MDPI and/or the editor(s). MDPI and/or the editor(s) disclaim responsibility for any injury to people or property resulting from any ideas, methods, instructions or products referred to in the content. |
© 2025 by the authors. Licensee MDPI, Basel, Switzerland. This article is an open access article distributed under the terms and conditions of the Creative Commons Attribution (CC BY) license (https://creativecommons.org/licenses/by/4.0/).