Article

Design and Construction Aspects of Concrete Block Paved Vertical Traffic-Calming Devices Located in Home Zone Areas

by
Stanisław Majer
1,*,
Alicja Sołowczuk
1 and
Marek Kurnatowski
2
1
Department of Construction and Road Engineering, West Pomeranian University of Technology in Szczecin, 71-311 Szczecin, Poland
2
Department of Sanitary Engineering, West Pomeranian University of Technology in Szczecin, 71-311 Szczecin, Poland
*
Author to whom correspondence should be addressed.
Sustainability 2024, 16(7), 2982; https://doi.org/10.3390/su16072982
Submission received: 5 March 2024 / Revised: 26 March 2024 / Accepted: 28 March 2024 / Published: 3 April 2024
(This article belongs to the Special Issue Sustainability in Pavement Materials and Design)

Abstract

:
In recent years, speed reduction measures have been increasingly used, especially in heavily urbanised areas. If local conditions allow, traffic-calming schemes are implemented, which include a variety of traffic-calming measures (TCM). Some of the most common traffic-calming measures are concrete block paved vertical traffic-calming devices (VTCDs), including speed tables, speed humps, speed bumps and raised pedestrian crossings. Different design and construction recommendations apply to the respective VTCD types. The aim of this article is to examine the effectiveness of VTCDs in speed reduction and the impact of horizontal forces on pavement conditions, both within and beyond VTCDs, after over a dozen years of exposure to traffic. For this purpose, speed surveys were carried out on selected two-way streets running through home zones in Poland. The pavements on selected VTCDs were identified and visually assessed for damage, and subsidence areas were estimated using the terrestrial laser scanning (TSL) technique. The analysis resulted in the development of the Deviation Model 3D (DM3D), showing local deviations from the theoretical surface, obtained by superimposing the two models, the Real Surface Digital Terrain Model (RS DTM) and the Theoretical Surface Digital Terrain Model (TS DTM). A comparative analysis of the pavement surface condition and the magnitudes of horizontal forces allowed us to identify the locations of critical spots in VTCDs. The results were used as the basis for developing recommended pavement structures and deriving engineering recommendations for concrete block paving in VTCDs.

Graphical Abstract

1. Introduction

1.1. Vertical Deflection Types and Nomenclature

The issue of traffic calming (TC) covers the design, construction and maintenance of different traffic-calming measures, including vertical and horizontal devices and street narrowing, which use a psycho-perceptive sense of enclosure to discourage motorists from speeding. This article discusses the design parameters and types of installed vertical traffic-calming devices (VTCDs), their effectiveness and the pavement structure parameters and deterioration after over a dozen years of exposure to traffic in the home zones under analysis. According to Schlabbach [1], the origins of the terms home zone (HZ) and traffic calming can be traced to the Netherlands, where the first ‘woonerfs’ were introduced as residential precincts, in order to reduce vehicular traffic, and where the first 80 mm high speed hump was installed in Delf in 1970. According to Cottrell et al. [2], a speed hump is a raised paved deflection whose function, according to Roess et al. [3], is to force drivers to slow down to mitigate an “unpleasant” bounce or jolt while running over the vertical traffic-calming device.
The vertical traffic-calming device group of traffic-calming measures includes speed bumps, speed humps, speed tables, raised crossings and raised junctions (also called intersection humps or plateaus), as shown in Figure 1 below.
The basic geometric parameters of vertical traffic-calming devices are the length in the direction of travel l, the height h, the on-ramp i1 and off-ramp i2 gradients and shapes and, sometimes, if appropriate, also the transverse width [4,5,6,7]. The parameters of a system of vertical devices include [7] the spacing intervals between consecutive humps, the materials used for the construction of vertical traffic-calming devices, pavement markings and traffic signs. The change in the height of vertical traffic-calming devices occurs over the length of a flat-topped parabolic, circular or sinusoidal ramp. In the direction of travel, the profiles may include a flat (Seminole) or circular middle portion (Watts) [8]. As defined in [8,9], a speed table is a speed hump featuring a flat-topped middle portion. Speed tables are also called trapezoidal humps or speed platforms. When located on a pedestrian crossing, they are called raised crosswalks or raised crossings, and the middle part length l should equal the pedestrian crossing width, i.e., 4 m [8,9]. The flat middle portion should be long enough to accommodate a passenger car wheelbase, and the on/off-ramps may be less steep, allowing greater driving speeds, as compared to speed humps. The gentler proportions characteristic of speed tables can be an important aesthetic element, and they can be preferred over other vertical traffic-calming devices when arranging streetscapes. This article is limited to analysing speed humps, speed tables and one raised crossing, all located in home zones and all having concrete block surfacing. In addition, for the selected vertical traffic-calming devices, different scenarios of their arrangement along the analysed street were taken into account, in accordance with the conclusions formulated from the research described in publications [2,10,11,12].

1.2. Literature Review

The ever-increasing use of vehicles and the growing awareness of the negative impact of road traffic on the environment triggered the introduction of traffic calming [5,6,13,14,15] and the development of sustainable road pavement design methods [6,16,17]. The implementation of traffic calming is by itself beneficial for reasons of increased safety, speed reduction and a reduction in air pollution and traffic-generated noise [18,19]. When planning traffic-calming schemes, different traffic-calming measures (horizontal and vertical deflections) [5,6,8,14,15,17] are taken into account and then the appropriate surfacing is specified [6,16]. It is important that apart from the effect of selected traffic-calming measures on traffic safety and speed reduction [2,9,11,12,20,21], traffic-calming measurement planning should also take into account their environmental and public health impacts [18,19,22,23]. Other studies covered various traffic-calming measures, such as speed humps, speed tables, chicanes, etc., and the influence of geospatial elements on the street surroundings was also analysed [24,25]. Studying speed reduction in calm traffic zones, some researchers pointed out the significant impact of the repetitive use of measures such as speed humps or speed tables and noted the extent of their slowing effect [5,6,15,22,26,27,28,29]. The sources used in this article [5,6,15] give, for example, VTCD spacing recommendations depending on the target speed. The average impact of a single VTCD on speed reduction, according to [26], may be up to 150 m max. Impact distances for VTCDs placed at strongly varied distances are given in [22]. Various speed determination models based on VTCD key design parameters are proposed in [26,27,28,29].
According to [8,9], the difference between a speed table and a speed hump lies in their flat-top lengths. In the case of the speed tables, their longer flat surface corresponds to the passenger car wheelbase, thus allowing faster riding [9]. Therefore, these traffic-calming measures should be used in 30 km/h or 40 km/h zones in the first place. Speed humps, on the other hand, feature a much shorter flat-top surface and are used where a much greater speed reduction is desired, such as in home zones. According to [30,31], when planning traffic calming and deciding whether to choose speed tables or speed humps, street parameters are also taken into account. These include the number of lanes, whether a horizontal section is straight or curved, the number of intersections, traffic conditions, longitudinal grade and, of course, the expected type of traffic (only passenger cars, with the possible traffic of commercial and municipal vehicles or public transport vehicles). Most studies deal with vertical traffic-calming devices surfaced with asphalt layers and located on asphalt paved streets [7,11,12,22,23,32,33]. Previous research focused mainly on the effectiveness of vertical traffic-calming devices in reducing vehicular speed in various vertical traffic-calming device designs and speed configurations. Several experimental studies [10,23,31,33,34,35,36] measured and analysed accelerations and delays during the passage along the vertical traffic-calming devices, using onboard test equipment to assess the comfort of travel over the hump.
However, there are no design recommendations in the literature regarding the choice of the pavement structure suitable for the planned vertical traffic-calming device, taking into consideration the streetscape in its immediate surroundings, the selection of its basic geometric parameters in relation to the type of street, its function, etc. Note that concrete blocks are the paving material of choice in home zone areas owing to a wide selection of available types, shapes and colours. It is also easy to delineate permeable pavement areas. When choosing the type of vertical traffic-calming device structure to be installed and the suitable type of surfacing in its immediate surroundings, it is necessary to bear in mind the higher traffic loading related to the horizontal forces created by the change in speed before and after the vertical traffic-calming device and the increase in the vertical force magnitude due to dynamic action.
The pavements for 30 km/h and 40 km/h zones are designed for adequate traffic service level, depending on the projected traffic loading. In home zone areas, in turn, traffic is assumed to be composed primarily of passenger cars with the occasional traffic of municipal and commercial vehicles. Urban transit vehicles may also be taken into account in specific situations. As a rule of thumb, the design of the pavement structure in home zones takes into account the lowest traffic category; in Poland, this is designated as KR1, characterised by a small number of equivalent single-axle loads [6,16]. However, the presence of traffic-calming measures, and especially vertical traffic-calming devices, may result, over time, in the development of characteristic pavement distress and deformations. Typical damage of concrete block surfacing includes cracking and spalled edges, surface scratches, open joints or missing paving blocks in extreme situations. In turn, surface deformations of these pavements include mainly all kinds of subsidence, rutting and corrugations [37,38,39,40,41,42]. As it was rightly noted by Zapata et al. [43], environmental conditions are also relevant for the durability of the pavement because external factors, such as precipitation, temperature, freeze/thaw cycles and the depth of the groundwater table, play a key role in determining the threshold of environmental impact on the condition of pavements exposed to traffic for over a dozen years.
Loprencipe et al. [34] and Cantisani et al. [44] proposed four classes of riding comfort based on their studies of surface irregularities of concrete block pavements and their impact on the driver’s and passenger’s sensations. Based on their experimental study results, they proved that surface irregularities of concrete block pavements can be assessed using the comfort index, and the obtained rating can be used as a basis to support road authorities’ decisions. Still, we lack a consistent and transparent method of assessing such irregularities. Studies on the design of stone pavements in pedestrian areas were also conducted by Loprencipe et al. [45] and Moretti et al. [46]. Interesting conclusions from the tests of the concrete block paving on steep slopes can be found in [47]. However, relatively little research has been devoted to the impact of vertical traffic-calming devices on road surfacing conditions. The few examples worth mentioning include [7,31,32,33,48]. These studies consider mainly the impact of specific geometric parameters and the scenario of speed humps’ arrangement along the street on the condition of the pavement in question.
In the pavement condition assessment, the assumptions of the extent of distress and deformation are also important for road maintenance and management purposes [6,49,50]. Nevertheless, most of the pavement condition assessment methods are designed specifically for asphalt pavements [39,40,41,42,51,52,53,54,55]. For example, Szpinek, in his publications [56,57], introduced an asphalt pavement distress and deformation rating system, relevant to the pavement condition assessment. A concrete block paving distress and deformation rating was, in turn, proposed in [51,58].

1.3. Research Problem

To sum up the above literature review, and considering the challenges we are facing in relation to climate change, ageing infrastructure and the decline of small-town populations, it can be concluded that when designing pavements in home zones, the sustainable development of road infrastructure and its long-term efficiency must also be taken care of. In the literature, one can rarely find comprehensive design recommendations or research results on the basic principles that should be followed when designing pavements in vertical traffic-calming device areas. Taking into consideration the above-mentioned research gap, this article seeks to find the interrelationship between the pre-selected traffic-calming determinants (i.e., speed, acceleration and deceleration) and the parameters of vertical traffic-calming devices installed in home zones, on the one hand, and the condition of the concrete block pavement after over a dozen years of traffic exposure, on the other. The aim of this article is to examine the effectiveness of VTCDs in speed reduction and the impact of horizontal forces on pavement conditions, both within and beyond VTCDs, after over a dozen years of traffic exposure. On the basis of a review of the literature, the established research gap and the aim, the authors of this article formulated the following research problem: Do the basic parameters of vertical traffic-calming devices installed in home zones and the traffic parameters affect the concrete block pavement condition in the immediate vicinity?
Figure 2 presents, step-by-step, the research method used in this article.
Section 2 describes the study areas and gives a description of the terrestrial laser scanning surveys carried out to assess the basic parameters of the investigated vertical traffic-calming devices and the pavement distress and deformation. Section 2 also presents the method for the assessment of traffic conditions. Section 3 presents the results of speed reduction and pavement condition surveys on the studied vertical traffic-calming devices. The comparison of the results of the vertical traffic-calming device geometry, speed, delay and acceleration data and parameters characterizing the pavement condition indicated that, in some cases, the pavement structure should be designed to be higher than previously adopted traffic measures. Therefore, a few pavement types are proposed in Section 4. Section 5 provides detailed conclusions on the selection of vertical traffic-calming devices suitable for a given street and its surrounding streetscape and gives recommendations on the structure of concrete block pavements in different home zones.

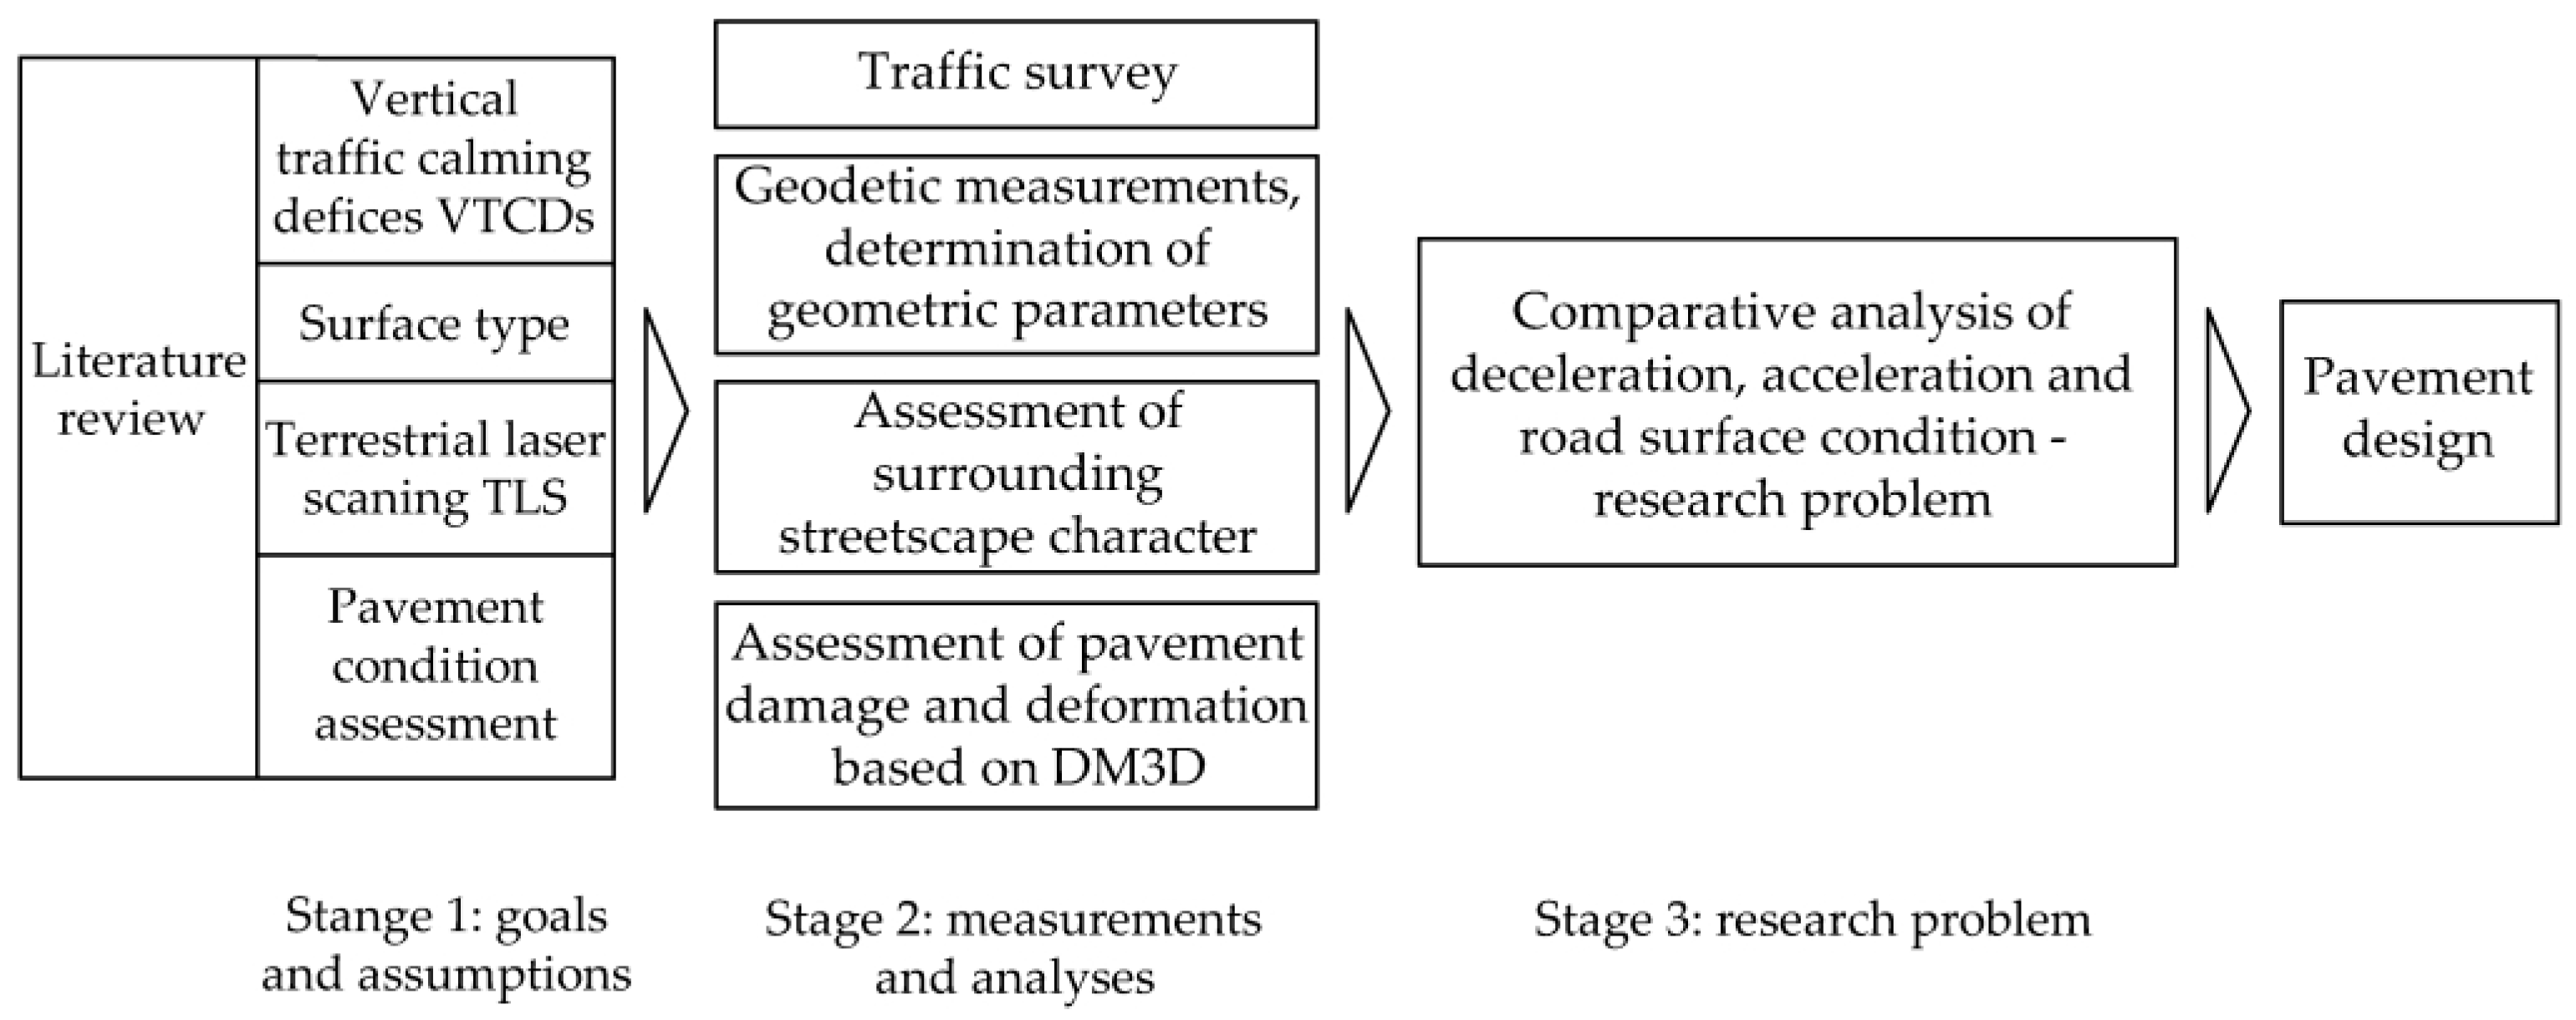
2. Materials and Methodology
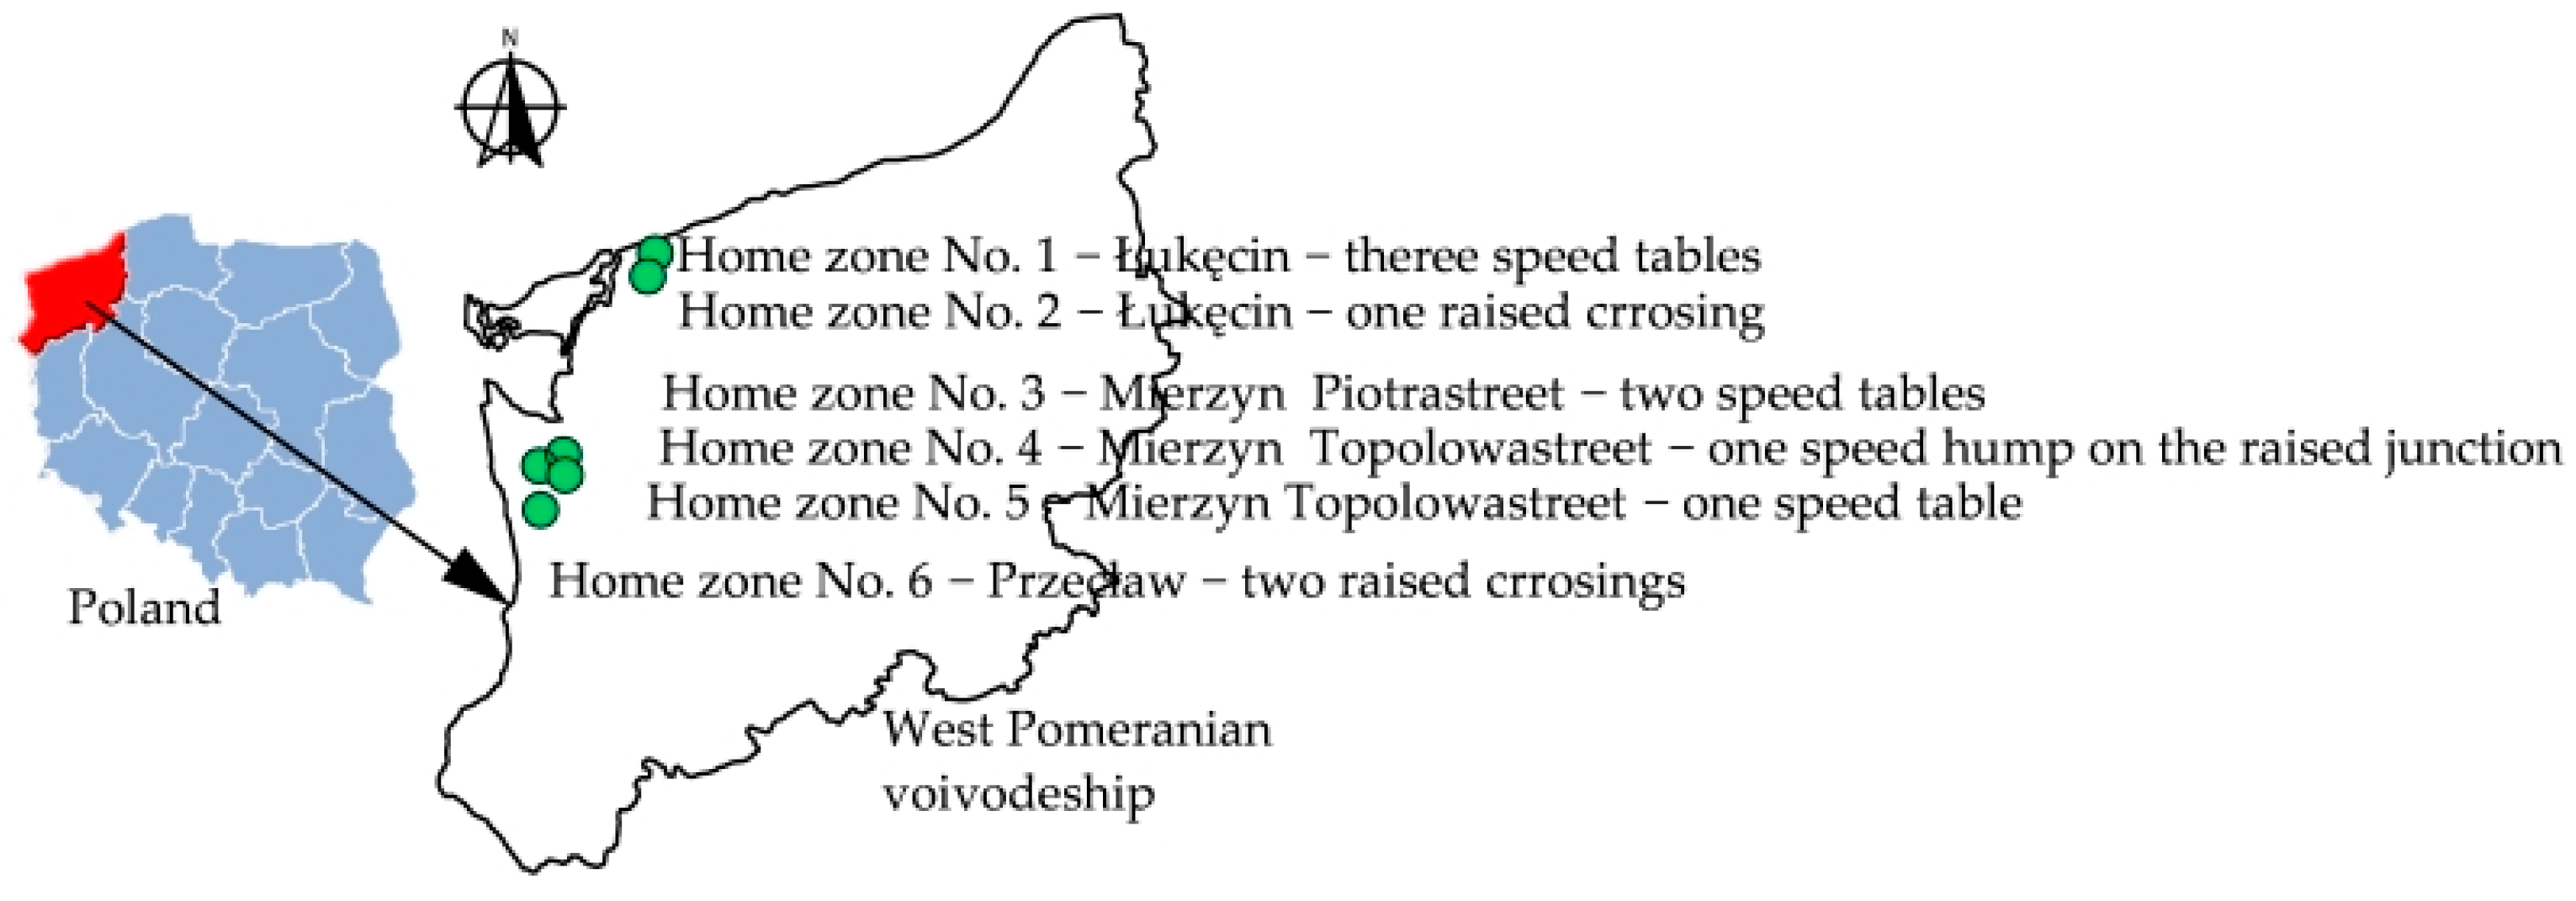
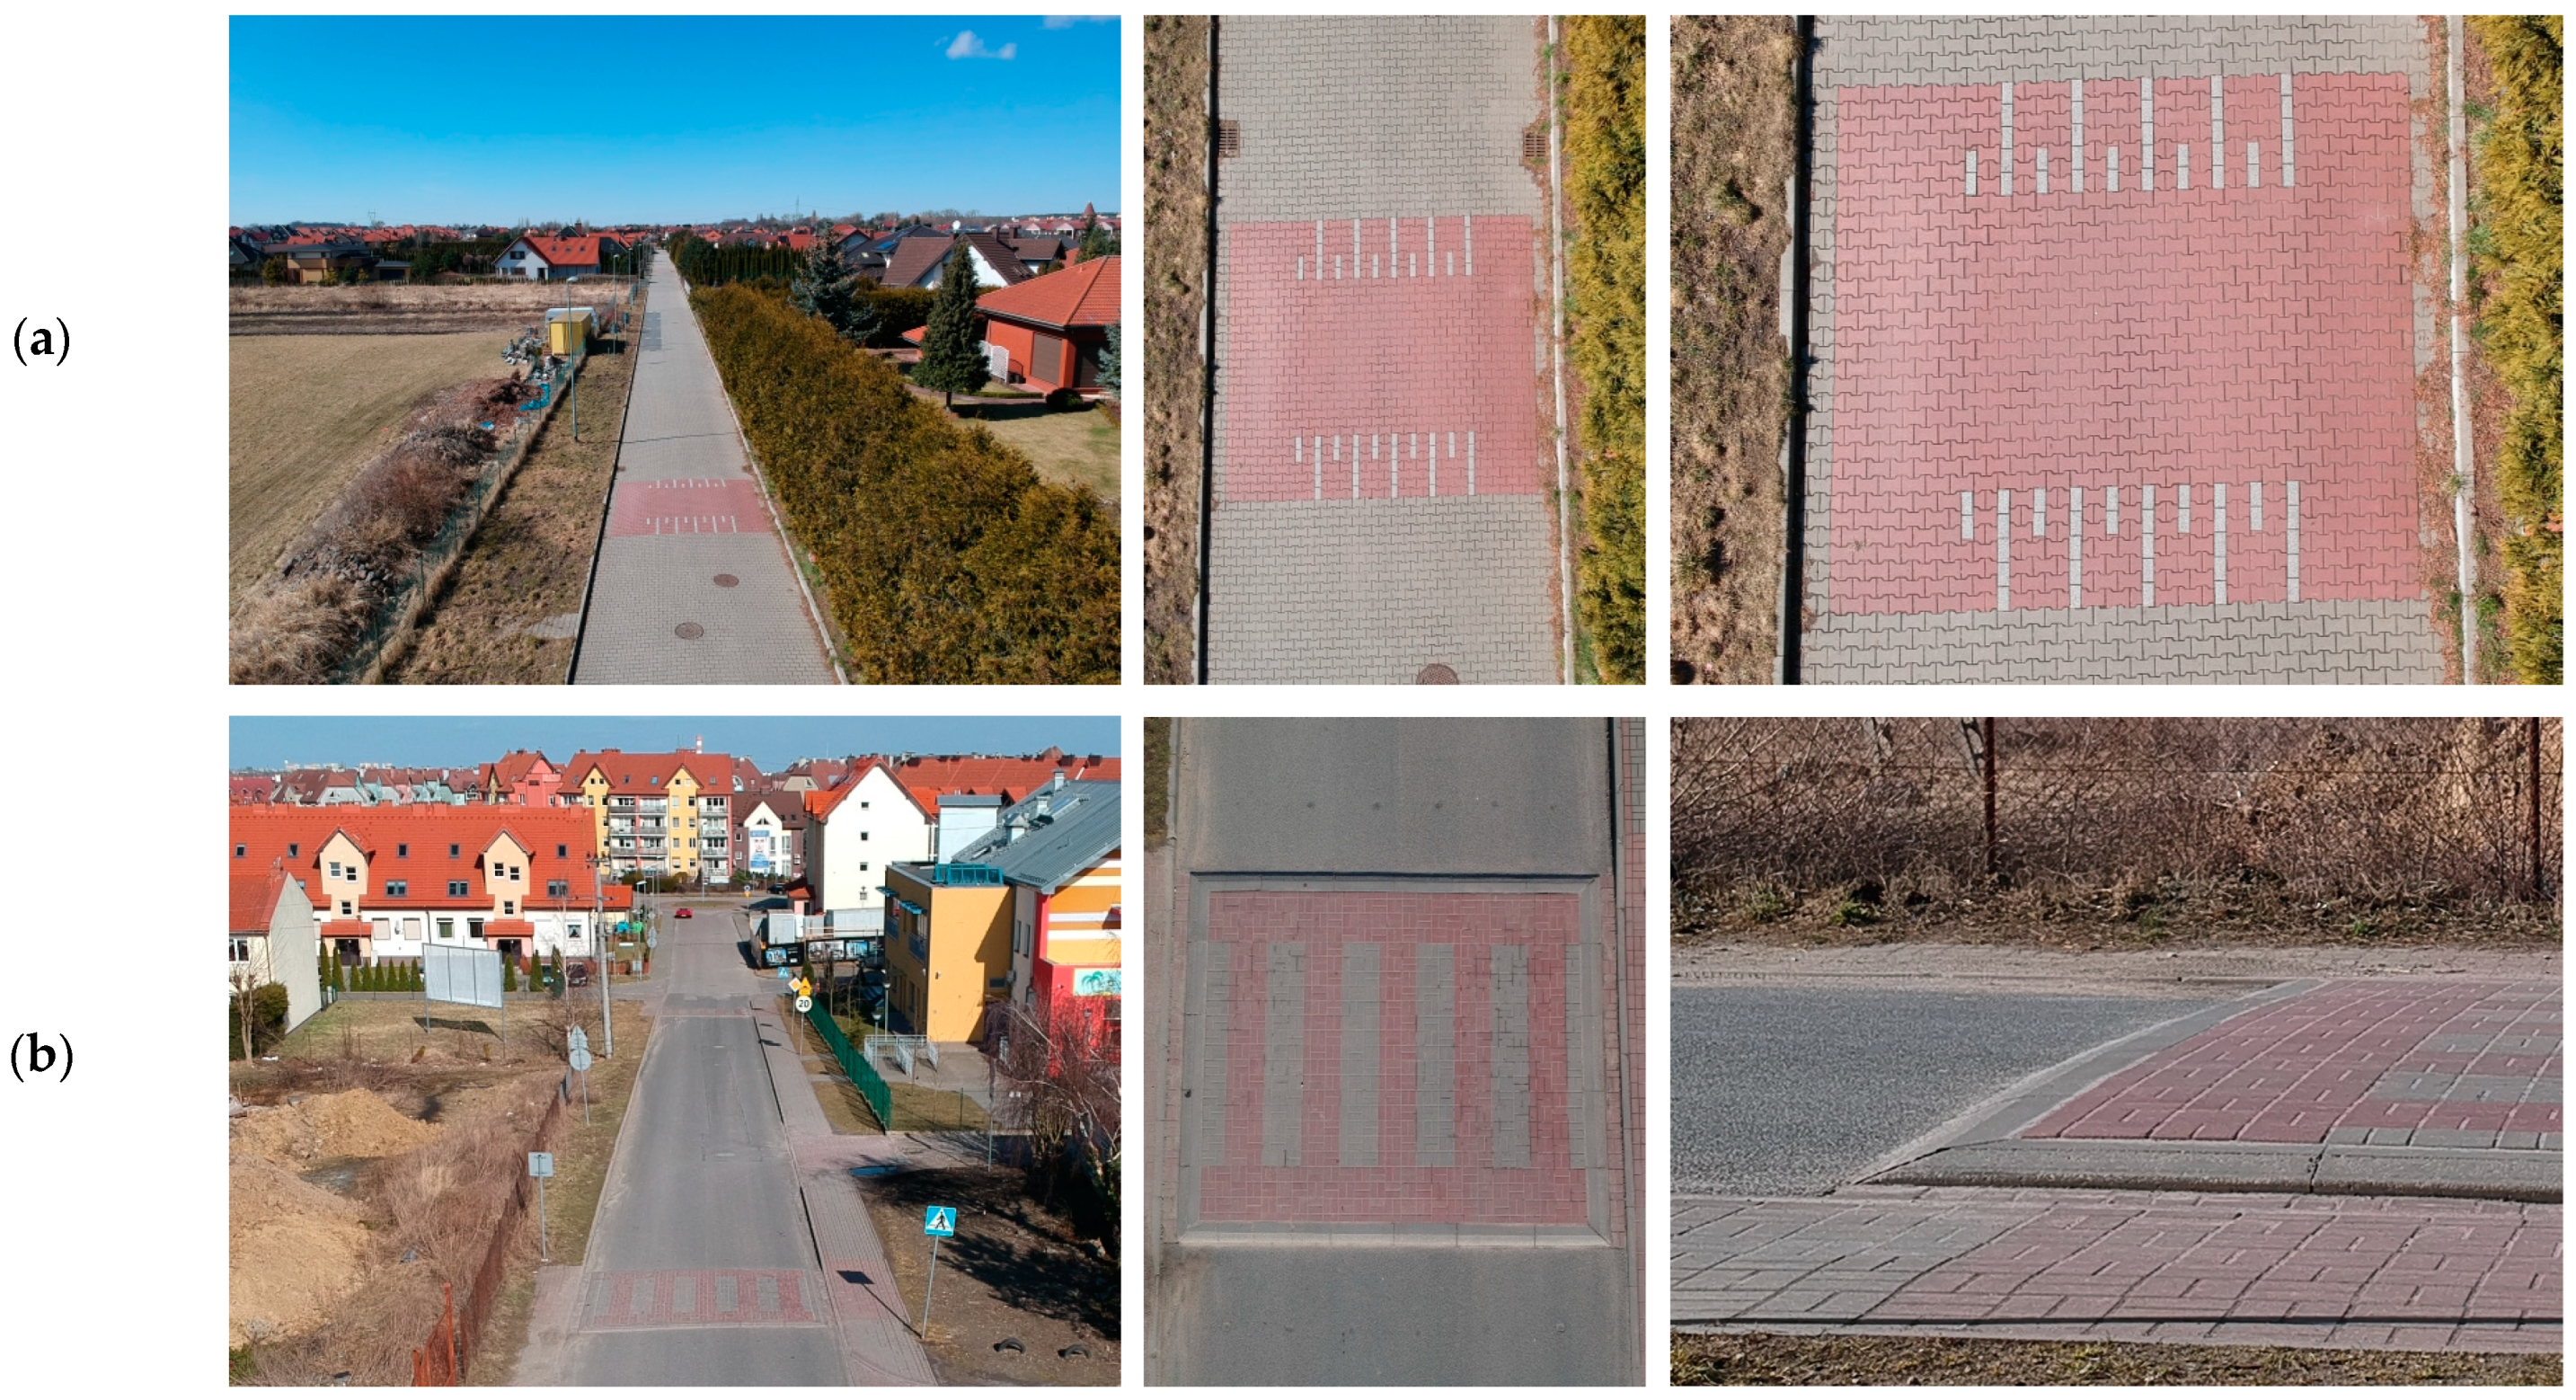
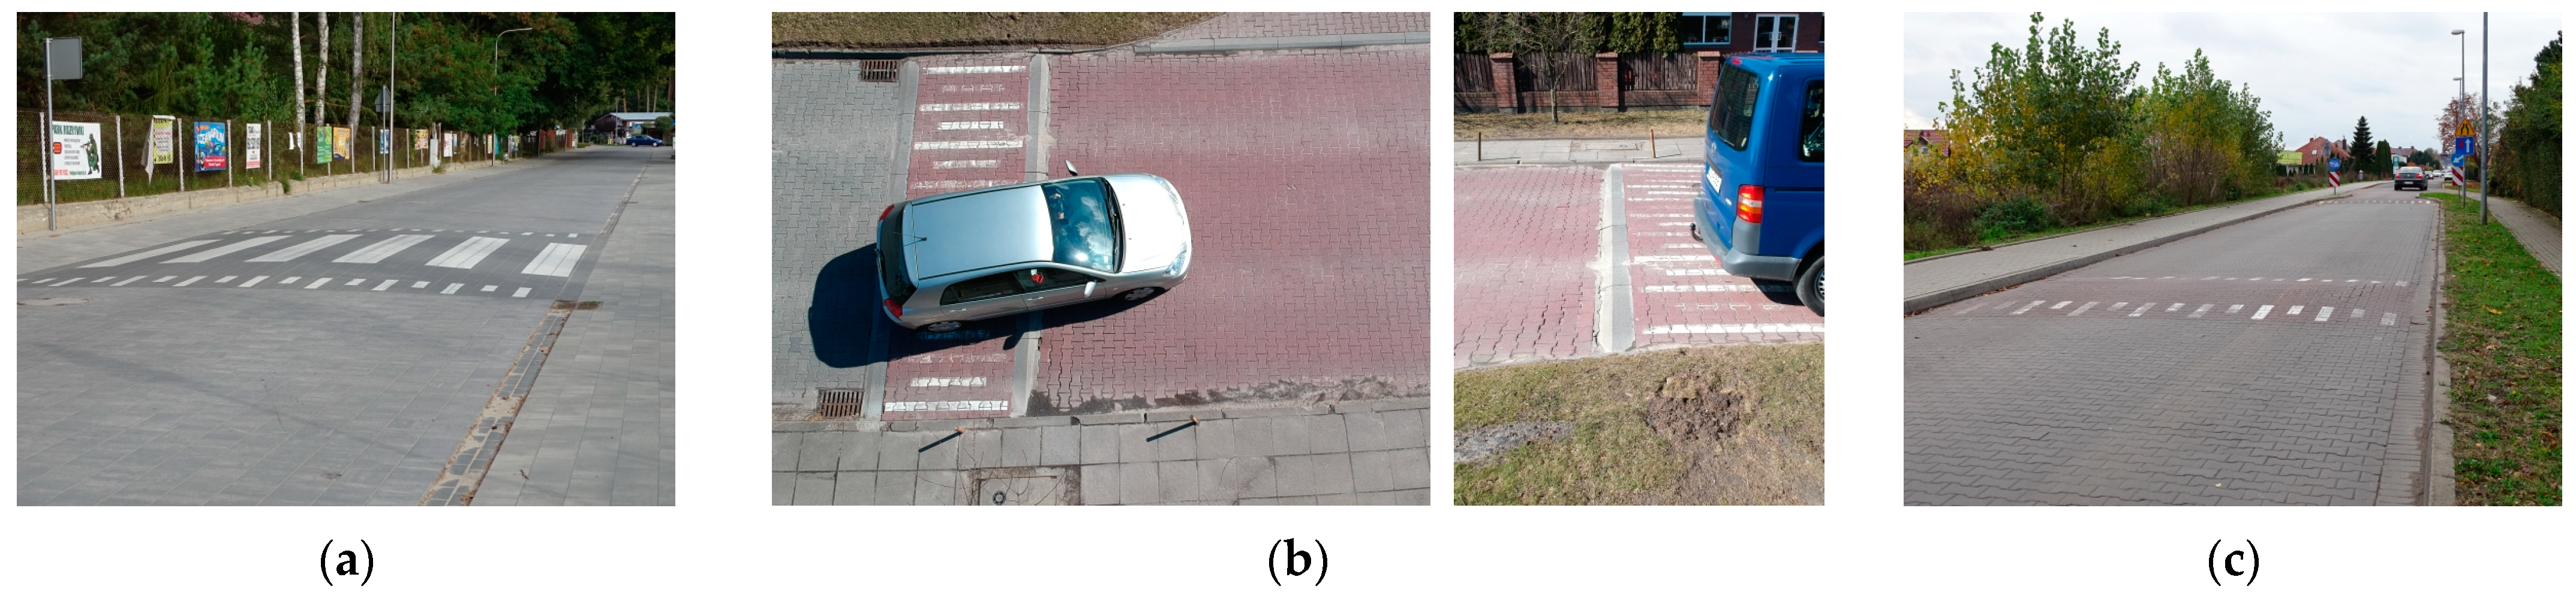
2.1. Study Area

Considering the purpose of the surveys described in this article, eleven vertical traffic-calming devices installed in home zones with different scenarios and streetscapes (Figure 3) were selected for the study. These included six speed tables, three raised crossings and two speed humps used at the beginning of the raised junction. Given the varying parameters of on/off-ramps in both directions of traffic, a total of twenty-two vertical traffic-calming devices were analysed. All vertical traffic-calming devices were located in single-family housing estates in small towns and villages of 2000 to 19,000 inhabitants. The selection of vertical traffic-calming devices installed on streets in home zones for pavement condition analysis was made based on the following assumptions:
-
VTCDs were installed on concrete block pavements;
-
VTCDs had different shapes and different geometric parameters;
-
The condition of the pavement before and after VTCD installation was different;
-
There was no history of accidents after VTCD installation;
-
No other traffic-calming measure was installed over a length of up to 100 m before and after the VTCDs under analysis.
Analysis of the effect of the vertical traffic-calming devices on the condition of the concrete block pavement involved the use of yet another condition for the selection of study areas, namely, different VTCD scenarios:
-
Three consecutive flat-topped speed tables placed at about 60 m intervals;
-
Two consecutive flat-topped speed tables, separated by about 130 m;
-
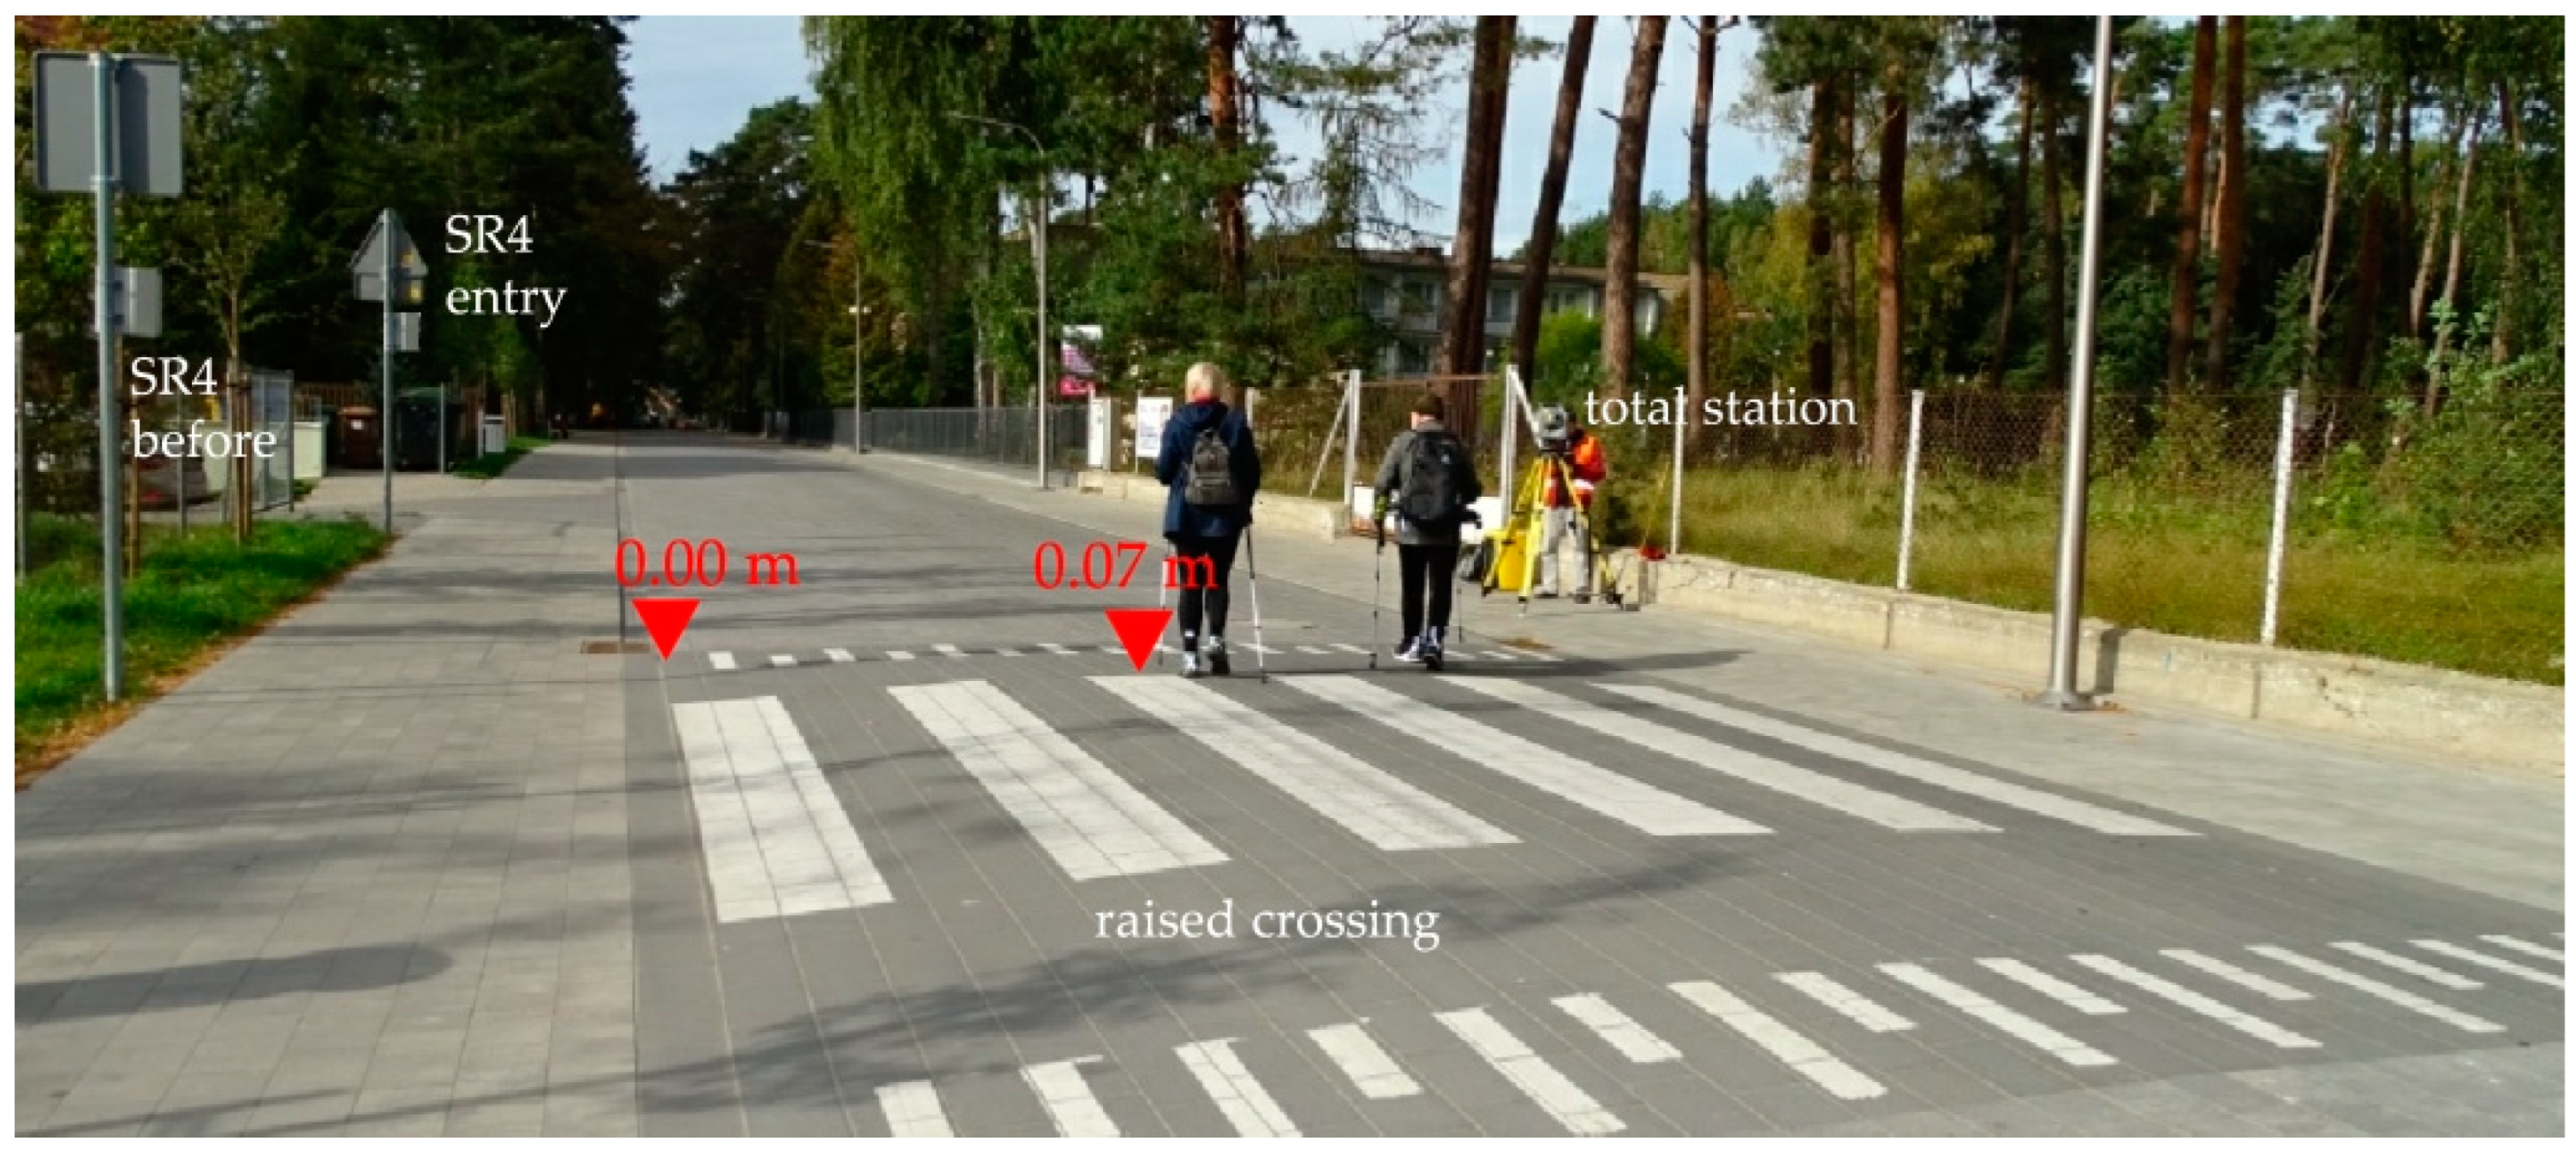
Two consecutive raised crossings on a street with a gradient of 3.5%, separated by about 60 m;
-
Three single VCTDs: a raised crossing, a speed table installed at the entry to the home zone and a speed hump installed at the entry to the raised junction (analysed before and after renewal).
All the selected vertical traffic-calming devices were installed over a dozen years ago, and all were located on two-way streets. All but one street had footways running on either side. The vertical traffic-calming devices selected for the study had top surfaces of various lengths (0.8–4.5 m), different heights ∆h (4–18 cm) and varying on/off-ramp gradients (2–25%).
In most cases, the pavement structure consisted of 8 cm thick concrete blocks, a 3 cm thick layer of 1:4 cement/sand bedding, a 20 cm thick crushed-stone aggregate base and a 10 cm thick separation/drainage layer. The design grade line of the pavement structure of the analysed vertical traffic-calming devices (speed tables or speed humps) was in most cases obtained by varying the road base thickness. In a single case of a very gently raised crossing, the soil subgrade was graded to obtain the required profile, and thus the pavement thickness remained constant over the raised crossing length.

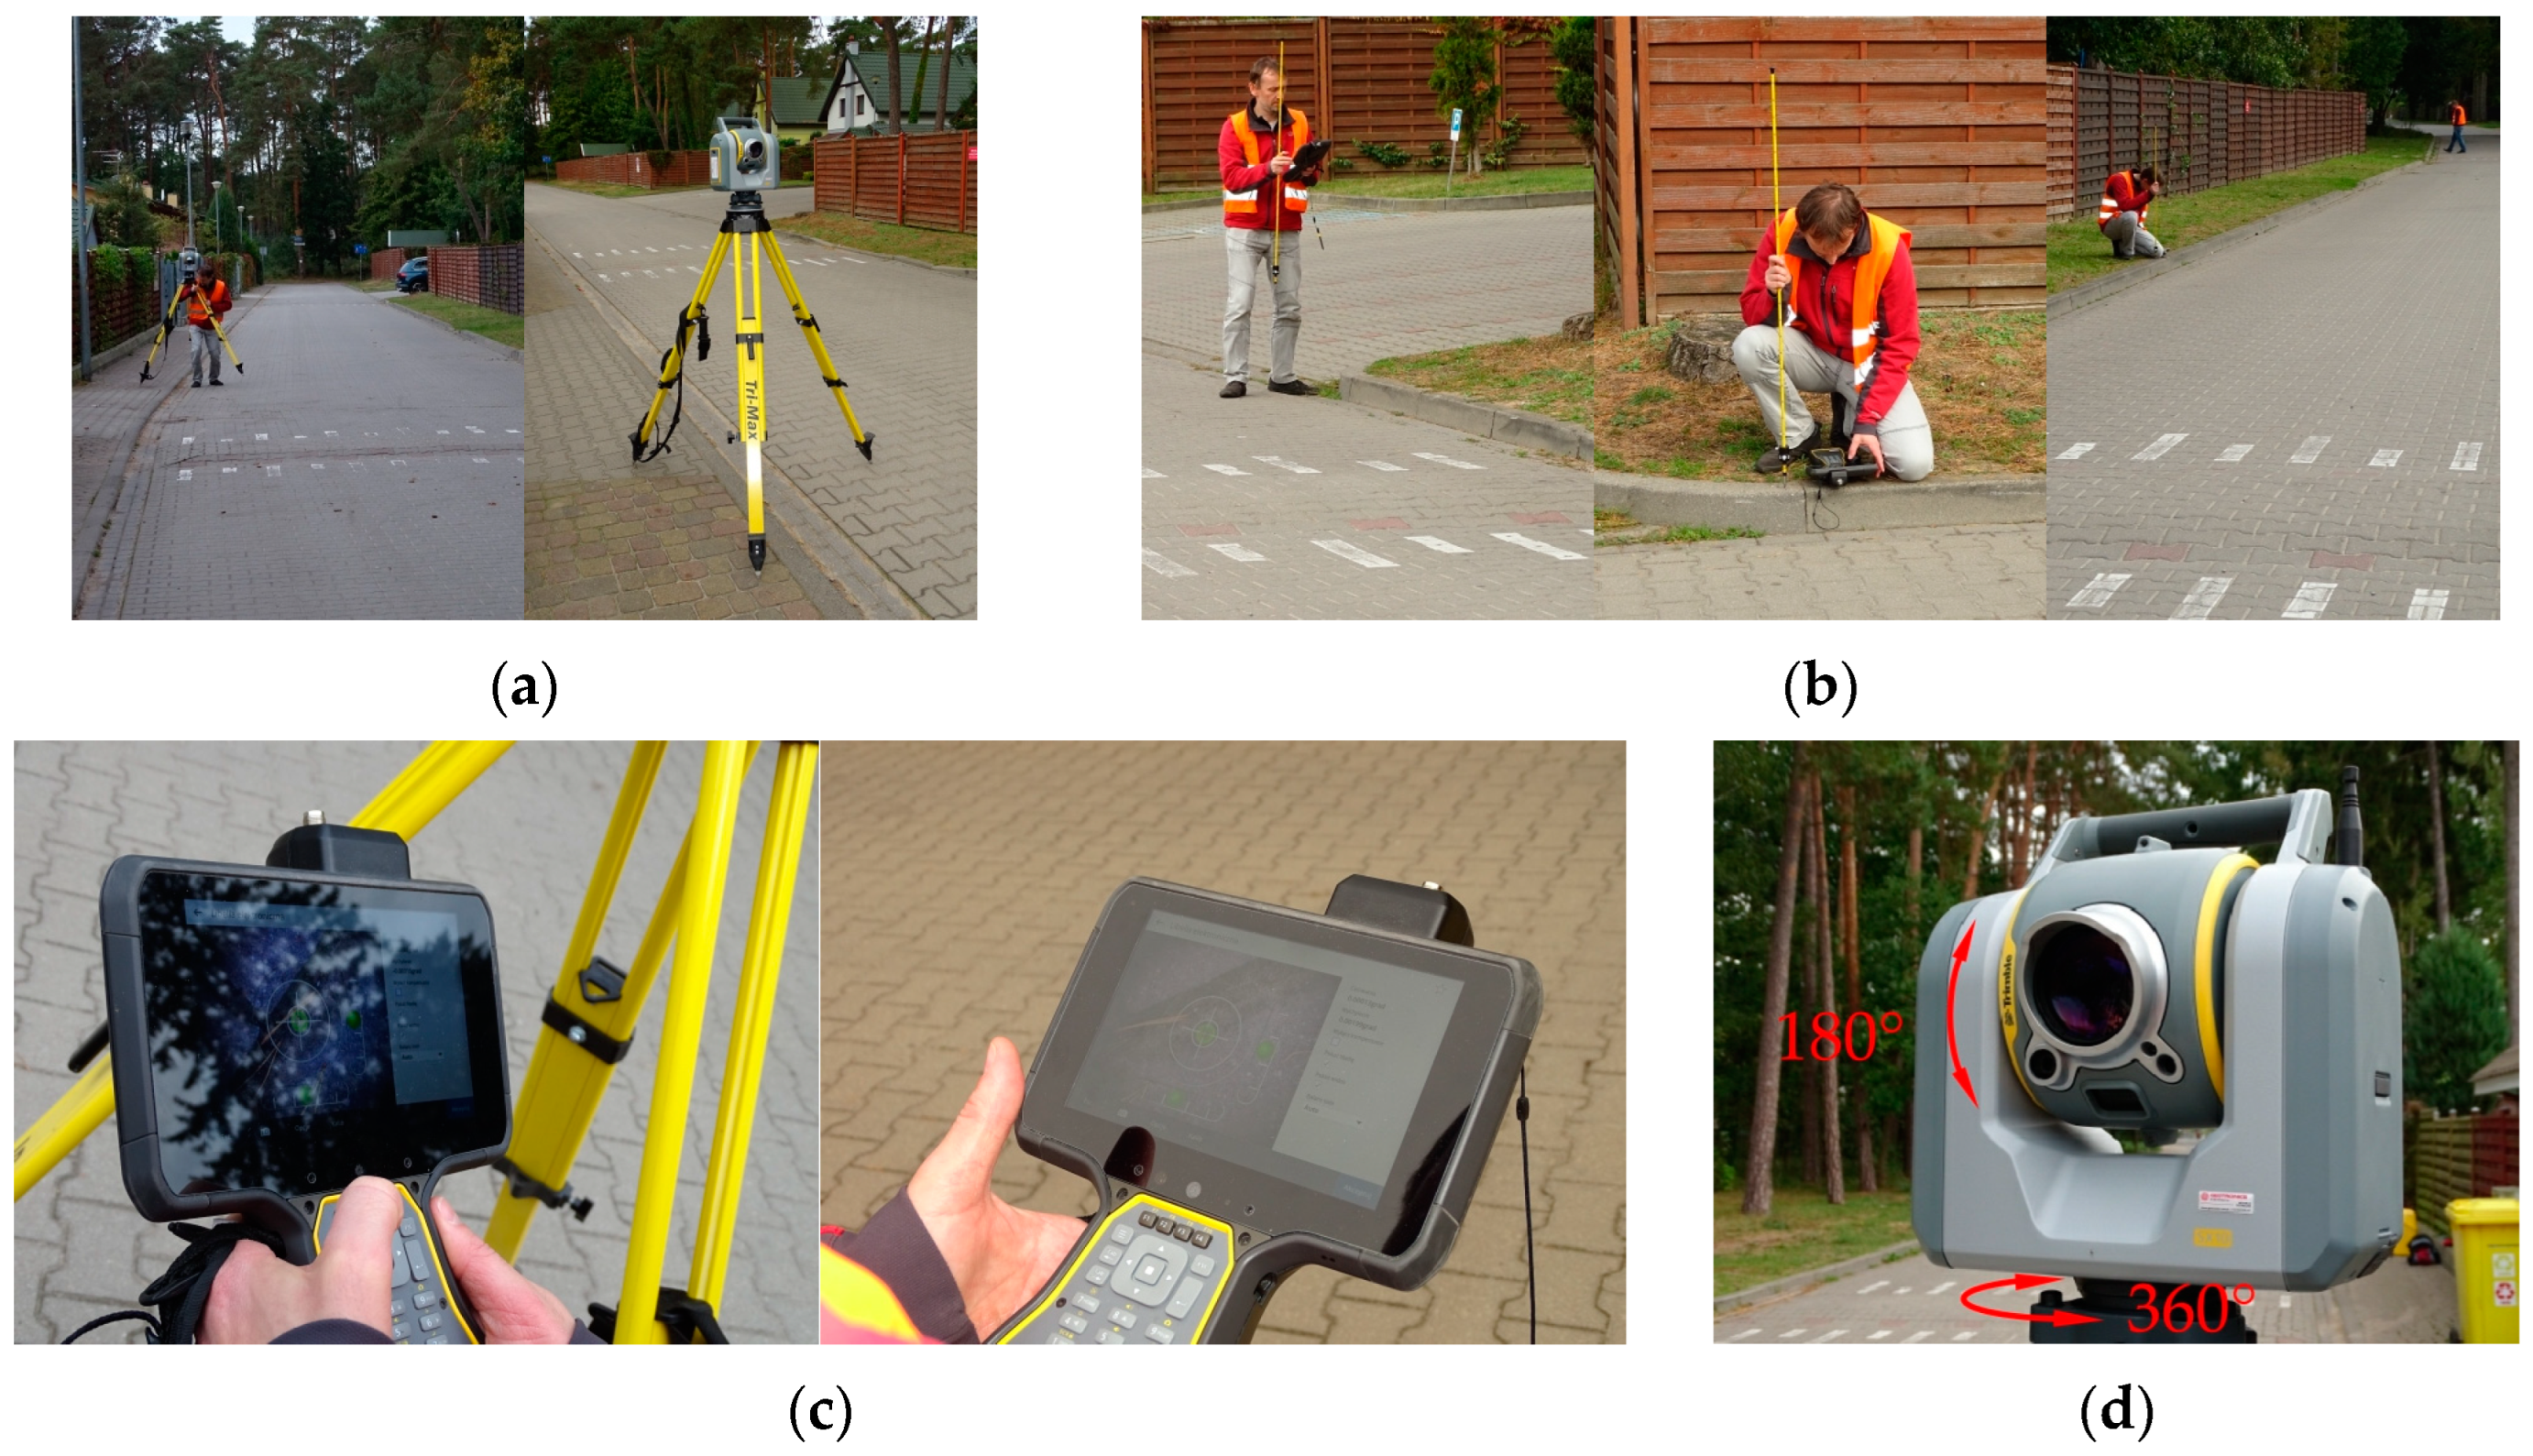
2.2. Terrestrial Laser Scanning Method of Pavement Distress and Deformation Measurement Using Trimble SX10 Scanning Total Station

The measurements of the geometric parameters of all the analysed vertical traffic-calming devices were performed using a Trimble SX10 scanning total station to 1.5 mm 3D positioning accuracy [59]. The scans of vertical traffic-calming device surfaces were performed with two total station settings (Figure 4) to ensure accurate mapping of the x, y and z coordinates on the edges of the vertical traffic-calming devices and of the existing pavement deformations, which could be skipped in single-position scanning. This made allowance for possible gaps in the scan data, e.g., due to cars passing during the survey. The pavement scanning was performed using geodetic control network points established in local x, y and z coordinate systems, separate for each vertical traffic-calming device (Figure 4c,d). In order to determine vertical traffic-calming device parameters and pavement condition, the surface of the roadway was scanned over sections of 10 m length, counting from the outer edge (Figure 4b,c). The location of the total station was determined using the space resection method with 0.001 m accuracy (Figure 4a,c).
Post-processing of the field data was performed using Trimble Business Center (TBC) software version 2023.10 [60], with the obtained point cloud refined by pavement deformations and interfaces between the modelled surfaces. First, a 3D model was developed and then a hypsometric map of the analysed area around a given vertical traffic-calming device was created. An example of a hypsometric map is shown in Figure 5a. The surfaces to be analysed were limited only to the street carriageway. In the next step, a Real Surface Digital Terrain Model (RS DTM) was created in the Triangulated Irregular Network (TIN) based on the obtained point cloud. The subsequent step in the analysis was to develop a Theoretical Surface Digital Terrain Model (TS DTM) of the carriageway stretch under analysis. The theoretical surface was formed by points selected from areas where no deformations had been found. The superimposition of the RS DTM and the TS DTM allowed us to develop a final 3D model of local deviations from the theoretical surface (DM3D), which was used for pavement condition assessment. Figure 5b presents also the chromatic scale of the estimated deviations from the assumed theoretical surface (TS DTM). Detailed longitudinal profiles in the axis of both lanes were made for each analysed vertical deflection in order to determine the on/off-ramp gradients and to estimate the location of the vertical traffic-calming device’s upper surface edge (Figure 5c). Figure 5c,d present selected profiles of the analysed vertical traffic-calming devices, with the blue dotted line representing the point cloud of the real pavement obtained from terrestrial laser scanning and the interpolated auxiliary red lines representing the theoretical surface, which was used to estimate the basic vertical traffic-calming device and pavement subsidence parameters. Detailed results of the geometric parameters of the analysed vertical traffic-calming devices are presented in Table A1 in Appendix A. Figure 5d shows a close-up view of the real and theoretical surfaces described above, showing the method used in this article to assess the deviations of deformed surfaces and a fragment of the DM3D model with one VTCD subsidence example. The method of pavement condition assessment by terrestrial laser scanning is used to evaluate the pavement’s condition to an accuracy unachievable by the conventional visual assessment method with the use of a straight edge. The subsidence surface areas and depths were calculated using the Trimble Business Center software employed for this study. The calculation procedures consisted of two steps: subsidence selection and calculation of the corresponding consecutive depths. The method used in this article was adopted mainly due to the assessment of the pavement deformation used on vertical traffic-calming devices. Visual assessment of vertical traffic-calming device conditions is rarely used in practice. Nevertheless, it needs to be firmly emphasised that in the authors’ opinion, the terrestrial laser scanning method is much more accurate and, more importantly, it is more reliable than the conventional visual assessment. For severely deteriorated pavements, it would be necessary to examine the pavement construction with a ground-penetrating radar or by conventional core sampling in order to obtain the layer thickness data. However, in the cases under analysis, there was no such need.
The DM3D model was used to assess the distress and deformation of the pavements under analysis. The classification of damages and cracks was based on the general assumptions presented in [56,57] concerning asphalt pavements. As already mentioned, in Poland there is no damage catalogue for the inspection of concrete block pavements. The method used in this article does not attempt to assess these damages. Instead, it is a research direction adopted in the analysis of the impact of acceleration and deceleration loading on the pavement condition. For damage to the concrete blocks and their size, the classification shown in Figure 6 was adopted.
For the pavement damages and deformations shown in Figure 6, based on [56], the authors presented the assessment of their impact on the general condition of the pavement after over a dozen years in service: low harm, moderately harmful and very harmful. Damage and spalling less than 3 mm deep or less than 8 cm long were classified as low harm. The very harmful group included cracks along the entire width of the block or spalling of the block’s edge covering over 25% of its surface. Subsidence depth in excess of 1 cm and the largest linear dimension of the surface exceeding 15 cm were also classified as very harmful. Also in this group were missing blocks.

2.3. Traffic Volume and Speed Surveys

Electronic time-synchronised SR4 traffic detectors were used for the traffic volume and speed surveys carried out as part of this study. The detectors were mounted on existing traffic signposts (Figure 7). The speed surveys were carried out in autumn. For the cases of home zones located in small seaside resort towns, this allowed us to eliminate the impact of crowds of tourists strolling the streets. In autumn, there were much fewer visitors in the resort towns, and they were only sporadically present on the home zone streets (Figure 7). The SR4 detectors measured speeds in both traffic directions simultaneously. They were sited at several characteristic places, depending on the analysed vertical traffic-calming device type. Surveys were conducted over a number of hours on working days from 10 a.m. to 3 p.m. The SR4 traffic detectors gathered data on the date, time, speed, vehicle category, time gap in seconds and vehicle headway. From these data, free flow data, that is, travel data, can be filtered out when the road ahead is clear of other vehicles or other side obstructions over a distance travelled in 7 s [60]. The minimum number of measurements in free-flowing traffic conditions at each counting station was 100. In further analysis, the values of v85 and vav were used. For almost all vertical traffic-calming devices, traffic volumes did not exceed 20–50 veh./h, which allowed us to assume free-flowing traffic conditions during the surveys. Traffic volumes reaching 200–300 veh./h were only noted at peak hours in study areas No. 4 and No. 5.
The speed data obtained and the adopted SR4 detector location spacings enabled the estimation of accelerations/decelerations with the use of classical physics formulas. As the time-synchronised detectors measured the speeds of the same vehicles passing along a given vertical traffic-calming device, it was possible to estimate the acceleration/deceleration of each vehicle. Then, according to the method of analysis described in [61,62], the horizontal forces transferred to the pavement were compared with the accelerations and delays recorded on the straight stretch of the street that did not include any traffic-calming measures.
In order to determine possible sections of locally increased pavement loading along the direction of travel, measurements of the traffic on the straight section without traffic-calming measures were carried out. The decelerations b and accelerations a obtained in home zones without vertical traffic-calming devices in free-flowing traffic conditions did not exceed the threshold values of affs = +0.6 m/s2 and bffs = –0.6 m/s2, respectively. Speed measurements in free-flowing traffic conditions were made in home zone No. 3 between the speed tables, and the decelerations/accelerations were calculated accordingly.
Thus, the authors made the following assumptions in their further analyses, in line with the research methods presented in [61,62]:
-
Deceleration and acceleration values ranging from 2 affs = +1.2 m/s2 to 2 bffs = −1.2 m/s2 will count as an increased impact of horizontal forces on the pavement;
-
Values above this range will allow for the determination of pavement sections exposed to an increased impact of horizontal forces.
According to the data given in older traffic engineering textbooks [63,64], when decelerating from 100 km/h to 50 km/h, safe braking can take place at the start of deceleration at b = 3.44 m/s2 and at the end of deceleration at b = 4.37 m/s2. Harsh deceleration occurs at values exceeding b = 6 m/s2. As for acceleration values, existing studies have taken into account situations of analysing acceleration when overtaking. Such situations are not taken into account in this study at all. Since the time of publication of [63,64], the vehicles travelling on the roads in Poland have changed a lot: there are far fewer low-powered cars on the roads, and modern passenger cars have different dynamic properties. Based on experimental studies carried out in recent years with the use of specialised measuring equipment, Loprencipe et al. [22] reported higher deceleration values in the immediate vicinity of vertical traffic-calming devices when braking to slow down from 50 km/h to 20 km/h. Similar deceleration/acceleration values were noted by the authors in their research in the home zones under analysis.

2.4. Assumptions on the Analysis of the Obtained Results Used for Pavement Design Purposes

This article assumes that should the hypothesis of the influence of geometric and traffic parameters on pavement deterioration be confirmed, different pavement structures for home zone areas should be allowed for. As noted above, the design of home zone carriageway pavements should, in the authors’ opinion, take into account a broad spectrum of sustainable road construction factors. This includes the type of traffic (i.e., not only municipal vehicle traffic but also, possibly, public transport or construction vehicles, where home zone expansion may be reasonably expected). When selecting speed hump heights and on-ramp gradients, the type of pedestrian traffic should also be taken into account to cater to the needs of the disabled and also, possibly, roller skaters, go-kart drivers and, in mountainous areas, ski runners. The option of reusing salvaged concrete blocks or recycling destroyed blocks is an important factor that should be taken into account. These factors are also an integral part of pavement structure design. It needs to be kept in mind when designing pavement structures that the discomfort of drivers and passengers is the primary argument against using vertical traffic-calming devices. The greatest discomfort is noted when the rear wheels pass over a given speed table or speed hump, while the front wheels have already left its area [4,22,36]. In addition, this results in increased vertical forces due to dynamic loading. Therefore, the authors assumed an analysis of the relationship between the size of pavement deformation and distress on the pavement surface and the deceleration/acceleration magnitude in different vertical traffic-calming device scenarios. On the basis of the results obtained, they aimed to obtain a concrete block pavement featuring a higher resistance to the horizontal forces generated during the passage through a vertical traffic-calming device.

3. Results

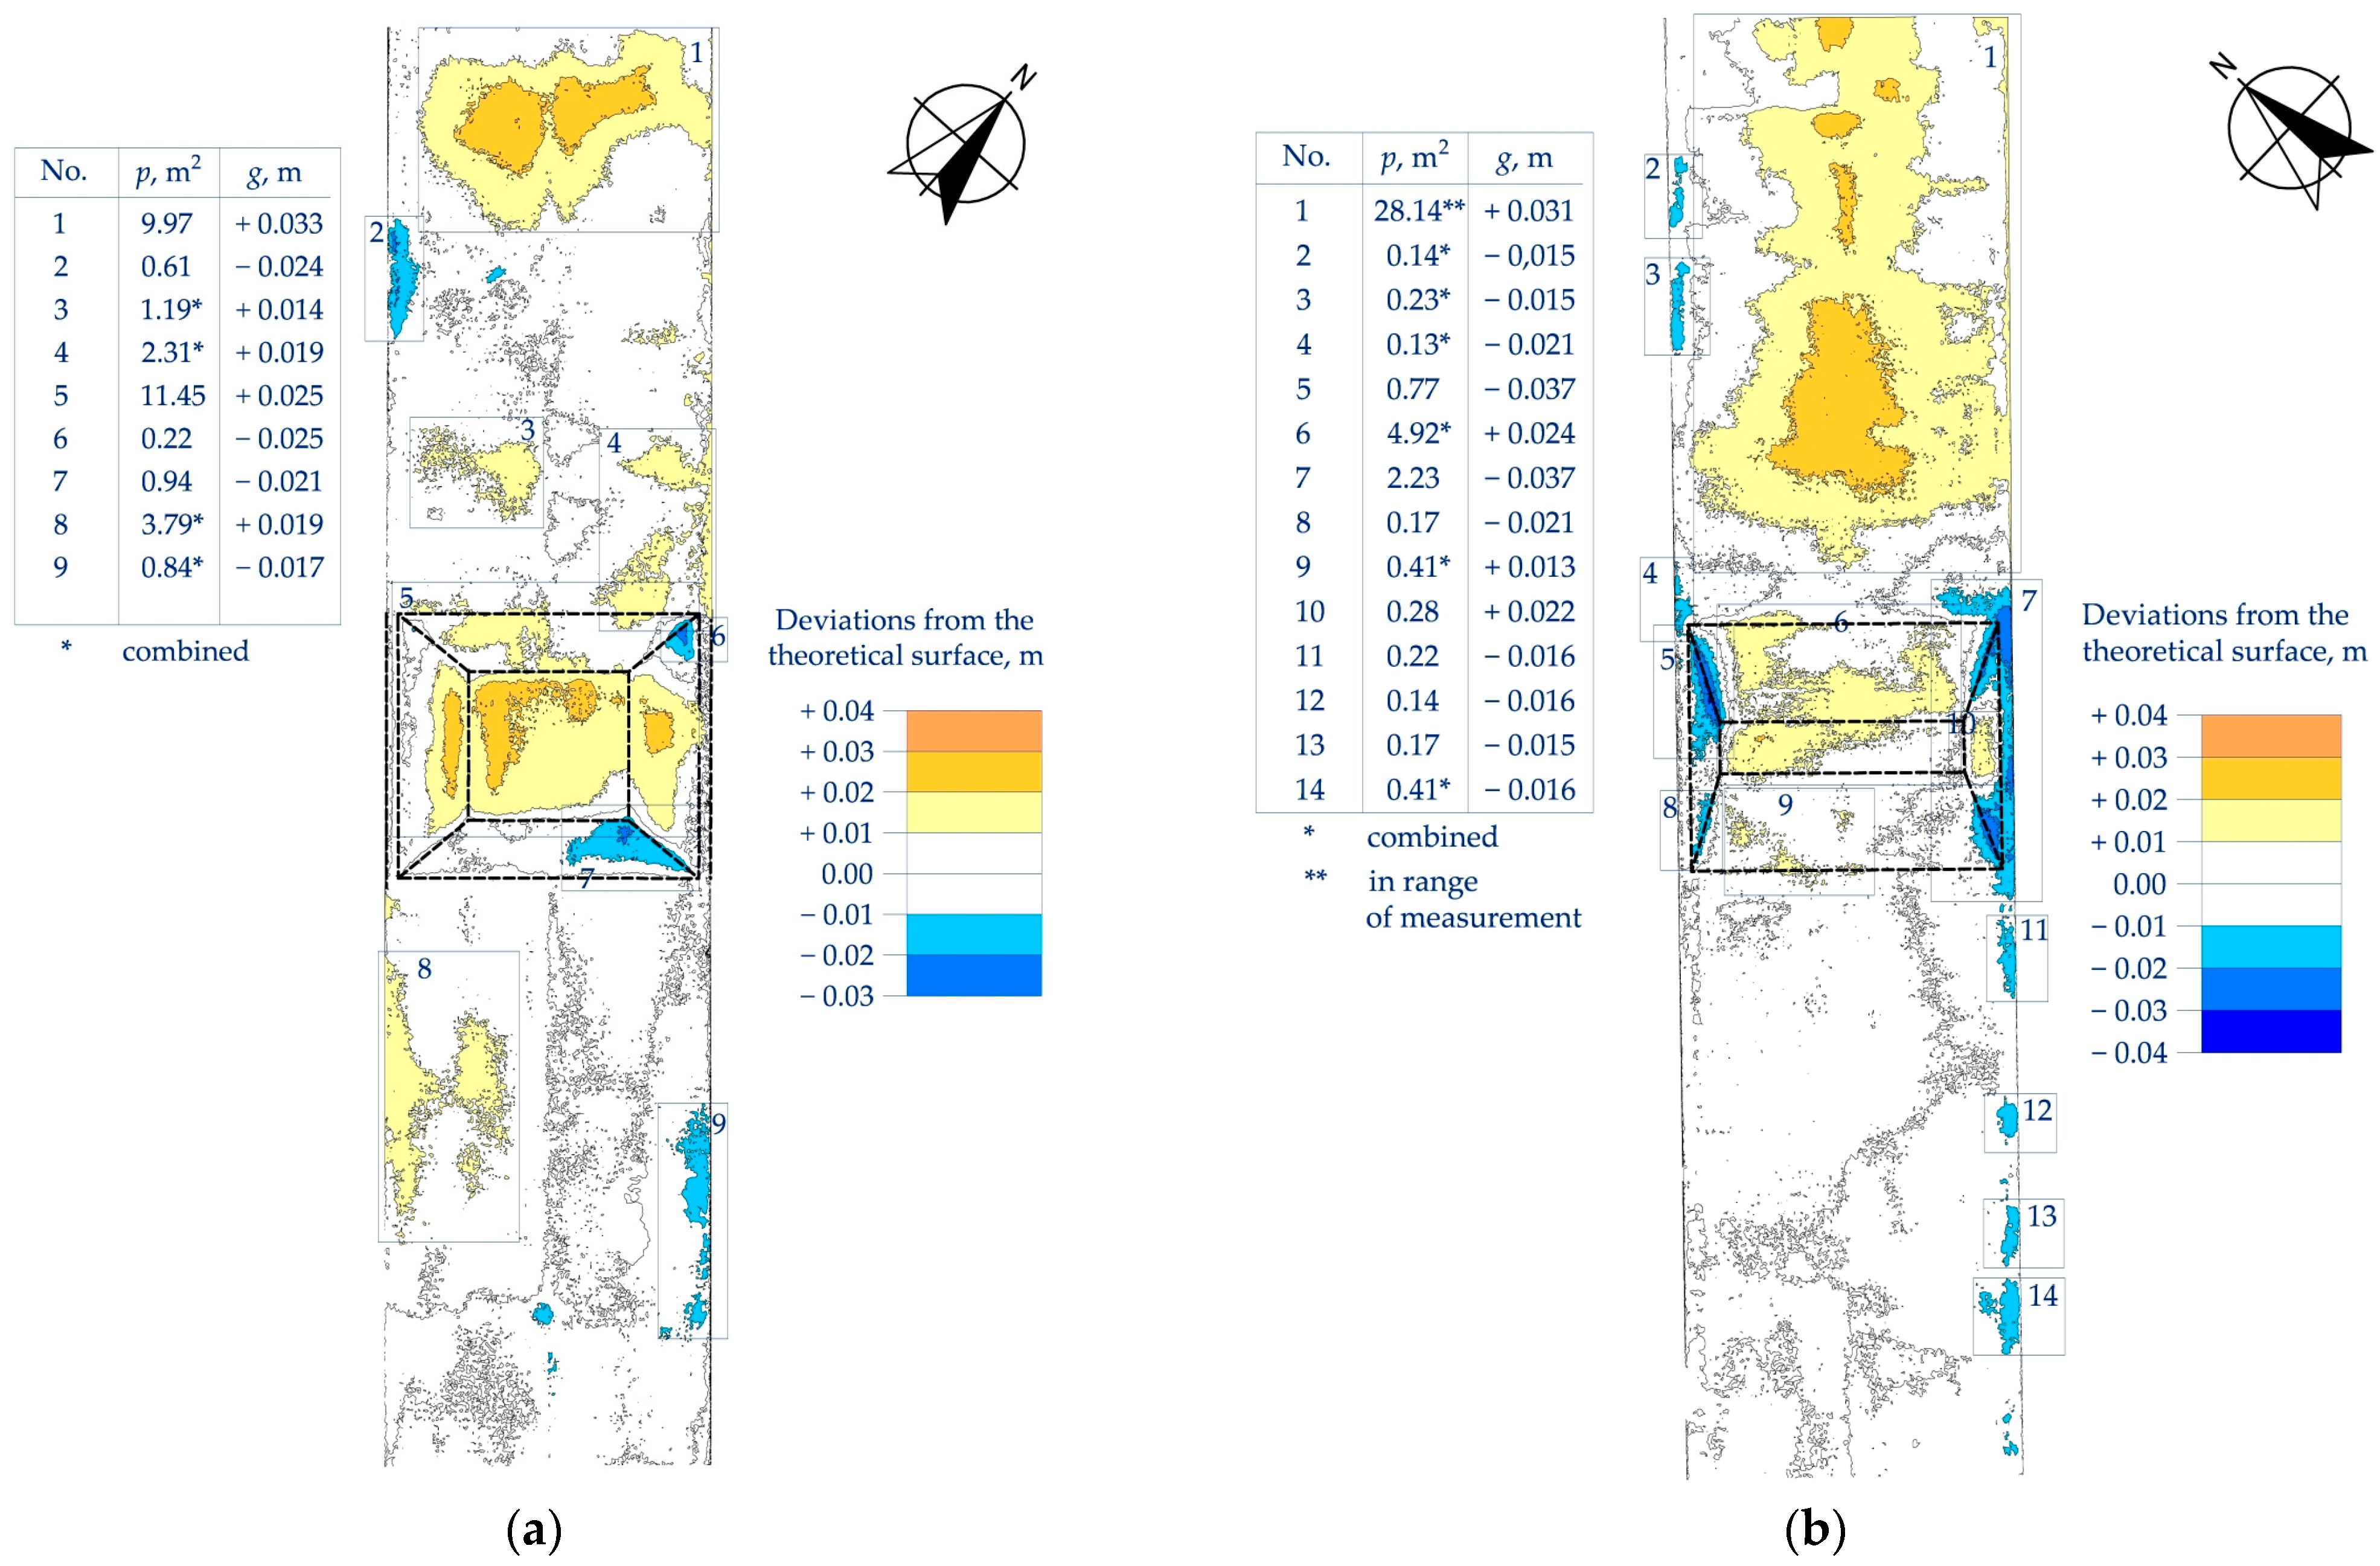
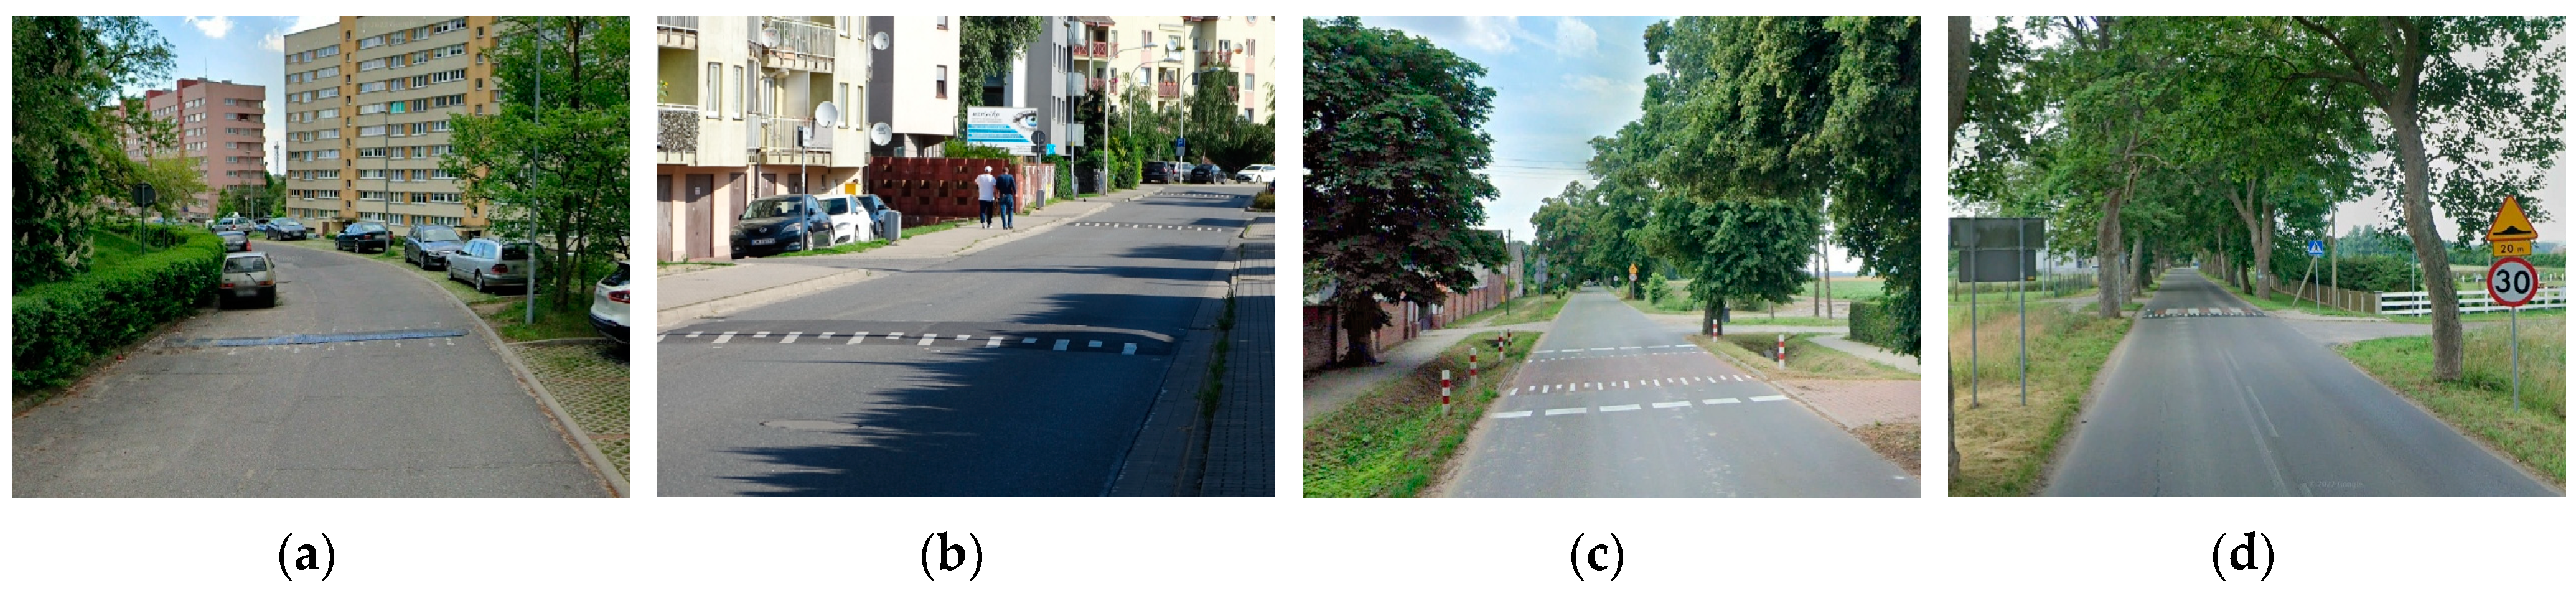
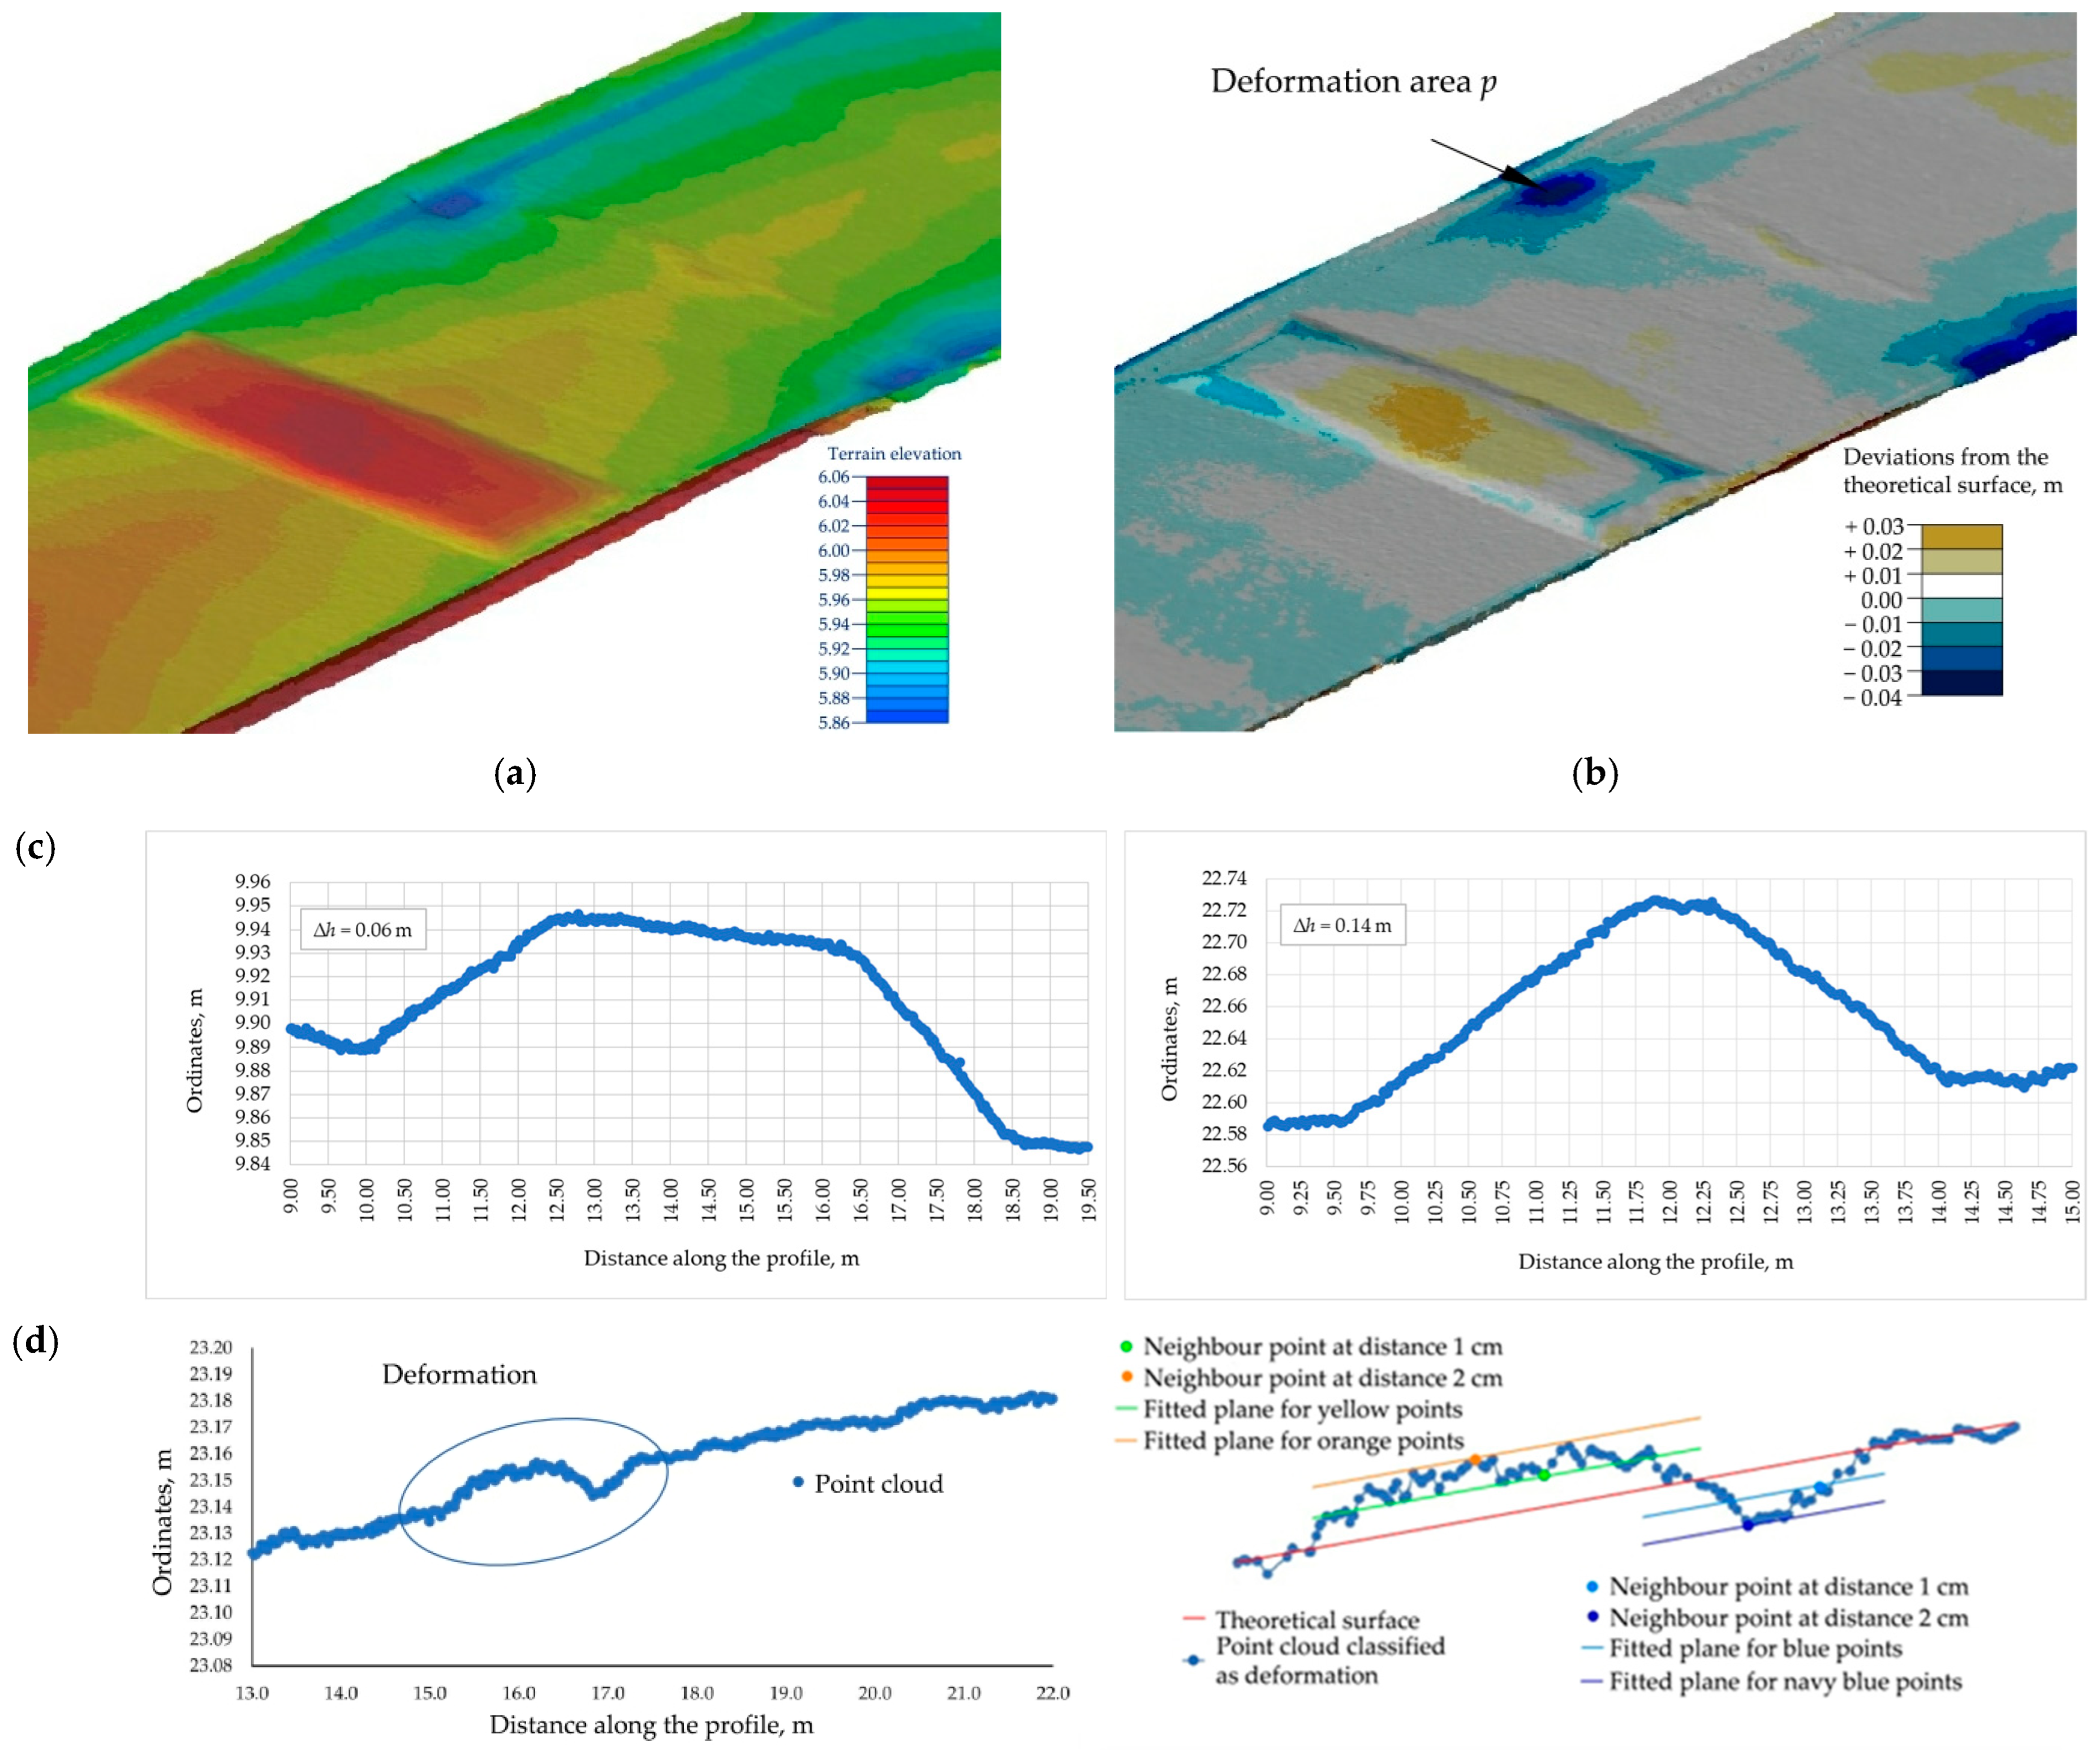
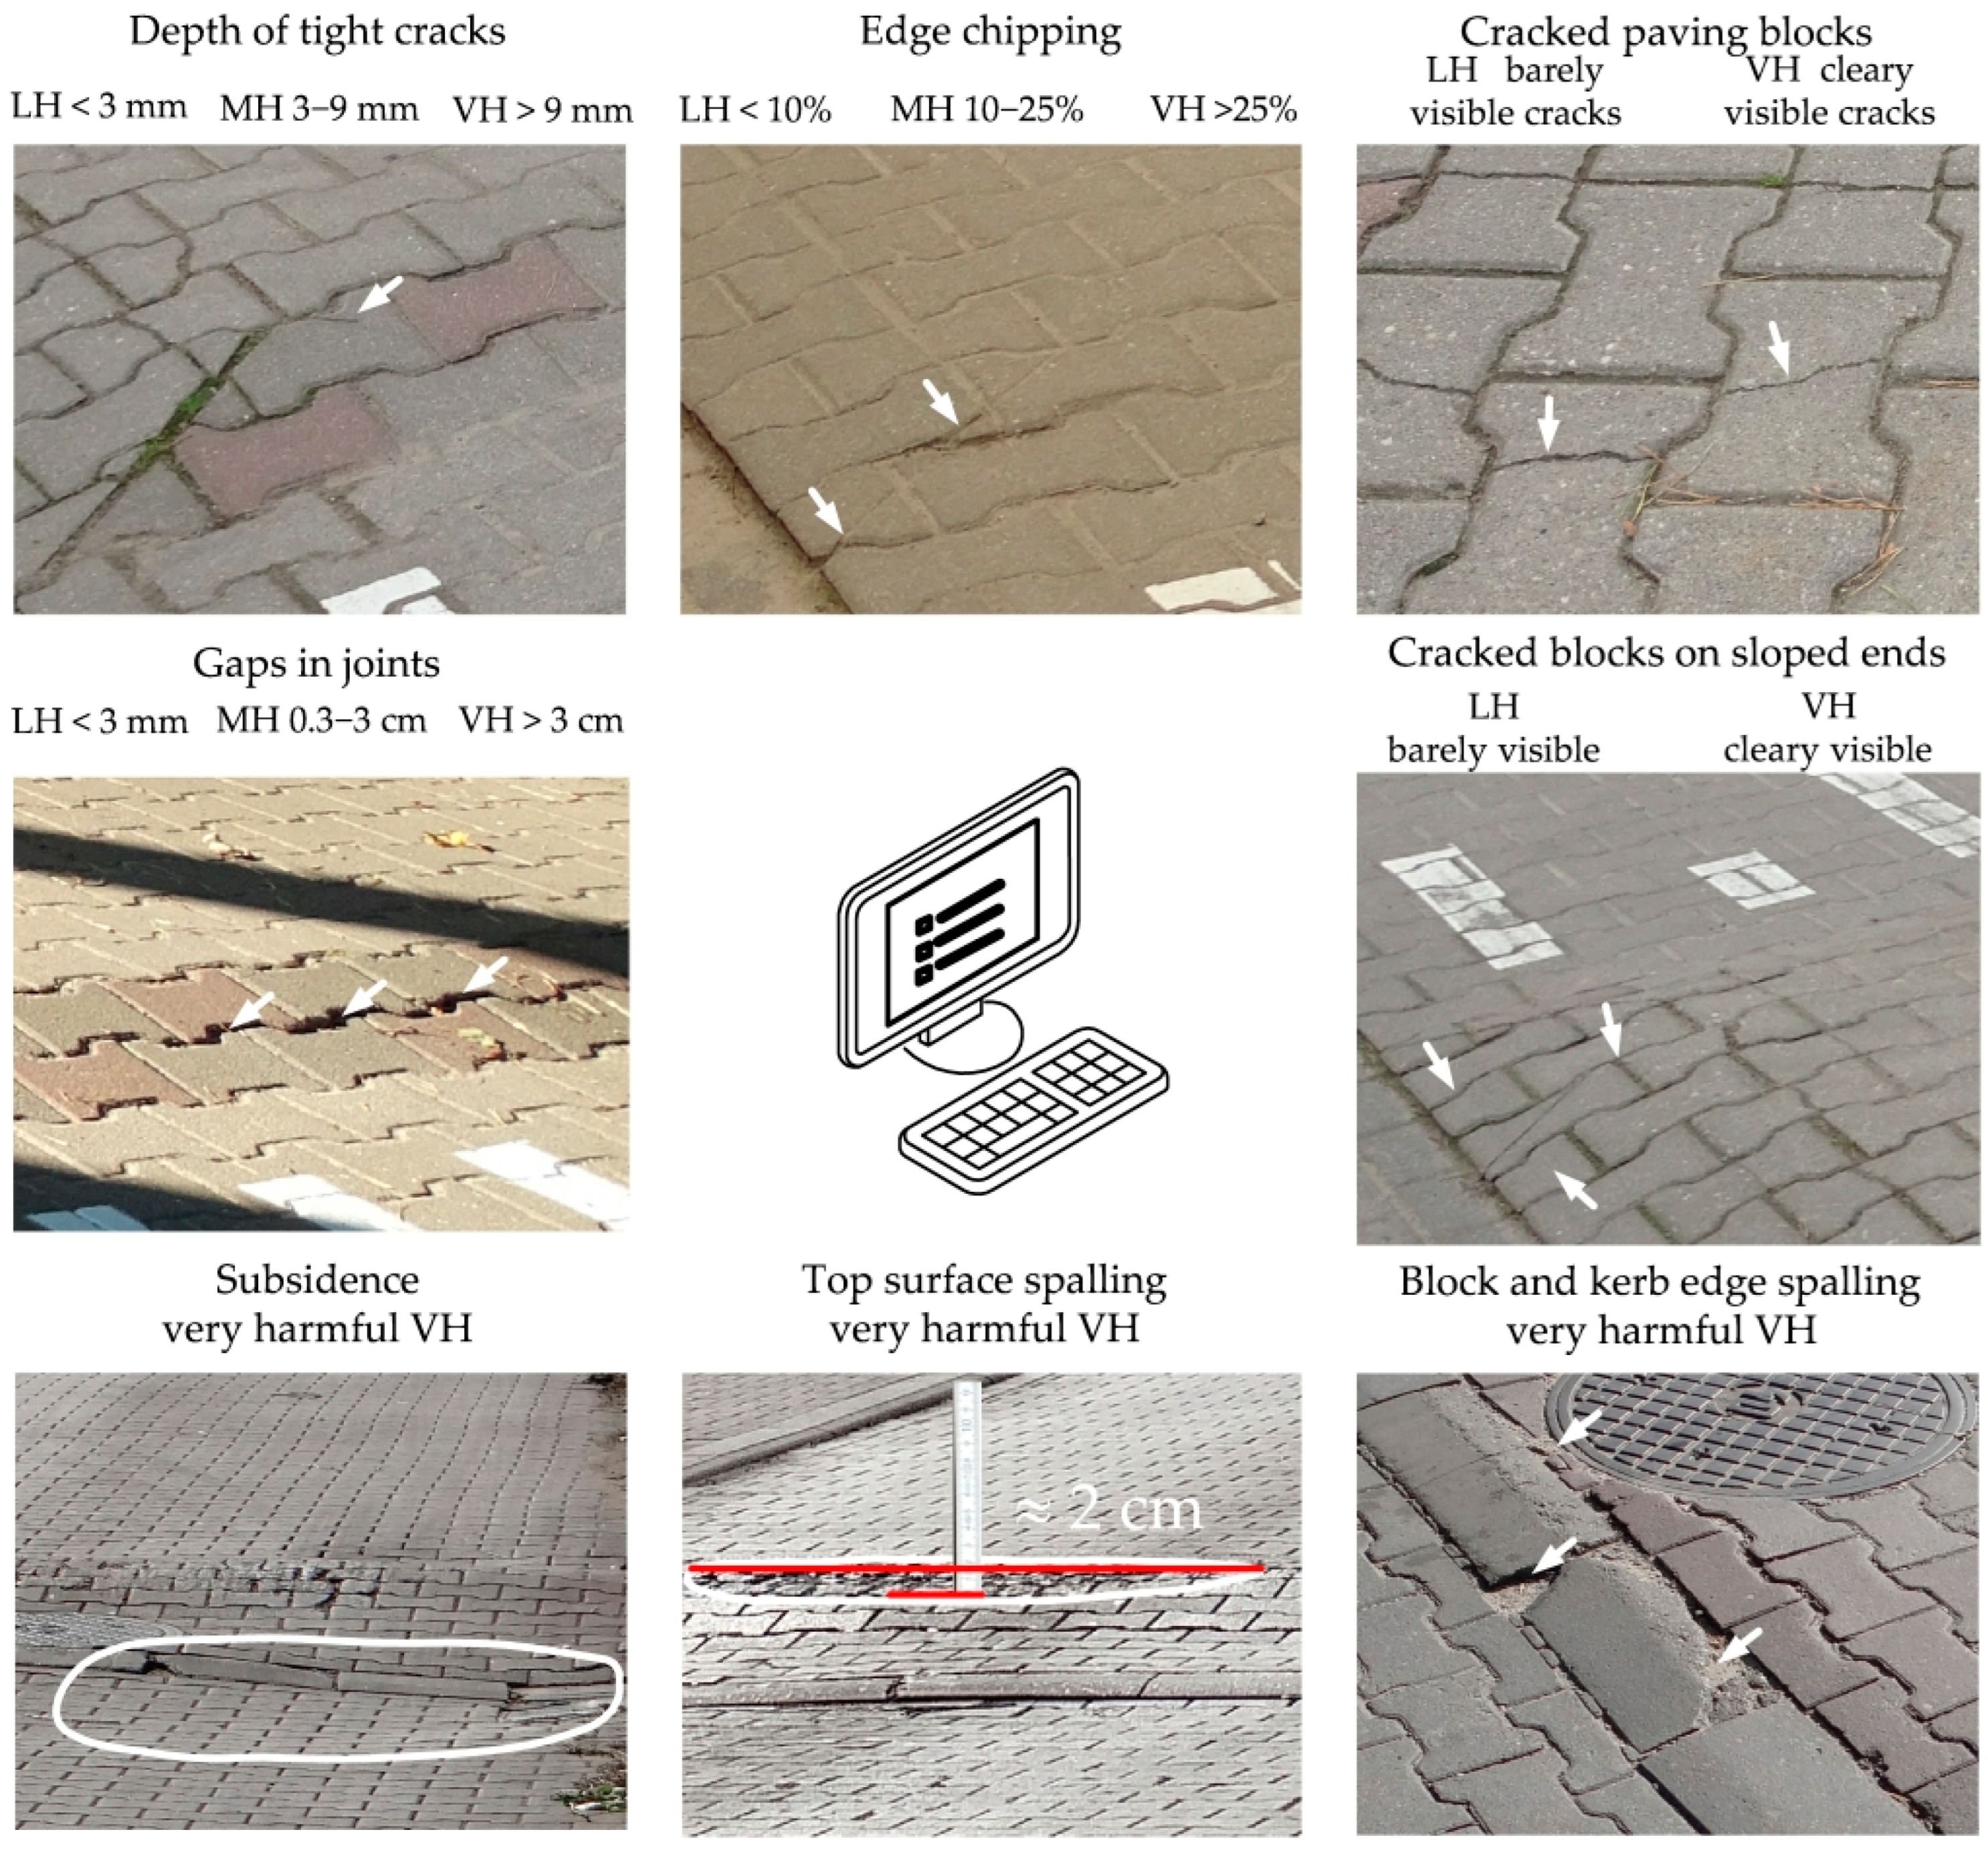
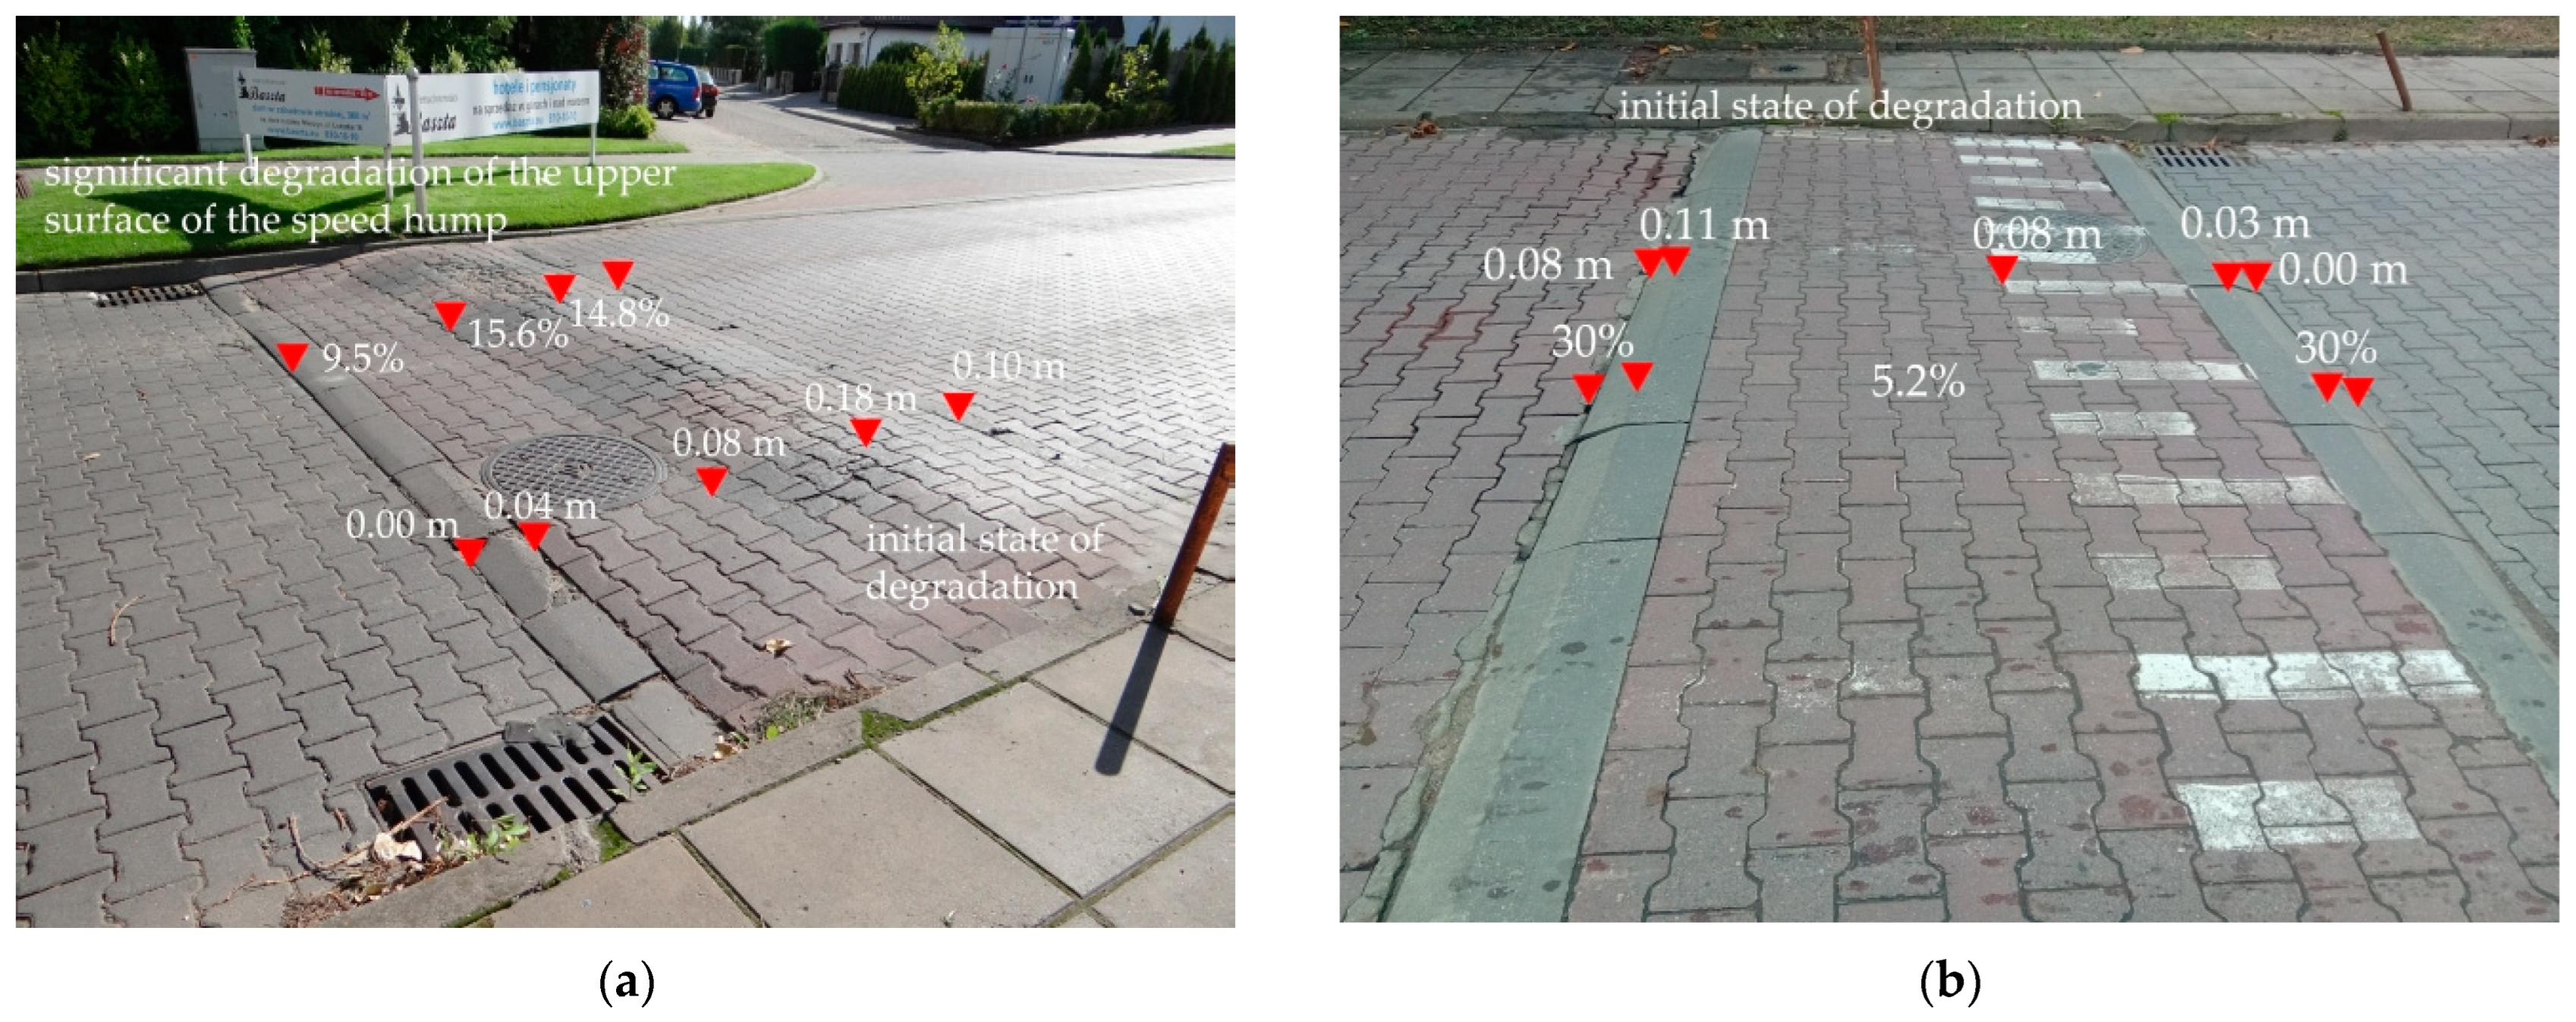
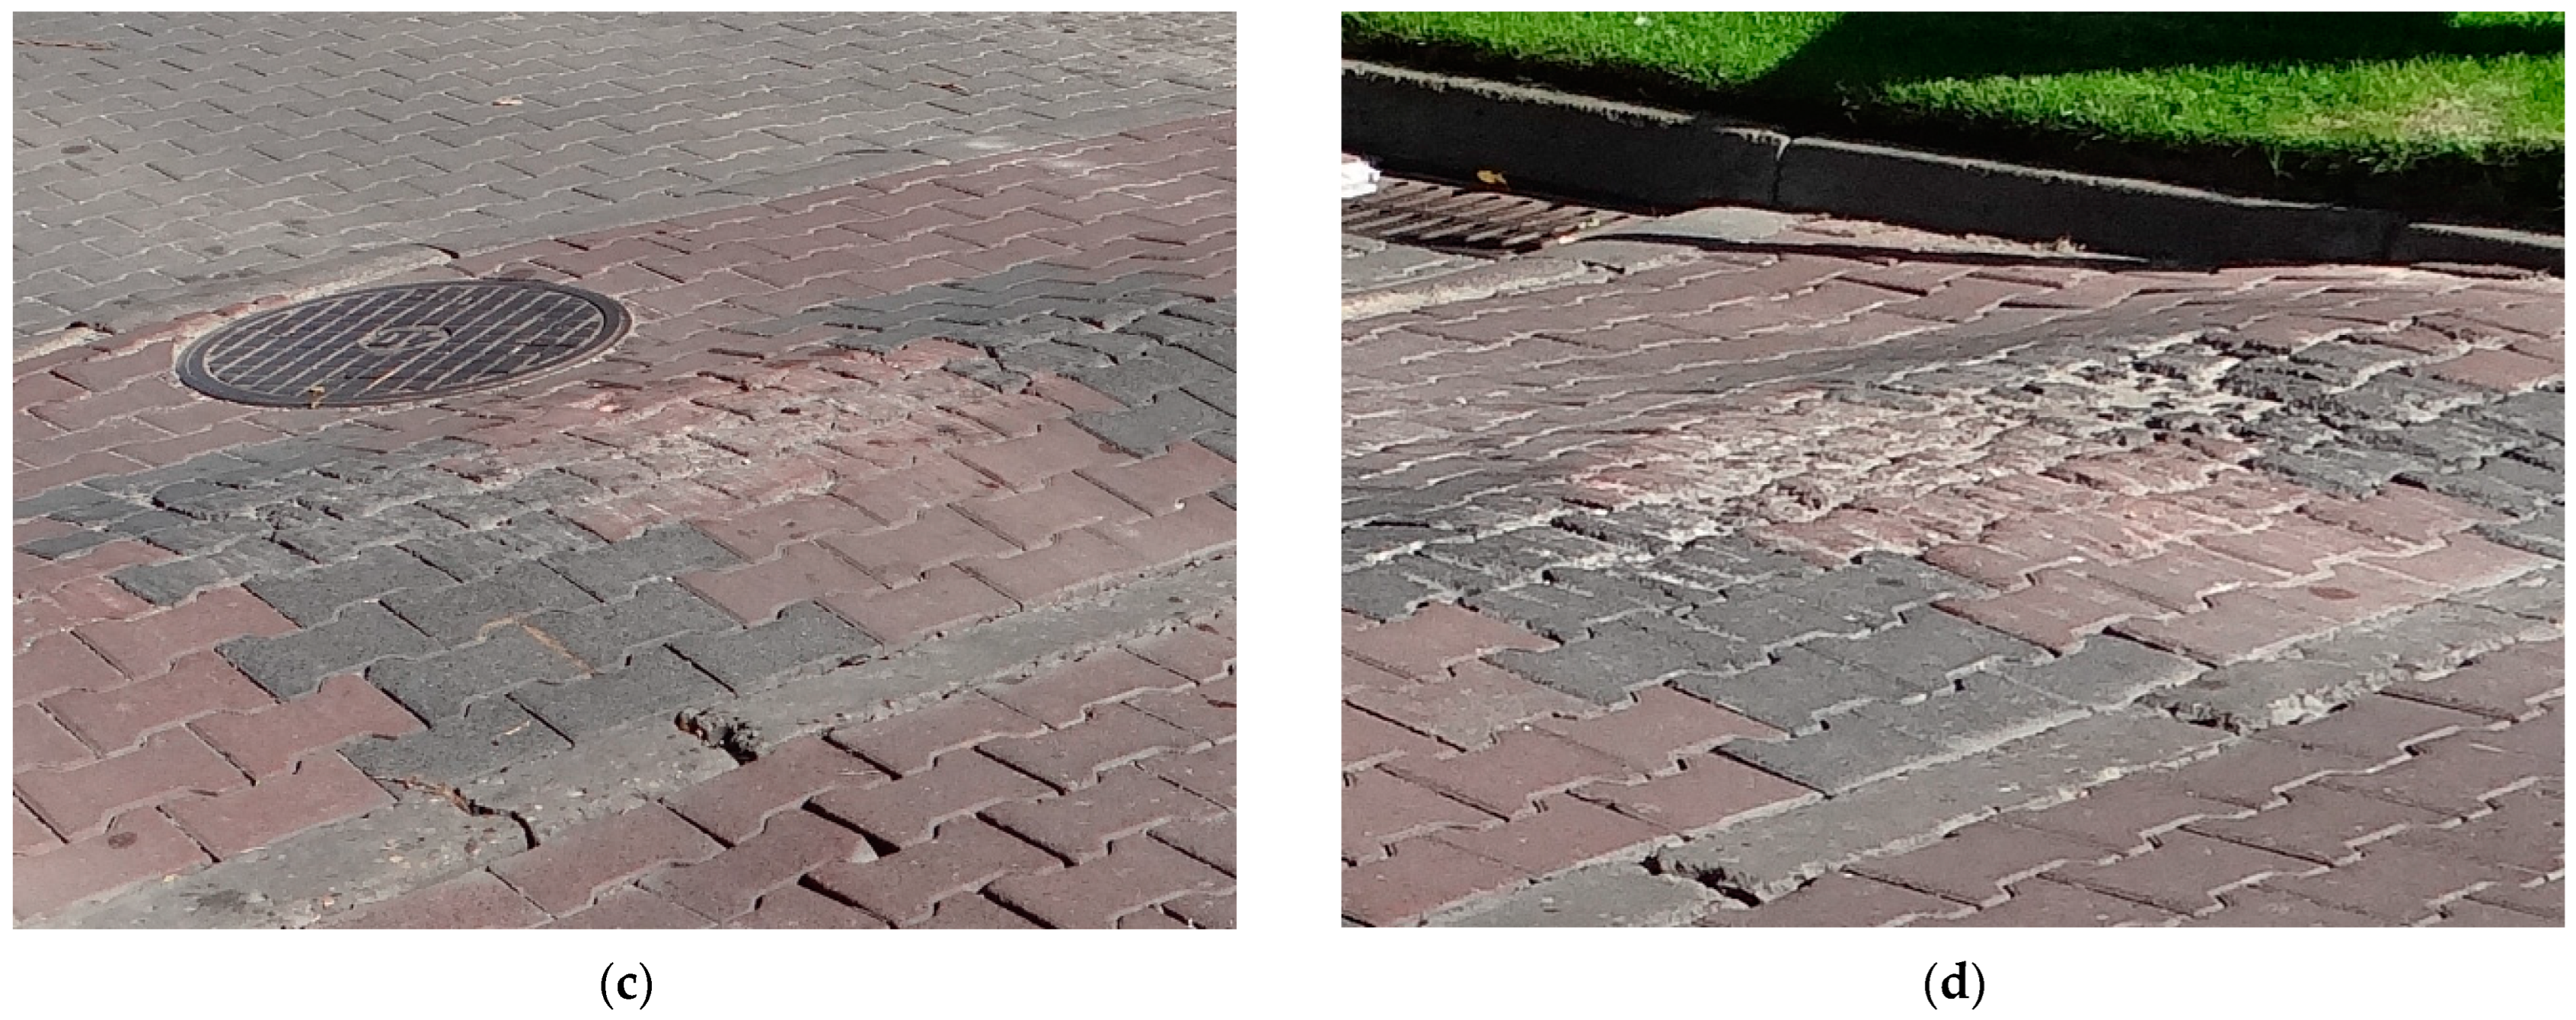
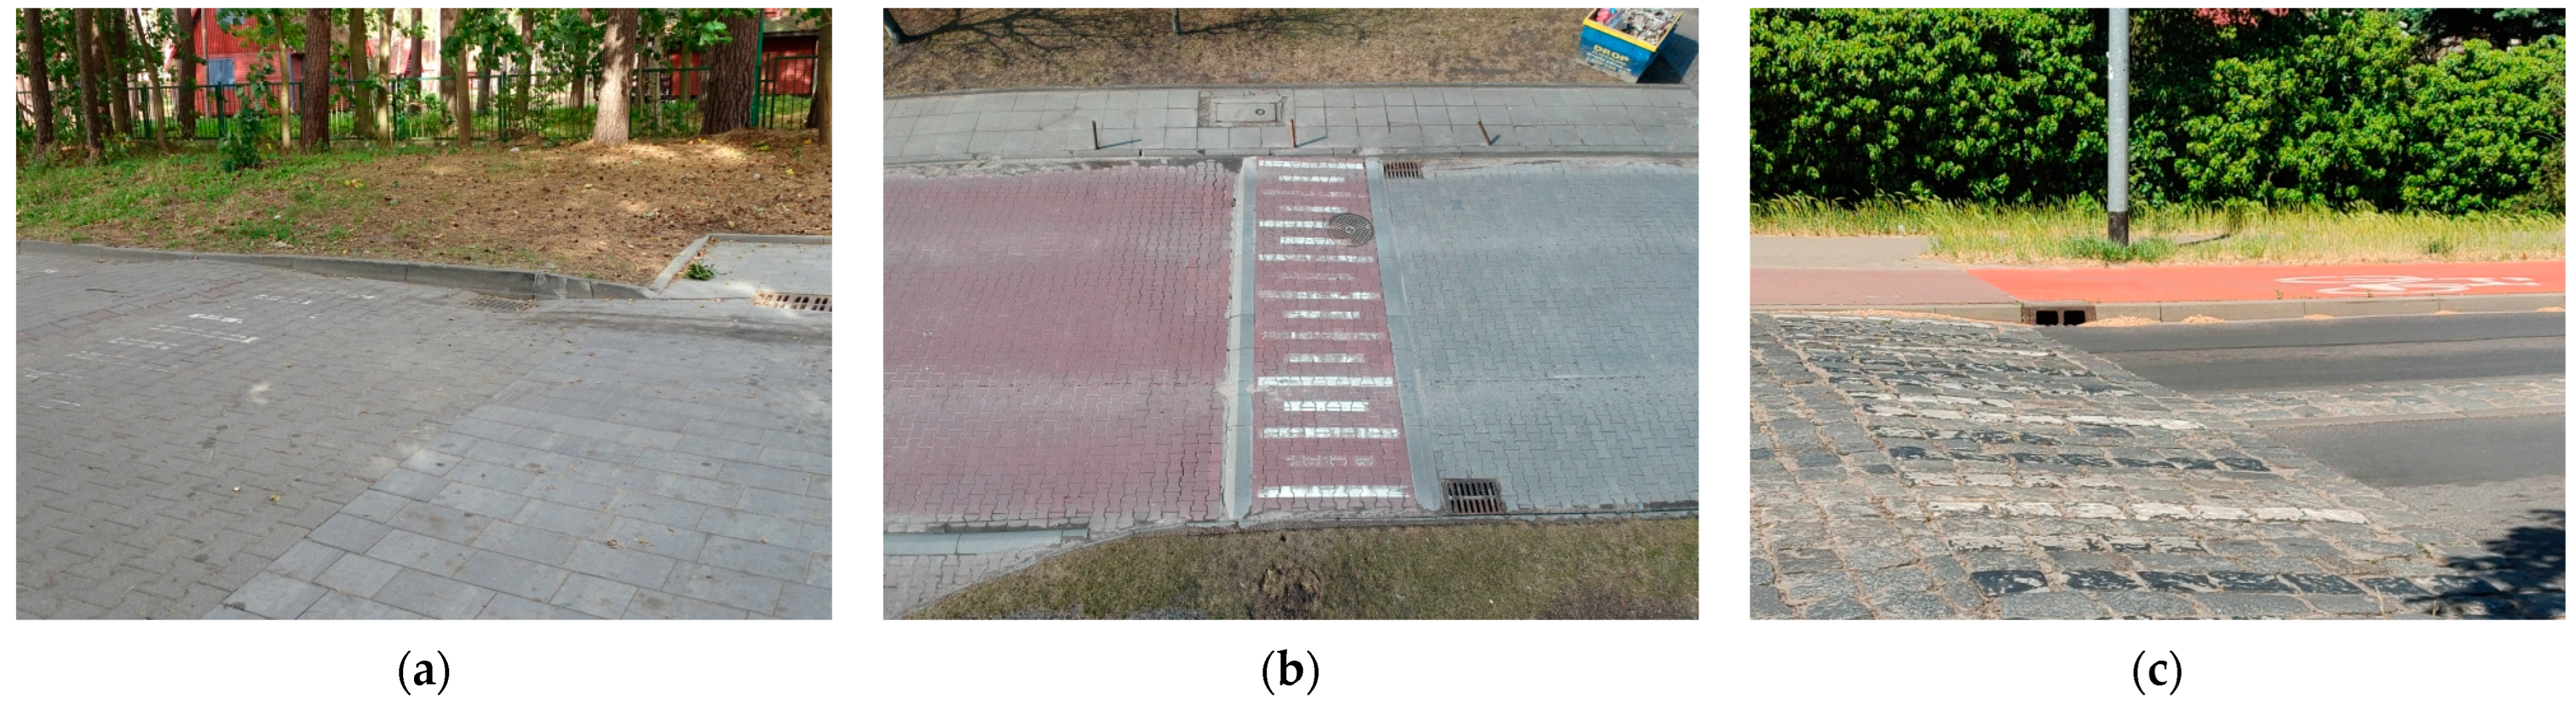
3.1. Results of the Identification of Pavement Surface Damage and Distress Based on Analysis of DM3D Models in the Surroundings of VTCDs Located in the Selected Home Zones

The scenario involving a set of three consecutive vertical traffic-calming devices is shown in home zone No. 1 in a small seaside resort town (Figure 8). More than a dozen years ago, four speed tables with concrete block paving were built on a short street (about 180 m long), providing access to small private resorts and terminating the main pedestrian street. Considering that in the summer the street is mainly used by holidaymakers and that roller, bike and go-kart enthusiasts organised races on it, at the request of the local inhabitants, a speed table was designed specifically to significantly calm the traffic and minimise racing owing to appropriately chosen shape and design parameters. Beyond the holiday period, the traffic volume does not exceed 30 veh./h. Over the last three years, this street has also been used by heavy construction vehicles due to the ongoing construction of several new holiday hotels in the vicinity.
The next streets, where the scenario of two consecutive vertical traffic-calming devices was applied, are in home zone No. 3 and home zone No. 6 (Figure 9). Home zone No. 3 is a local street in a suburban village located near the city of Szczecin, sided by private properties and as yet undeveloped building plots. Beyond the holiday period, the traffic volume does not exceed 20 veh./h. Home zone No. 6 is a driveway to a large housing estate composed of multi-family buildings, located in a suburban village. The longitudinal gradient of the street is 3.5%. Beyond the holiday period, the traffic volume does not exceed 50 veh./h. The analysed raised crossing was built over a dozen years ago. These are unique raised crossings with very steep on-ramps (25% gradient). A few years ago, on completion of the construction of multi-family buildings situated on both sides of the street, the problematic raised crossing was removed and replaced with conventional speed bumps made of prefabricated elements.
The next home zones, No. 2, No. 4 and No. 5, represent single vertical traffic-calming device scenarios (Figure 10). The first one is a raised crossing installed on the main pedestrian street in a small health resort town. Beyond the holiday period, the traffic volume does not exceed 50 veh./h. The next one is a speed hump installed at the entry to a raised four-leg intersection on the main street, distributing traffic to small home zones in a suburban village. Traffic volumes reach up to 200–300 veh./h during peak hours. In this case, the traffic survey was conducted twice, before and after the renewal. The last speed hump is located on the same street, distributing traffic to small home zones in a suburban village.
As mentioned before, based on the land survey data collected with the Trimble SX10 total station, longitudinal grades of the traffic lanes were obtained, and the vertical traffic-calming devices’ geometric parameters were determined (Table A1 in Appendix A).
On the basis of the obtained DM3D, the authors determined the subsidence surface areas before and after the analysed vertical traffic-calming devices in either traffic direction. The detailed subsidence data are given in Table 1. In addition, Table 1 presents also the characteristic parameters of the studied vertical traffic-calming devices. Regarding pavement distresses, their parameters were estimated both on the basis of the DM3D results and visual observations made during the surveys. All these data are summarised in Table 1, including subsidence surface areas at sewer grates pk where appropriate. Examples of DM3D models are represented in Figure A2 in Appendix B to illustrate the subsidence area and depth calculation procedure.
On 6 cm high, short speed tables (No. 1, No. 2 and No. 3) with 0.8–1.0 flat-top lengths and 8–20% on-ramp gradients, cracks or scratches were noted on several pavement blocks, with small chippings identified on the edges of the isolated blocks.
One of the analysed speed humps was installed at the beginning of a raised junction (in home zone No. 4). It was a two-step feature, heavily deteriorated after over a dozen years of traffic exposure (Figure 11a). For this reason, a renewal project was carried out there a few years ago, and a new 13 cm high speed hump was installed (Figure 11b). The main damages to the old speed hump included the spalling of the top part of the hump, mainly on the exit from the raised junction. Spalling and chipping of both kerbs laid at the beginning and at the end of the speed hump were also noted. The difference in speed hump heights in both directions of traffic proved to be significant in this particular case. The height of the speed hump at the exit from the raised junction was 8 cm before and 18 cm after the renewal project (Figure 11a). This was likely the main cause of the damage suffered by the upper surface of concrete blocks from the chassis of passenger cars leaving the raised junction. On the other hand, on the approach to the raised junction, drivers saw an 18 cm high speed hump and thus adjusted the speed to this difference of levels. On the speed hump after renewal, with a height difference of 11 cm, visible spalling of the concrete blocks’ surface was also observed in the first place, but this time, it was located in the opposite direction lane, at the raised junction entry leg (Figure 11b). Another main distress noted there was subsidence right behind the speed hump at the interface with the raised junction’s pavement.
No concrete block distress was identified on the other vertical traffic-calming devices (lt = 6.0–8.0 m long and 5–8 cm high).

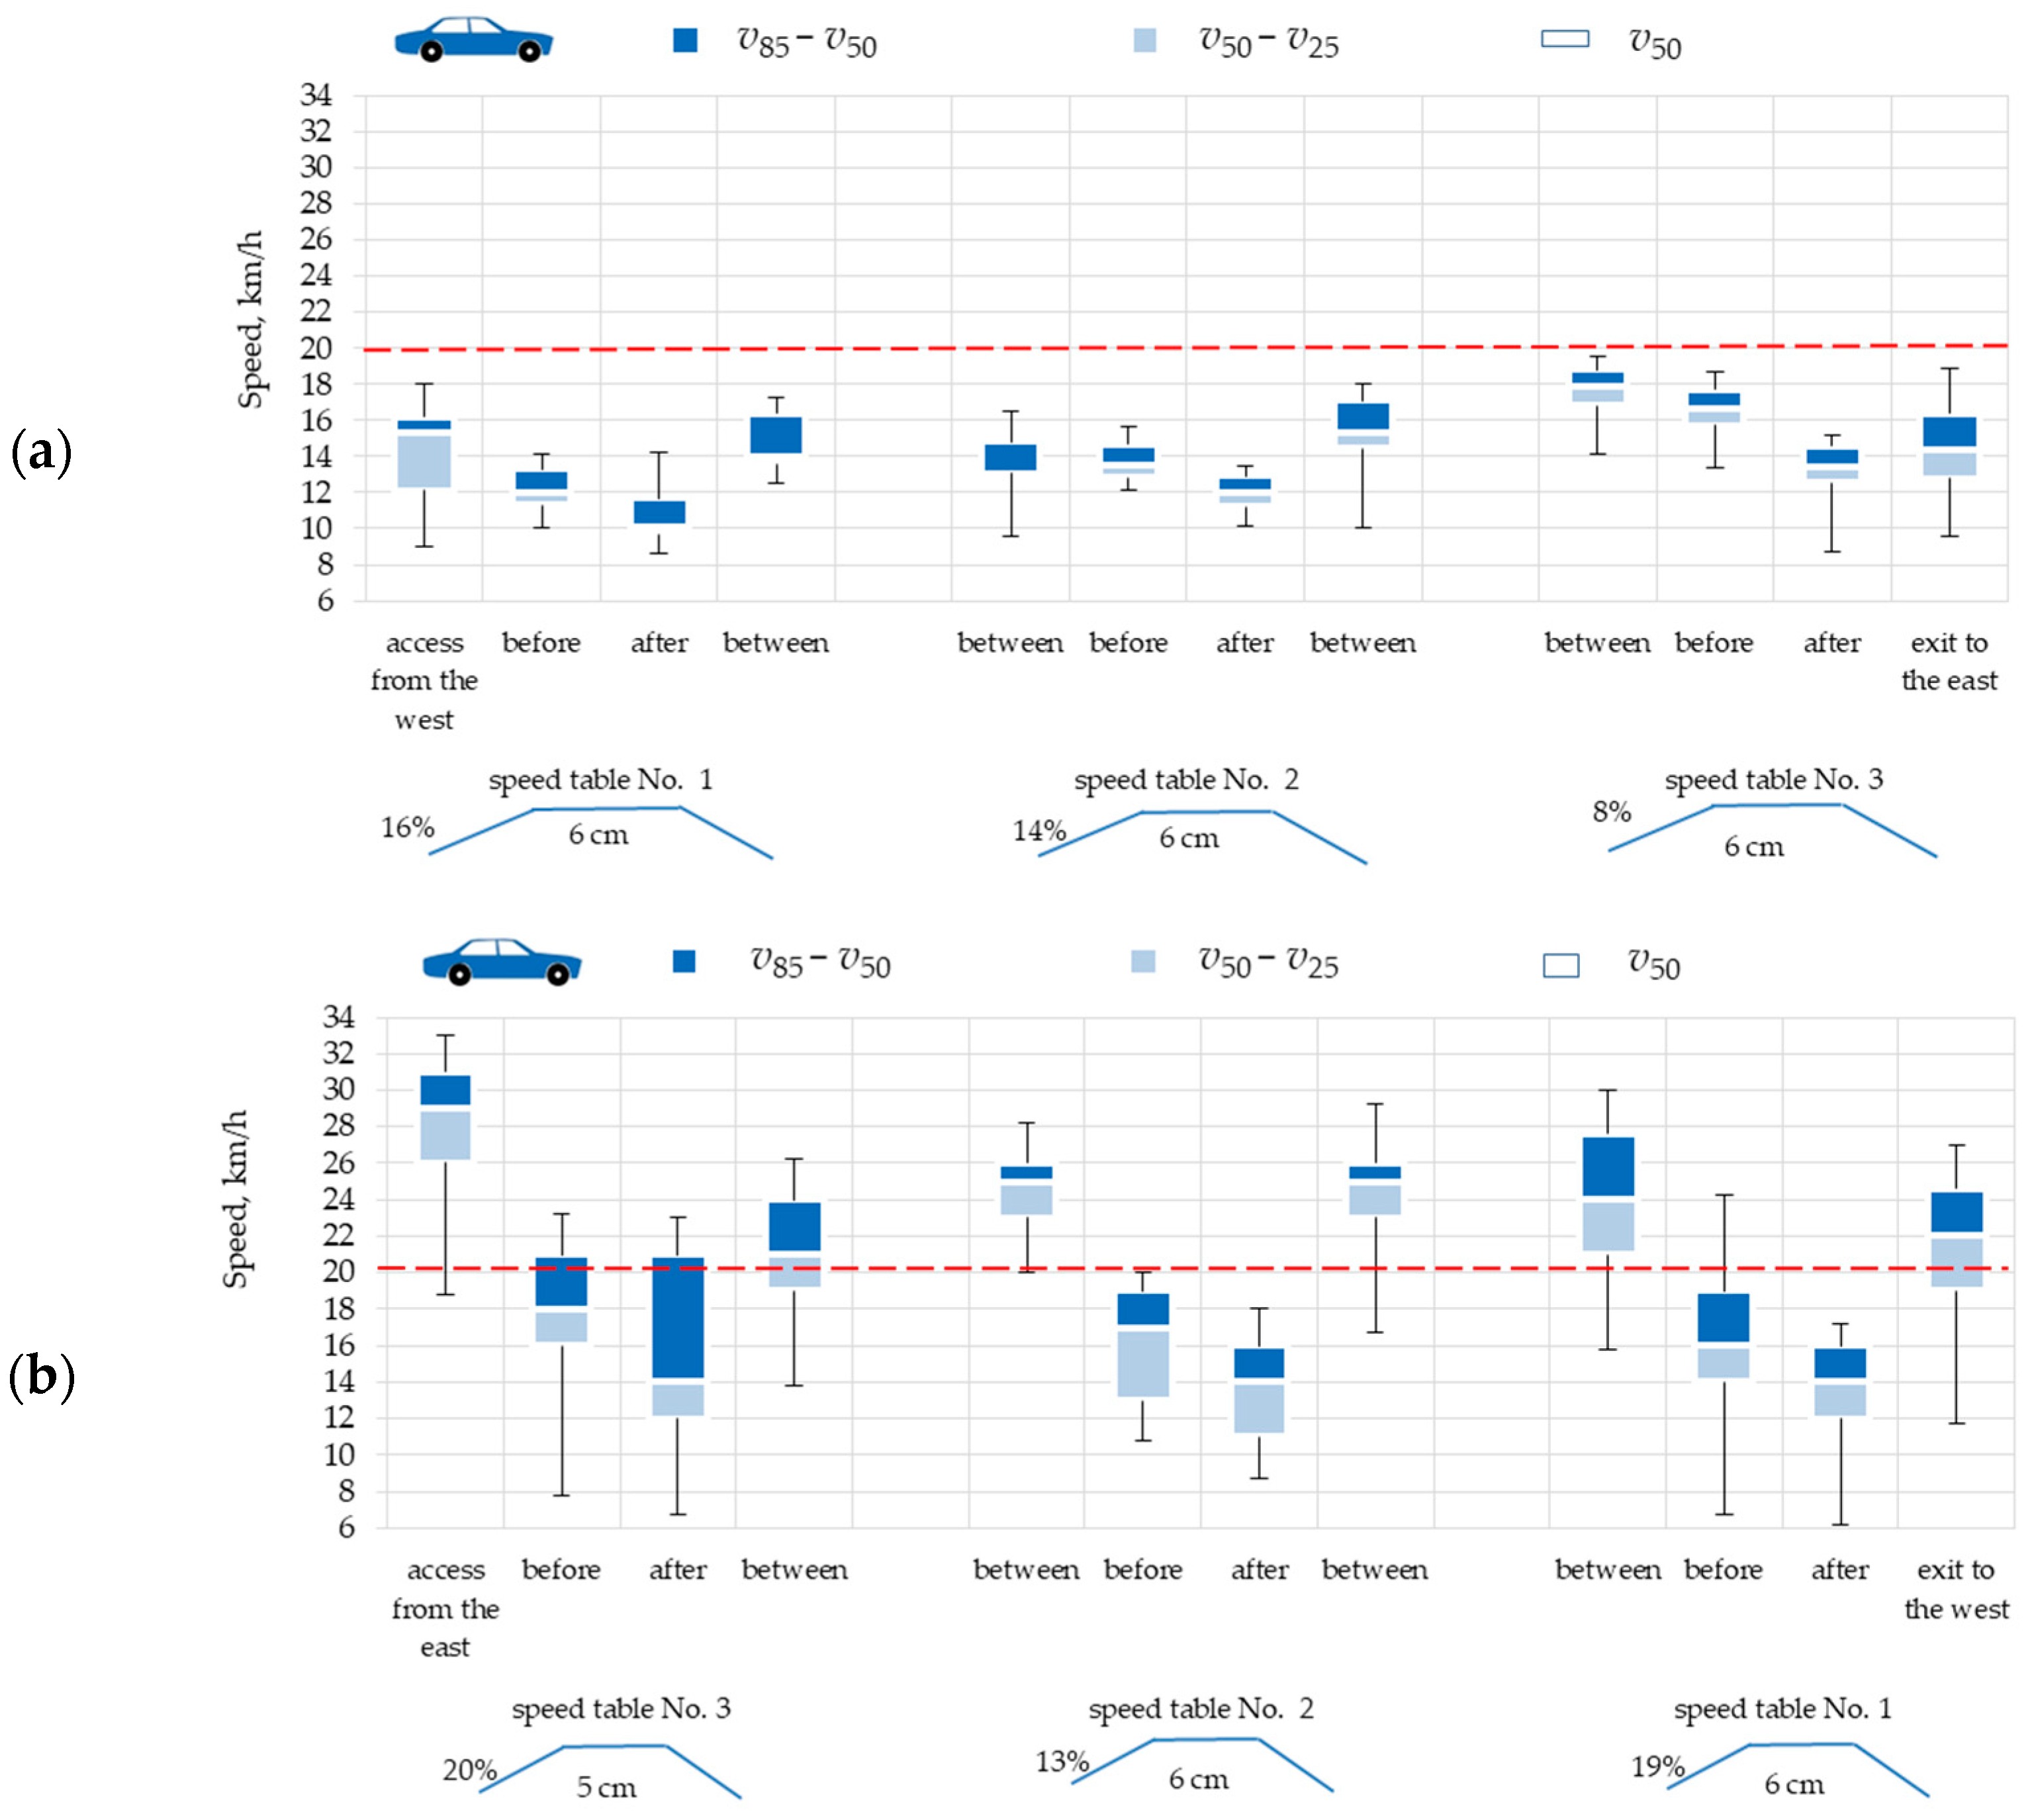
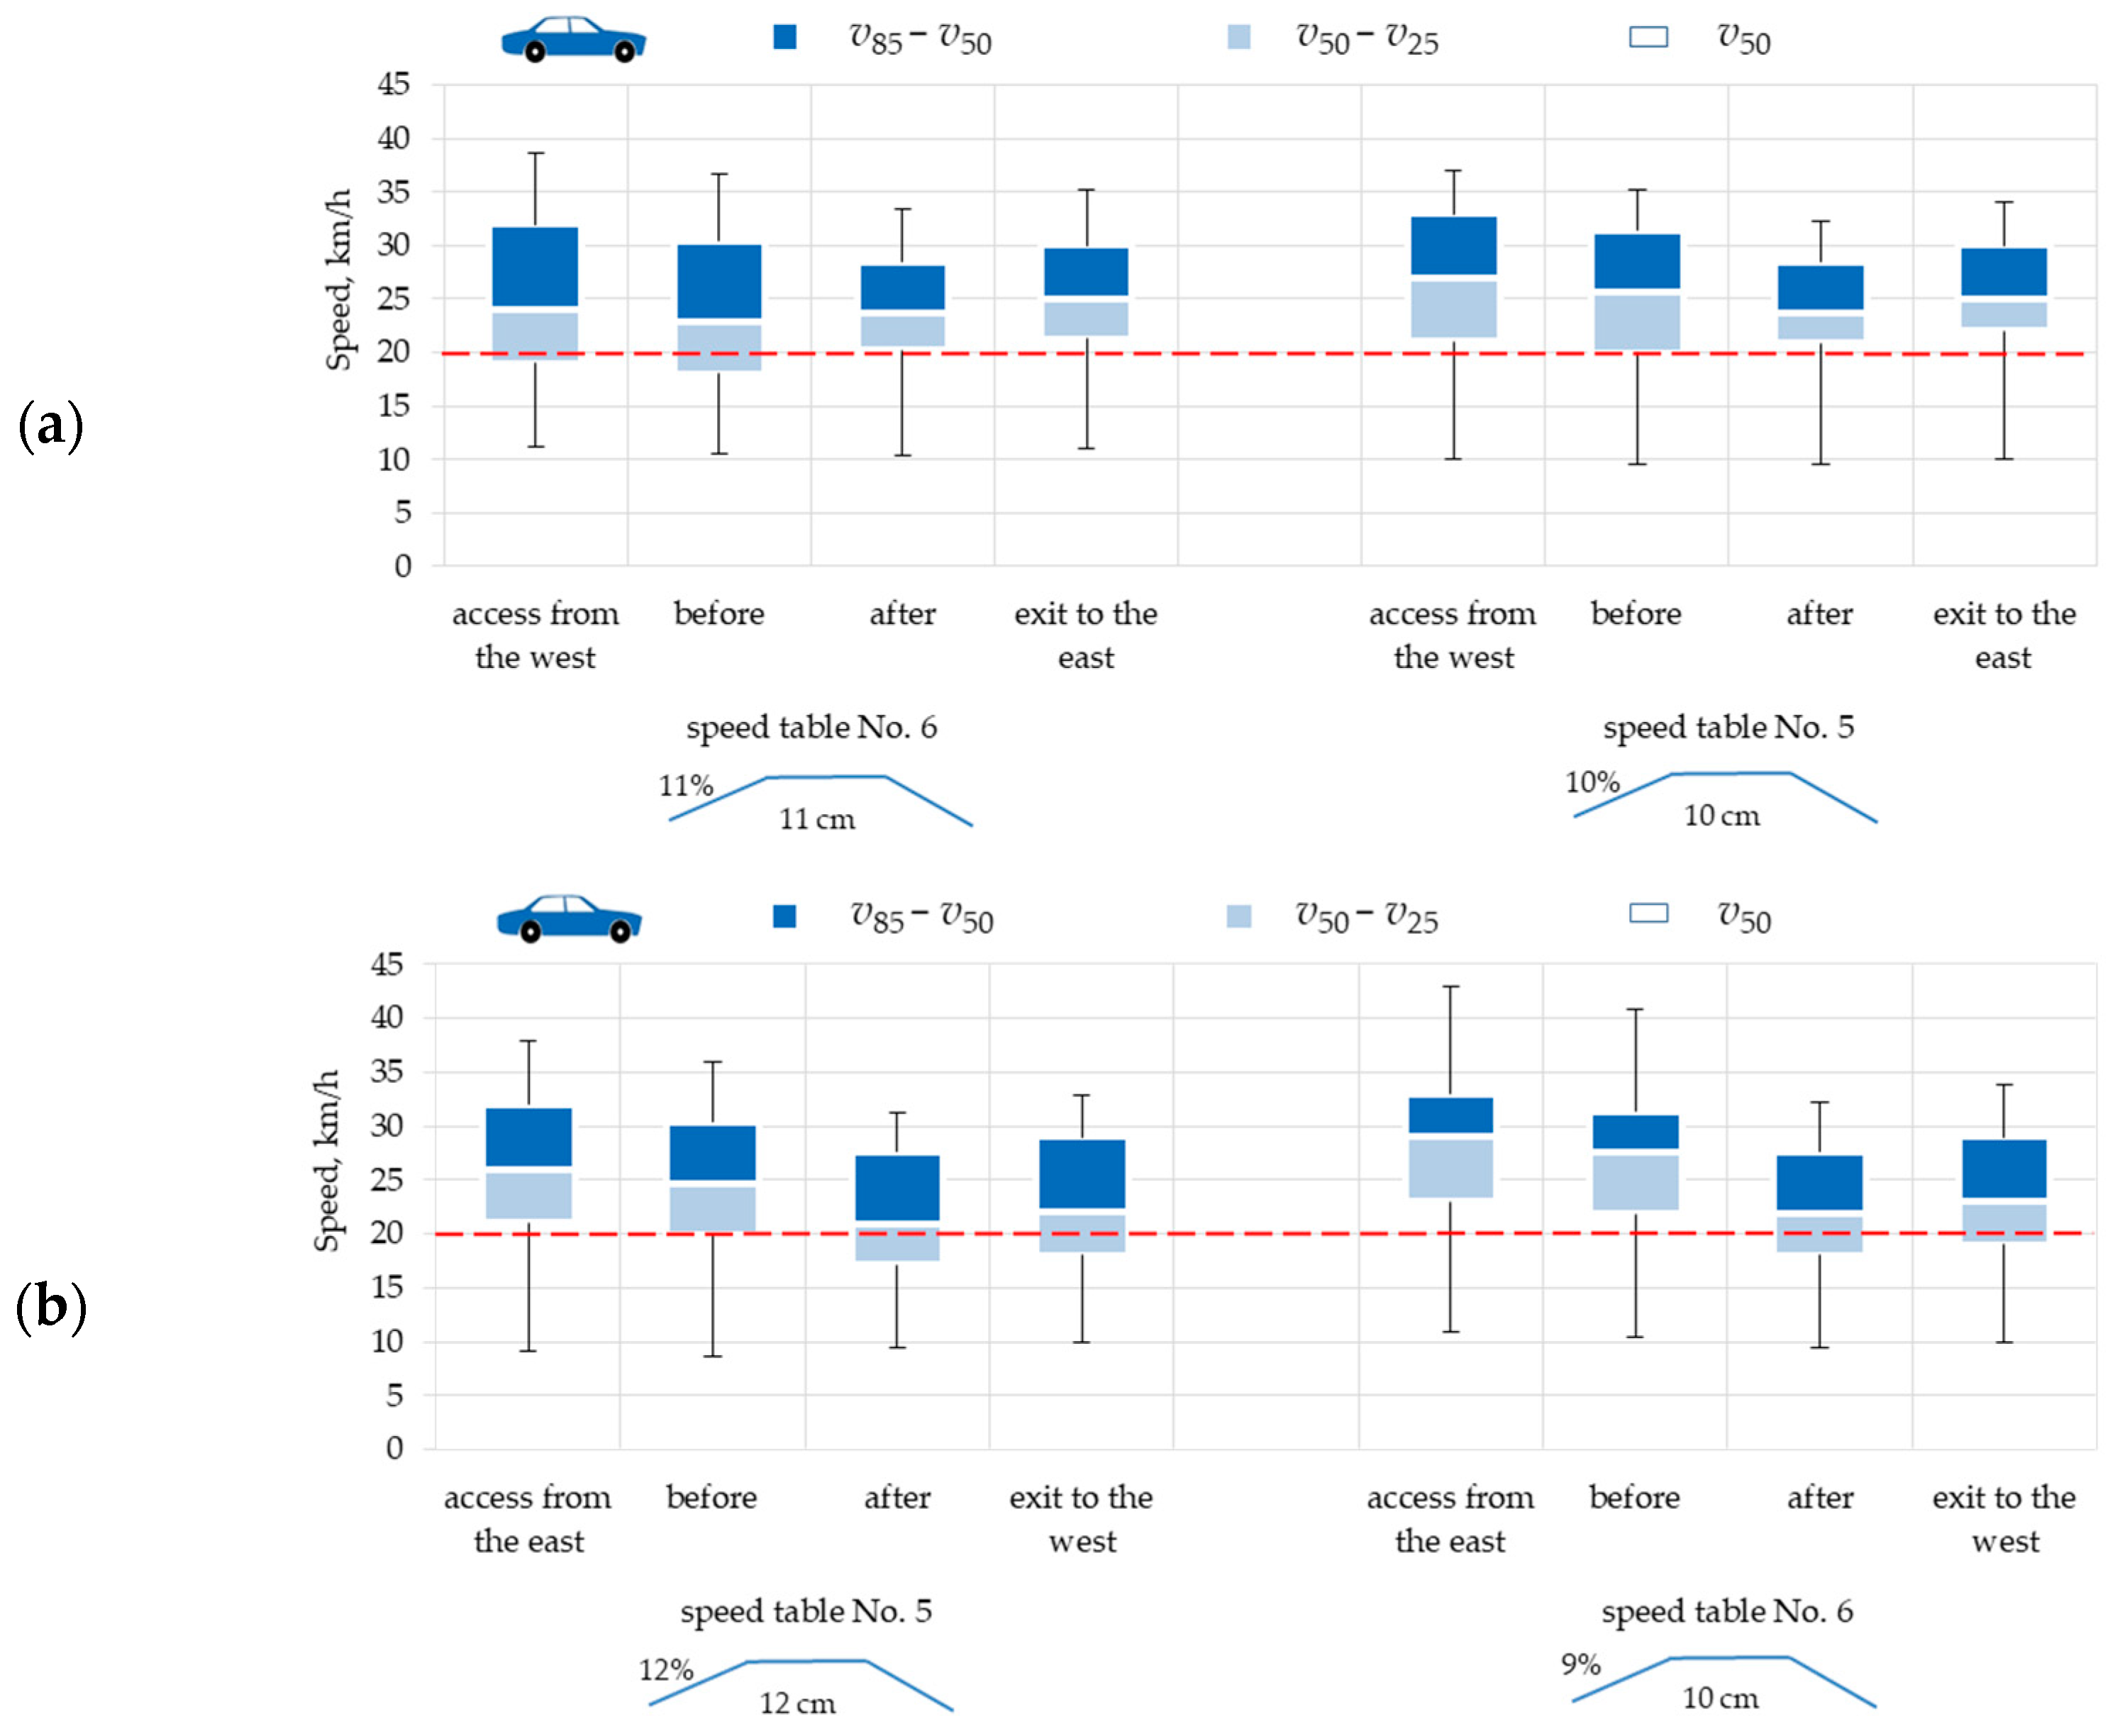
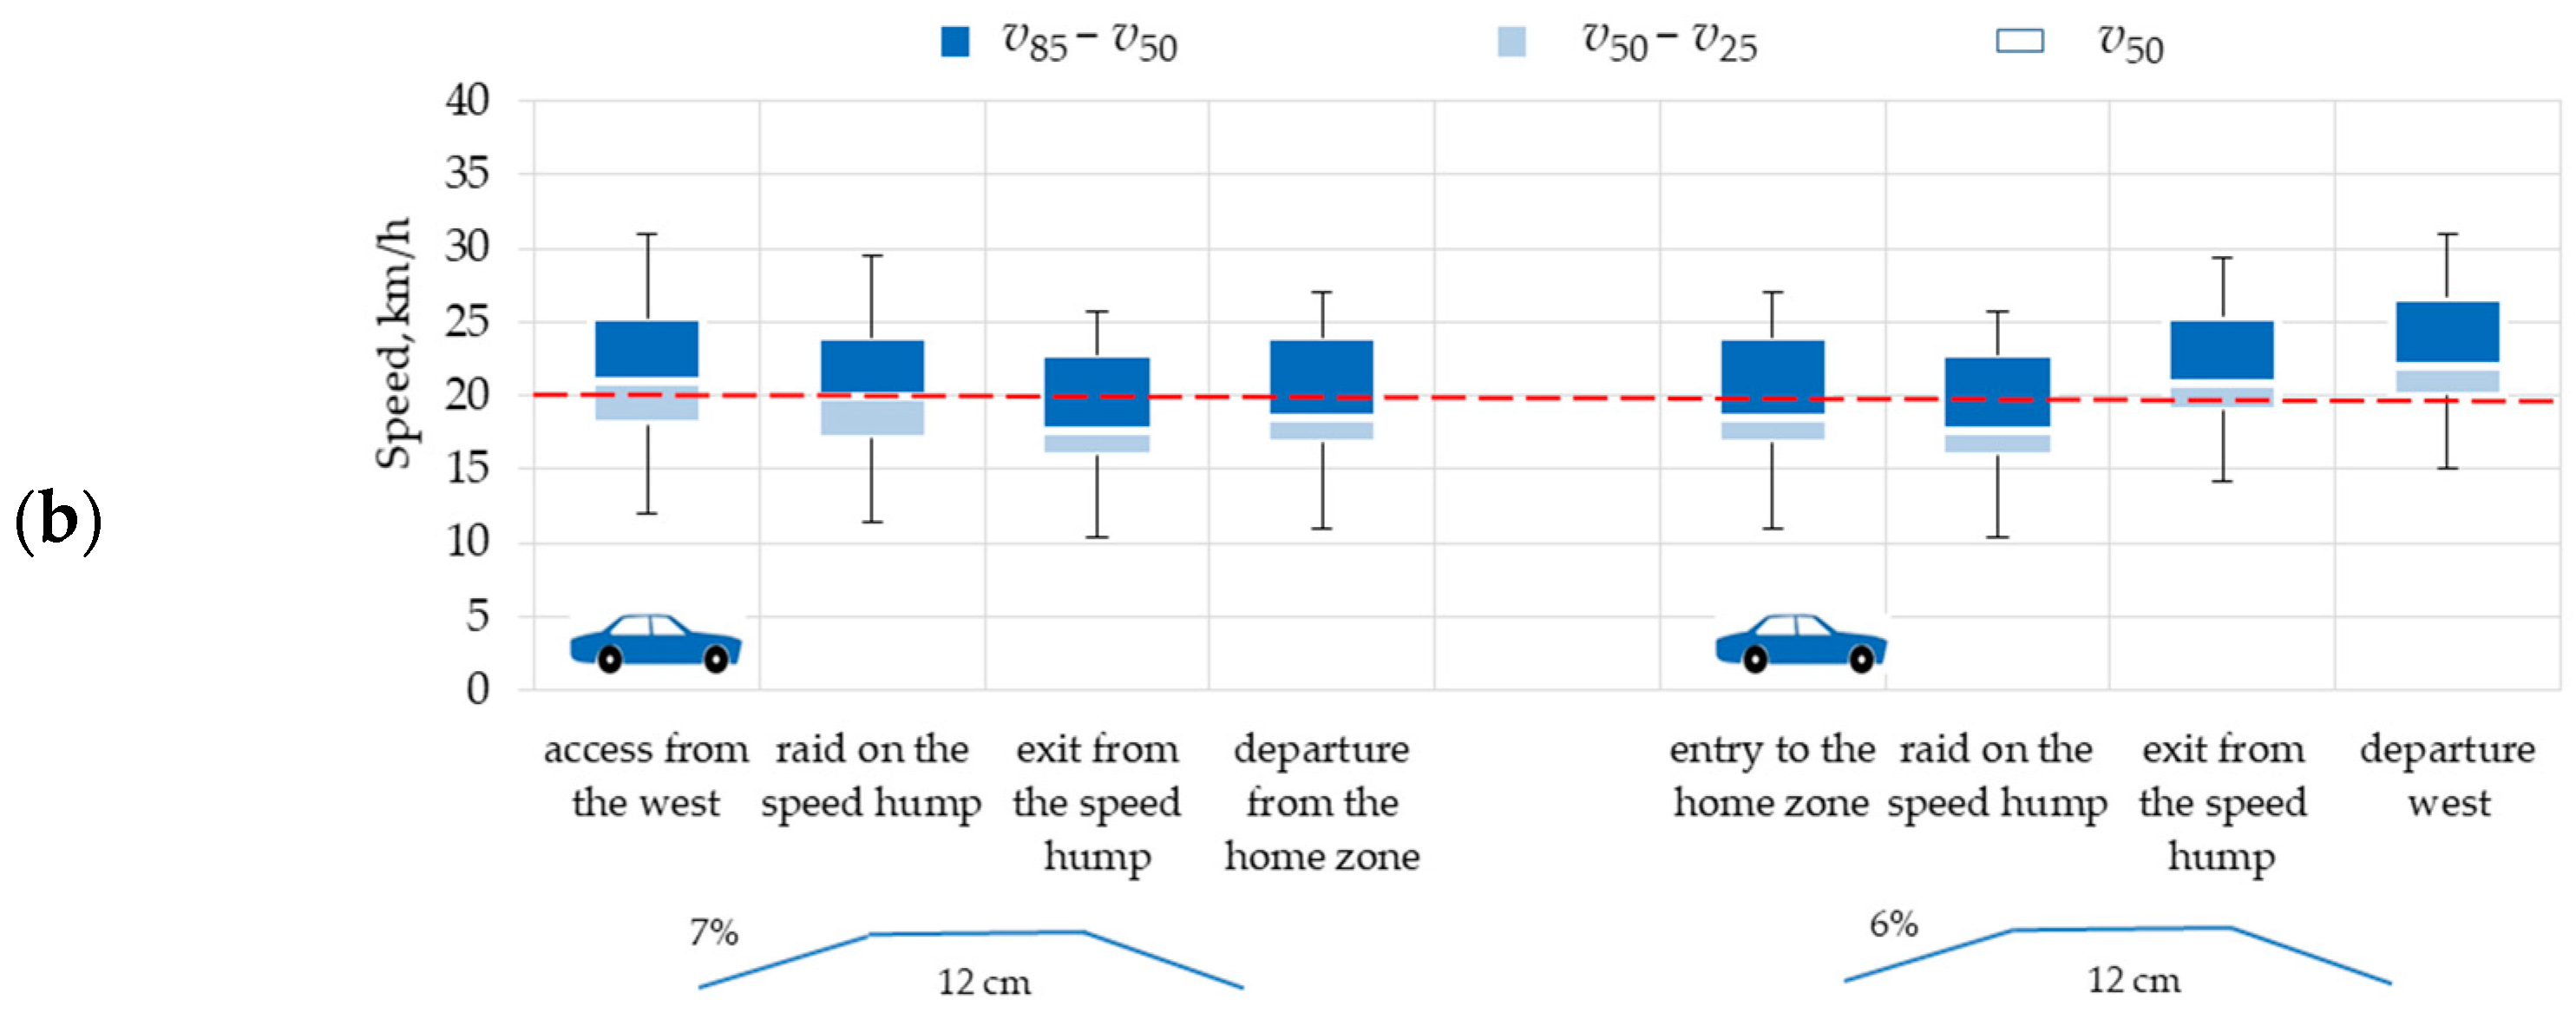
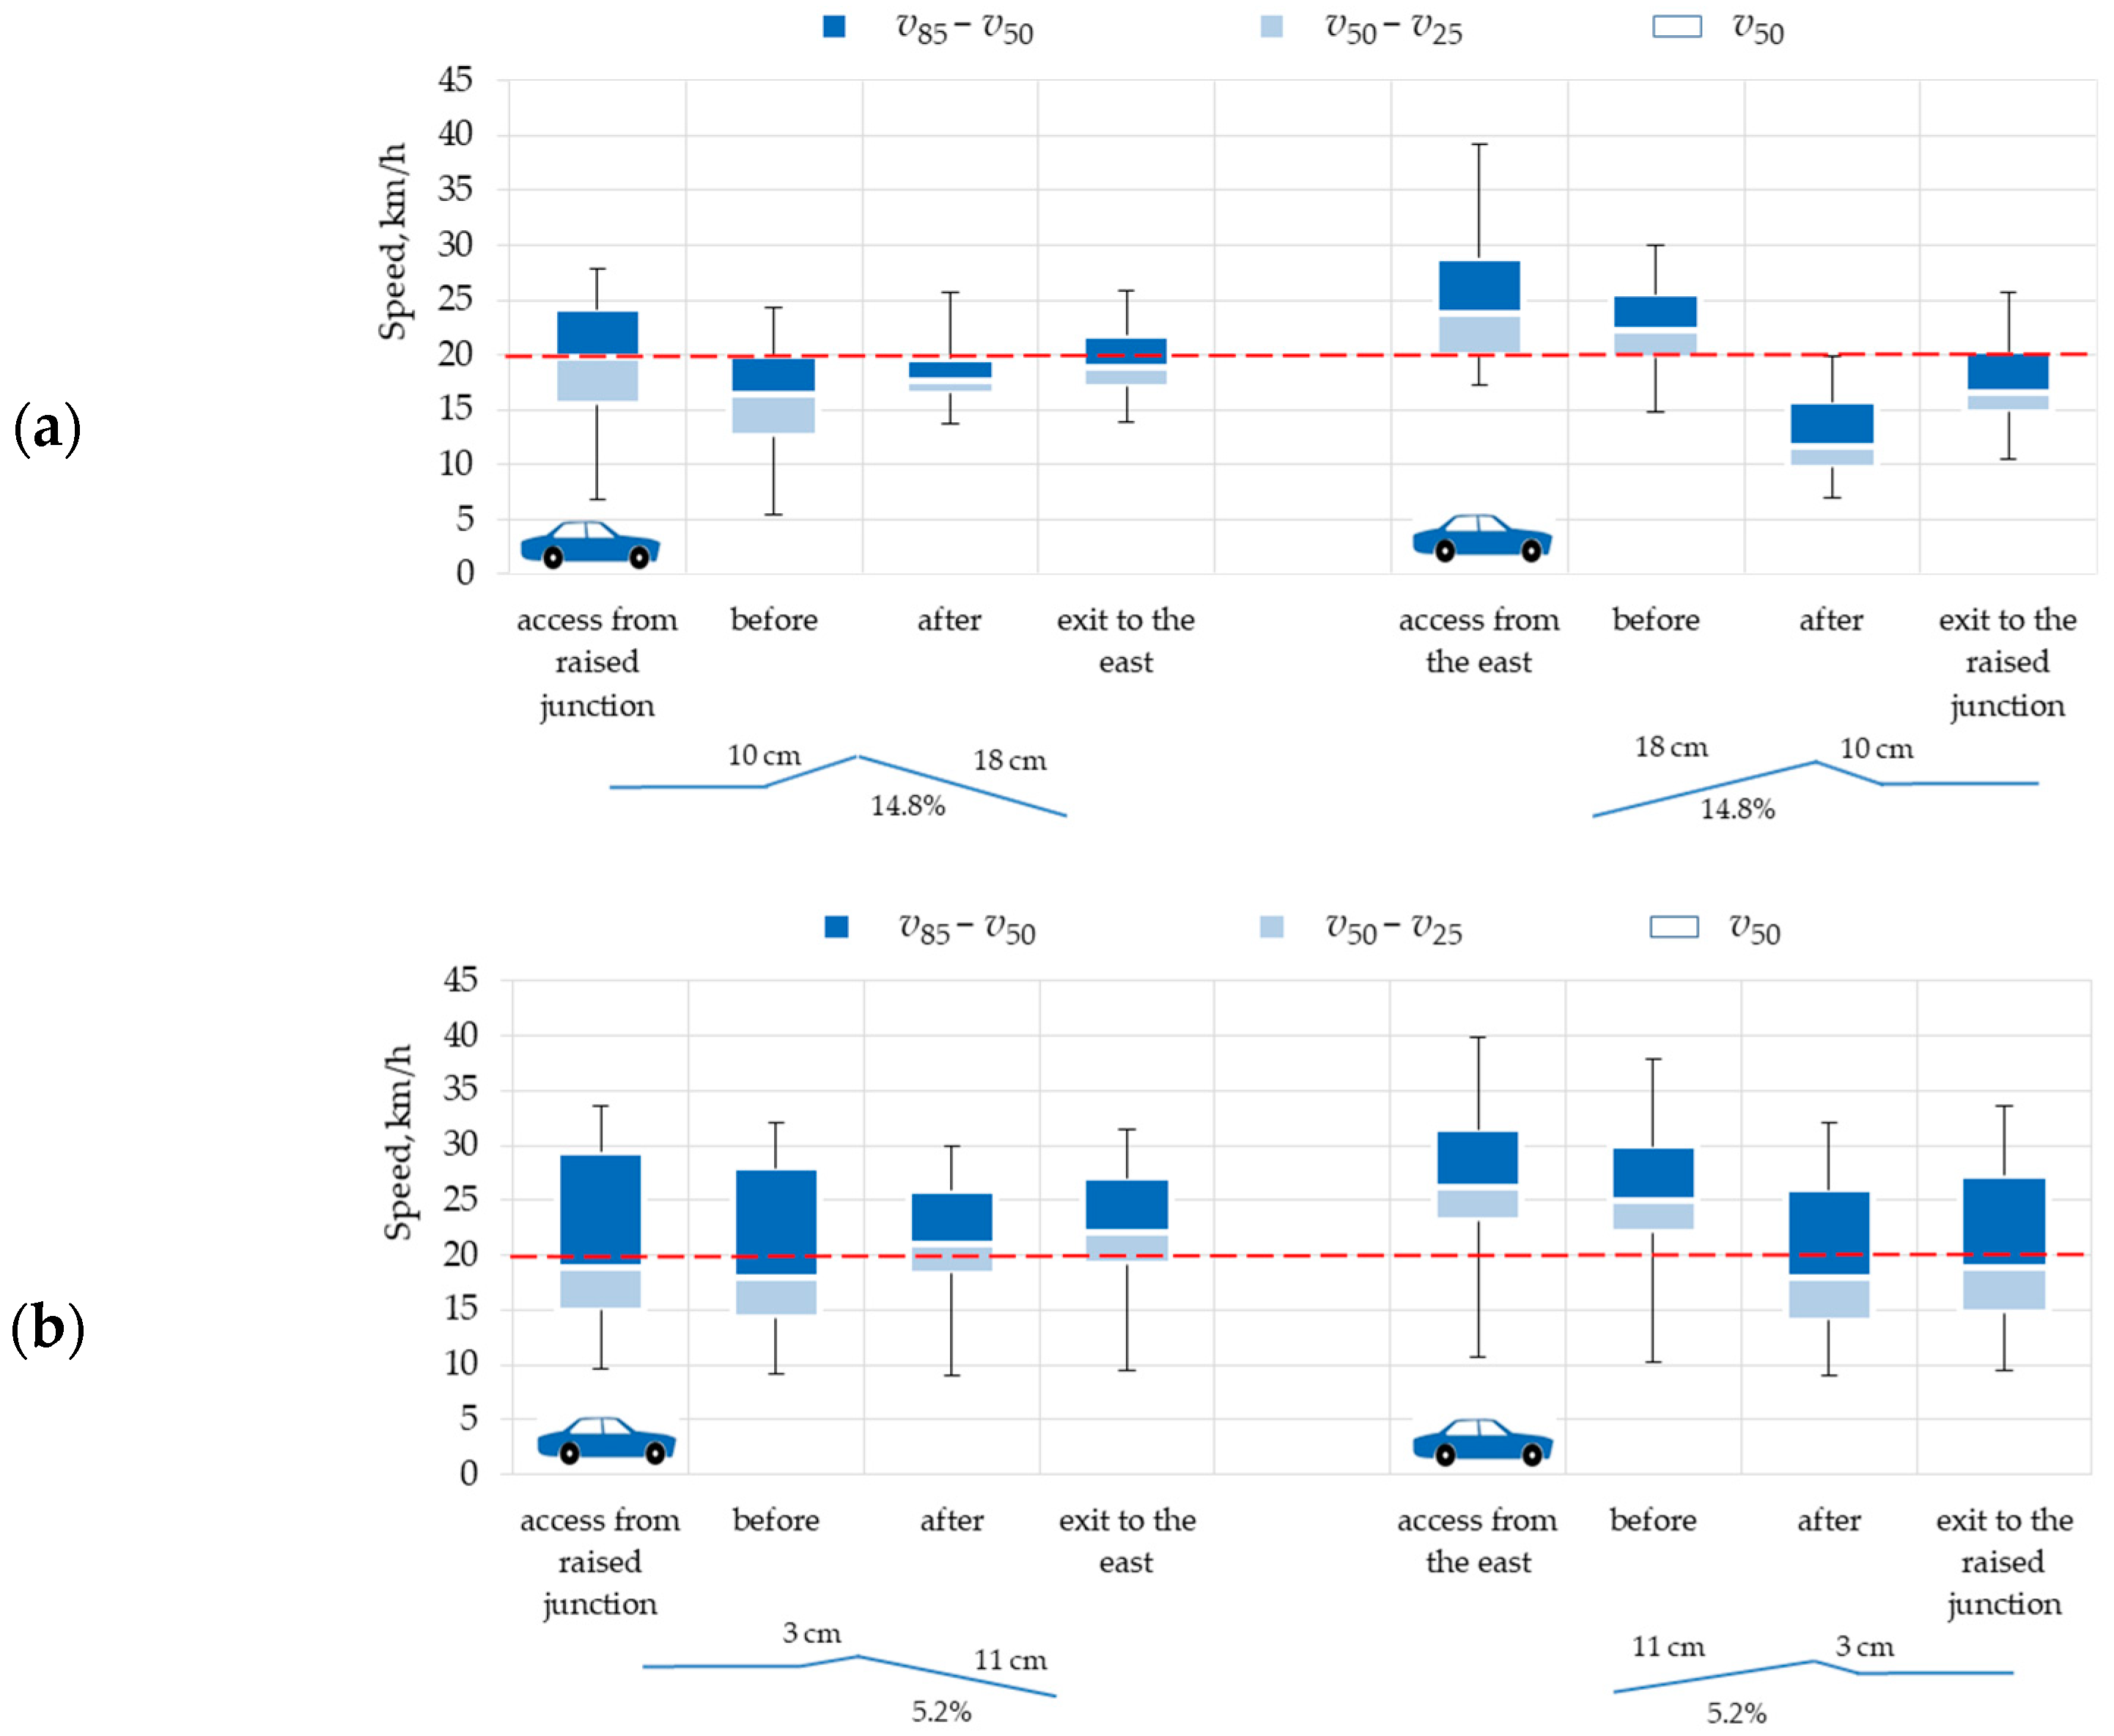
3.2. Results of Speed Surveys in Home Zones

The vehicle speeds were measured at several test sites distributed along each traffic direction. Normality tests were carried out for all the vehicle speed populations. Normal distributions were obtained in all cases. This made it possible to estimate v85 and vav in free-flowing traffic conditions and to take the determined values as a basis for further analyses for each vertical traffic-calming device under study (Table 2). Table 2 gives the calculated v85 and vav values before and after the respective vertical traffic-calming devices. Appendix C in Figure A3, Figure A4, Figure A5, Figure A6 and Figure A7 shows box plots of all the speed results obtained from the passage through all the analysed vertical traffic-calming devices. Table 2 also lists the estimated acceleration and deceleration values on the approach to the vertical traffic-calming devices and the departure from the vertical traffic-calming devices, respectively.
In the comments on the results presented in Table 2, it is necessary to cite the results obtained by other researchers [2,64,65,66,67,68,69], who, in their conclusions, summed up that traffic calming is a complex issue and its main objective is accident prevention. Driving behaviour and skills are rarely taken into account when analysing the obtained speed reductions. Other researchers, in commenting on the results obtained from their studies, reported that the speed reduction on approach to analogous traffic-calming measures depends largely on the driver’s temperament and on the habits of pedestrians, the latter in the case of raised pedestrian crossings [11,25,28].
Similar conclusions and summaries can be formulated with regard to the results presented in Table 2. The final speed reduction results were in fact influenced not only by the parameters of the analysed vertical traffic-calming devices or by the street parameters (mainly the longitudinal gradient of the street and vertical traffic-calming device arrangement scenarios) but also by the drivers’ temperaments, their knowledge of the route and driving by rote, the type of home zone, vehicular and pedestrian traffic parameters and the streetscape of the immediate surroundings.

4. Discussion and Pavement Design

4.1. Relationship between VTCD Parameters and Traffic Parameters

As a rule of thumb, home zone vertical traffic-calming device parameters are based on the adopted vertical traffic-calming device arrangement scenario. In the analysed cases, the relationships between these parameters were examined, and the results are given in Table 3 below. As can be seen, these relationships vary between the different scenarios and locations. The traffic parameters were found to depend on the vertical traffic-calming device ramp slope and the flat-top length in two or three consecutive vertical traffic-calming device scenarios. In single vertical traffic-calming device scenarios, almost all geometrical parameters mattered. Different relationships were obtained between these geometrical parameters and horizontal forces acting on the pavements. In several consecutive vertical traffic-calming device scenarios, the approach decelerations and departure accelerations were found to depend on almost all the vertical traffic-calming device’s geometrical parameters, except for the flat-top length in the case of accelerations. Most probably, the spacing intervals between the consecutive vertical traffic-calming devices also mattered. Other relationships were obtained for the single vertical traffic-calming device scenarios, which is consistent with the conclusions formulated in [69]. Thus, it can be concluded that traffic parameters depend, in general, on the vertical traffic-calming device’s height and length and do not depend on the on/off-ramp gradients.
The studied horizontal force vs. vertical traffic-calming device geometry relationships were found to be varied and indefinite. Summing up, we may state that similar analyses are scarce in the available publications. Examples of similar analyses can be found in [10,23,32,33,35], yet they are hardly comparable with this study’s results due to the different vertical traffic-calming device siting and geometrical parameters. With regard to horizontal forces, we can compare only the accelerations and declarations given in Table 3 with the study results published in [23]. Still, this can only be carried out for some of the vertical traffic-calming devices located in traffic-calmed zones, as the locations of vertical traffic-calming devices studied in [23] varied strongly in terms of vehicle speed limit.
A limitation of this study is the location of all the analysed vertical traffic-calming devices within a home zone area. The differences between the different home zones included the surrounding streetscape, street function and traffic volumes. The primary criterion for choosing a given vertical traffic-calming device was, in addition to its location in a home zone area, the condition of the concrete block paving that had been in operation for over a dozen years. Nevertheless, the values and relationships obtained in this study can serve as guidance for other designers.

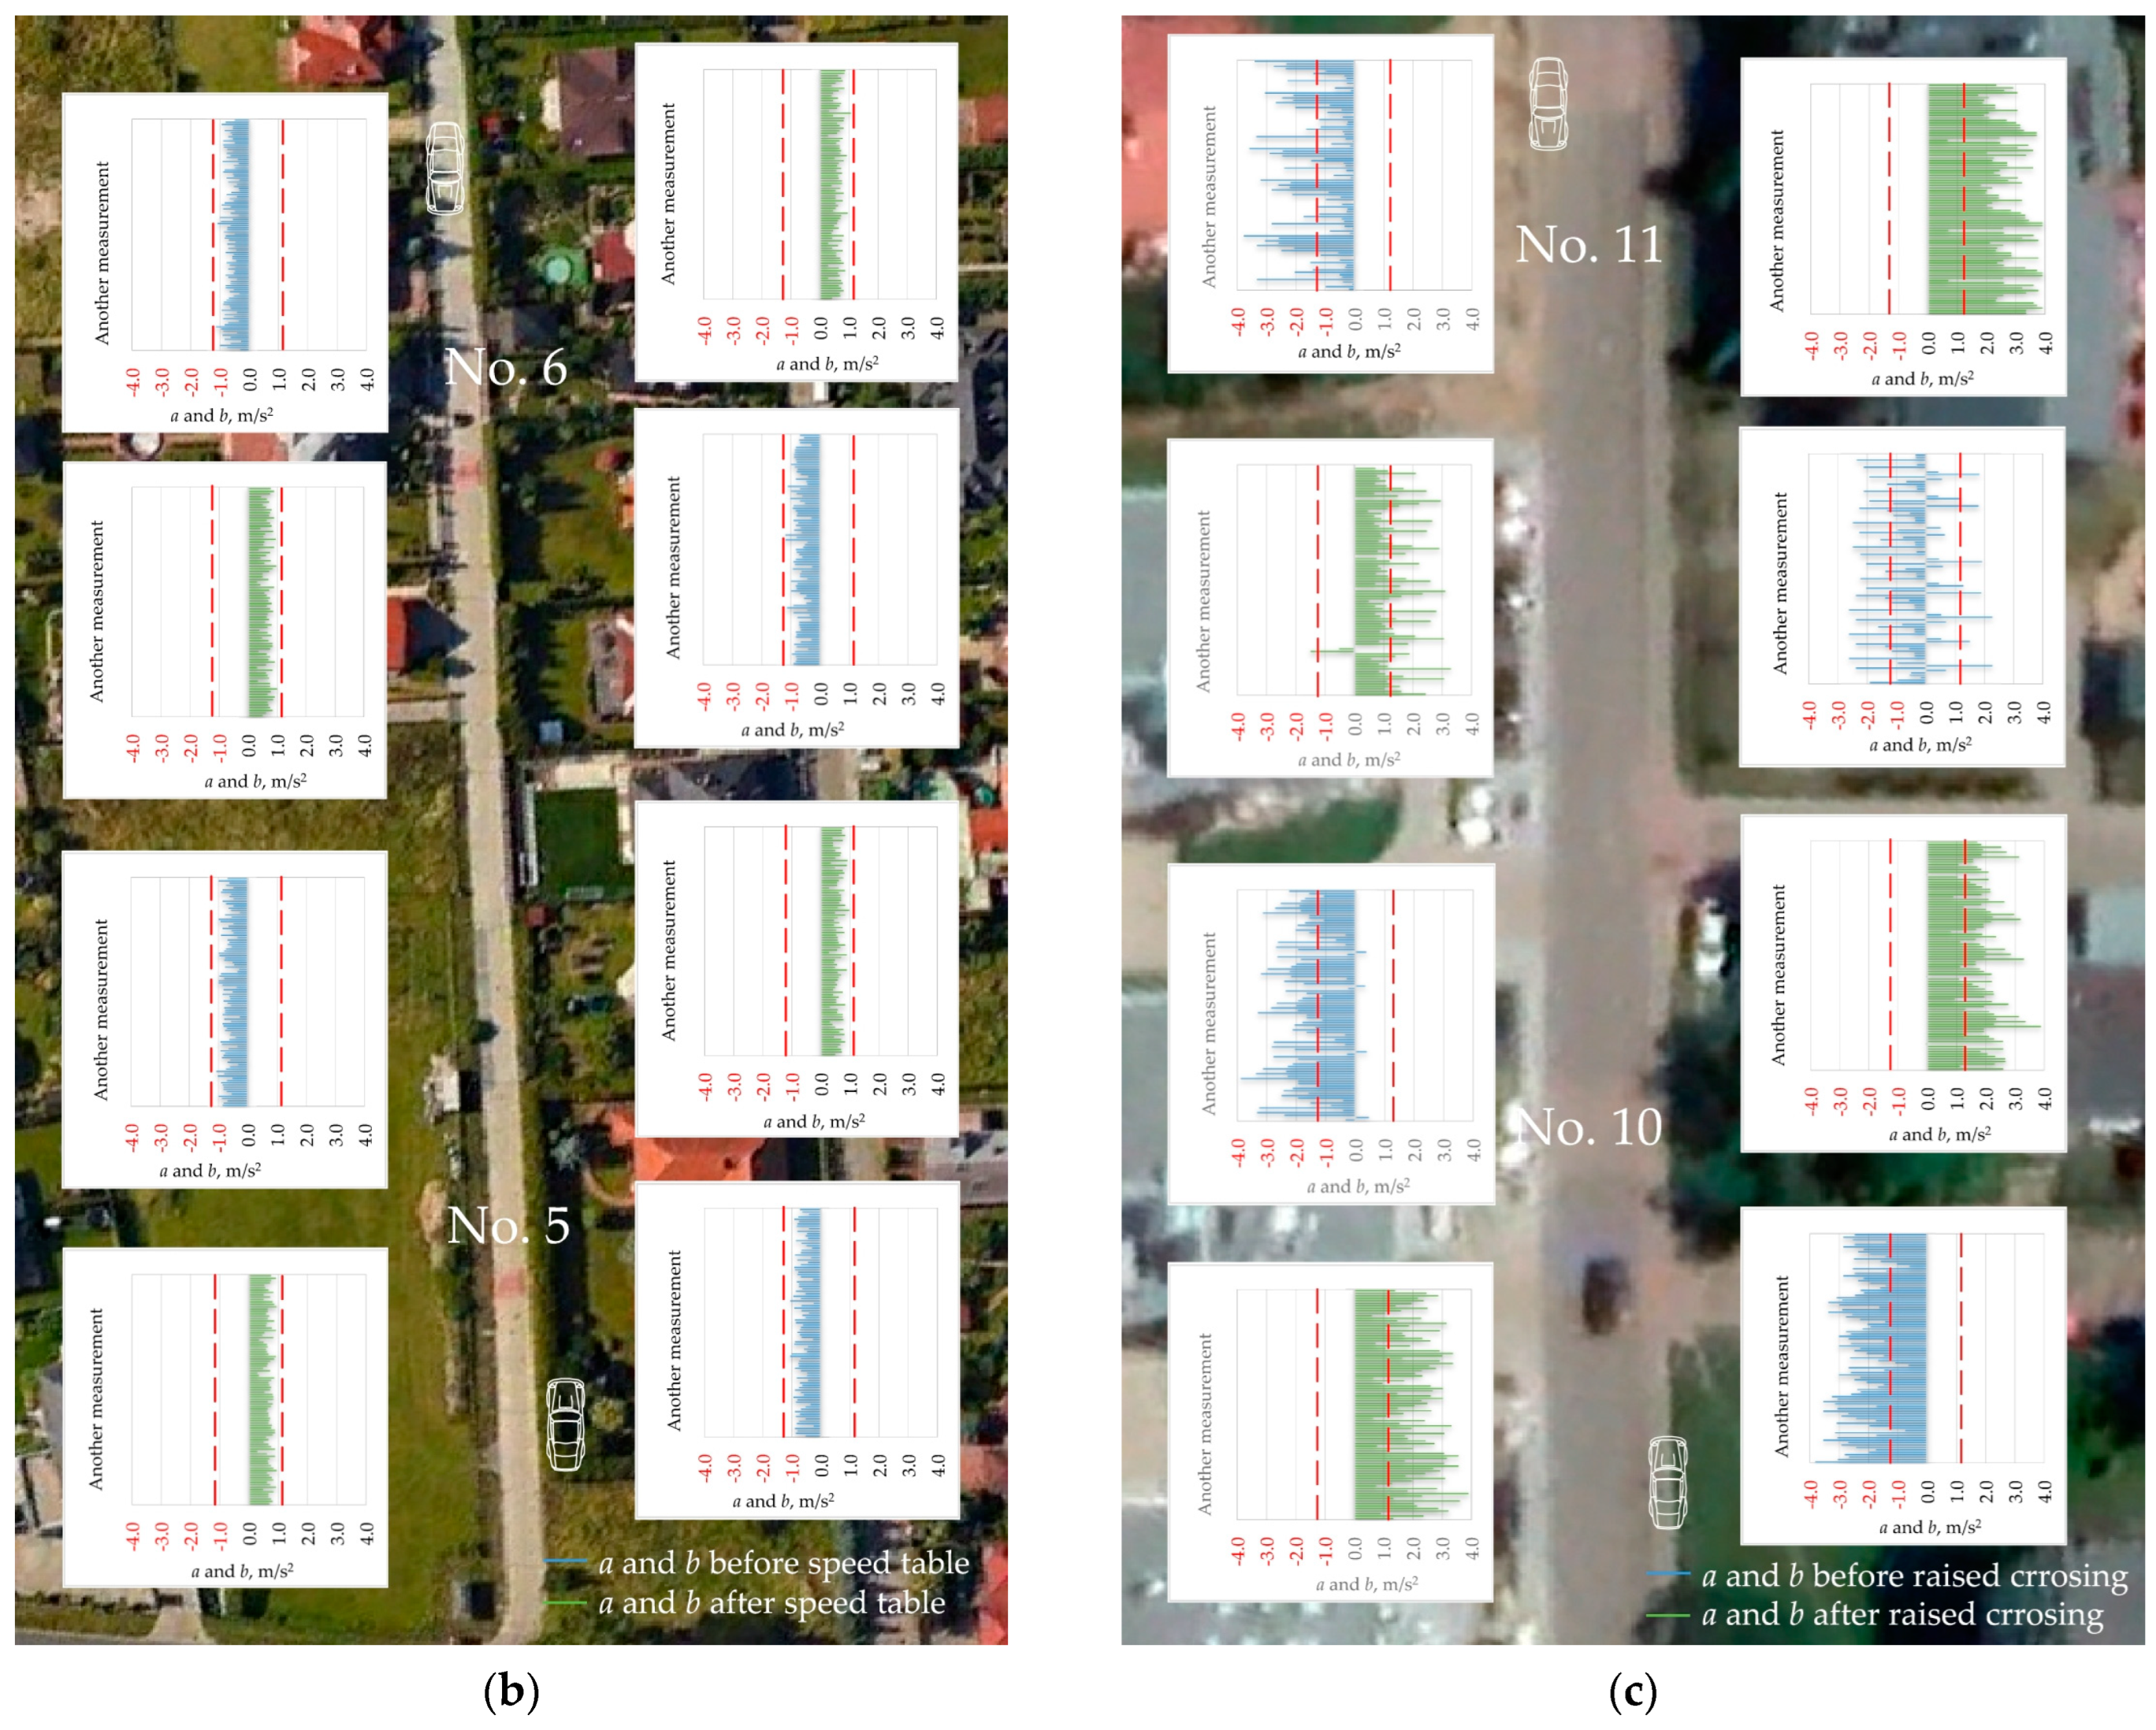
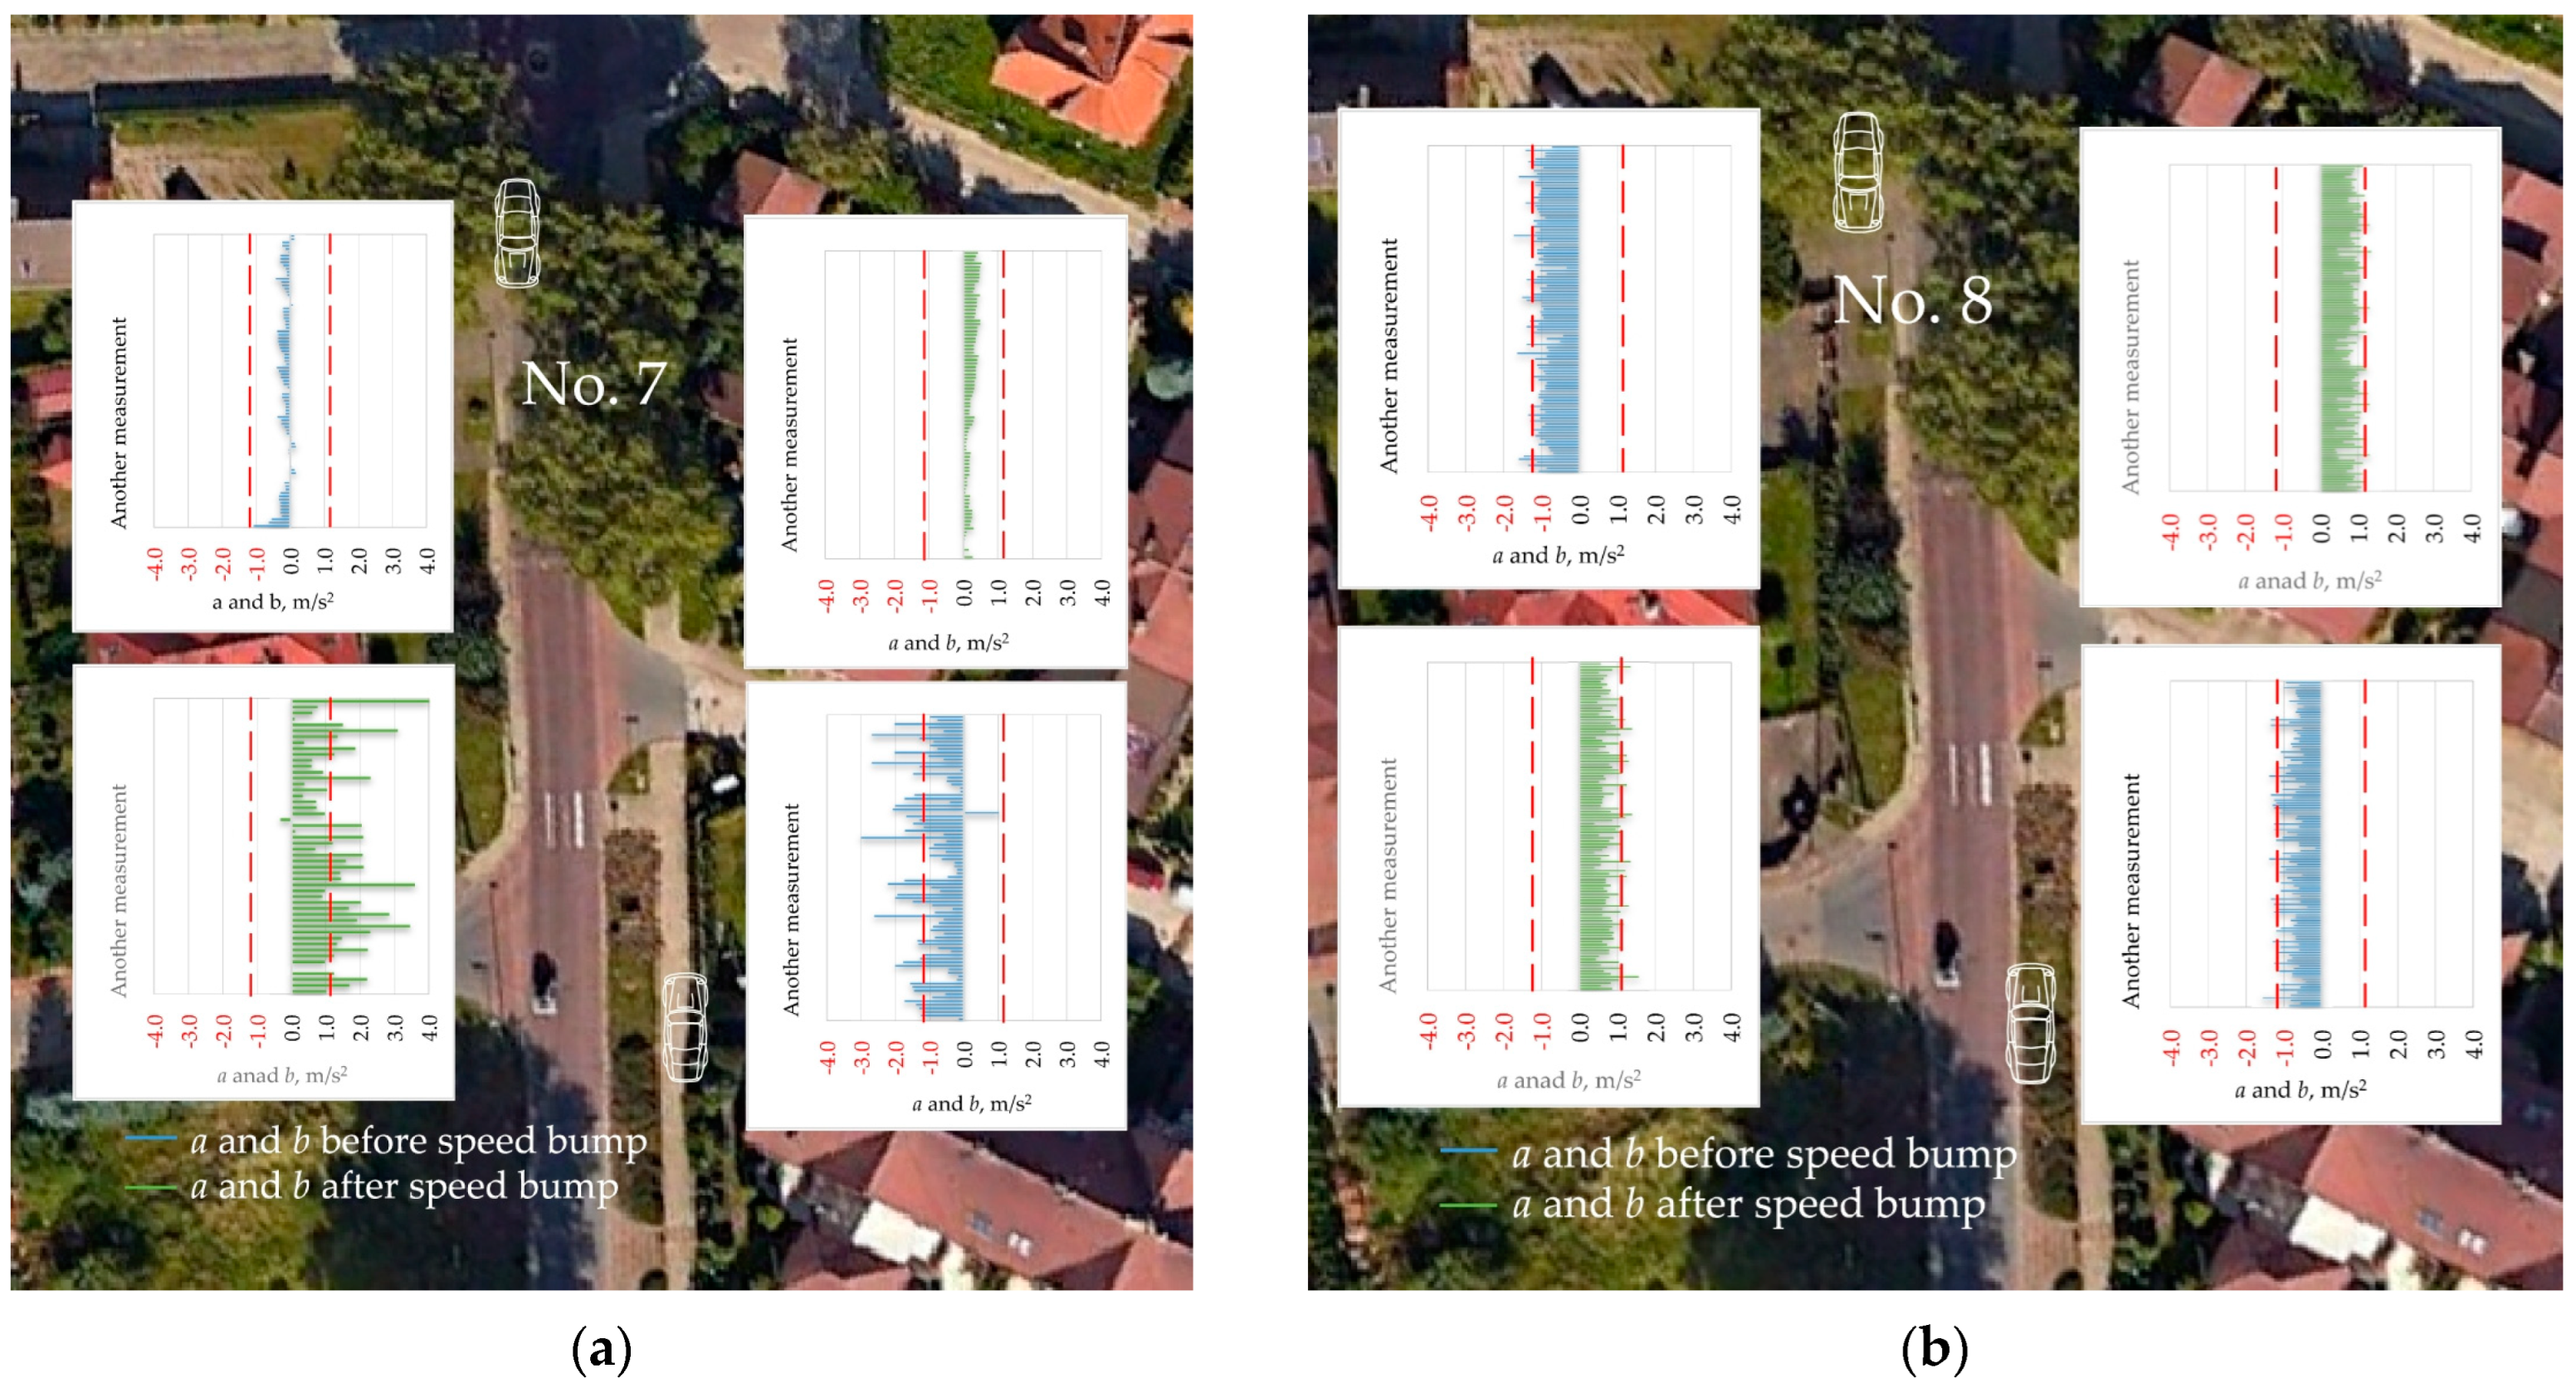
4.2. Acceleration and Deceleration Variation Ranges before and after VTCD

The second analysis related to the purpose of this article and the research problem under analysis concerned the variation in horizontal forces in vertical traffic-calming device approach and departure sections. The bar chart in Figure 12 represents the accelerations and decelerations for the respective vertical traffic-calming device scenarios in the order of recording. In line with the assumptions made in Section 2, the red dashed lines delineate the −1.2 m/s2 to +1.2 m/s2 range, i.e., twice the deceleration or acceleration value recorded in the home zone without vertical traffic-calming devices in free-flowing traffic conditions (2 bffs or 2 affs). This deceleration/acceleration range (−1.2 m/s2 to +1.2 m/s2) was adopted as the severe traffic loading threshold. Thus, decelerations and accelerations that fell beyond this range were considered to indicate severe traffic loading with a potentially detrimental effect on the analysed road pavement. The data in Figure 12a show significantly different decelerations in the two traffic directions on the same speed tables. It is most probable that there were some other factors responsible for this in addition to the speed table installation. Important in this case was the very slow driving of the local residents over a distance of up to 180 m on the way from speed table No. 1 to speed table No. 3. In the opposite direction, much higher speeds were noted at the home zone entry despite the vertical traffic-calming devices located there. Harsher breaking and greater accelerations were most probably due to them. However, this harsh braking could be related to subsidence only at speed table No. 3. This is because of two street gullies located before speed table No. 3 and the resulting dips in the pavement, due to which the vertical traffic-calming devices located there may appear higher than they actually are. Greater speed reductions are a consequence of that. Also, the data given in Figure 12c indicate more severe traffic loading of the pavement. A high longitudinal gradient of 3.5% also played a major role in this case. This steep section of the street was chosen intentionally, taking into account the objectives of this study. Nevertheless, neither high subsidence nor pavement distress points were noted before and after the raised crossings located there, despite their steep on/off-ramps. Subsidence problems in these locations were limited to max. 2 cm deep dips located in the wheel paths right before and after these raised crossings. The condition of the concrete block paving of these vertical traffic-calming devices was rated as very good after over a dozen years of use. Still, right after their construction, the local residents requested the removal of these steep raised crossings due to uncomfortable driving through them. In the case shown in Figure 12a,c, no connection was found between the high accelerations/decelerations (almost two times the adopted threshold range of −1.2 m/s2 to +1.2 m/s2) and the pavement condition there. More severe deterioration and subsidence, as compared to the other vertical traffic-calming devices, were noted only at speed table No. 3.
Figure 13 and Figure 14 show the single vertical traffic–calming device sites.
At the raised crossing and speed table shown in Figure 13, where decelerations/accelerations did not exceed the acceptable range defined by the acceptable effect of horizontal forces acting on the pavement, no extensive subsidence problems were found after five years of operation (Table 2). Attention is drawn to the vast height differences between these vertical traffic-calming devices. However, small deformations were found at the VTCD corners (Appendix D, Figure A8), possibly indicating a need for a different design of the on/off-ramp interfaces with the adjacent part of the street pavement. The examples shown in Figure 14 support this observation. In this case, the raised junction area initially included an 18 cm high speed bump. The very gentle vertical and horizontal deflections located on this street were not effective in preventing speeding there. These excessive driving speeds resulted in the progressing deterioration of the speed bump concrete block paving, most severe in the raised junction exit direction (Figure 11). After the speed bump reconstruction, the accelerations/decelerations observed there did not exceed the adopted acceptable range (−1.2 m/s2 to +1.2 m/s2). However, deformations before and after the new speed bump remained in place due to a very narrow area of speed bump renewal (2.25 m in width).

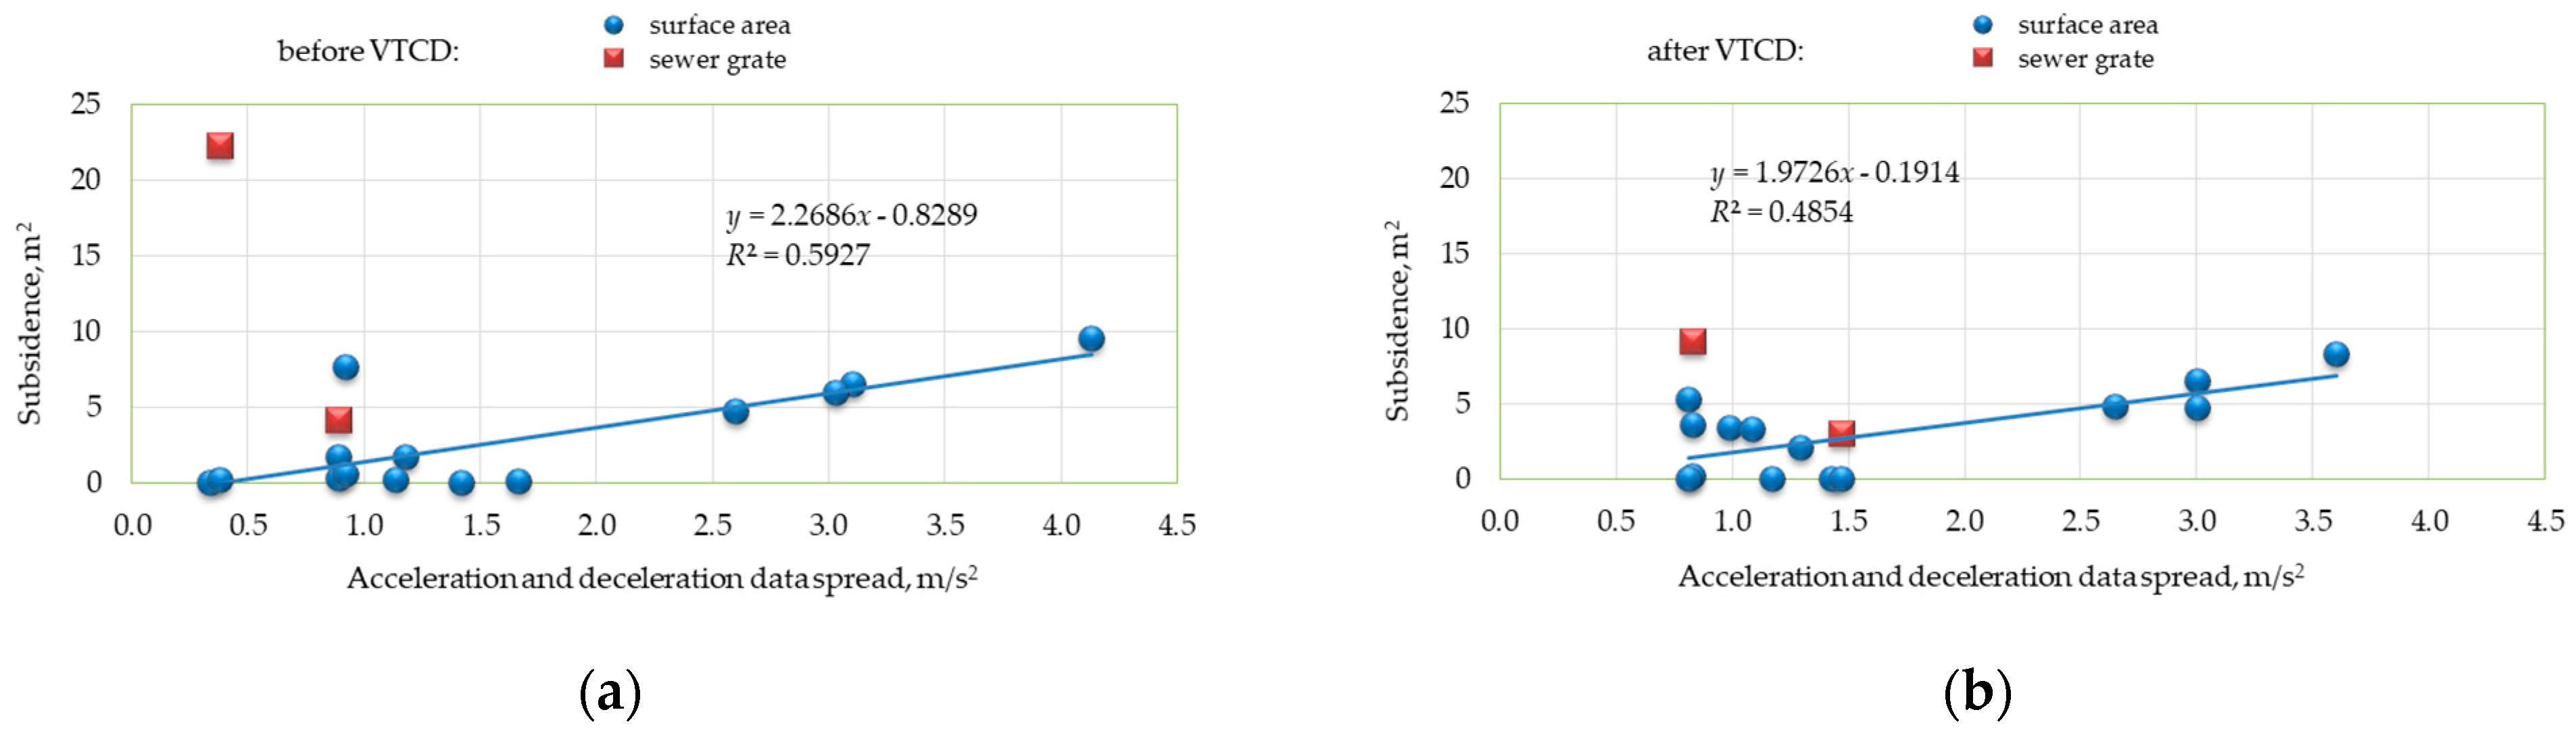
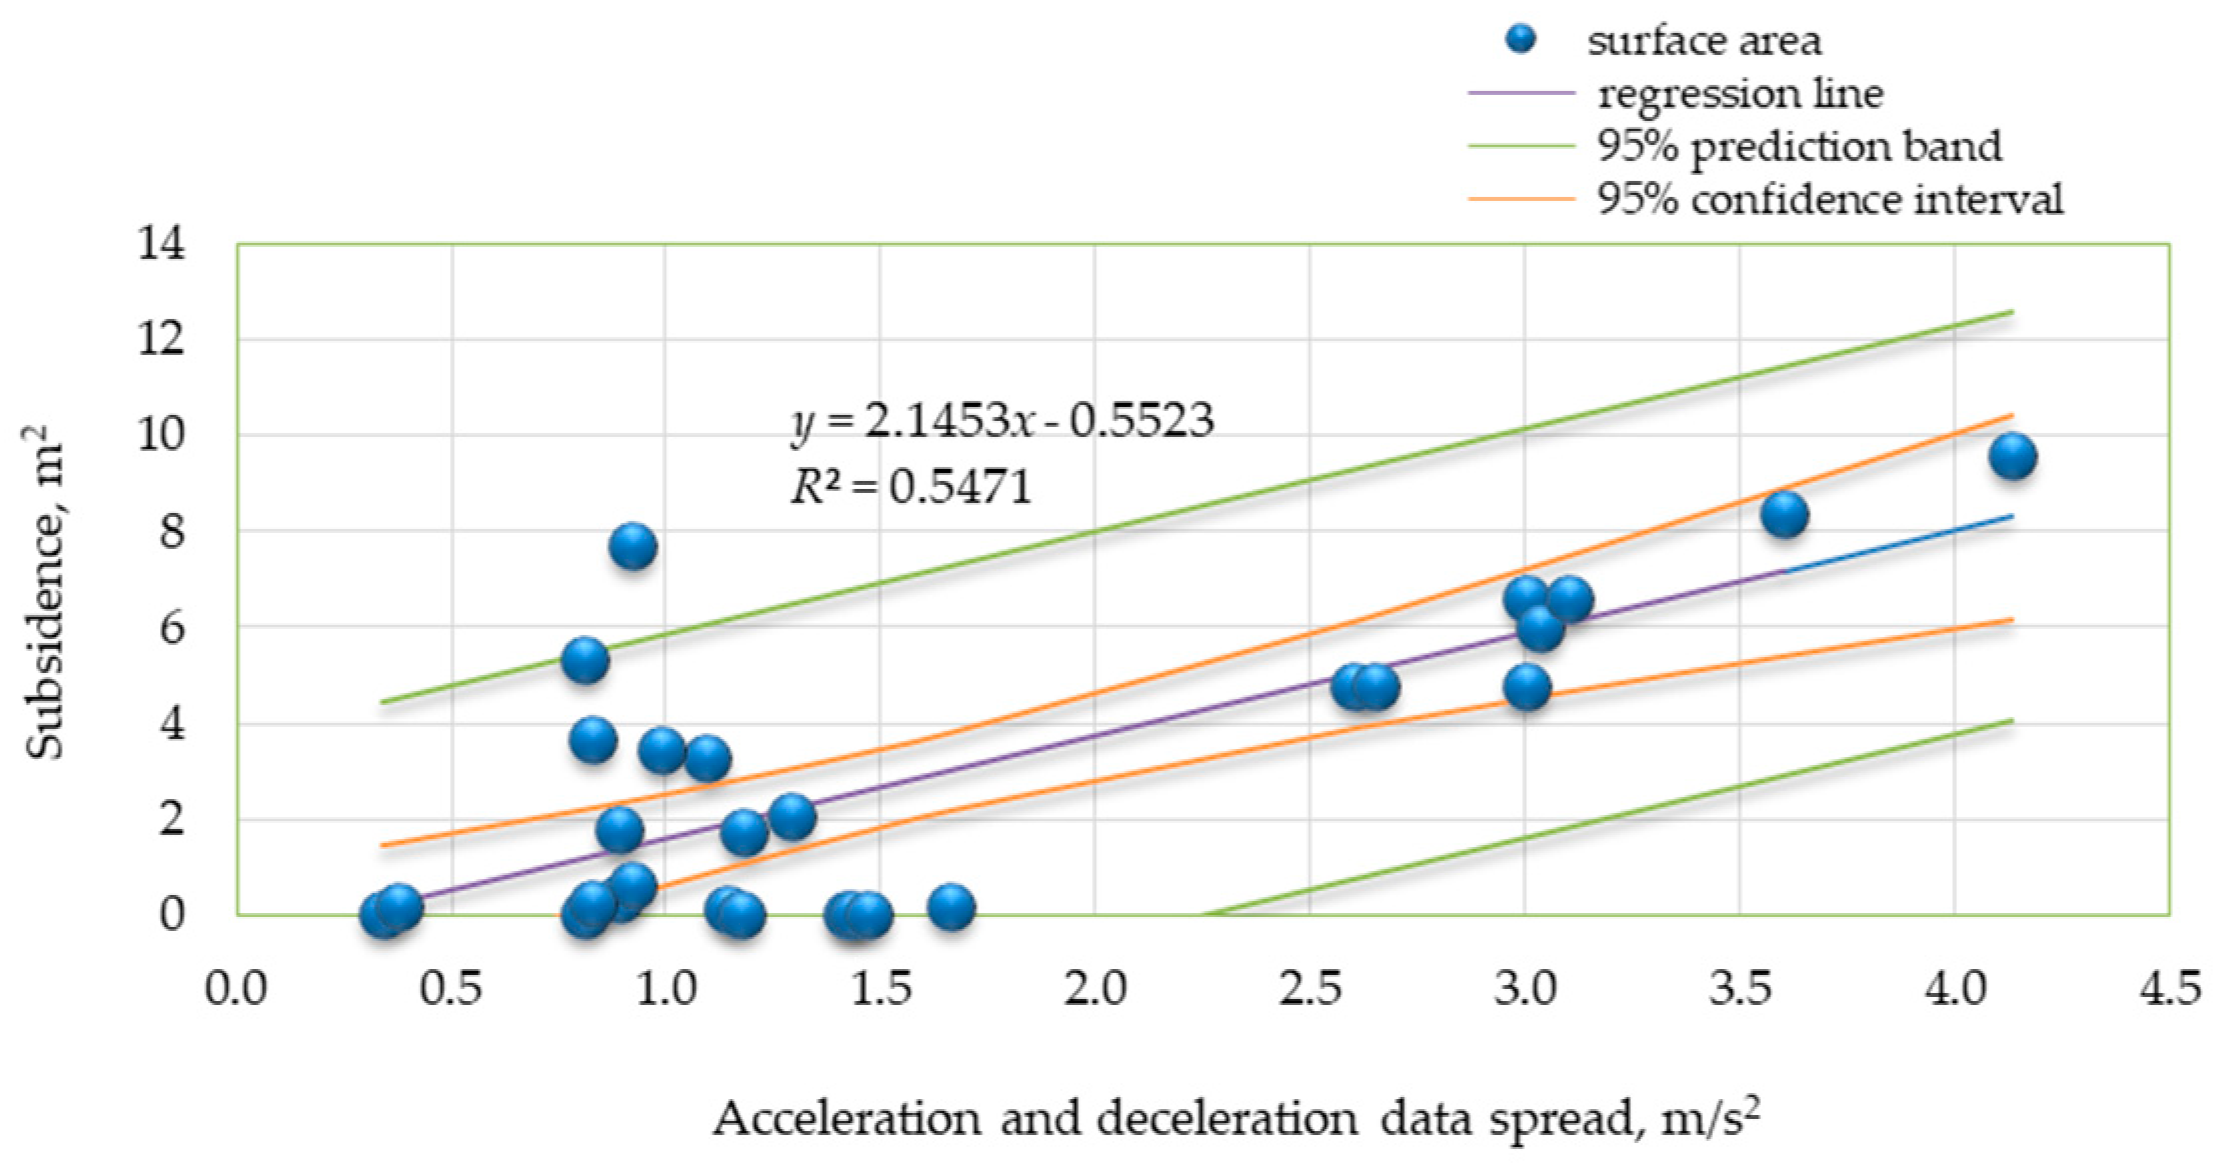
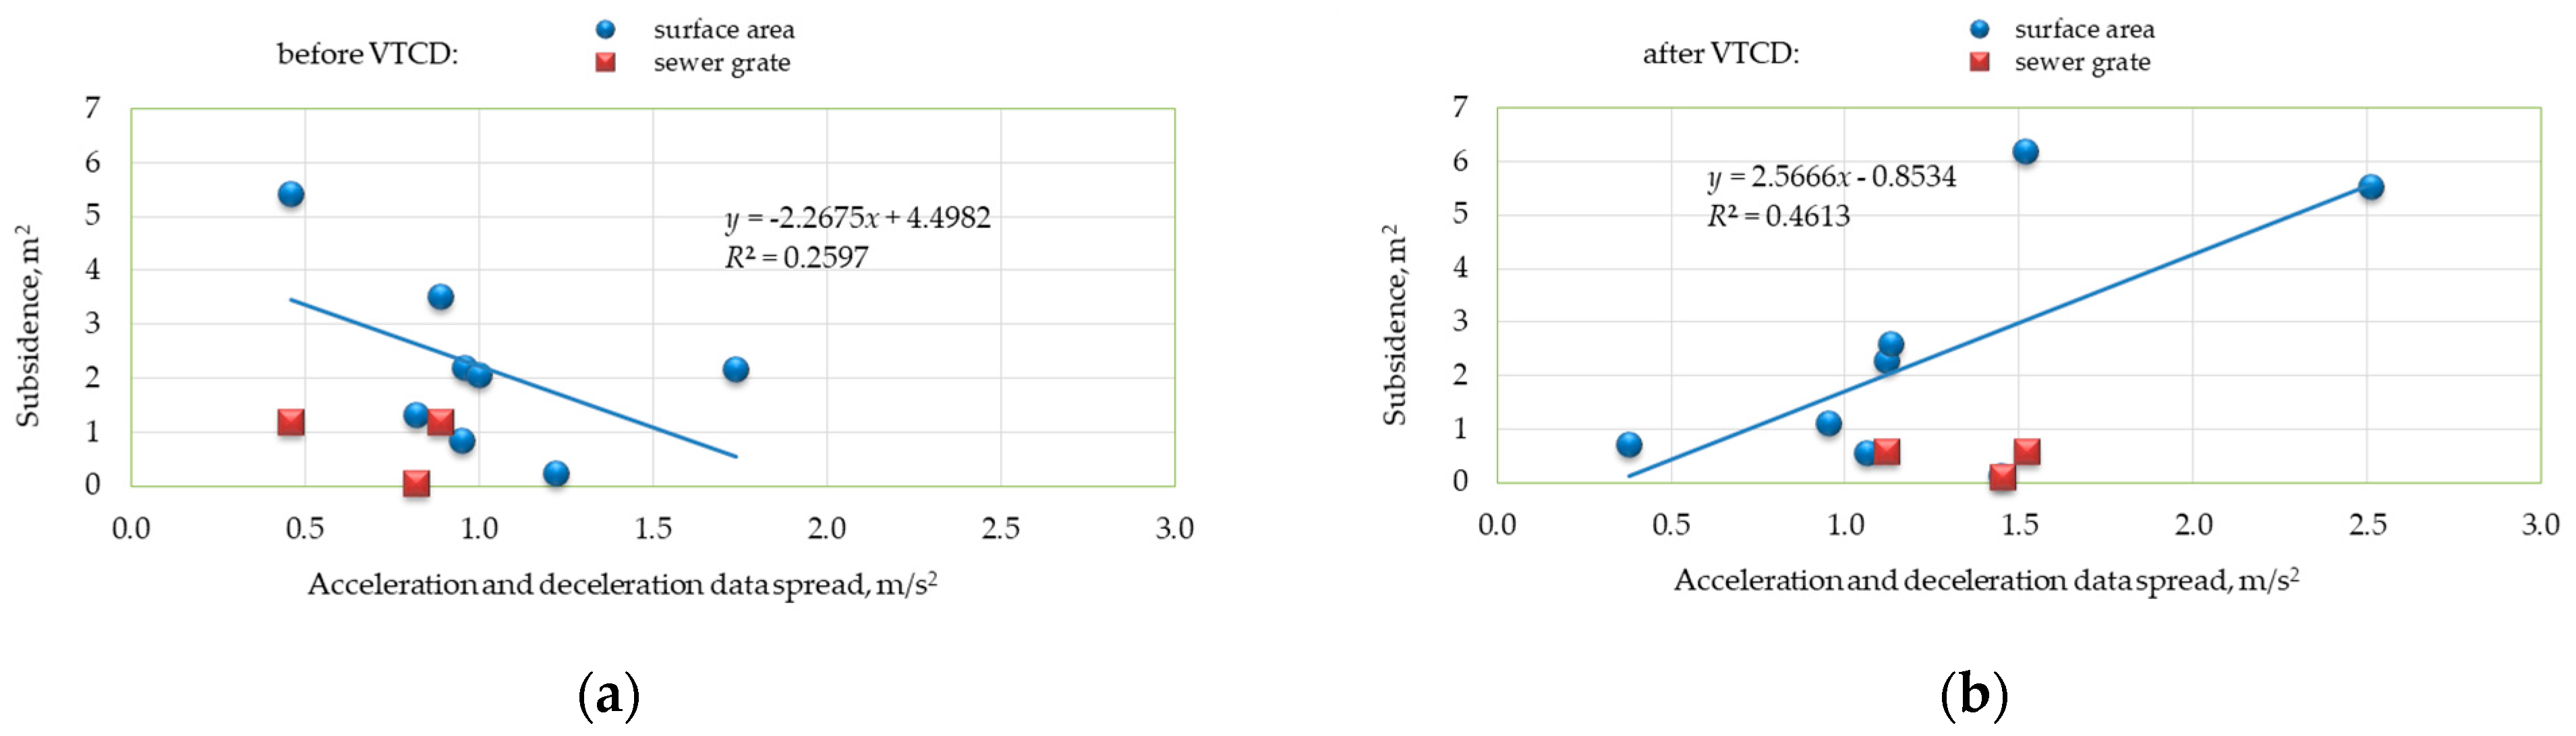
4.3. Relationship between Accelerations/Decelerations and Surface Area of the Pavement Deformations before and after VTCD

The next analysis concerned the second part of the research problem of this study. The scope was limited to subsidence, which was found to be the predominant pavement distress type in all the analysed cases. Other types of pavement distress, including cracked or missing blocks, damaged kerbs or open joints, were noted in isolated cases only (Table 1). Next, we sought a relationship between the subsidence surface area and the calculated accelerations/decelerations given in Table 1 and Table 2. The decelerations before and after the respective vertical traffic-calming devices in three and two consecutive vertical traffic-calming device scenarios were considered as the first step, as shown in Figure 15. As the dips in the pavement around sewer grates may not be directly related to braking or accelerations, these data were represented with a different symbol. Considering the complex nature of pavement loading, the spreads of a85 and b85 values are shown in all cases on the horizontal axis of the charts given in Figure 15. The data in Figure 15 indicate a statistically significant relationship between the subsidence surface area and the spread of the a85 and b85 values. Given the high R correlation coefficient values, a regression analysis is represented in Figure 16 for the combined data before and after the vertical traffic-calming device, from which sewer grate spots had been filtered out. The analyses represented in Figure 15 and Figure 16 prove the correctness of the study hypothesis, showing the statistically significant dependence of subsidence surface areas before and after vertical traffic-calming devices on decelerations and accelerations. The obtained coefficient of determination of R2 = 55% confirms that the examined variables x and y explain the identified relationship between them f(x, y) at 55% probability. The remaining 45% may be related to the pavement or soil subgrade characteristics or design or construction flaws. Therefore, the decelerations/accelerations obtained from the speed surveys are considered highly relevant to the pavement condition, taking into account highly variable and alternately occurring compression and tension stresses.
Similar analyses were carried out for the single vertical traffic-calming device data. The relationships obtained before and after the respective vertical traffic-calming device were not found to be consistent, as can be seen in Figure 17. In the case of single vertical traffic-calming device scenarios, the correlation and R-squared values were much lower, and the combination was precluded due to opposite relationships. Thus, in the case of single vertical traffic-calming devices, decelerations/accelerations have probably less bearing, while the type, design and construction have more bearing on the subsidence surface areas.
The subsidence areas around the sewer grates should also be mentioned as part of this discussion. All the sewer grates were located on the gutter, adjacent to the kerb, lying entirely within the carriageway, probably on the wheel paths. Most cars passed the installed vertical traffic-calming device by directing their right wheels onto the sloped sides, sewer grates or pathway area, thus mitigating the effect of the difference in level. The locations of the most critical grates are shown in Figure 18. They should preferably be replaced by kerb inlets. The subsidence areas around grates shown in Figure 18a,b are shown in Figure A2 in Appendix B. The proposed kerb inlets would allow for transmission of the stresses partly to the kerb foundation and partly to the much smaller area of the grates, thus avoiding strain accumulations at these locations (Figure 18c).

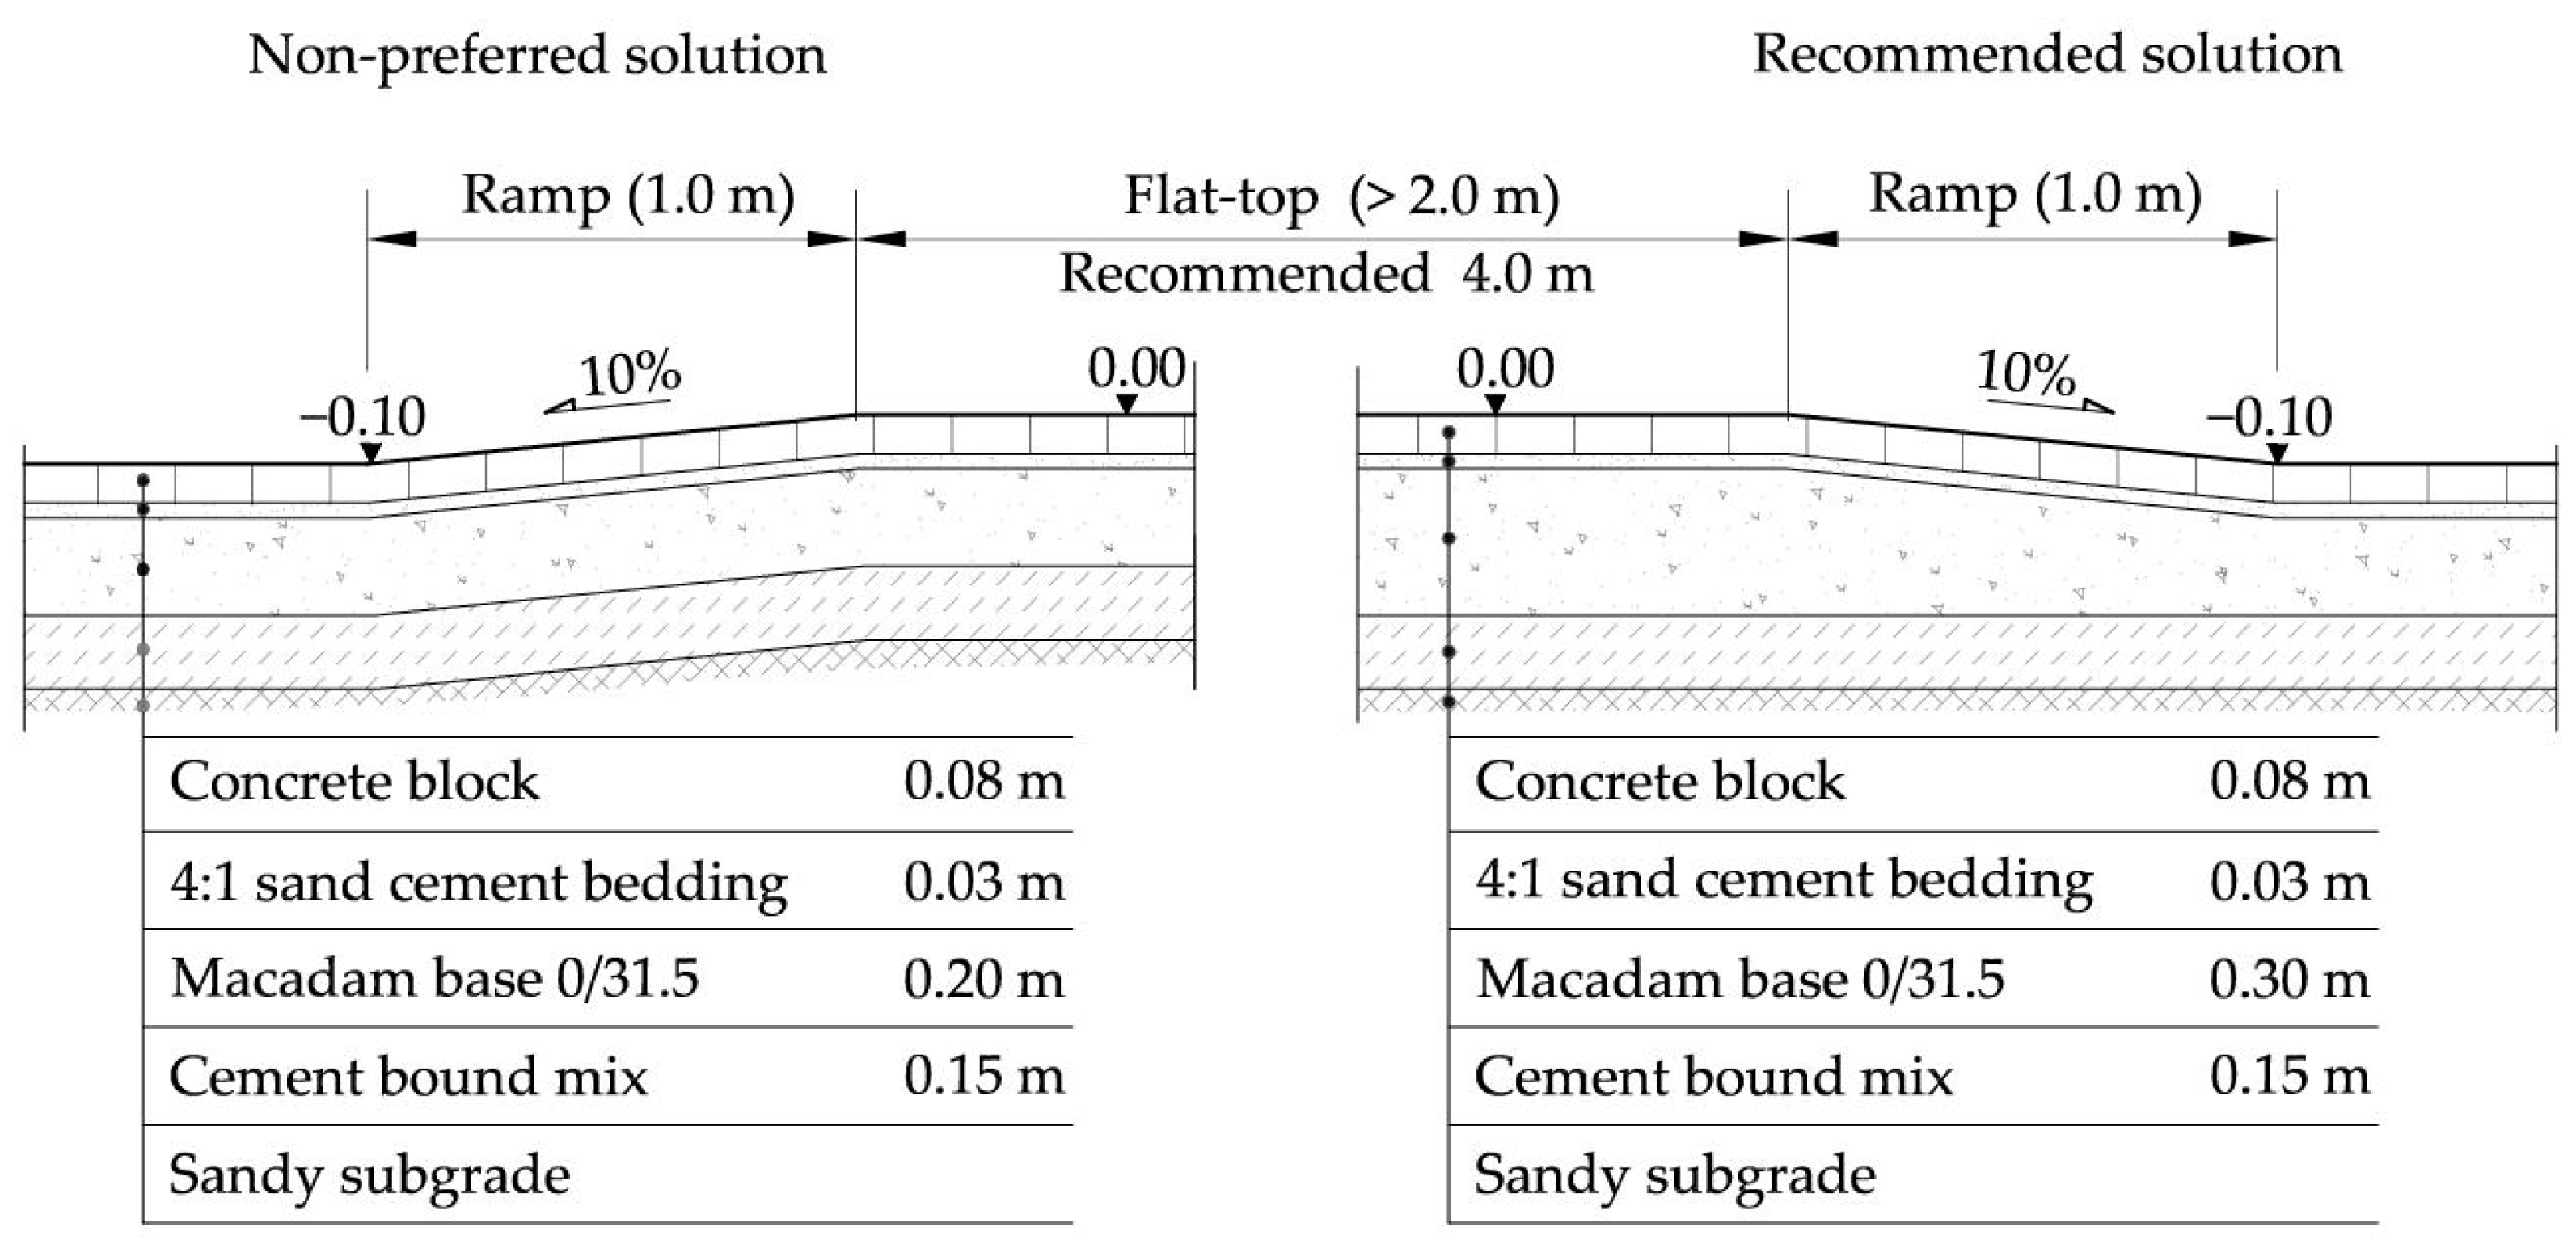
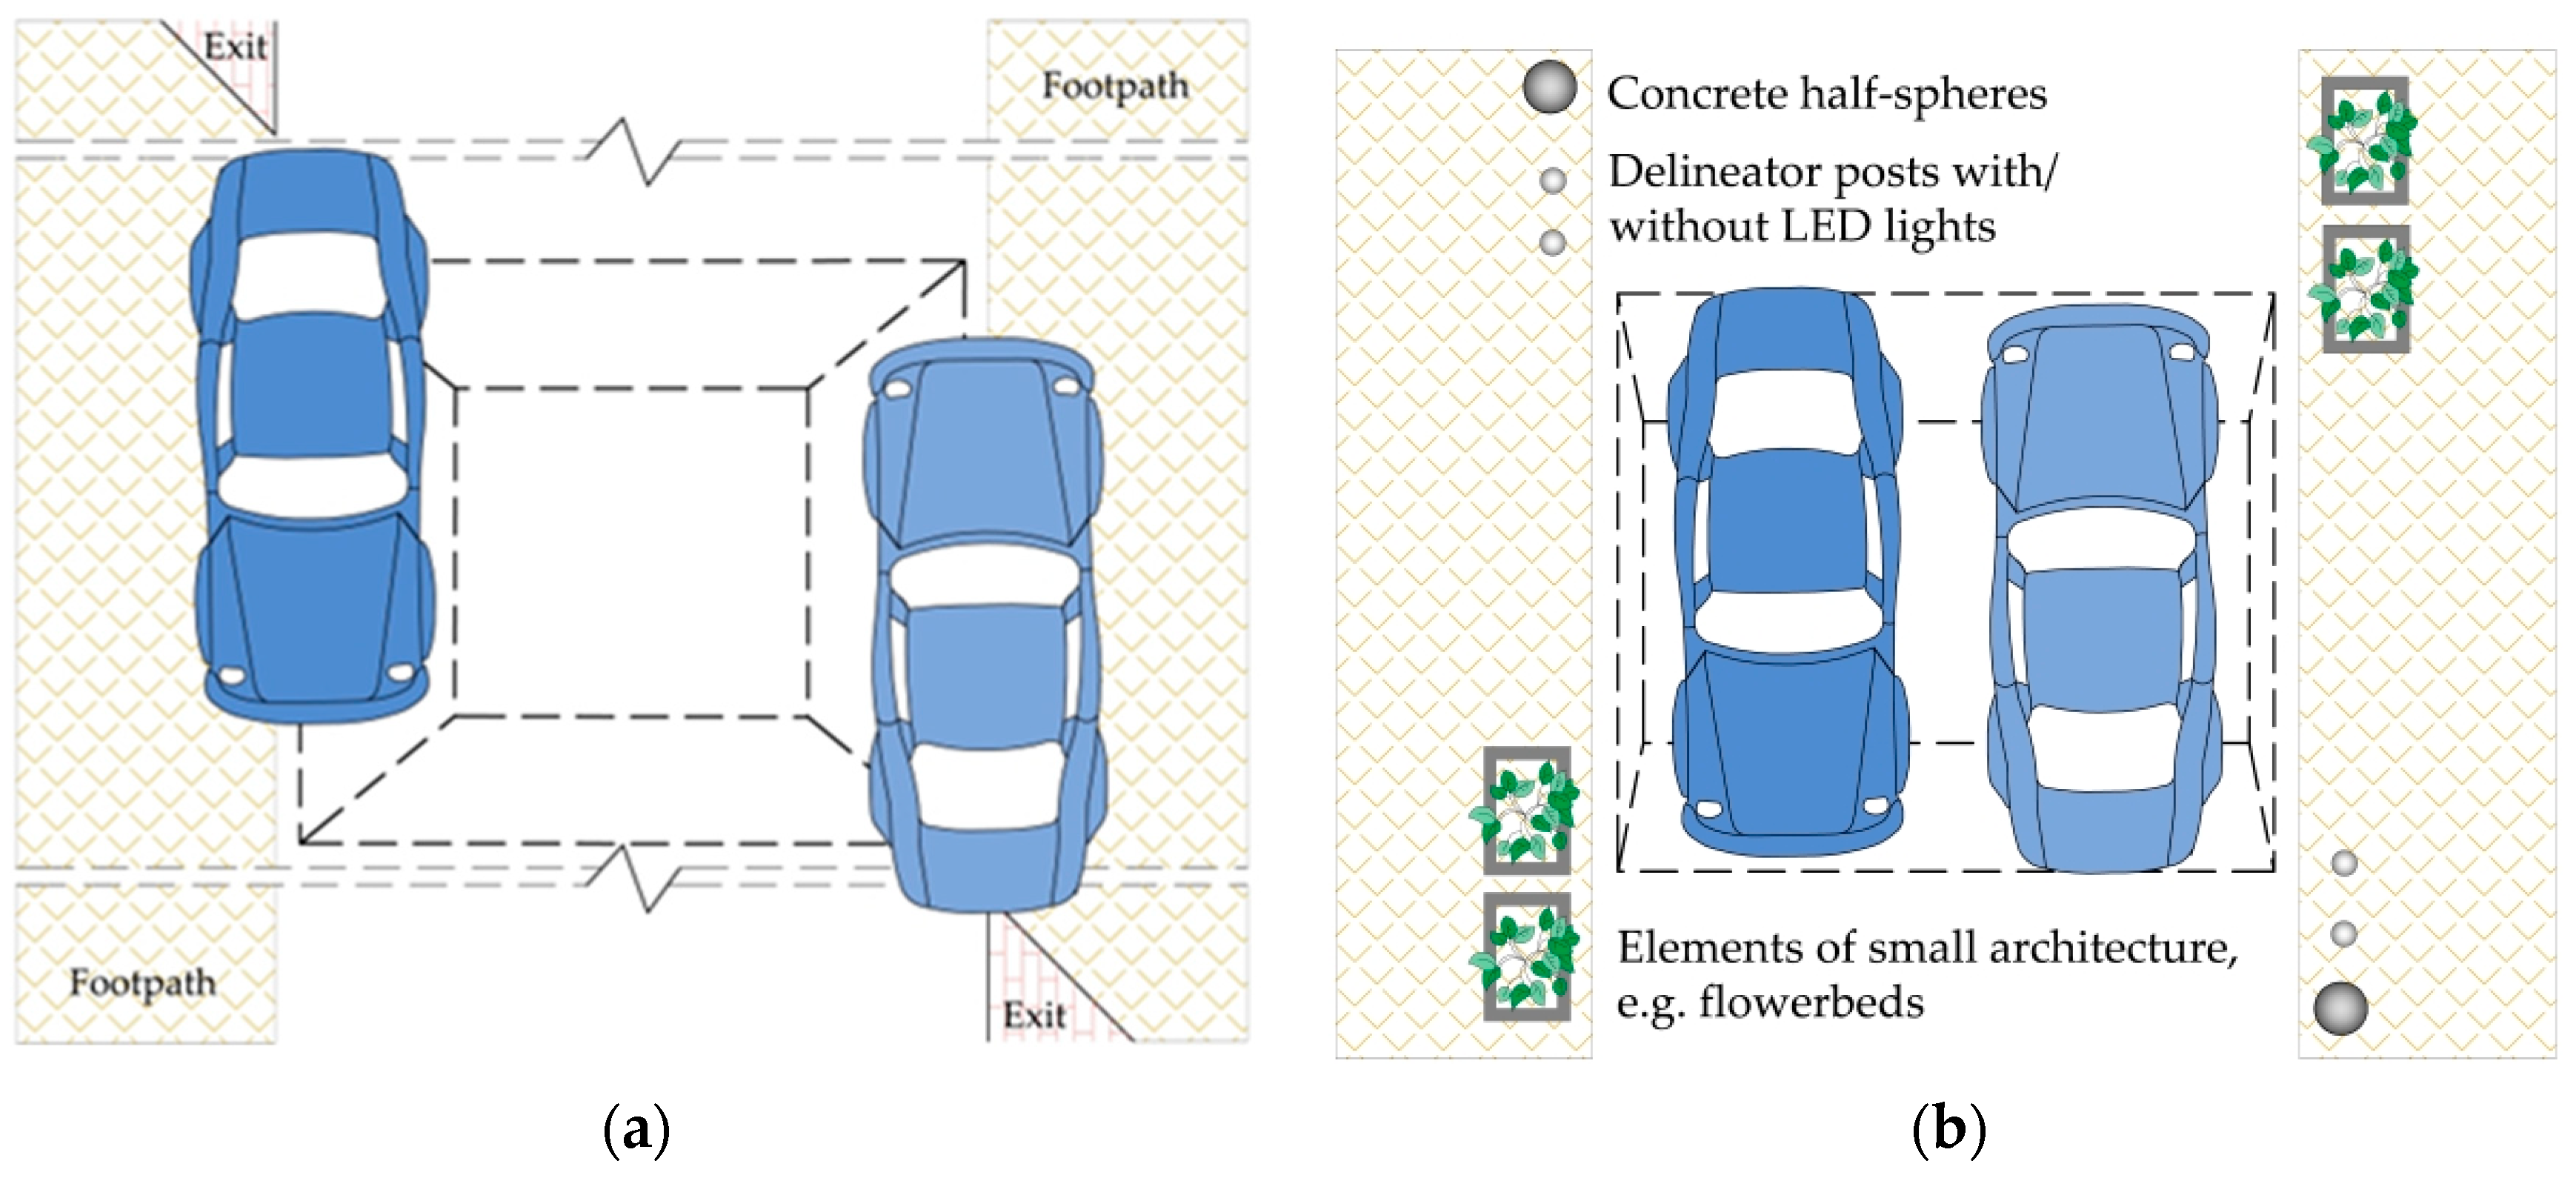
4.4. Pavement Design

Along with undeniable benefits, including slower driving and the improved safety of vulnerable road users, vertical traffic-calming devices involve some undesired effects. Increased fuel consumption and thus higher air pollution due to lower driving speeds and, more importantly, acceleration after passing the vertical traffic-calming devices are considered the most significant ones [70,71]. Janusevicius and Grubliauskas [71] reported increases on average in the levels of carbon dioxide by 1.8, nitrous oxide by 4.3 and carbon oxide by 2.2 after the installation of the speed tables studied by them. The severity of this effect can be mitigated by using paving blocks made of concrete containing nanocrystalline titanium dioxide (TiO2) [72,73]. This so-called smog-eating paving is particularly recommended in home zone areas where residential buildings are located adjacent to the street. They are not that important where the buildings are set back from the street and separated from the pathway by front gardens. It is worthwhile noting that the problem of air pollution generated by passenger cars is bound to decrease in importance over time [74] owing to the increased use of electric cars, expected to reach 70% of the total sales in the EU.
Thus, based on the assessed vertical traffic-calming device design characteristics and assessment of the adjacent pavement condition, two concrete block paving designs are proposed in this article.
The first of them is recommended for home zones (Figure 19) where only municipal or exceptionally commercial vehicles are allowed in addition to passenger cars. The surfacing materials in this case are typical 8 cm thick interlocking paving blocks. The vertical traffic-calming device formation should preferably be at the same level as the adjacent road formation, and increased thickness should be obtained by thickening the road base layer only (recommended design in Figure 19). Grading of the soil subgrade in order to reach the carriageway level without thickening the road base should be avoided (non-preferred design in Figure 19). This was the case on raised crossing No. 4 where a few vertical deformations were noted after just a few years of use (Figure 20a). For the other studied vertical traffic-calming devices, the observed deformations were limited to subsidence at sloped side joints (Figure 20b,c), most probably caused by erratic driving over them. This can be avoided by the recommended vertical traffic-calming device design shown in Figure 21, where on the side facing, the kerb is steeper to keep the cars away from the sloped side. The recommended measures to prevent vehicles from encroaching on the footway area, of which a few examples of erratic driving were noted during our surveys (Figure 22a), include delineator posts or street furniture items: concrete half-spheres or flowerbeds or even concrete sculptures, the latter being a very popular option in Scandinavian countries (Figure 22b). Where the designed street lighting is insufficient for vertical traffic-calming device location requirements, LED delineator posts may be used as supplementary lighting.
A different pavement structure should be used where heavy goods or public buses can be expected to travel along the street. The preferred paving materials for these locations are 8 or 10 cm thick interlocking paving blocks, anthracite in colour, especially on the on-ramps, to contrast with pavement markings. A layer of concrete should be placed to strengthen the pavement structure in such locations, extending onto the vertical traffic-calming device approach and departure sections. These approach and departure sections should be 1 m long for streets used by buses (Figure 23a) and 3 m long where construction projects are expected to take place in the home zone area in question (Figure 23b).

5. Conclusions

Summing up, some limitations of this research must be mentioned, as it is the first time that a need for different pavement structures has been postulated by the authors. The surveys were carried out on eleven vertical traffic-calming devices differing in terms of the design parameters, scenarios, surrounding streetscape and traffic characteristics on the analysed streets. Therefore, considering that the available design guidelines do not comprehensively cover the problems, the scope of research should be gradually expanded in future studies and analyses in this area of study.
The study results presented in this article and the conclusions derived in [2,75] indicate a need for further research, which should cover, inter alia, the vertical traffic-calming devices’ spacing intervals in the respective scenarios and their effect on the concrete block paving condition. Still, our findings may be used to good effect in both the planning and construction phases of traffic-calming projects, as well as for analytical purposes.
These findings are summarised below:
-
This article confirmed the existence of a statistically significant relationship between decelerations/accelerations and the condition of concrete block paving around vertical traffic-calming devices located in home zones arranged in various scenarios;
-
The authors believe that a few vertical traffic-calming devices spaced at smaller intervals may be more effective in reducing the speed of travel than one high vertical traffic-calming device;
-
The authors believe that in vertical traffic-calming device locations, kerb inlets are the option of choice due to considerably less deterioration occurring around them, as compared to standard sewer grates;
-
When a few consecutive vertical traffic-calming devices are designed in a home zone, smoke-eating concrete paving blocks are recommended where residential buildings are located close to the carriageway, and conventional interlocking pavers would suffice where homes are isolated from the street by front gardens;
-
Higher vertical traffic-calming devices should have smaller on/off-ramp gradients in order to limit harsh braking and acceleration, and they should preferably be spaced at smaller intervals;
-
The authors believe that before and after a vertical traffic-calming device, the pavement structure should be strengthened with a concrete road base layer, which should extend beyond the ramps to increase the resistance of the pavement to increased horizontal and vertical forces.
The recommendations of the extension in road base length, less steep ramps and smaller vertical traffic-calming device spacing will reduce the horizontal forces transmitted on the pavement, thus mitigating deterioration of the pavement and resulting in better conditions of the surface after exposure to traffic for over a dozen years.

Author Contributions

Conceptualisation, S.M., A.S. and M.K.; methodology, S.M.; software, S.M. and M.K.; validation, S.M., A.S. and M.K.; formal analysis, S.M.; data curation, S.M. and M.K.; writing—original draft preparation, S.M., A.S. and M.K.; writing—review and editing, S.M.; visualisation, S.M., A.S. and M.K.; supervision, S.M.; project administration, S.M. All authors have read and agreed to the published version of the manuscript.

Funding

This research received no external funding.

Institutional Review Board Statement

Not applicable.

Informed Consent Statement

Not applicable.

Data Availability Statement

The data presented in this study are available in the article.

Conflicts of Interest

The authors declare that they have no known competing financial interests or personal relationships that could have appeared to influence the work reported in this paper.

Appendix A

Table A1. Geometrical characterisation of vertical devices. Source: own work.
No.Direction
of Traffic
Geometric Parameters of Vertical Traffic-Calming Devices
ibeforei1h1llth2i2iafter
Home zone No. 1—Łukęcin (flat-topped speed tables)
1from west0.3%16%0.061.01.70.06−19%0.8%
from east−0.8%19%0.061.01.70.06−16%−0.3%
2from west0.4%14%0.060.81.750.06−13%0.4%
from east−0.4%13%0.060.81.750.06−14%−0.4%
3from west0.8%8%0.061.01.950.05−20%−1.3%
from east1.3%20%0.051.01.950.06−8%−0.8%
Home zone No. 2—Łukęcin (raised crossing)
4from west0.6%2%0.044.08.00.07−4%−0.7%
from east0.7%4%0.074.08.00.04−2%−0.6%
Home zone No. 3—Mierzyn Piotra street (flat-topped speed tables)
5from west−1.4%10%0.104.52.00.12−12%−1.1%
from east1.1%12%0.124.52.00.10−10%1.4%
6from west−0.7%11%0.114.52.00.09−9%0.7%
from east0.7%9%0.094.52.00.11−11%−0.7%
Home zone No. 4—Mierzyn Montessori (speed humps on the raised junction—before No. 7 and after renewal No. 8)
7from west−0.9%14.8%0.180.112.20.10−15.6% & −9.5%0.5%
from east−0.5%9.5% & 15.6%0.100.112.20.18−14.8%0.6%
8from west−0.9%30%0.030.202.250.11−5.2%0.5%
from east−0.5%5.2%0.110.202.250.03−30%0.9%
Home zone No. 5—Mierzyn Topolowa street (speed table)
9from west7%7%0.121.04.20.10−6%6%
from east−6%6%0.121.04.20.11−6%−7%
Home zone No. 6—Przecław (raised crossing)
10from west−3.5%25%0.144.34.90.14−25%−3.5%
from east3.5%25%0.144.34.90.14−25%3.5%
11from west−3.5%25%0.144.34.90.14−25%−3.5%
from east3.5%25%0.144.34.90.14−25%3.5%
Designations: i1—on-ramp gradient, %; h1—on-ramp height, m; l—flat-top length, m; lt—total length, m; h2—off-ramp height, m; i2—off-ramp gradient, %.
Figure A1. Image of designations from Table 1. Source: own work.
Sustainability 16 02982 g0a1

Appendix B

Figure A2. Sample models DM3D: (a) speed table No. 3; (b) speed hump before raised junction No. 8. Source: own work.
Sustainability 16 02982 g0a2

Appendix C

The whiskers represent the minimum and maximum values; the lower and upper edges of the boxes determine the first and third quartiles; the bold line designates the median value.
Figure A3. Box plot of data measured—home zone No. 1 Łukęcin (three flat-topped speed table scenario): (a) direction of traffic from west to east; (b) direction of traffic from east to west. Source: own work.
Sustainability 16 02982 g0a3
Figure A4. Box plot of data measured—home zone No. 3 Mierzyn Piotra street (two flat-topped speed table scenario) (at distance m): (a) direction of traffic from west to east; (b) direction of traffic from east to west. Source: own work.
Sustainability 16 02982 g0a4
Figure A5. Box plot of data measured—home zone No. 6 Przecław (two raised crossing scenario): (a) direction of traffic on the decline (−3.5%); (b) direction of traffic on a hill (+3.5%). Source: own work.
Sustainability 16 02982 g0a5
Figure A6. Box plot of data measured: (a) home zone No. 2 Łukęcin (raised crossing No. 4); (b) home zone No. 5 Mierzyn Topolowa street (speed table No. 9). Source: own work.
Sustainability 16 02982 g0a6aSustainability 16 02982 g0a6b
Figure A7. Box plot of data measured—home zone No. 4 Mierzyn Topolowa street (one speed hump scenario): (a) speed hump No. 7 before renewal; (b) speed hump No. 8 after renewal. Source: own work.
Sustainability 16 02982 g0a7

Appendix D

Figure A8. Sample models DM3D: (a) speed table No. 5; (b) speed table No. 9. Source: own work.
Sustainability 16 02982 g0a8

References

  1. Schlabbach, K. Traffic Calming in Europe; Institute of Transportation Engineers (ITE): Washington, DC, USA, 1997. [Google Scholar]
  2. Cottrell, W.D.; Kim, N.; Martin, P.T.; Perrin, H.J. Effectiveness of traffic management in Salt Lake City, Utah. J. Saf. Res. 2006, 37, 27–41. [Google Scholar] [CrossRef] [PubMed]
  3. Roess, R.P.; Prassas, E.S.; McShane, W.R. Traffic Engineering, 3rd ed.; Pearson/Prentice Hall: East Lansing, MI, USA, 2004. [Google Scholar]
  4. Traffic Management Guidelines; Government Publications Sale Office, Sun Alliance House: Dublin, Ireland, 2014.
  5. Urban Traffic Areas—Part 7—Speed Reducers; Vejdirektoratet–Vejregeludvalget: Copenhagen, Denmark, 1991.
  6. Roads Development Guide; East Ayrshire, Strathclyde Regional Council: London, UK, 2010.
  7. Zainuddin, N.I.; Adnan, M.A.; Md Diah, J. Optimization of speed hump geometric design: Case study on residential streets in Malaysia. J. Transp. Eng. 2014, 140, 05013002. [Google Scholar] [CrossRef]
  8. Institute of Transportation Engineers. Traffic Calming: State of the Practice; Report ITE/FHWA; Institute of Transportation Engineers: Washington, DC, USA, 1999; Available online: https://safety.fhwa.dot.gov/saferjourney1/library/pdf/toolsintro.pdf (accessed on 5 January 2024).
  9. DOWL Engineers. Traffic Calming Protocol Manual; Municipality of Anchorage Traffic Department: Anchorage, AK, USA, 2001; Available online: https://www.muni.org/Departments/traffic/Documents/Policy_Manual_03_10_Section_6.pdf (accessed on 5 January 2024).
  10. D’Apuzzo, M.; Evangelisti, A.; Santilli, D.; Nardoianni, S.; Cappelli, G.; Nicolosi, V. Towards a new design methodology for vertical traffic calming devices. Sustainability 2023, 15, 13381. [Google Scholar] [CrossRef]
  11. Moreno, A.T.; García, A.; Romero, M.A. Speed table evaluation and speed modeling for low-volume crosstown roads. Transp. Res. Rec. J. Transp. Res. Board 2011, 2203, 85–93. [Google Scholar] [CrossRef]
  12. Antić, B.; Dalibor Pešić, D.; Vujanić, M.; Lipovac, K. The influence of speed bumps heights to the decrease of the vehicle speed—Belgrade experience. Saf. Sci. 2013, 57, 303–312. [Google Scholar] [CrossRef]
  13. Moreno, A.T.; García, A. Use of speed profile as surrogate measure: Effect of traffic calming devices on crosstown road safety performance. Accid. Anal. Prev. 2013, 61, 23–32. [Google Scholar] [CrossRef] [PubMed]
  14. DCCE&PD. Traffic Calming Guidelines; Devon County Council Engineering & Planning Department: Devon, UK, 1992. [Google Scholar]
  15. FGSV. Road and Transportation Research Association Directives for the Design of Urban Roads; RASt 06; Road and Transportation Research Association, Working Group High-Way Design, FGSV: Köln, Germany, 2006. [Google Scholar]
  16. Katalog Typowych Konstrukcji Nawierzchni Jezdni Przeznaczonych do Ruchu Bardzo Lekkiego Oraz Innych Części Dróg WR-D-63; Ministerstwo Infrastruktury: Warszawa, Poland, 2022. (In Polish)
  17. DDOT. Guidelines on Vertical Traffic Calming Implementation; District Departament of Transportation DDOT: Washington, DC, USA, 2022; Available online: https://ddot.dc.gov/sites/default/files/dc/sites/ddot/DDOT%20Vertical%20Traffic%20Calming%20Guidelines%5B93%5D.pdf (accessed on 18 May 2020).
  18. Jazcilevich, A.; Vázquez, M.J.M.; Ramírez, P.L.; Pérez, I.R. Economic-environmental analysis of traffic-calming devices. Transp. Res. Part D Transp. Environ. 2015, 36, 86–95. [Google Scholar] [CrossRef]
  19. Lee, G.; Joo, S.; Oh, C.; Choi, K. An evaluation framework for traffic calming measures in residential areas. Transp. Res. Part D Transp. Environ. 2013, 25, 68–76. [Google Scholar] [CrossRef]
  20. Yeo, J.; Lee, J.; Cho, J.; Kim, D.-K.; Jang, K. Effects of speed humps on vehicle speed and pedestrian crashes in South Korea. J. Saf. Res. 2020, 75, 78–86. [Google Scholar] [CrossRef]
  21. Speed Tables in Uses. Available online: https://quicksetts.com/jpproducts/speed-Tabs/ (accessed on 5 July 2023).
  22. Pérez-Acebo, H.; Ziółkowski, R.; Linares-Unamunzaga, A.; Gonzalo-Orden, H. A series of vertical deflections, a promising traffic calming measure: Analysis and recommendations for spacing. Appl. Sci. 2020, 10, 3368. [Google Scholar] [CrossRef]
  23. Loprencipe, G.; Moretti, L.; Pantuso, A.; Banfi, E. Raised pedestrian crossings: Analysis of their characteristics on a road network and geometric sizing proposal. Appl. Sci. 2019, 9, 2844. [Google Scholar] [CrossRef]
  24. Sołowczuk, A.; Kacprzak, D. Identification of determinants of the speed-reducing effect of pedestrian refuges in villages located on a chosen regional road. Symmetry 2019, 11, 597. [Google Scholar] [CrossRef]
  25. Balant, M.; Lep, M. Comprehensive traffic calming as a key element of sustainable urban mobility plans-impacts of a neighbourhood redesign in Ljutomer. Sustainability 2020, 12, 8143. [Google Scholar] [CrossRef]
  26. Wirksamkeit Geschwindigkeitsdämpfender Maßnahmen Außerorts; Hessisches Landesamt für Straßen- und Verkehrswesen: Hessen, Germany, 1997; Available online: https://docplayer.org/57666796-Wirksamkeit-geschwindigkeitsdaempfender-massnahmen.html (accessed on 28 February 2024).
  27. Rokade, S.; Kumar, R.; Rokade, K.; Dubey, S.; Vijayawargiya, V. Assessment of effectiveness of vertical deflection type traffic calming measures and development of speed prediction models in urban perspective. Int. J. Civ. Eng. Technol. (IJCIET) 2017, 8, 1135–1146. [Google Scholar]
  28. Mohammadipour, A.; Archilla, A.R.; Papacostas, C.S.; Alavi, S.H. Pedestrian (RPC) influence on speed reduction. In Proceedings of the Transportation Research Board (TRB) 91st Annual Meeting, Washington, DC, USA, 22–26 January 2012; Available online: https://www.researchgate.net/publication/273687736_Pedestrian_RPC_Influence_on_Speed_Reduction (accessed on 20 October 2023).
  29. Pau, M. Speed bumps may induce improper drivers’ behavior: Case study in Italy. J. Transp. Eng. 2002, 128, 472–478. [Google Scholar] [CrossRef]
  30. Ho, G.P.E.; Beck, K.; Hildreth, C. Speed humps on steep streets. In Livable Streets Subdivision 24 June 2019 ITE Western District Meeting; US San Francisco Municipal Transportation Agency: San Francisco, CA, USA, 2019; Available online: https://www.westernite.org/annualmeetings/19_Monterey/Presentations/4A/4A-Ho.pdf (accessed on 12 September 2023).
  31. Kanjanavapastit, A.; Thitinaruemit, A. Estimation of a speed hump profile using quarter car model. Procedia-Soc. Behav. Sci. 2013, 88, 265–273. [Google Scholar] [CrossRef]
  32. Zakaria, M.H.; Al-Ayaat, A.; Shwaly, S. Impact of road humps on the pavement surface condition. Civ. Eng. J. 2019, 5, 1314–1326. [Google Scholar] [CrossRef]
  33. Abdulgazi, G.; Bilgin, E.; Lav, A.H.; Artan, R. An investigation into the effect of parabolic speed hump profiles on ride comfort and driving safety under variable vehicle speeds: A campus experience. Sustain. Cities Soc. 2019, 45, 413–421. [Google Scholar] [CrossRef]
  34. Thitinarumit, A.; Kanjajavapastit, A. A road hump detection using vehicle velocity. In Proceedings of the 2nd ECTI Conference on Application Research and Development ECTI-CARD, Pattaya, Thailand, 10 May 2010; Proceedings Conference. pp. 283–288. [Google Scholar]
  35. Loprencipe, G.; Bruno, S.; Cantisani, G.; D’Andrea, A.; Di Mascio, P.; Moretti, L. Methods for measuring and assessing irregularities of stone pavements—Part I. Sustainability 2023, 15, 1528. [Google Scholar] [CrossRef]
  36. Myszkowski, S. Układ ABS, częśc 2, Kompendium praktycznej wiedzy. Wiadomości IC 2013, 22, 1–20. (In Polish) [Google Scholar]
  37. Wolter, M. Damage to Concrete Block Pavement Structures and Defective Concrete Paving Blocks—Solution Approaches from the Practice of the Expert. 2007. Available online: https://www.researchgate.net/publication/298582904_Damage_to_concrete_block_pavement_structures_and_defective_concrete_paving_blocks_-Solution_approaches_from_the_practice_of_the_expert (accessed on 5 December 2023).
  38. Füssl, J.; Kluger-Eigl, W.; Blab, R. Experimental identification and mechanical interpretation of the interaction behaviour between concrete paving blocks. Int. J. Pavement Eng. 2015, 17, 478–488. [Google Scholar] [CrossRef]
  39. Siriborvornratanakul, T. An automatic road distress visual inspection system using an onboard in-car camera. Adv. Multimed. 2018, 2018, 2561953. [Google Scholar] [CrossRef]
  40. Medina, R.; Gómez-García-Bermejo, J.; Zalama, E. Automated visual inspection of road surface cracks. In Proceedings of the 27th International Symposium on Automation and Robotics in Construction (ISARC 2010), Bratislava, Slovakia, 25–27 June 2010; pp. 155–164. [Google Scholar] [CrossRef]
  41. Medina, R.; Llamas, J.; Zalama, E.; Gómez-García-Bermejo, J. Enhanced automatic detection of road surface cracks by combining 2d/3d image processing techniques. In Proceedings of the 2014 IEEE International Conference on Image Processing (ICIP), Paris, France, 27–30 October 2014; pp. 778–782. [Google Scholar] [CrossRef]
  42. Lueangvilai, E. Development of Structure and Pavement Inspection Using Mobile Laser Scanning Point Clouds: A Case Study of Thailand Expressway. Ph.D. Thesis, Sirindhorn International Institute of Technology, Thammasat University, Pathum Thani, Thailand, 2022. [Google Scholar]
  43. Zapata, C.E.; Andrei, D.; Witczak, M.W.; Houston, W.N. Incorporation of Environmental Effects in Pavement Design. Road Mater. Pavement Des. 2007, 8, 667–693. [Google Scholar] [CrossRef]
  44. Cantisani, G.; Bruno, S.; D’Andrea, A.; Loprencipe, G.; Di Mascio, P.; Moretti, L. Methods for measuring and assessing irregularities of stone pavements—Part II. Sustainability 2023, 15, 3715. [Google Scholar] [CrossRef]
  45. Loprencipe, G.; Di Mascio, P.; Moretti, L.; Zoccali, P. Analytical and Numerical Approaches for Design of Stone Pavers in Urban Shared Areas. IOP Conf. Ser. Mater. Sci. Eng. 2019, 471, 062030. [Google Scholar] [CrossRef]
  46. Moretti, L.; Di Mascio, P.; Loprencipe, G.; Zoccali, P. Theoretical analysis of stone pavers in pedestrian areas. Transp. Res. Procedia 2020, 45, 169–176. [Google Scholar] [CrossRef]
  47. Concrete Block Paving: Technical Note for Steep Slopes; Concrete Manufactures Association: Johannesburg, Soth Africa, 2022; Available online: https://celpaving.co.za/wp-content/uploads/2019/03/steep_slopes1.pdf (accessed on 28 July 2023).
  48. Abdel-Wahed, T.A.; Hashim, I.H. Effect of speed hump characteristics on pavement condition. J. Traffic Transp. Eng. (Engl. Ed.) 2017, 4, 103–110. [Google Scholar] [CrossRef]
  49. Roads Liaison Group. Asset Management Guidance for Footways and Cycle Routes: Pavement Design and Maintenance; Roads Liaison Group: London, UK, 2018; Available online: https://ukrlg.ciht.org.uk/media/11786/ctf-task1v7.pdf (accessed on 5 January 2024).
  50. Staniek, M. Metody oceny stanu nawierzchni sieci drogowej. Zesz. Nauk. Politech. Śląskiej 2011, 72, 83–90. [Google Scholar]
  51. Highways Department. Guidance Notes Catalogue of Road Defects; (CORD) Research & Development Division: Hong Kong, China, 2013; Available online: https://www.hyd.gov.hk/en/technical_references/technical_document/guidance_notes/pdf/gn015b.pdf (accessed on 5 January 2024).
  52. System Oceny Stanu Nawierzchni SOSN; Wytyczne Stosowania: Warszawa, Poland, 1989. (In Polish)
  53. System Oceny Stanu Nawierzchni SOSN; Wytyczne Stosowania: Warszawa, Poland, 2002. (In Polish)
  54. Czarnecki, K. Janowski, A. System oceny wizualnej nawierzchni SOWA-1, część 1. Drogownictwo 1999, 4, 108–113. (In Polish) [Google Scholar]
  55. Czarnecki, K.; Janowski, A. System oceny wizualnej nawierzchni SOWA-1, część 2. Drogownictwo 1999, 5, 151–154. (In Polish) [Google Scholar]
  56. Szpinek, S. Katalog Wybranych Uszkodzeń Nawierzchni Bitumicznych dla Potrzeb “SOSN”, Zeszyt 44; IBDiM: Warszawa, Poland, 1994. (In Polish) [Google Scholar]
  57. Szpinek, S. Metoda wizualnej oceny stanu uszkodzeń nawierzchni wg SOSN. Drogownictwo 1999, 2, 57–61. (In Polish) [Google Scholar]
  58. Silva, W.; Picado-Santos, L.; Barroso, S.; Cabral, A.E.; Stefanutti, R. Assessment of Interlocking Concrete Block Pavement with By-Products and Comparison with an Asphalt Pavement: A Review. Appl. Sci. 2023, 13, 5846. [Google Scholar] [CrossRef]
  59. Trimble Inc. Trimble SX10 Technical Data Sheet; Trimble Inc.: Westminster, CO, USA, 2017. [Google Scholar]
  60. Software Trimble Business Center TBC Version. 2023. Available online: https://geospatial.trimble.com/en/resources/blog/what-s-new-in-trimble-business-center-version-2023-10 (accessed on 20 September 2023).
  61. Highway Capacity Manual HCM; Transportation Research Board: Washington, DC, USA, 2000.
  62. Majer, S.; Sołowczuk, A. Road surface degradation reasons in case of bus isles and bus stops. In Proceedings of the Seventh International Scientific Con-ference on International Combustion Engines and Vehicles—MOTAUTO, Sofia, Bulgaria, 18–20 October 2000; Volume 2, pp. 122–128. [Google Scholar]
  63. Gardas, P.; Sołowczuk, A. Estimation of the necessary length of strengthening the pavement structure in the vicinity of a bus stop on the basis of tests carried out in a selected city. Roads Bridges–Drog. Mosty 2022, 21, 39–61. [Google Scholar] [CrossRef]
  64. Roess, R.P.; Prassas, E.S.; McShane, W.R. Traffic Engineering: International Edition, 3rd ed.; Pearson: London, UK, 2004. [Google Scholar]
  65. Datka, S.; Suchorzewski, W.; Tracz, M. Inżynieria Ruchu; WKŁ: Warszawa, Poland, 1997. (In Polish) [Google Scholar]
  66. Ahmad, H.; Rahman, M. Traffic Calming Approaches to Road Safety; ARRB Transport Research, Limited: Melbourne, Australia, 2003; Corpus ID: 111393910. [Google Scholar]
  67. Di Mascio, P.; Moretti, L.; Capannolo, A. Concrete block pavements in urban and local roads: Analysis of stress-strain condition and proposal for a catalogue. J. Traffic Transp. Eng. (Engl. Ed.) 2019, 6, 557–566. [Google Scholar] [CrossRef]
  68. Rollings, R.S. Concrete Block Pavements: Technical Report GL-83-3; Geotechnical Laboratory: Vicksburg, MS, USA, 1983. [Google Scholar]
  69. Shwaly, A.S.; Mohamed, H.; Zakaria, M.H.; Al-Ayaat, A.H. Development of Ideal Hump Geometric Characteristics for Different Vehicle Types “Case Study” Urban Roads in Kafr El-Sheikh City (Egypt). Hindawi Adv. Civ. Eng. 2018, 2018, 3093594. [Google Scholar] [CrossRef]
  70. Crouse, D.W. Traffic calming: A social issue. Bull. Sci. Technol. Soc. 2004, 24, 138–144. [Google Scholar] [CrossRef]
  71. Janusevicius, T.; Grubliauskas, R. The Effect of Speed Bumps and Humps on the Concentrations of CO, NO and NO2 in Ambient Air. Air Qual. Atmos. Health 2019, 12, 635–642. [Google Scholar] [CrossRef]
  72. Kostki Antysmogowe—Kostki, Które Oczyszczają Powietrze! Available online: https://www.bruk-bet.pl/warto-wiedziec/kostka-antysmogowa-kostka-ktora-oczyszcza-powietrze (accessed on 20 December 2023). (In Polish).
  73. Kostki Brukowe Antysmogowe. Available online: https://www.intrac.com.pl/oferta/kostki-brukowe-przemyslowe/kostki-antysmogowe/ (accessed on 5 January 2024). (In Polish).
  74. Olak, R. Raport EY: Do 2035 Roku Liczba Pojazdów Elektrycznych w Europie Wzrośnie z 5 do 130 Milionów. Co zrobić by Sieć Elektroenergetyczna to Wytrzymała? Available online: https://www.ey.com/pl_pl/news/2022/02/ey-eurelectric-ev-grid (accessed on 5 January 2024).
  75. Barbosa, H.M.; Tight, M.R.; May, A.D. A model of speed profiles for traffic calmed roads. Transp. Res. Part A Policy Pract. 2000, 34, 103–123. [Google Scholar] [CrossRef]
Figure 1. Different VTCDs suitable for asphalt pavements: (a) speed bump; (b) a series of five speed humps; (c) a series of five speed tables; (d) raised crossing. Source: own work.
Sustainability 16 02982 g001
Figure 2. Adopted stages of the research. Source: own work.
Sustainability 16 02982 g002
Figure 3. Study areas. Source: own work.
Sustainability 16 02982 g003
Figure 4. Trimble SX10 scanning total station used for the terrestrial laser scanning survey: (a) dual-station location of the scanner before and after VTCD; (b) establishment and two measurements of geodetic network; (c) controller and visualisation of measurement data; (d) selected phases of the total station and 3D scanning operation, i.e., 360° “rotation” and 180° “vertical rotation”. Source: own work.
Sustainability 16 02982 g004
Figure 5. Illustrative models made for deformation and distress analysis on the VTCDs under study: (a) hypsometric map; (b) model DM3D; (c) sample profiles of flat-topped speed table: ∆h = 0.06 m and ∆h = 0.14 m; (d) location of an example of pavement deformation and details of the selected fragment. Source: own work.
Sustainability 16 02982 g005
Figure 6. Possible distress and deformations of the concrete block pavement on VTCDs (LH—low harm, MH—moderately harmful, VH—very harmful). Source: own work.
Sustainability 16 02982 g006
Figure 7. Siting of SR4 detectors used to automatically measure traffic volumes and speed on one of the VTCDs under study. Source: own work.
Sustainability 16 02982 g007
Figure 8. Three speed tables in home zone No. 1: (a) No. 1; (b) No. 2; (c) No. 3. Source: own work.
Sustainability 16 02982 g008
Figure 9. Scenarios with two VCTDs: (a) two speed tables in home zone No. 3; (b) two raised crossings in home zone No. 6. Source: own work.
Sustainability 16 02982 g009
Figure 10. Scenarios with one VCTD: (a) raised crossing in home zone No. 2; (b) speed hump in home zone No. 4 after renewal; (c) speed hump in home zone No. 5. Source: own work.
Sustainability 16 02982 g010
Figure 11. Speed hump on the raised junction: (a) condition before renewal No. 7; (b) condition after renewal No. 8; (c) pavement deterioration details on the raised junction on-ramp section (max. to a depth of 1.5 cm concrete block spalling); (d) pavement deterioration details on the raised junction off-ramp section (max. to a depth of 4 cm concrete block spalling). Source: own work.
Sustainability 16 02982 g011aSustainability 16 02982 g011b
Figure 12. Decelerations/accelerations at consecutive VTCDs: (a) three speed tables; (b) two speed tables; (c) two raised crossings. Source: own work.
Sustainability 16 02982 g012aSustainability 16 02982 g012b
Figure 13. Decelerations/accelerations at a single VTCD: (a) raised crossing; (b) speed table. Source: own work.
Sustainability 16 02982 g013
Figure 14. Decelerations/accelerations at speed bumps: (a) before renewal; (b) after renewal. Source: own work.
Sustainability 16 02982 g014
Figure 15. Regression analysis for the data of three and two consecutive VTCD scenarios, respectively: (a) before VTCDs (R = 0.77); (b) after VTCDs (R = 0.70). Source: own work.
Sustainability 16 02982 g015
Figure 16. Regression analysis for the combined data of three and two consecutive VTCD scenarios (R = 0.74). Source: own work.
Sustainability 16 02982 g016
Figure 17. Regression analysis for the single VTCD scenario: (a) before VTCDs (R = −0.51); (b) after VTCDs (R = 0.68). Source: own work.
Sustainability 16 02982 g017
Figure 18. Sewer grates: (a) located at speed table No. 3; (b) located at speed table No. 8; (c) recommended kerb inlets. Source: own work.
Sustainability 16 02982 g018
Figure 19. Pavement structure KR1. Source: own work.
Sustainability 16 02982 g019
Figure 20. Subsidence at sloped sides joints: (a) subsidence on non-preferred pavement after just a few years of exposure to traffic; (b) subsidence on non-preferred pavement after over a dozen years of exposure to traffic; (c) subsidence of non-strengthened pavement after over a dozen years of exposure to traffic. Source: own work.
Sustainability 16 02982 g020
Figure 21. Different shapes of recommended and non-preferred VTCDs. Source: own work.
Sustainability 16 02982 g021
Figure 22. Erratic and correct driving through VTCDs: (a) VTCD shape enabling driving on the footway; (b) elements of small architecture making it impossible to drive on the footway. Source: own work.
Sustainability 16 02982 g022
Figure 23. Pavement structure KR2: (a) approach and departure sections should be 1 m long for streets used by buses; (b) approach and departure sections should be 3 m long for streets where construction projects are expected to take place in the home zone area in question. Source: own work.
Sustainability 16 02982 g023
Table 1. VTCD results of deformation and distress assessment for the analysed VTCDs. Source: own work.
No.Direction of TrafficGeometric Parameters of VTCDsData on Pavement Deformation and Distress
i1l1i2p1/pkp2/pknmdg
Home zone No. 1—Łukęcin (flat-topped speed tables)
1from west16%1.0−19%0.341.4311
from east19%1.0−16%1.140.991
2from west14%0.8−13%1.181.1731
from east13%0.8−14%1.661.2931
3from west8%1.0−20%1.421.47/3.1031
from east20%1.0−8%0.38/22.381.093-1
Home zone No. 2—Łukęcin (raised crossing)
4from west2%4.0−4.0%0.82/0.070.38
from east4%4.0−2%0.961.45/0.11-
Home zone No. 3—Mierzyn Piotra street (flat-topped speed tables)
5from west10%4.5−12%0.920.83/9.300.5
from east12%4.5−10%0.89/4.180.811
6from west11%4.5−9%0.890.830.5
from east9%4.5−11%0.920.810.5
Home zone No. 4—Mierzyn Montessori (speed humps on the raised junction—before No. 7 and after renewal No. 8)
7from west14.8%0.11−15.6% & −9.5%1.741.52/0.604843
from east9.5% & 15.6%0.11−14.8%0.46/1.192.5151643
8from west30%0.20−5.2%1.221.12/0.60
from east5.2%0.20−30%0.89/1.191.13
Home zone No. 5—Mierzyn Topolowa street (flat-topped speed table)
9from west7%1.0−6%0.380.95
from east6%1/0−6%1.451.06
Home zone No. 6—Przecław (raised crossing)
10from west25%4.3−25%3.033.031
from east25%4.3−25%3.103.1011.5
11from west25%4.3−25%4.134.131.5
from east25%4.3−25%2.602.601
Designations: i1—on-ramp gradient, %; i2—off-ramp gradient, %; l1—top surface length, m; p1—“before” subsidence area, m2; p2—“after” subsidence area, m2; pk—additional subsidence area around sewer grates, m2; n—number of cracked concrete blocks, pcs.; m—number of missing or chipped concrete blocks, pcs.; d—length of kerb damage, m; g—max. joint gap depth, cm.
Table 2. Results of the traffic surveys conducted on the analysed VTCDs (in both traffic directions). Source: own work.
No.Traffic Parameters, km/h, and Acceleration a and Deceleration b, m/s2
Direction of TrafficBeforeAfterBeforeAfter
v85beforevavbeforev85aftervavaftera85beforeaavbeforeb85beforebavbeforea85afteraavafterb85afterbavafter
Home zone No. 1—Łukęcin (flat-topped speed table)
1from west13.312.011.710.5−0.34−0.360.470.38−0.96−0.46
from east21.017.721.015.40.060.06−1.08−0.780.990.73
2from west14.713.612,912.10.470.33−0.71−0.411.170.93
from east19.016.216,013.30.490.22−1.17−0.581.290.90
3from west17.716.514.613.20.290.18−1.13−0.791.471.13
from east19.015.816.013.1−0.38−0.350.730.42−0.36−0.16
Home zone No. 2—Łukęcin (raised crossing)
4from west37.533.735.631.90.21 0.11 −0.61−0.42−0.38−0.59
from east31.528.033.729.70.96 1.18 0.970.86−0.48−0.77
Home zone No. 3—Mierzyn Piotra street (flat-topped speed table)
5from west31.424.728.523.7−0.90−0.720.830.69
from east30.423.927.621.2−0.89−0.700.810.62
6from west30.422.828.523.3−0.89−0.670.830.68
from east31.425.327.621.7−0.92−0.740.810.63
Home zone No. 4—Mierzyn Montessori (speed humps on the raised junction—before No. 7 and after renewal No. 8)
7from west20.015.419.717.7−1.74−1.060.40 0.27−1.12−0.63
from east25.622.325.622.30.100.07−0.33−0.232.231.49−0.28−0.17
8from west28.019.625.920.9−1.22−0.851.120.91
from east30.025.026.019.1−0.89−1.081.130.83
Home zone No. 5—Mierzyn Topolowa street (speed table)
9from west24.020.322.818.4−1.00−0.850.950.77
from east22.818.422.818.4−0.95−0.771.060.89
Home zone No. 6—Przecław (raised crossing)
10from west19.415.519.114.9−3.03−2.342.602.00−0.05−0.04
from east20.216.719.215.50.400.37 −2.70−1.833.002.15
11from west16.012.215.712.01.810.73 −2.32−1.233.602.75
from east14.211.013.010.3–2.60–1.282.401.42–0.60–0.31
Table 3. Correlation coefficients R. Source: own work.
ParametersPlace Geometric Parameters of VTCDPlace Geometric Parameters of VTCD
i1h1llth2i2i1h1llth2i2
Three and two VTCD scenario
Traffic, km/hbeforev85−0.550.160.55−0.320.18−0.61afterv85−0.440.250.61−0.220.26−0.52
beforevav−0.650.030.43−0.430.05−0.65aftervav−0.440.250.61−0,220.26−0.52
Horizontal forces, m/s2beforeb85−0.74−0.81−0.52−0.95−0.79−0.83aftera850.750.720.400.930.700.64
beforebav−0.66−0.77−0.55−0.87−0.75−0.39afteraav0.690.700.400.890.690.61
One VTCD scenario
Traffic, km/hbeforev85−0.23−0.790.730.67−0.50−0.17afterv85−0.36−0,760.870.82−0.43−0.37
beforevav−0.52−0.650.810.76−0.47−0.17aftervav−0.41−0,670.910.86−0.31−0.47
Horizontal forces, m/s2beforeb85−0.83−0.470.350.350.27−0.03aftera850.79−0.38−0.17−0.190.590.11
beforebav−0.57−0.440.430.410.62−0.39afteraav0.47−0.53−0.01−0.020.50−0.05
Disclaimer/Publisher’s Note: The statements, opinions and data contained in all publications are solely those of the individual author(s) and contributor(s) and not of MDPI and/or the editor(s). MDPI and/or the editor(s) disclaim responsibility for any injury to people or property resulting from any ideas, methods, instructions or products referred to in the content.

