

BIM-Based Assessment of the Environmental Effects of Various End-of-Life Scenarios for Buildings

Abstract
1. Introduction
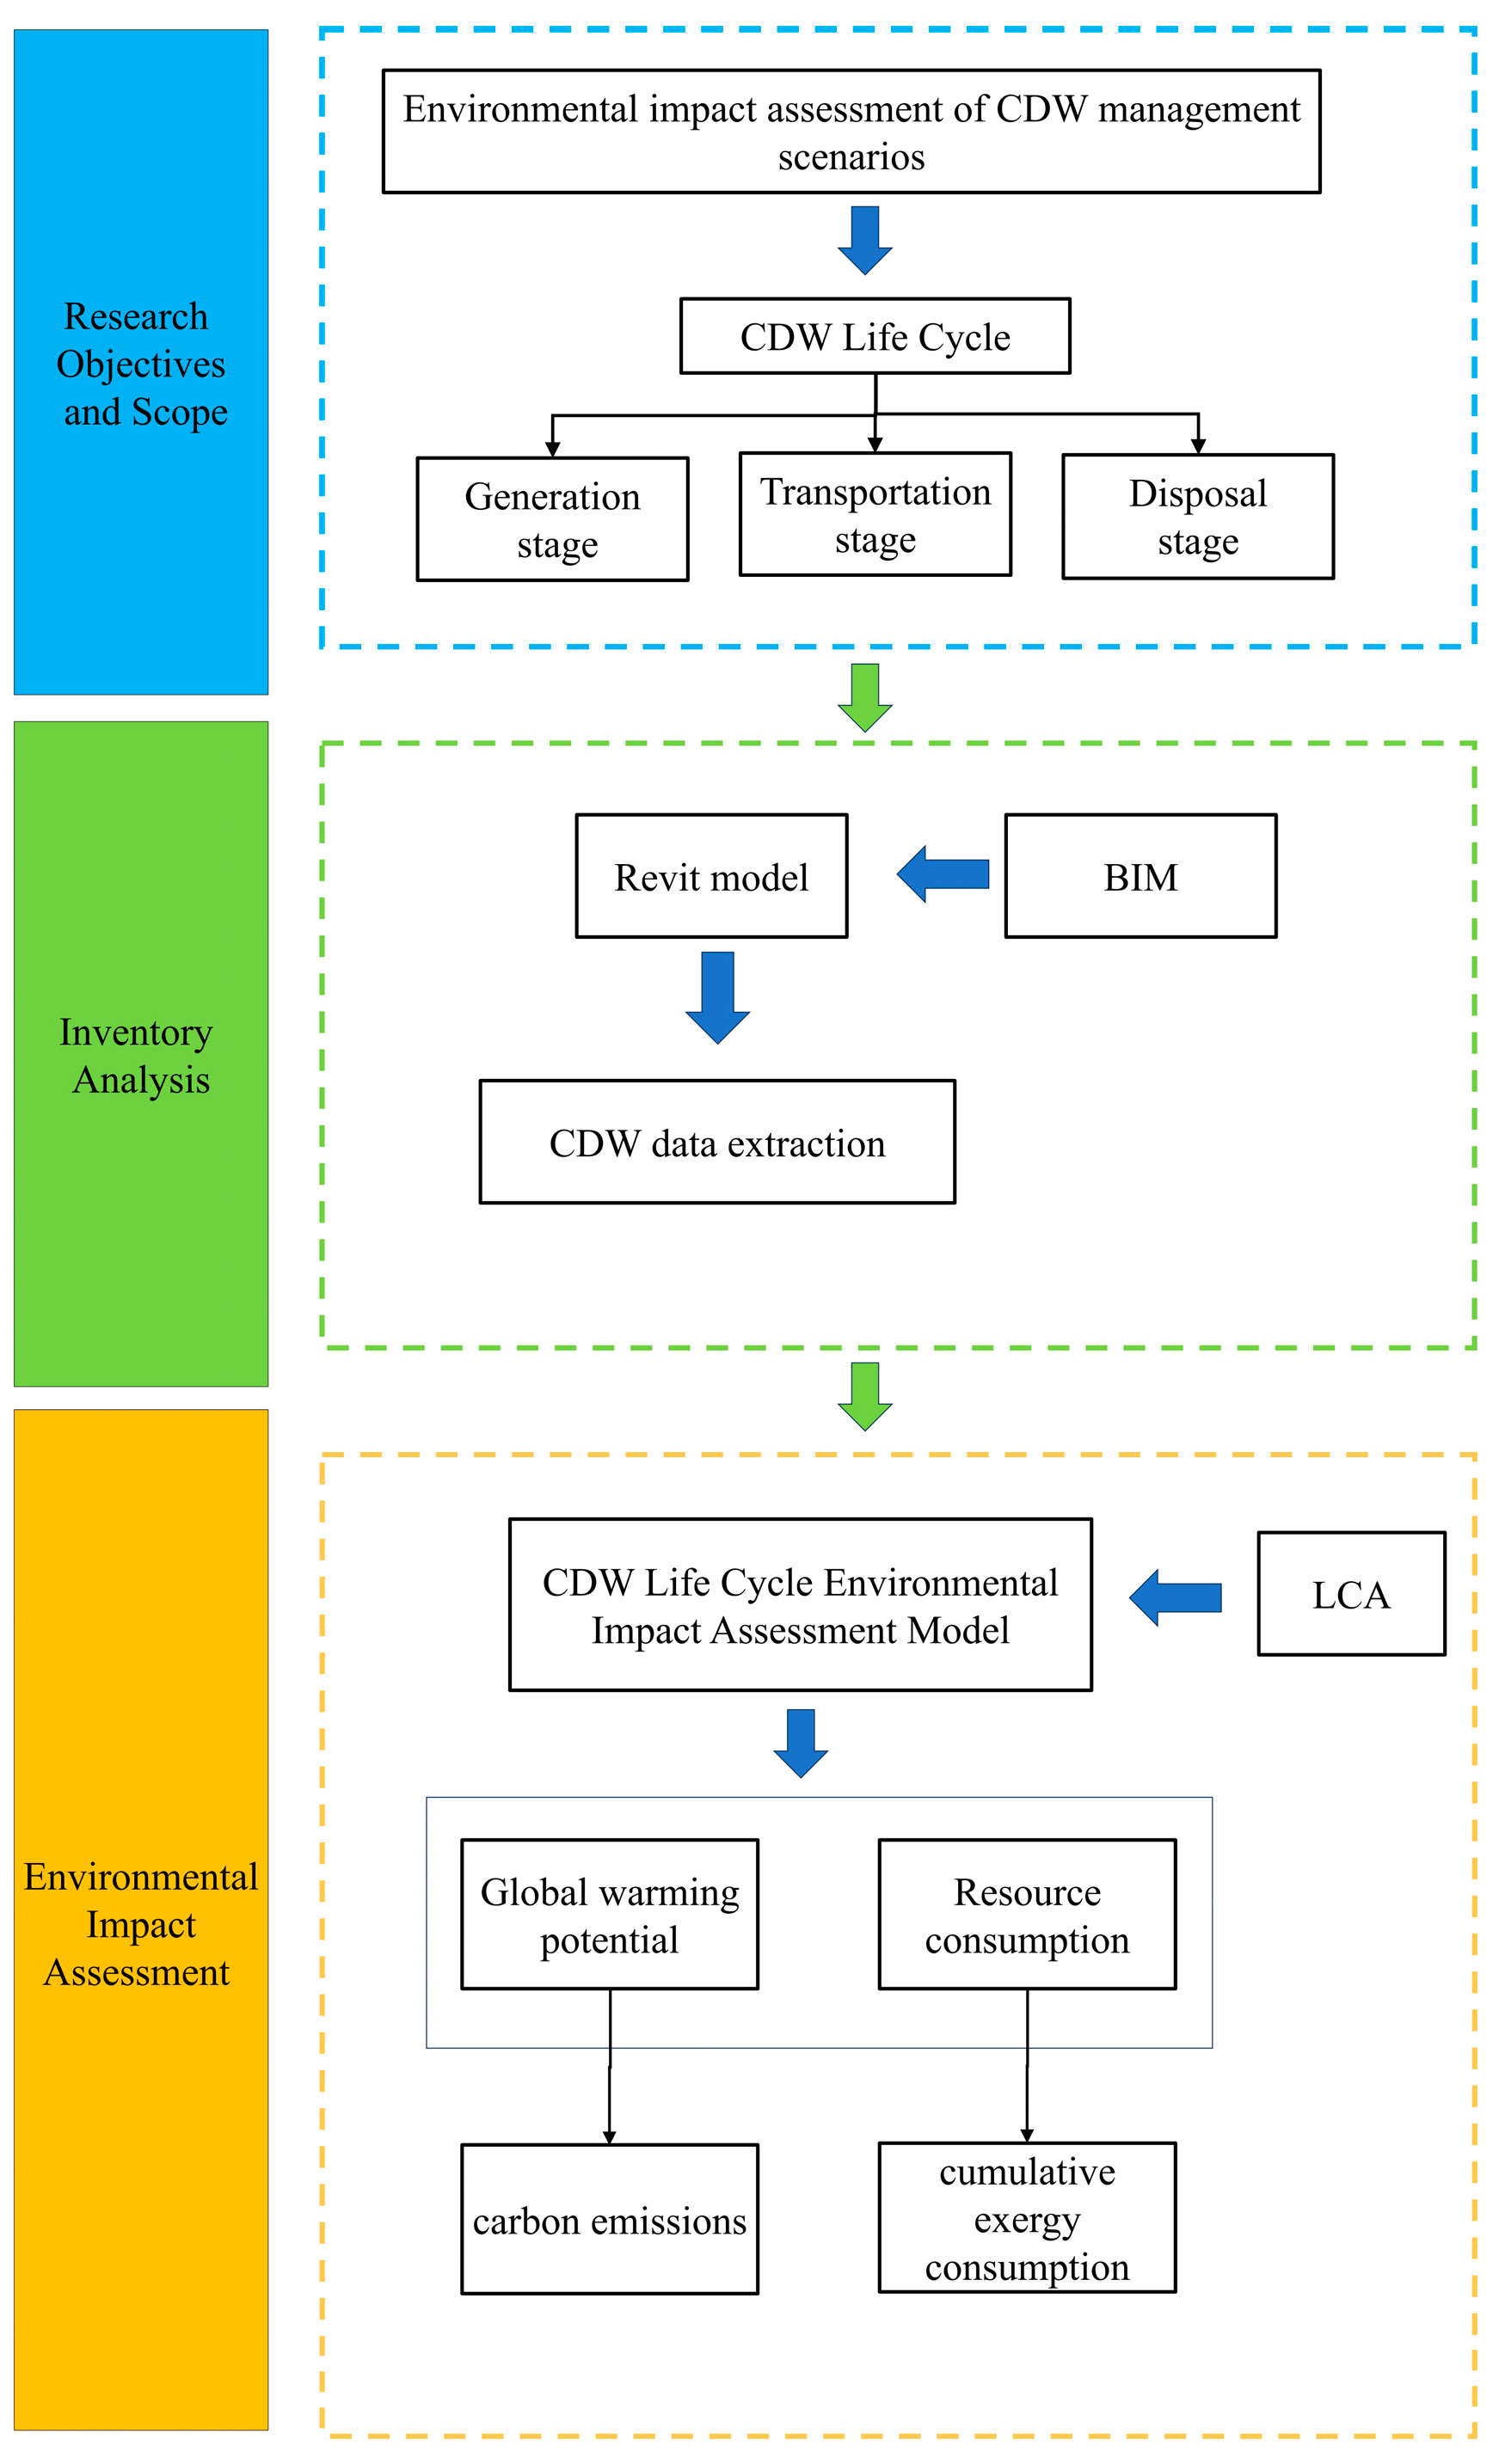
2. Methods
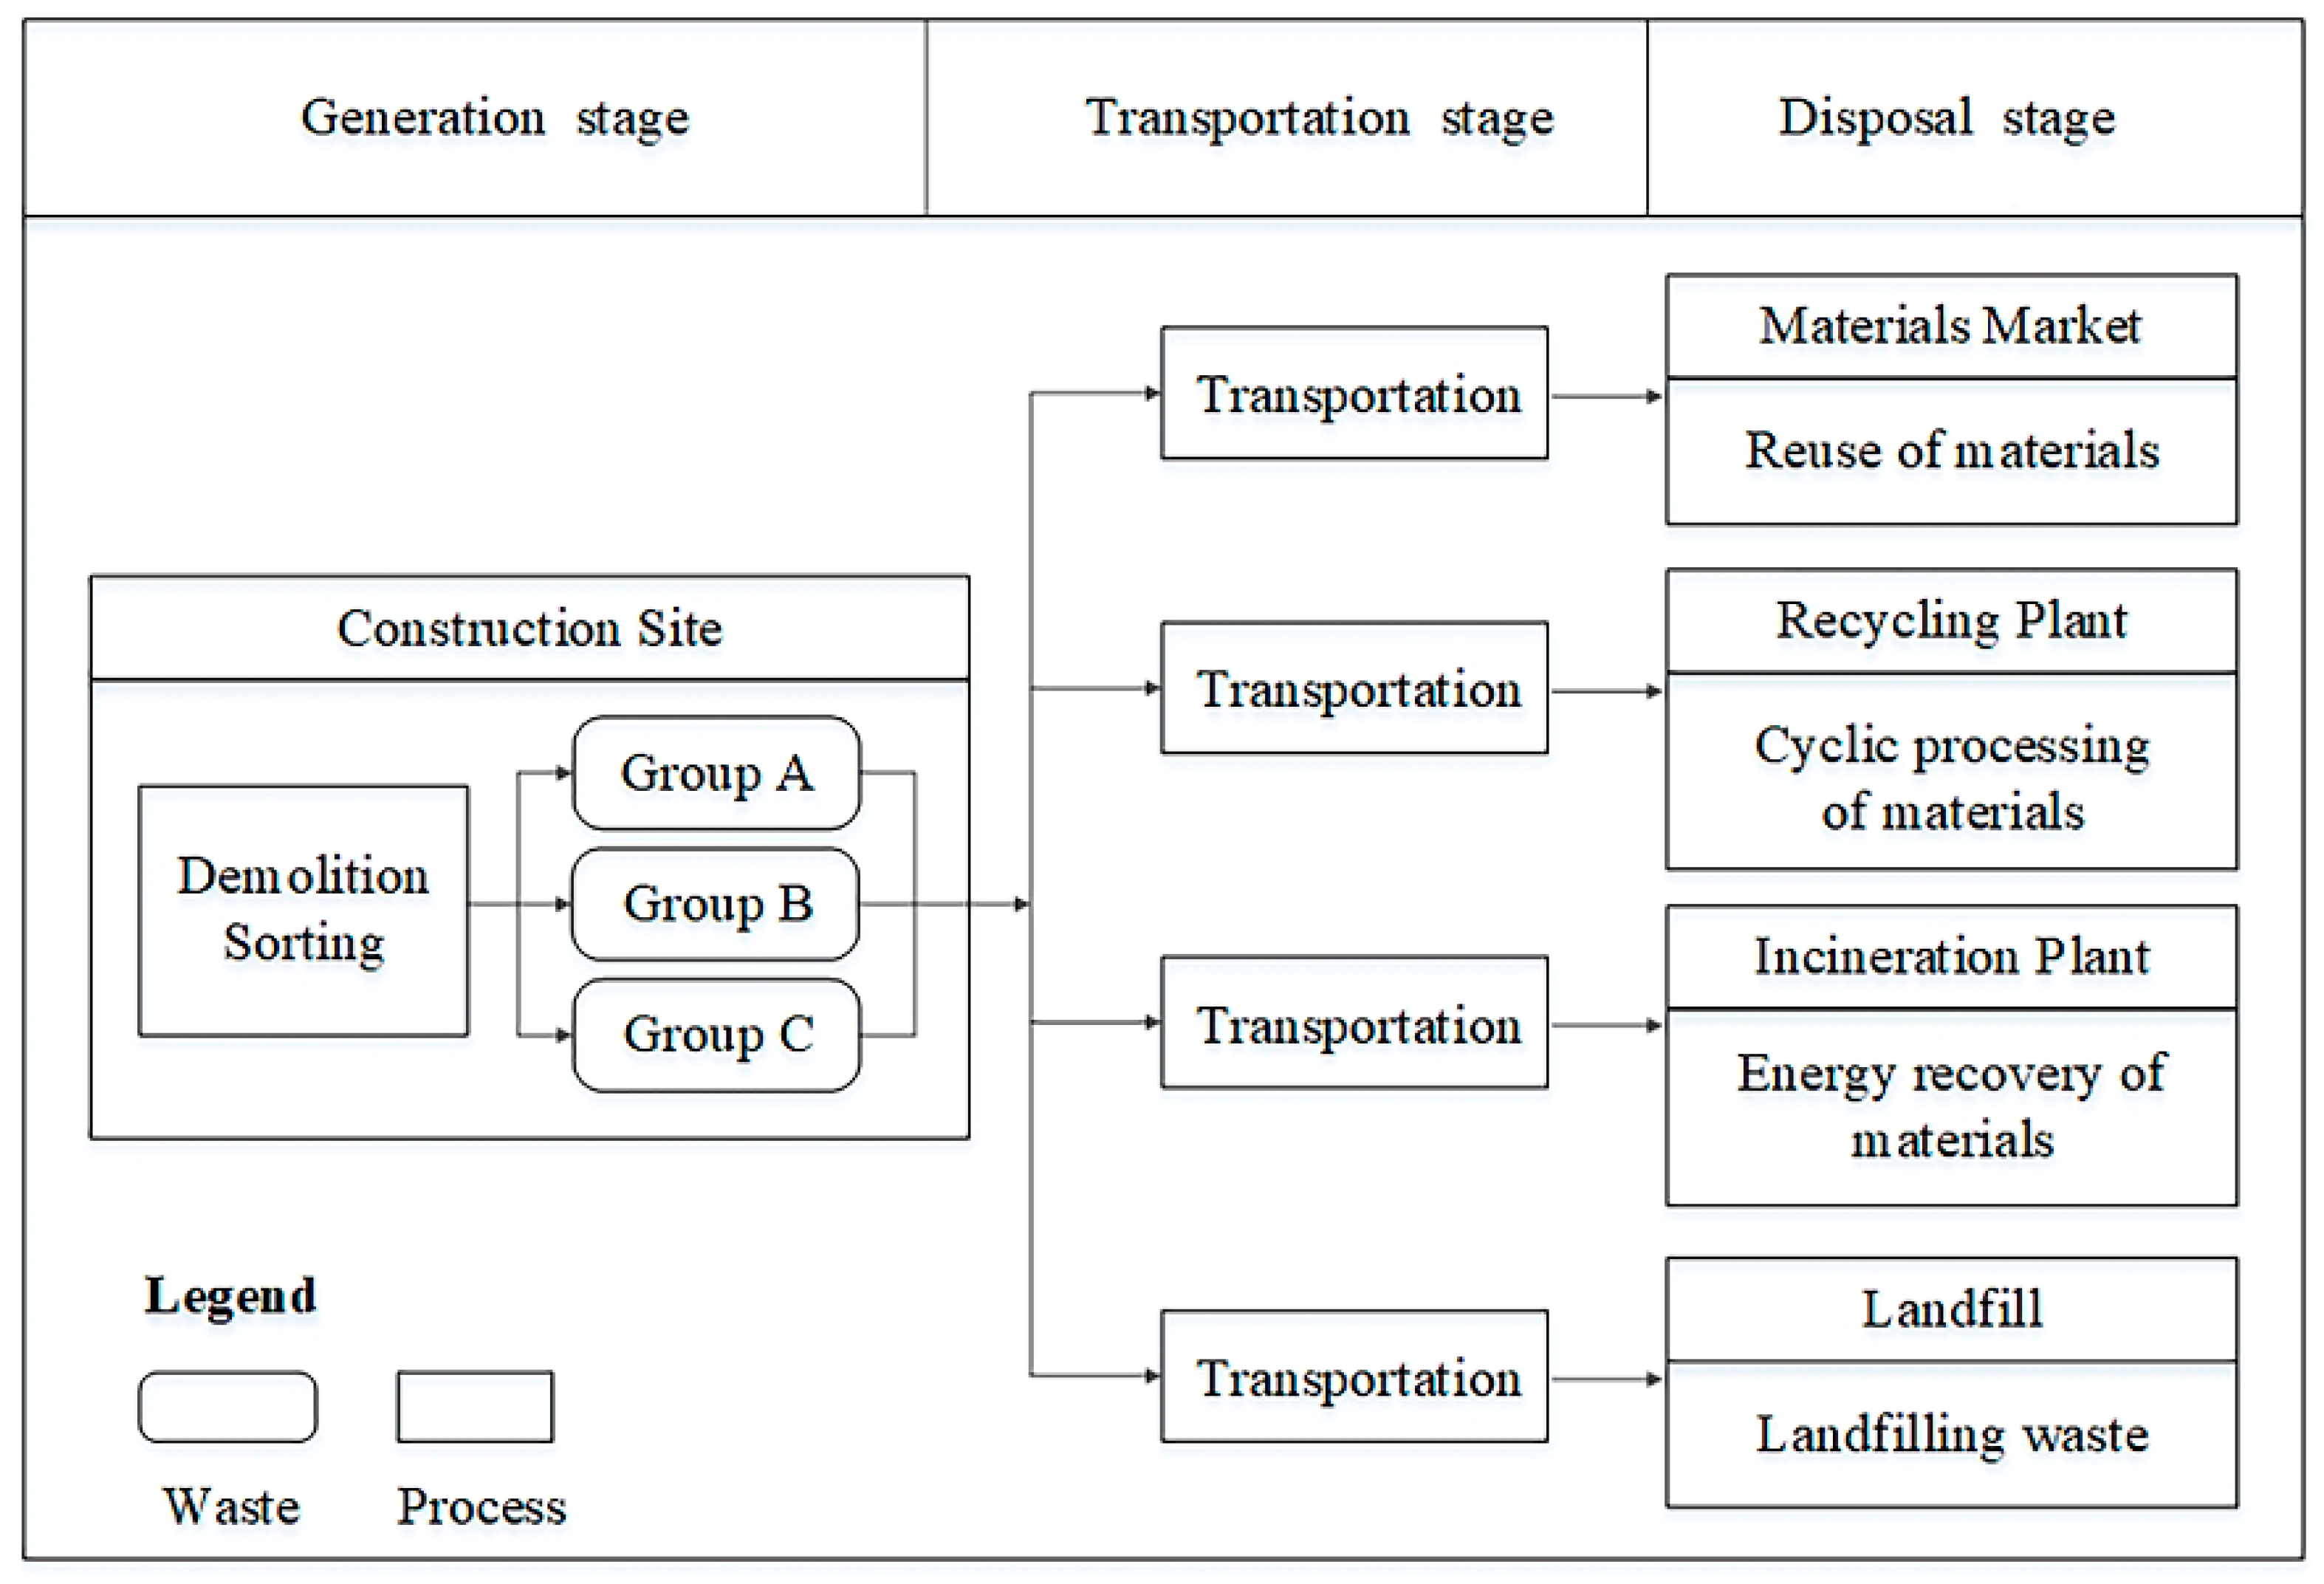
2.1. Goal and Scope Definitions
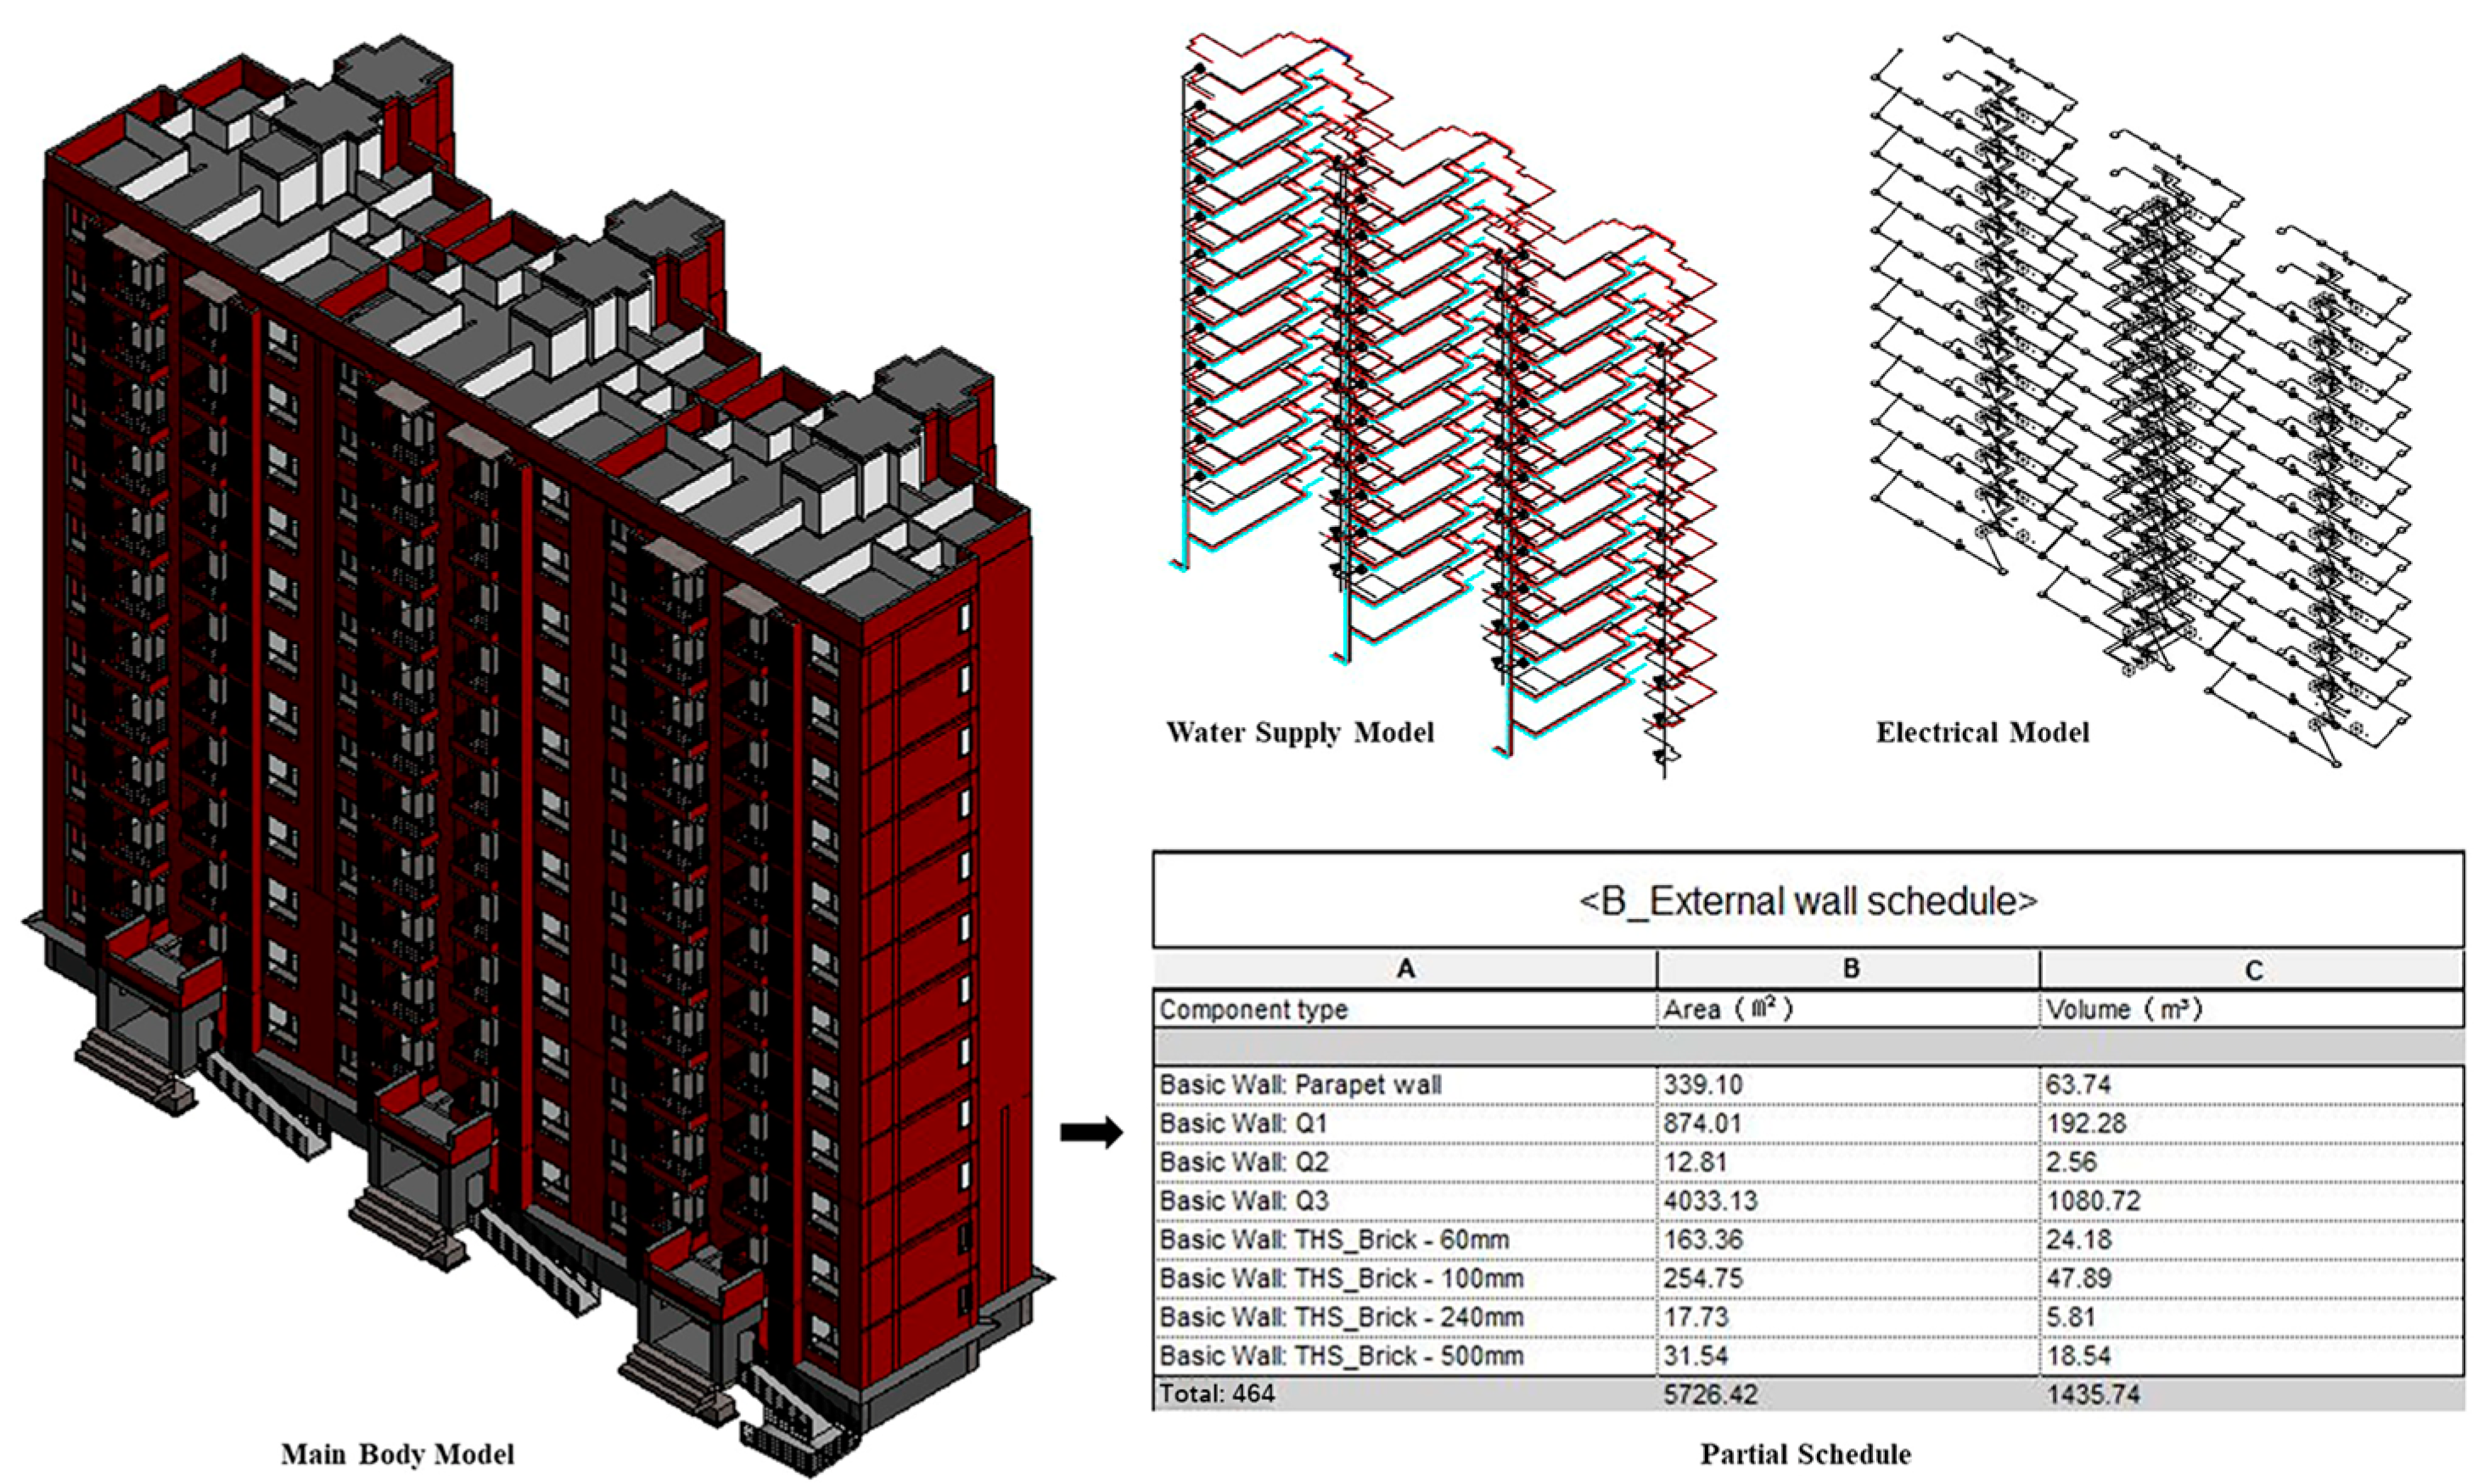
2.2. Inventory Analysis
2.3. Impact Assessment
2.3.1. Carbon Emissions
- (1)
- Generation stage
- (2)
- Transportation stage
- (3)
- Disposal stage
- (1)
- Material market
- (2)
- Recycling plant
- (3)
- Incineration plant
- (4)
- Landfill
2.3.2. Cumulative Exergy Consumption
- (1)
- Generation stage
- (2)
- Transportation stage
- (3)
- Disposal stage
2.4. Results and Interpretation
3. Case Study
3.1. Case Description
3.2. Inventory Analysis
3.3. CDW Management Scenarios
3.3.1. Scenario 1
3.3.2. Scenario 2
3.3.3. Scenario 3
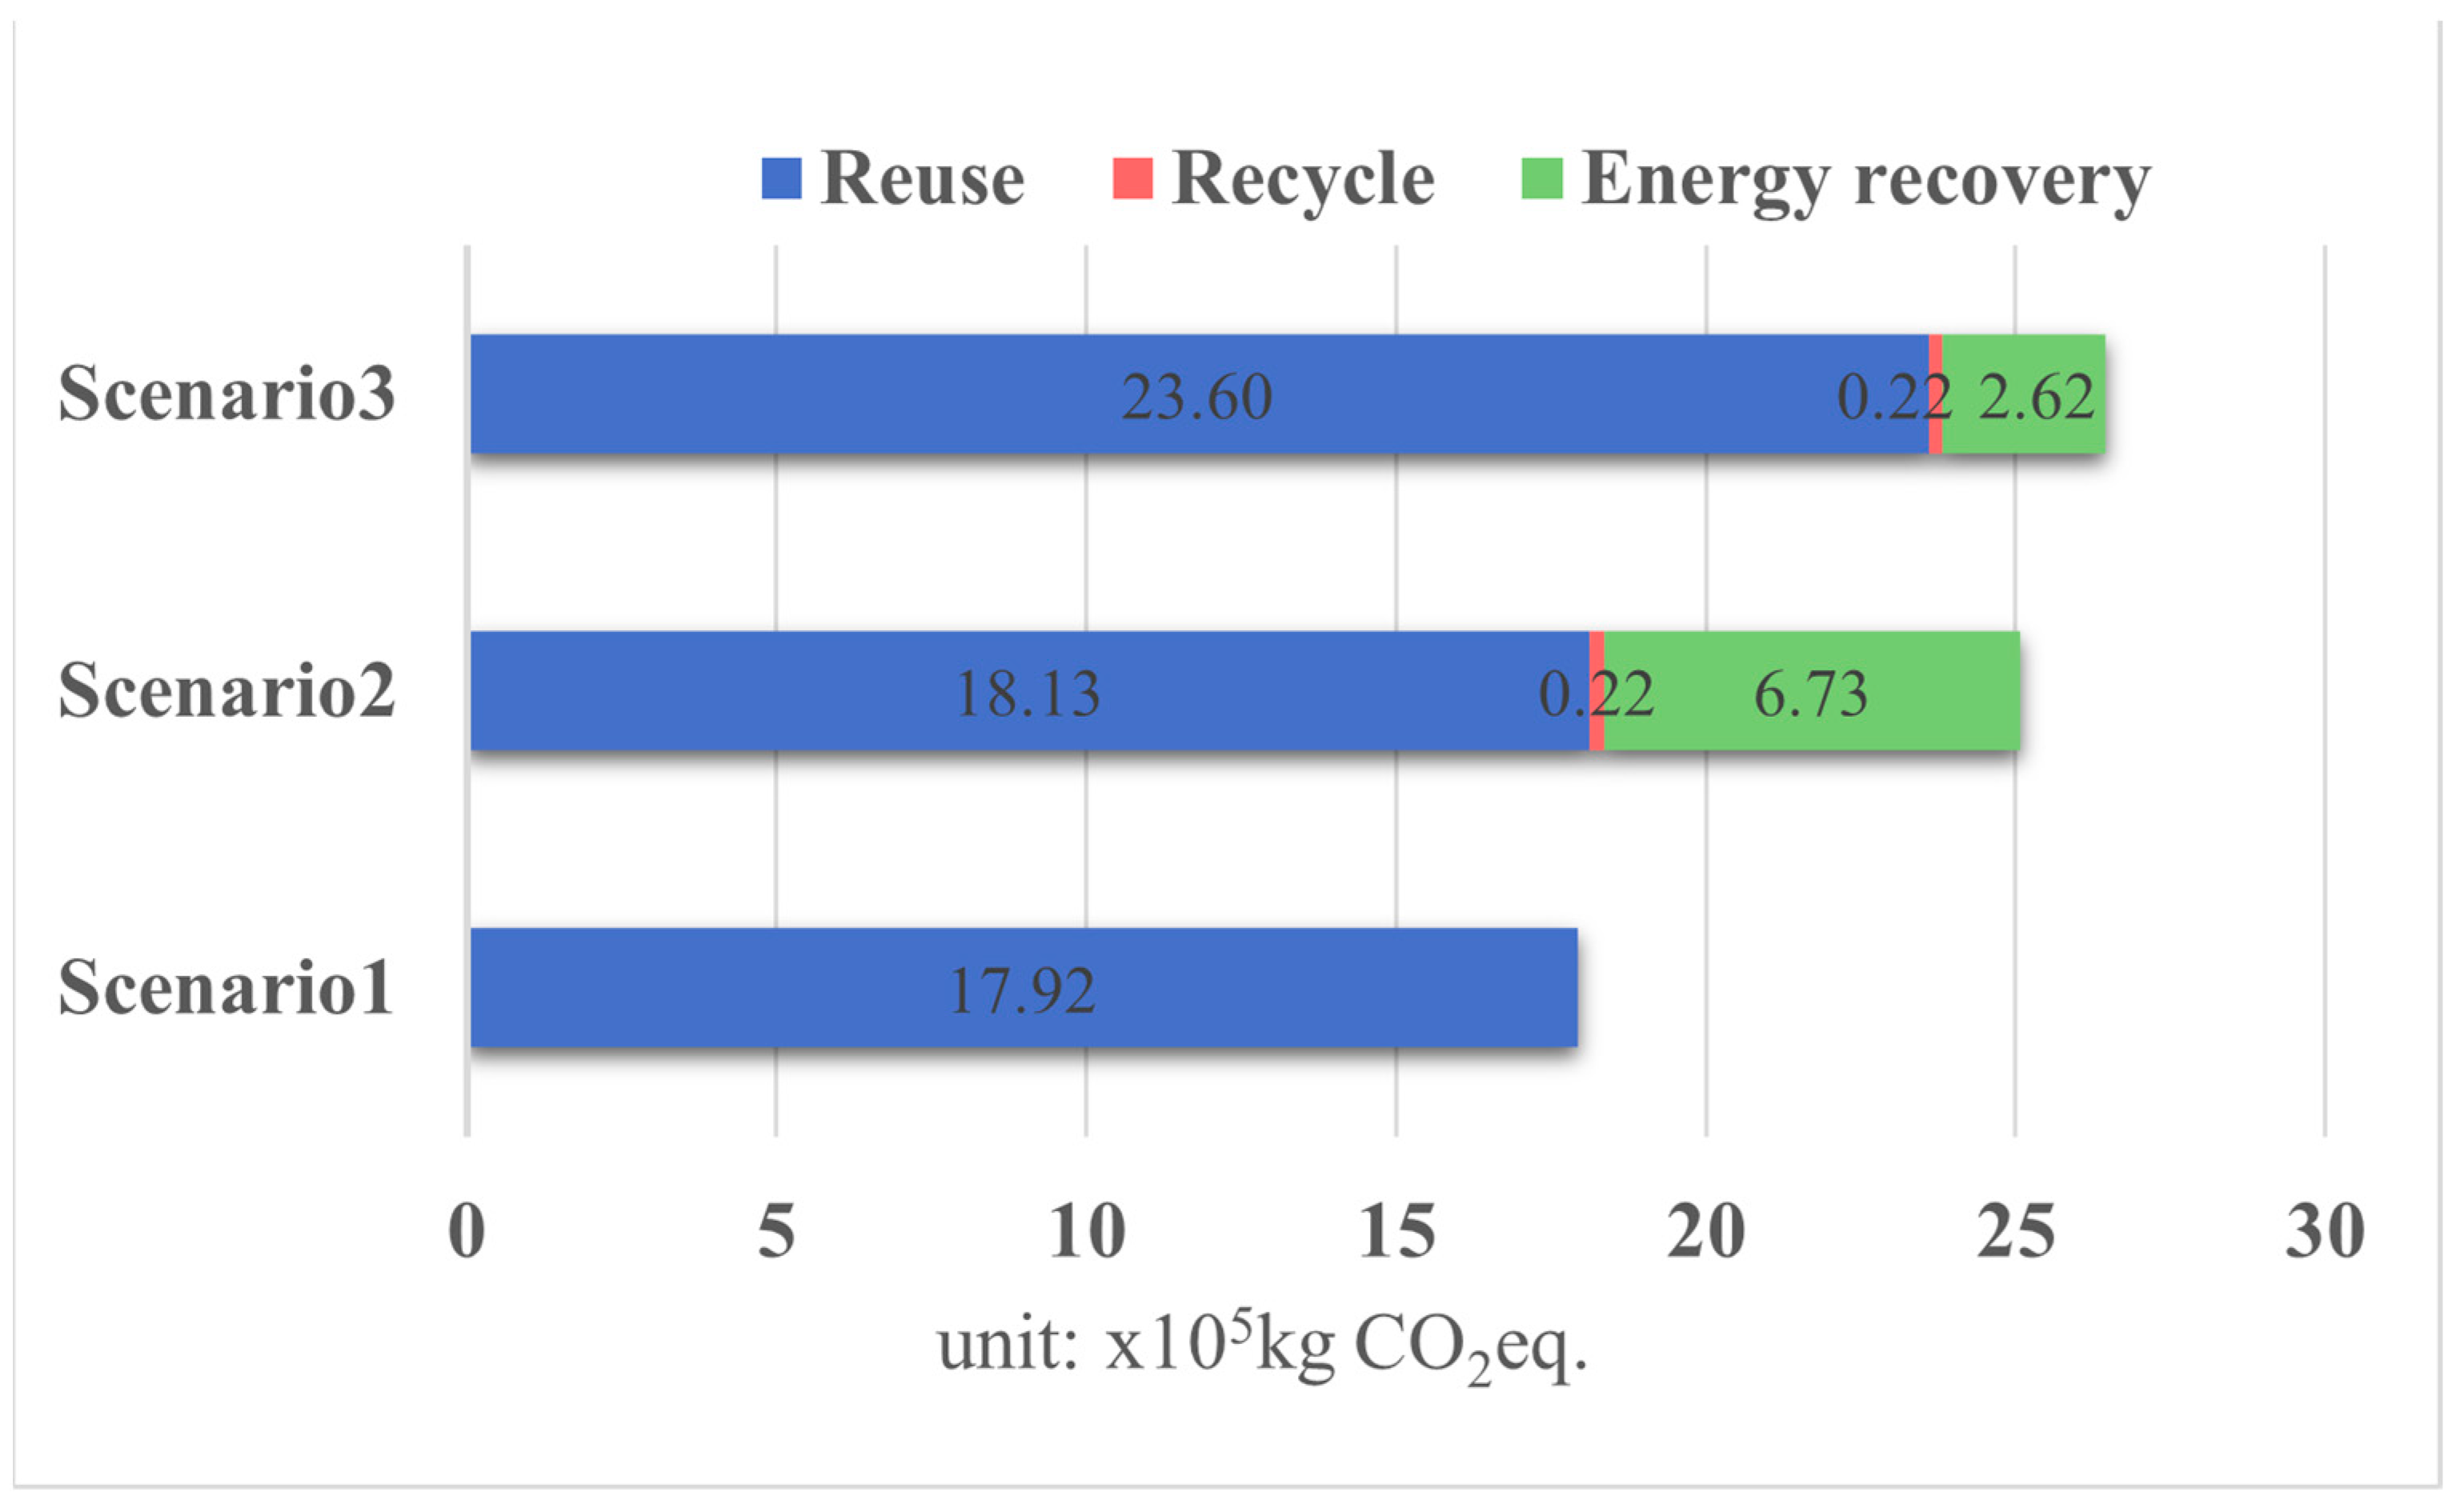
3.4. Calculation Results and Interpretation
4. Discussion
5. Conclusions
- (1)
- Under the circular economy strategy, the CDW management plan that maximizes reuse and recycle has the least environmental impact and can avoid the most carbon emissions and cumulative exergy consumption. Therefore, when formulating CDW management policies, relevant departments should give priority to the circular economy strategy, substitute secondary materials for raw materials as much as possible, and focus on improving the reuse rate and recycling rate.
- (2)
- The environmental benefits brought by the recycling of various materials are not necessarily proportional to their quality or volume. Compared with other materials such as concrete, the environmental benefits of metal and plastic reuse are the most significant, with metal ranking first in terms of the total amount of resource savings, followed by plastic. The best management approach for these energy-intensive materials is reuse, as it requires the least amount of energy compared to material recovery. Therefore, CDW management plans should prioritize the reuse of metals and plastics to reduce the environmental impact caused by carbon emissions and resource consumption.
- (3)
- The avoidance of original resource consumption through energy recovery can generate additional benefits, and its saving effect on original resources cannot be ignored. Therefore, it needs to be comprehensively considered in decision making. For different materials, the resource consumption and resource-saving potential during the recycling process vary. Therefore, when formulating CDW management policies, relevant departments should select the most suitable treatment method based on actual conditions.
6. Limitations and Future Research Directions
Author Contributions
Funding
Institutional Review Board Statement
Informed Consent Statement
Data Availability Statement
Conflicts of Interest
References
- Ginga, C.P.; Ongpeng, J.M.C.; Daly, M.K.M. Circular Economy on Construction and Demolition Waste: A Literature Review on Material Recovery and Production. Materials 2020, 13, 2970. [Google Scholar] [CrossRef] [PubMed]
- Menegaki, M.; Damigos, D. A Review on Current Situation and Challenges of Construction and Demolition Waste Management. Curr. Opin. Green Sustain. Chem. 2018, 13, 8–15. [Google Scholar] [CrossRef]
- Belayutham, S.; González, V.A.; Yiu, T.W. A Cleaner Production-Pollution Prevention Based Framework for Construction Site Induced Water Pollution. J. Clean. Prod. 2016, 135, 1363–1378. [Google Scholar] [CrossRef]
- de Oliveira Andrade, J.J.; Possan, E.; Squiavon, J.Z.; Ortolan, T.L.P. Evaluation of Mechanical Properties and Carbonation of Mortars Produced with Construction and Demolition Waste. Constr. Build. Mater. 2018, 161, 70–83. [Google Scholar] [CrossRef]
- Bocken, N.M.P.; de Pauw, I.; Bakker, C.; van der Grinten, B. Product Design and Business Model Strategies for a Circular Economy. J. Ind. Prod. Eng. 2016, 33, 308–320. [Google Scholar] [CrossRef]
- Huang, B.; Wang, X.; Kua, H.; Geng, Y.; Bleischwitz, R.; Ren, J. Construction and Demolition Waste Management in China through the 3R Principle. Resour. Conserv. Recycl. 2018, 129, 36–44. [Google Scholar] [CrossRef]
- Kabirifar, K.; Mojtahedi, M.; Wang, C.; Tam, V.W.Y. Construction and Demolition Waste Management Contributing Factors Coupled with Reduce, Reuse, and Recycle Strategies for Effective Waste Management: A Review. J. Clean. Prod. 2020, 263, 121265. [Google Scholar] [CrossRef]
- Akanbi, L.A.; Oyedele, L.O.; Akinade, O.O.; Ajayi, A.O.; Davila Delgado, M.; Bilal, M.; Bello, S.A. Salvaging Building Materials in a Circular Economy: A BIM-Based Whole-Life Performance Estimator. Resour. Conserv. Recycl. 2018, 129, 175–186. [Google Scholar] [CrossRef]
- Oliveira, M.; Miguel, M.; van Langen, S.K.; Ncube, A.; Zucaro, A.; Fiorentino, G.; Passaro, R.; Santagata, R.; Coleman, N.; Lowe, B.H.; et al. Circular Economy and the Transition to a Sustainable Society: Integrated Assessment Methods for a New Paradigm. Circ. Econ. Sustain. 2021, 1, 99–113. [Google Scholar] [CrossRef]
- Ghaffar, S.H.; Burman, M.; Braimah, N. Pathways to Circular Construction: An Integrated Management of Construction and Demolition Waste for Resource Recovery. J. Clean. Prod. 2020, 244, 118710. [Google Scholar] [CrossRef]
- Ma, W.; Hao, J.L.; Zhang, C.; Di Sarno, L.; Mannis, A. Evaluating Carbon Emissions of China’s Waste Management Strategies for Building Refurbishment Projects: Contributing to a Circular Economy. Environ. Sci. Pollut. Res. 2023, 30, 8657–8671. [Google Scholar] [CrossRef] [PubMed]
- Wu, H.; Zuo, J.; Zillante, G.; Wang, J.; Yuan, H. Status Quo and Future Directions of Construction and Demolition Waste Research: A Critical Review. J. Clean. Prod. 2019, 240, 118163. [Google Scholar] [CrossRef]
- Ding, Z.; Wang, Y.; Zou, P.X.W. An Agent Based Environmental Impact Assessment of Building Demolition Waste Management: Conventional versus Green Management. J. Clean. Prod. 2016, 133, 1136–1153. [Google Scholar] [CrossRef]
- Rossati, A. Global Warming and Its Health Impact. Int. J. Occup. Environ. Med. 2017, 8, 7–20. [Google Scholar] [CrossRef] [PubMed]
- Wang, Y.; Wang, X.; Wang, H.; Zhang, X.; Zhong, Q.; Yue, Q.; Du, T.; Liang, S. Human Health and Ecosystem Impacts of China’s Resource Extraction. Sci. Total Environ. 2022, 847, 157465. [Google Scholar] [CrossRef] [PubMed]
- Frölicher, T.L.; Paynter, D.J. Extending the Relationship between Global Warming and Cumulative Carbon Emissions to Multi-Millennial Timescales. Environ. Res. Lett. 2015, 10, 075002. [Google Scholar] [CrossRef]
- Dewulf, J.; Van der Vorst, G.; Versele, N.; Janssens, A.; Van Langenhove, H. Quantification of the Impact of the End-of-Life Scenario on the Overall Resource Consumption for a Dwelling House. Resour. Conserv. Recycl. 2009, 53, 231–236. [Google Scholar] [CrossRef]
- Zakerhosseini, A.; Abdoli, M.A.; Molayzahedi, S.M.; Salmi, F.K. Life Cycle Assessment of Construction and Demolition Waste Management: A Case Study of Mashhad, Iran. Environ. Dev. Sustain. 2023, 1–27. [Google Scholar] [CrossRef]
- Wang, T.; Wang, J.; Wu, P.; Wang, J.; He, Q.; Wang, X. Estimating the Environmental Costs and Benefits of Demolition Waste Using Life Cycle Assessment and Willingness-to-Pay: A Case Study in Shenzhen. J. Clean. Prod. 2018, 172, 14–26. [Google Scholar] [CrossRef]
- Qiao, L.; Tang, Y.; Li, Y.; Liu, M.; Yuan, X.; Wang, Q.; Ma, Q. Life Cycle Assessment of Three Typical Recycled Products from Construction and Demolition Waste. J. Clean. Prod. 2022, 376, 134139. [Google Scholar] [CrossRef]
- Zhang, M.; Liu, X.; Kong, L. Evaluation of Carbon and Economic Benefits of Producing Recycled Aggregates from Construction and Demolition Waste. J. Clean. Prod. 2023, 425, 138946. [Google Scholar] [CrossRef]
- Wu, H.; Duan, H.; Wang, J.; Wang, T.; Wang, X. Quantification of Carbon Emission of Construction Waste by Using Streamlined LCA: A Case Study of Shenzhen, China. J. Mater. Cycles Waste Manag. 2015, 17, 637–645. [Google Scholar] [CrossRef]
- Liu, J.; Huang, Z.; Wang, X. Economic and Environmental Assessment of Carbon Emissions from Demolition Waste Based on LCA and LCC. Sustainability 2020, 12, 6683. [Google Scholar] [CrossRef]
- Wang, J.; Wu, H.; Duan, H.; Zillante, G.; Zuo, J.; Yuan, H. Combining Life Cycle Assessment and Building Information Modelling to Account for Carbon Emission of Building Demolition Waste: A Case Study. J. Clean. Prod. 2018, 172, 3154–3166. [Google Scholar] [CrossRef]
- Hoque, M.R.; Durany, X.G.; Sala, C.S.; Méndez, G.V.; Peiró, L.T.; Huguet, T.V. Energy Intensity of the Catalan Construction Sector. J. Ind. Ecol. 2012, 16, 699–709. [Google Scholar] [CrossRef]
- Huysman, S.; De Schaepmeester, J.; Ragaert, K.; Dewulf, J.; De Meester, S. Performance Indicators for a Circular Economy: A Case Study on Post-Industrial Plastic Waste. Resour. Conserv. Recycl. 2017, 120, 46–54. [Google Scholar] [CrossRef]
- Peplow, M. Enzymes Offer Waste-to-Energy Solution. Science 2017, 355, 1360–1361. [Google Scholar] [CrossRef]
- Hoang, N.H.; Ishigaki, T.; Kubota, R.; Tong, T.K.; Nguyen, T.T.; Nguyen, H.G.; Yamada, M.; Kawamoto, K. Waste Generation, Composition, and Handling in Building-Related Construction and Demolition in Hanoi, Vietnam. Waste Manag. 2020, 117, 32–41. [Google Scholar] [CrossRef]
- Hu, Q.; Liu, R.; Su, P.; Huang, J.; Peng, Y. Construction and Demolition Waste Generation Prediction and Spatiotemporal Analysis: A Case Study in Sichuan, China. Environ. Sci. Pollut. Res. 2023, 30, 41623–41643. [Google Scholar] [CrossRef]
- Isikdag, U.; Underwood, J. A Synopsis of the Handbook of Research on Building Information Modelling; May: Salford, MA, USA, 1 January 2010. [Google Scholar]
- Won, J.; Cheng, J.C.P. Identifying Potential Opportunities of Building Information Modeling for Construction and Demolition Waste Management and Minimization. Autom. Constr. 2017, 79, 3–18. [Google Scholar] [CrossRef]
- Lu, Y.; Wu, Z.; Chang, R.; Li, Y. Building Information Modeling (BIM) for Green Buildings: A Critical Review and Future Directions. Autom. Constr. 2017, 83, 134–148. [Google Scholar] [CrossRef]
- Bakchan, A.; Faust, K.M.; Leite, F. Seven-Dimensional Automated Construction Waste Quantification and Management Framework: Integration with Project and Site Planning. Resour. Conserv. Recycl. 2019, 146, 462–474. [Google Scholar] [CrossRef]
- Kim, Y.-C.; Hong, W.-H.; Park, J.-W.; Cha, G.-W. An Estimation Framework for Building Information Modeling (BIM)-Based Demolition Waste by Type. Waste Manag. Res. 2017, 35, 1285–1295. [Google Scholar] [CrossRef] [PubMed]
- Xu, J.; Shi, Y.; Xie, Y.; Zhao, S. A BIM-Based Construction and Demolition Waste Information Management System for Greenhouse Gas Quantification and Reduction. J. Clean. Prod. 2019, 229, 308–324. [Google Scholar] [CrossRef]
- Su, S.; Li, S.; Ju, J.; Wang, Q.; Xu, Z. A Building Information Modeling-Based Tool for Estimating Building Demolition Waste and Evaluating Its Environmental Impacts. Waste Manag. 2021, 134, 159–169. [Google Scholar] [CrossRef] [PubMed]
- De Wolf, C.; Cerezo, C.; Murtadhawi, Z.; Hajiah, A.; Al Mumin, A.; Ochsendorf, J.; Reinhart, C. Life Cycle Building Impact of a Middle Eastern Residential Neighborhood. Energy 2017, 134, 336–348. [Google Scholar] [CrossRef]
- Azzouz, A.; Borchers, M.; Moreira, J.; Mavrogianni, A. Life Cycle Assessment of Energy Conservation Measures during Early Stage Office Building Design: A Case Study in London, UK. Energy Build. 2017, 139, 547–568. [Google Scholar] [CrossRef]
- Brooks, M.; Abdellatif, M.; Alkhaddar, R. Application of Life Cycle Carbon Assessment for a Sustainable Building Design: A Case Study in the UK. Int. J. Green Energy 2021, 18, 351–362. [Google Scholar] [CrossRef]
- Peng, Z.; Lu, W.; Webster, C.J. Quantifying the Embodied Carbon Saving Potential of Recycling Construction and Demolition Waste in the Greater Bay Area, China: Status Quo and Future Scenarios. Sci. Total Environ. 2021, 792, 148427. [Google Scholar] [CrossRef]
- Zhao, Q.; Gao, W.; Su, Y.; Wang, T.; Wang, J. How Can C&D Waste Recycling Do a Carbon Emission Contribution for Construction Industry in Japan City? Energy Build. 2023, 298, 113538. [Google Scholar] [CrossRef]
- Coelho, A.; de Brito, J. Influence of Construction and Demolition Waste Management on the Environmental Impact of Buildings. Waste Manag. 2012, 32, 532–541. [Google Scholar] [CrossRef] [PubMed]
- Level of Development (LOD) Specification–BIM Forum. Available online: https://bimforum.org/resource/lod-level-of-development-lod-specification/ (accessed on 20 March 2024).
- Shi, Y.; Xu, J. BIM-Based Information System for Econo-Enviro-Friendly End-of-Life Disposal of Construction and Demolition Waste. Autom. Constr. 2021, 125, 103611. [Google Scholar] [CrossRef]
- Jin, N.; Tai, J.; Xu, B. Study on physical and chemical characteristics of waste from construction waste transfer stations in Shanghai. Environ. Sustain. Dev. 2020, 45, 68–71. [Google Scholar] [CrossRef]
- General Rules for Calculation of the Comprehensive Energy Consumption GBT2589-2020. Available online: http://ft.panzhihua.gov.cn/zfxxgk/fdzdgknr_1/lzyj/zcwj/1949798.shtml (accessed on 20 March 2024).
- CPCD, China Products Carbon Footprint Factors Database. Available online: https://lca.cityghg.com/ (accessed on 20 March 2024).
- Huang, J.; Zhang, H.; Tan, Q.; Zhan, M.; Lin, X.; Li, X. Calculation of Carbon Emissions of a Small Scale Waste Pyrolysis-gasification Incineration Plant. Environ. Sanit. Eng. 2021, 29, 1–6. [Google Scholar] [CrossRef]
- López Ruiz, L.A.; Roca Ramón, X.; Gassó Domingo, S. The Circular Economy in the Construction and Demolition Waste Sector—A Review and an Integrative Model Approach. J. Clean. Prod. 2020, 248, 119238. [Google Scholar] [CrossRef]
- Hossain, M.d.U.; Leu, S.-Y.; Poon, C.S. Sustainability Analysis of Pelletized Bio-Fuel Derived from Recycled Wood Product Wastes in Hong Kong. J. Clean. Prod. 2016, 113, 400–410. [Google Scholar] [CrossRef]
- Borkowski, A.S. Evolution of BIM: Epistemology, Genesis and Division into Periods. J. Inf. Technol. Constr. 2023, 28, 646–661. [Google Scholar] [CrossRef]


| CDW Material | Volume (m³) | Density (t/m³) | Change Factor | Weight (t) |
|---|---|---|---|---|
| Group A | 877.4 | |||
| Steel | 59.88 | 7.85 | 1 | 470.06 |
| Aluminum | 13.12 | 2.7 | 1.02 | 36.13 |
| Plastic | 133.55 | 1.6 | 1.1 | 235.05 |
| Timber | 159.89 | 0.7 | 1.05 | 117.52 |
| Glass | 7.10 | 2.5 | 1.05 | 18.64 |
| Group B | 9212.92 | |||
| Concrete | 2092.99 | 2.42 | 1.1 | 5571.54 |
| Cement | 617.61 | 2 | 1.2 | 1482.26 |
| Brick | 782.42 | 1.9 | 1.2 | 1783.89 |
| Ceramic tile | 126.34 | 2.7 | 1.1 | 375.23 |
| Group C | 146.89 | |||
| Mixed fragment | 94.16 | 1.3 | 1.2 | 146.89 |
| Total | 10,237.21 |
| Machine | Work Efficiency | Unit | Energy Type | Energy Consumption Rate | Unit | Data Source |
|---|---|---|---|---|---|---|
| Rock drill | 0.355648 | h/ | Electricity | 16.1 | kwh/h | onsite survey in Dalian |
| Hydraulic hammer | 0.038396 | h/ | Diesel | 22.1 | kg/h | |
| Crawler bulldozer | 0.0266715 | h/ | Diesel | 17.3 | kg/h | |
| Crawler excavator | 0.025281 | h/ | Diesel | 17.3 | kg/h | |
| Crawler hydraulic rock crusher | 0.124016 | h/ | Diesel | 26.2 | kg/h |
| Energy Type | Carbon Emissions Factor | Unit | Source |
|---|---|---|---|
| Diesel | 4.16015 | kg eq./kg | IPCC 2013 GWP 100a V1.01 |
| Electricity | 0.8357 | kg eq./kwh | NDRC, 2010 |
| Waste Materials | Raw Materials Replaced | Carbon Emission Factors of Raw Material Reduction (kg CO2 eq./t) | Source |
|---|---|---|---|
| Steel | Steel | 2268.6477 | IPCC 2013 GWP 100a V1.01 |
| Aluminum | Aluminum | 20,074.1686 | |
| Plastic | Plastic | 1866.6075 | |
| Timber | Timber | 919.2599 | |
| Glass | Glass | 1166.5981 | |
| Masonry material waste | Natural coarse aggregate | 2.4250 | |
| Mixed fragment | - | - |
| Type | Unit | Numerical Value |
|---|---|---|
| Calorific value of construction waste | KJ/kg | 5000 1 |
| Calorific value of standard coal | KJ/kg | 7000 2 |
| Carbon emissions per standard coal | kg | 2.493 3 |
| Carbon emissions per unit of waste incineration | kg | 0.61 4 |
| Material Type | Scenario 1 | Scenario 2 | Scenario 3 |
|---|---|---|---|
| Group A | |||
| Steel | Reuse | Reuse | Reuse |
| Aluminum | Reuse | Reuse | Reuse |
| Glass | Landfill | Reuse | Reuse |
| Plastic | Landfill | Incineration | Reuse |
| Timber | Landfill | Incineration | Reuse |
| Group B | |||
| Concrete | Landfill | Recycle | Recycle |
| Cement | Landfill | Recycle | Recycle |
| Brick | Landfill | Recycle | Recycle |
| Ceramic tile | Landfill | Recycle | Recycle |
| Group C | |||
| Mixed fragment | Landfill | Landfill | Incineration |
| Stage | Scenario 1 (kg CO2 eq.) | Scenario 2 (kg CO2 eq.) | Scenario 3 (kg CO2 eq.) |
|---|---|---|---|
| Generation stage | 1.503 × 10⁵ | 1.503 × 10⁵ | 1.503 × 10⁵ |
| Transportation stage | 1.520 × 10⁴ | 1.520 × 10⁴ | 1.520 × 10⁴ |
| Disposal stage | 2.687 × 10⁴ | −3.003 × 10⁵ | −8.295 × 10⁵ |
| Materials market | −1.792 × 10⁶ | −1.813 × 10⁶ | −2.360 × 10⁶ |
| Recycling plant | 0 | 1.703 × 10⁶ | 1.703 × 10⁶ |
| Incineration plant | 0 | −4.128 × 10⁵ | −1.720 × 10⁵ |
| Landfill | 1.819 × 10⁶ | 2.233 × 10⁵ | 0 |
| Total | 1.923 × 10⁵ | −1.348 × 10⁵ | −6.641 × 10⁵ |
| Stage | Scenario 1 (MJ) | Scenario 2 (MJ) | Scenario 3 (MJ) |
|---|---|---|---|
| Generation stage | 1.167 × 10⁶ | 1.167 × 10⁶ | 1.167 × 10⁶ |
| Transportation stage | 1.188 × 10⁶ | 1.188 × 10⁶ | 1.188 × 10⁶ |
| Disposal stage | 2.676 × 10⁶ | 3.166 × 10⁶ | 3.082 × 10⁵ |
| Materials market | 0 | 0 | 0 |
| Recycling plant | 0 | 2.509 × 10⁵ | 2.509 × 10⁵ |
| Incineration plant | 0 | 2.867 × 10⁶ | 5.729 × 10⁴ |
| Landfill | 2.676 × 10⁶ | 4.847 × 10⁴ | 0 |
| Total | 5.031 × 10⁶ | 5.520 × 10⁶ | 2.663 × 10⁶ |
| Material Type | Scenario 1 (MJ) | Scenario 2 (MJ) | Scenario 3 (MJ) |
|---|---|---|---|
| Group A | 1.949 × 10⁷ | 2.136 × 10⁷ | 3.793 × 10⁷ |
| Steel | 1.233 × 10⁷ | 1.233 × 10⁷ | 1.233 × 10⁷ |
| Aluminum | 7.155 × 10⁶ | 7.155 × 10⁶ | 7.155 × 10⁶ |
| Plastic | 0 | 3.620 × 10⁵ | 1.435 × 10⁷ |
| Timber | 0 | 6.373 × 10⁵ | 6.373 × 10⁵ |
| Glass | 0 | 8.732 × 10⁵ | 3.454 × 10⁶ |
| Group B | 0 | 2.157 × 10⁶ | 2.157 × 10⁶ |
| Concrete | 0 | 1.003 × 10⁶ | 1.003 × 10⁶ |
| Mixed debris | 0 | 1.154 × 10⁶ | 1.154 × 10⁶ |
| Group C | 0 | 0 | 5.229 × 10⁵ |
| Mixed fragment | 0 | 0 | 5.229 × 10⁵ |
| Total | 1.949 × 10⁷ | 2.352 × 10⁷ | 4.601 × 10⁷ |
Disclaimer/Publisher’s Note: The statements, opinions and data contained in all publications are solely those of the individual author(s) and contributor(s) and not of MDPI and/or the editor(s). MDPI and/or the editor(s) disclaim responsibility for any injury to people or property resulting from any ideas, methods, instructions or products referred to in the content. |
© 2024 by the authors. Licensee MDPI, Basel, Switzerland. This article is an open access article distributed under the terms and conditions of the Creative Commons Attribution (CC BY) license (https://creativecommons.org/licenses/by/4.0/).
Share and Cite
Wang, S.; Wu, Q.; Yu, J. BIM-Based Assessment of the Environmental Effects of Various End-of-Life Scenarios for Buildings. Sustainability 2024, 16, 2980. https://doi.org/10.3390/su16072980
Wang S, Wu Q, Yu J. BIM-Based Assessment of the Environmental Effects of Various End-of-Life Scenarios for Buildings. Sustainability. 2024; 16(7):2980. https://doi.org/10.3390/su16072980
Chicago/Turabian StyleWang, Shuqiang, Qingqing Wu, and Jinping Yu. 2024. "BIM-Based Assessment of the Environmental Effects of Various End-of-Life Scenarios for Buildings" Sustainability 16, no. 7: 2980. https://doi.org/10.3390/su16072980
APA StyleWang, S., Wu, Q., & Yu, J. (2024). BIM-Based Assessment of the Environmental Effects of Various End-of-Life Scenarios for Buildings. Sustainability, 16(7), 2980. https://doi.org/10.3390/su16072980