Abstract
The Northeast State-owned Forest Areas comprise the largest region of resources in China. The transformation of the Northeast State-owned Forest Areas is due to various stimuli, such as policies, systems, and markets. In the context of ecological construction and the reform of the state-owned forest system in Northeast China, these have undergone a transformation in terms of economy, society, and ecology. However, a mismatch persists between employment and industrial structures, leading to hidden unemployment. This study employs the framework of hidden unemployment theory, utilizing the Cobb–Douglas production function to quantify the hidden unemployment rate, revealing the relationship between transformation and hidden unemployment. Through this analysis, the underlying causes of hidden unemployment in Northeast China’s state-owned forest regions are scrutinized. There is a bidirectional causal relationship between ecological transformation and hidden unemployment, while there is a unidirectional causal relationship between economic transformation and hidden unemployment. Variance decomposition analysis highlights the substantial contribution of social transformation, followed by economic transformation, with ecological transformation playing a comparatively smaller role. Based on the above research, this article proposes expediting the reforms within the forest industry groups, facilitating the separation of governmental and corporate interests. Additionally, it advocates for strategic forestry development planning to effectively absorb surplus labor, and proposes three policy directives aimed at supporting forest area employees, including provisions for job transfers and reemployment opportunities.
1. Introduction
The Northeast State-owned Forest Areas, comprising China’s largest forest ecological functional zone, are essential for ecological preservation and sustainable economic development [1,2]. This region has suffered economic, social, and ecological catastrophes as a result of the extended and intensive exploitation of forest resources [3,4]. The government has thus implemented the Natural Forest Resources Protection Project, which involves the protection of ecological functional areas [5]; a complete ban on commercial logging of natural forests; and the “Reform Plan of State-owned Forest Farm” and “Guiding Opinions on Reform of State-owned Forest Region” [6,7,8]. These initiatives aim to facilitate the transformation of the forest region [9]. Ecological policies mainly affect the environmental and economic features of the Northeast State-owned Forest Areas, while the literature on forest system reform mostly discuss changes at the forest system level [2,10]. Therefore, the Northeast State-owned Forest Areas have undergone economic, social, and ecological shifts [11]. However, in this transition, a discrepancy arose between the employment structure and industrial structure [12,13]. Additionally, the nature of the employment system in the Northeast State-owned Forest Areas generates a surplus of laborers [12,14], giving rise to “hidden unemployment”.
Forest industry groups form against the background of a traditional planned economy system. Their special management system ensures that forest workers can be fully employed without unemployment, disproving the theory that labor is a commodity. Consequently, there exists no labor market or unemployment insurance system within these groups. However, with economic, social, and ecological reforms, the efficiency of labor from both internal and external sources has prompted us to reconsider the issue of unemployment among forestry workers. Forest industry groups gradually divest government functions through institutional reform and transform into enterprises, aiming to solve the internal surplus labor and redistribution problems through market mechanisms. However, this process has become challenging due to the imperfect labor market and incomplete unemployment insurance system. Moreover, the dearth of research on hidden unemployment in the Northeast State-owned Forest Areas exacerbates this issue. Thus, it has become imperative to quantify the extent of hidden unemployment in these regions to facilitate a deeper analysis of its causes and ramifications. Therefore, enhancing the unemployment insurance system has emerged as a vital strategy to mitigate hidden unemployment in the Northeast State-owned Forest Areas. Such measures would provide a safety net for transitioning individuals affected by hidden unemployment, fostering a more sustainable workforce within these regions.
Labor demand and hidden unemployment in the Northeast State-owned Forest Areas are vital indicators of future workforce reallocation. Investigating the root causes and repercussions of hidden unemployment in these regions would lay the groundwork for targeted development strategies in subsequent phases of forest area advancement. This study utilizes forestry statistics, primarily sourced from the China Forestry and Grassland Statistical Yearbook, alongside data from the “Northeast State-owned Forest Region Reform Monitoring” project, to calculate and analyze hidden unemployment in the Northeast State-owned Forest Areas. Incorporating labor heterogeneity components enhances the accuracy of these estimates. By examining the causal relationships between economic, social, and ecological changes and analyzing the factors contributing to hidden unemployment, this study predicts the impact of economic, social, and ecological transformations on hidden unemployment. Such insights offer valuable guidance for addressing hidden unemployment challenges in these areas during later development.
This paper makes several potential contributions. (1) Integration of supply–demand theory and dual-economy structure: Hidden unemployment in the Northeast State-owned Forest Areas is examined using supply–demand theory and a dual-economy structure. This statement highlights that, amid the increasing intensity of natural forest protection measures, the primary causes and mechanisms of hidden unemployment are rooted in the mismatch between the current industrial and employment structures, as well as the nature of the employment mechanism. (2) Analysis of labor force heterogeneity: This research examines labor force heterogeneity using data from the China Forestry and Grassland Statistical Yearbook and the “Northeast State-owned Forest Region Reform Monitoring” project launched collaboratively by the State Forestry and Grassland Bureau and the Northeast Forestry University. Heterogeneity analysis enhances the precision of measuring the hidden unemployment rate and offers a greater understanding of the current state of hidden unemployment in the Northeast State-owned Forest Areas (3) Exploration of transformation impact: This research explores the underlying factors of hidden unemployment and estimates the factors that might lead to later transformation in the Northeast State-owned Forest Areas, which contributes to our understanding of how economic, social, and ecological transformation factors impact hidden unemployment and reassign the surplus labor in the Northeast State-owned Forest Areas. The Northeast State-owned Forest Areas are typical resource areas, and their development thus depends on the resources they offer. Furthermore, the hidden unemployment in these areas is stimulated by ecological policies (projects) and institutional reforms, which will not only affect the social stability of forest areas and hinder their economic development but also indirectly affect the protection and development of forest resources. The study of hidden unemployment in the Northeast State-owned Forest Areas is not only conducive to improving social stability and people’s livelihoods in forest areas but also provides a basis for the protection of forest resources in the Northeast State-owned Forest Areas. Although this study was carried out in the context of China’s forest reform, it can provide a broader understanding of and impact on the economics of population, resources, and the environment. Insights gleaned from this study can inform global efforts to address hidden unemployment, particularly in regions undergoing ecological and resource transitions, such as those in Africa and South America. These areas face similar challenges of resource depletion and livelihood insecurity, making the findings and lessons learned herein valuable for devising solutions to hidden unemployment worldwide.
2. Literature Review
In 1936, the British economist Robinson defined hidden unemployment as skilled professionals taking on nontechnical tasks to make a living during the Great Depression. Here, marginal productivity is lower than potential productivity [15]. Subsequently, the American economist Lewis extended this concept to describe a labor force with zero (negative) marginal productivity in the traditional agricultural sector of developing countries [16]. The research scope of hidden unemployment has evolved from agriculture [17,18] to industry [19,20,21] as economic changes altered the industrial and labor market structures, being influenced by shifting consumer preferences and technological innovation [22,23], resulting in the emergence of “surplus” labor [19]. Research suggests that there is a direct relationship between the amount of economic growth and the development of the labor market, specifically in terms of labor demand. Regions or nations with higher levels of economic development tend to have lower rates of hidden unemployment. Early studies on hidden unemployment mostly focused on determining how it happens and measuring it.
Agriculture is the first sector to be impacted and undergo economic transformation with economic development. Changes in the industrial structure alter the position of farmers in the labor market [17]. However, the released labor force often fails to secure alternative nonagricultural jobs that match its skill set [24,25], giving rise to hidden unemployment [26]. Hidden unemployment in agriculture can be categorized into five groups [15]: (1) Low nutritional and health levels: this category describes unrealized potential output per worker due to the low nutritional and health levels of the labor force [17,27,28]. (2) Insufficient motivation of cultivators: in this category, there is a low level of output per labor input due to the insufficient motivation of cultivators to maximize productivity [29]. (3) Low willingness to prioritize material income: this category highlights situations where a low willingness to prioritize material income over leisure results in a much lower labor supply than the full employment potential [29,30]. (4) Underutilization of factors: in cases of relatively fixed factor ratios, the supply of some factors exceeds demand, leading to their underutilization and subsequent unemployment [18,28,31,32]. (5) Highly seasonal agricultural patterns: this category involves highly seasonal agricultural patterns, leading to periods of labor being unused for months [17,33].
Presently, the research on hidden unemployment predominantly concentrates on traditional agriculture, with limited attention given to the forestry sector, particularly in the case of the Northeast State-owned Forest Areas. Building upon this gap, in this study, we aimed to analyze hidden unemployment in the Northeast State-owned Forest Areas, emphasizing labor productivity. The approach employed utilizes the Cobb–Douglas production function method for accurate calculations. Given that the transformation of the Northeast State-owned Forest Areas is an enduring and evolving process with changing focal points, a comprehensive exploration of its causes and contributions to transformation offers a theoretical foundation [34,35]. This foundation is essential for addressing hidden unemployment during different phases of transformation, with a focus on the later stages of development in the Northeast State-owned Forest Areas
3. Theoretical Analysis Framework and Research Strategy
3.1. Theoretical Analysis Framework
The administrative entities overseeing the Northeast State-owned Forest Areas in China consist of five forest industry groups: the Inner Mongolia Forest Industry Group, the Jilin Forest Industry Group, the Changbai Mountain Forest Industry Group, the Longjiang Forest Industry Group, and the Greater Khingan Mountains Forest Industry Group. These groups possess characteristics intrinsic to both government and enterprise entities. Functioning as “protectors of national forest resources”, “managers of state-owned enterprises”, and “administrative overseers for local government” [1], forest industry groups bear both social and enterprise responsibilities [3,6,7,8,10,36,37]. In their role as “the manager of state-owned enterprises”, forest industry groups optimally utilize existing capital investments and labor inputs to maximize enterprise utility. Simultaneously, as enterprises, they consider labor costs. The economic development of a forest industry group, as an enterprise unit, hinges on forestry resources. Therefore, the introduction of a series of ecological protection policies aims at promoting the Northeast State-owned Forest Areas transformation, and unveiling the mechanism behind the formation of hidden unemployment during the transitional period.
As an enterprise unit, a forest industry group relies on forestry resources for economic development. Therefore, when a series of ecological protection policies are introduced, it promotes its transformation, causing the gradual decline of the resource industry. This has significantly impacted the production and life of forest workers and generated a large number of “surplus” personnel. These “surplus” personnel are partly due to the asset restructuring and downsizing of the forest industry group and to the closure of related enterprises due to the shrinkage of the forest industry group, which is consistent with the emergence of surplus personnel in the first category of enterprises. However, due to the nature of the work of the forest industry group, personnel adjustments cannot be made according to market demand, resulting in surplus labor force. This article combines the research of domestic and foreign scholars on hidden unemployment (mainly referring to Felices, 2003), the study of “surplus” personnel in enterprises, and the special situation of the research object, the forest industry group. Hidden unemployment is defined in this article as follows: The forest industry group has undergone transformation in the face of policy implementation and institutional changes but fails to fully utilize the labor force it employed during the transformation process. A phenomenon where the actual demand for labor is smaller than the number of hired workers has emerged, and hidden unemployment is understood as a phased product caused by the institutional changes and transitional development of the Northeast State-owned Forest Areas.
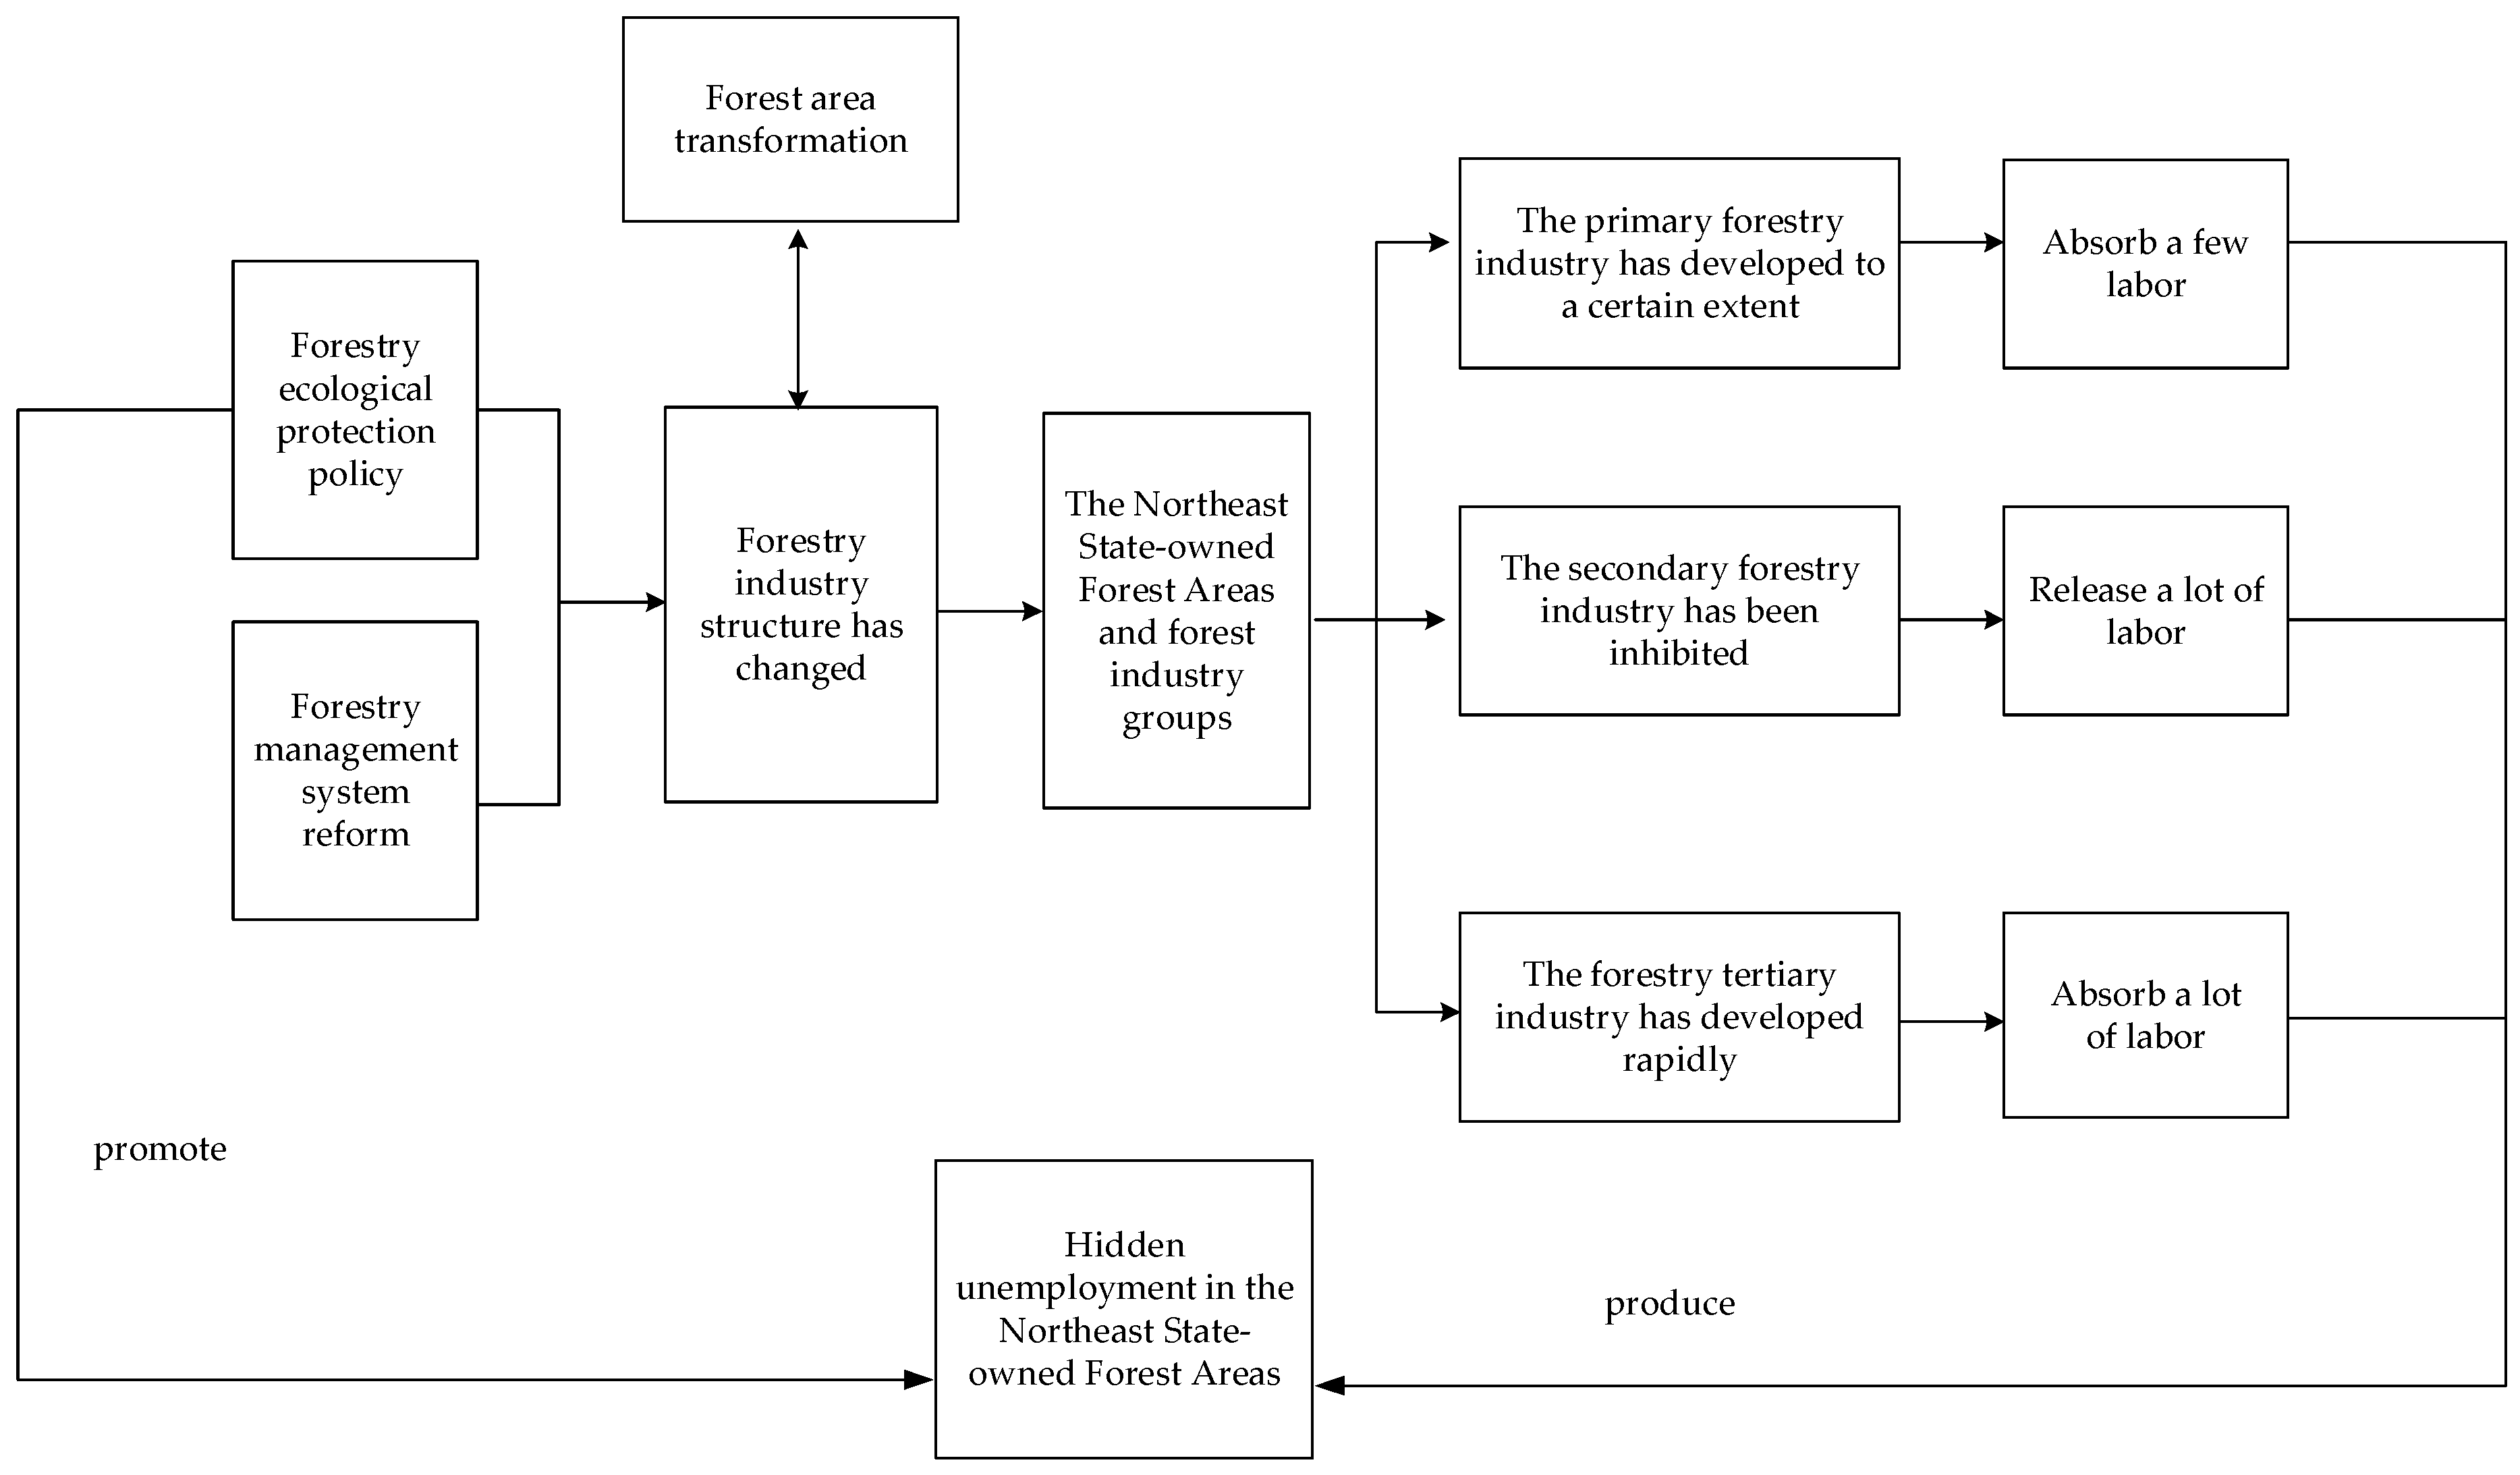
Based on the definition of hidden unemployment and the evolution of the forestry industry in the Northeast State-owned Forest Areas, we established the theoretical framework depicted in Figure 1. The forestry industry structure and forestry employment structure of the Northeast State-owned Forest Areas have undergone changes with the implementation of ecological policies (projects) such as comprehensive logging cessation, and hidden unemployment is seen as a result of the collision and uncoordinated development of these two subsystems. The sustainable development of forest economy must be based on the coordinated development of the forestry industry structure and forestry employment structure. In the process of forest transformation, the forestry industry structure changes first, and the forestry employment structure will then change according to the adjustment of the forestry industry structure, resulting in some surplus personnel. Under the dual effects of forest area transformation and the implementation of forestry ecological protection policies, the forestry industry structure of the forest industry group undergoes changes, which are then transmitted to the three forestry industries. This is reflected, to a certain extent, in the development of the primary forestry industry, which will absorb a small amount of labor force [34,35]. The primary forestry industry is mainly focused on forestry planting and nurturing. The implementation of ecological policies, including comprehensive logging cessation projects, spurs the growth of the primary forestry industry and heightens labor demand, albeit imposing a greater burden on the sector. However, the primary forestry industry is not a labor-intensive industry; so, the absorption of labor is limited. The development of the secondary forestry industry is suppressed, which, in turn, leads to the release of a significant portion of the labor force. The secondary forestry industry mainly focuses on forest logging and related manufacturing and processing, and it is a labor-intensive industry with a large number of laborers; the implementation of the comprehensive logging cessation policy has greatly curbed the development of the secondary forestry industry, thus releasing a large amount of the labor force. The tertiary forestry industry has developed rapidly due to an increasing emphasis on the ecological environment, especially on forest tourism, forest health, and understory planting. Correspondingly, as the leading industry, the tertiary forestry industry will absorb a large amount of labor. During this process, the structure of the forestry industry undergoes rapid changes, while the employment structure of the forestry industry does not. In the secondary forestry industry, manufacturing, as the leading industry in the forest industry group, generates a large number of “surplus” personnel, i.e., hidden unemployment. As forest reforms expand and the forestry industry transforms, hidden unemployment is expected to initially rise and then decline [38]. The specific process is shown in Figure 1.

Figure 1.
Formation mechanism of hidden unemployment in the Northeast State-owned Forest Areas.
3.2. Research Methods
This article explores the repercussions of ecological policies, engineering initiatives, and institutional reforms on the forest industry groups of the Northeast State-owned Forest Areas. Through the assessment of hidden unemployment, we formulate rational employment strategies for forest workers with the aim of fostering sustainable development in the region. On the basis of existing theoretical research, in this study, we initially scrutinize the impact mechanism of ecological policies on forest industry group employment, proposing relevant research hypotheses. Subsequently, employing the Cobb–Douglas production function method with available data, we calculate the number of hidden unemployed individuals and the hidden unemployment rate. Moreover, recognizing the multifaceted stimuli driving the transformation of the Northeast State-owned Forest Areas—including policies, systems, and market dynamics—we explore the relationship between this transformation and hidden unemployment through causal analysis and variance decomposition.
3.2.1. Estimation Method for the Hidden Unemployment Population
In this paper, the Cobb–Douglas production function is used to calculate the hidden unemployment level in the Northeast State-owned Forest Areas [39,40,41,42], the specific formula for which is as follows:
In Equation (1), Q represents the social output of the whole forest area; A indicates the technical level; K represents the physical capital stock; L denotes the amount of labor employed; t denotes time; and α and β denote the elasticity of capital and labor output, respectively. It is assumed that is the wage of forest employees, P is the comparable price, and the real wage of the labor force is wt/P. Under the condition of maximizing profit, when the effective labor supply in the forest area is , the amount of labor needed is L*, and the hidden unemployment rate is when the enterprise added value is Q. Further considering the human capital factor of the labor force [39,40,41,42], the production function can be expressed as follows:
In Equation (2), A0 represents the technical level and is a fixed value; ht represents the average human capital level of the labor force. The effective labor supply and the corresponding hidden unemployment rate can be calculated.
3.2.2. Analysis of Labor Force Heterogeneity
It is assumed that the individual efficiency and wage of the labor force in the employed population are given according to the proportion of their individual qualities, and the individual qualities x of the labor force obey the normal distribution of N (u, 1) (u represents the average quality level of the labor force, which should be large enough to ensure that almost all the individual qualities of the labor force are greater than zero). Assuming that the number of labor employment in t year is and the effective employment rate is ηt under the condition that there is no difference in labor quality, the corresponding hidden unemployment rate, or the total labor quality needed by the whole society, is (in fact, the total quality is equivalent to the amount of labor). When the quality of the labor force is heterogeneous and the high-quality labor force prioritizes the distribution of work, only the labor force with a quality greater than a receives work task arrangement, and the total quality, , provided by this part of the labor force should be equal to the total quality needed under the condition that there is no difference in the quality of the labor force, as follows:
Furthermore, the following formula can be obtained: . In this way, when ′ and u are known, the value of a can be obtained. Additionally, we can obtain the effective employment proportion ′, which corresponds to the hidden unemployment ′ and the hidden unemployed population ′.
3.2.3. Transformation Evaluation—Entropy Weight Method
The min–max standardization method is used to eliminate the influence of different units between index data, as follows [43,44,45]:
In Equation (4), the k indices x1, x2…, xk are given, where Xi = {x1, x2…, xk}. It is assumed that the standardized values of each index dataset are Y1, Y2, …Yk. Yli is the standardized datum of the i-th index in year l, and the weight of each evaluation index is calculated by the entropy weight law [43,44,45]. If the entropy of the i-th index is Ej in the model, the calculation formula of Ej is as follows:
In Formula (5), ; if , then . After calculating the information entropy of each index, the weight of each index is calculated. The specific formula is as follows:
According to Formula (6), the scoring formula of the economic transformation ability of the Northeast State-owned Forest Areas can be derived as follows:
In Equation (7), Zl is the final score of the transformation ability evaluation in year l for the Northeast State-owned Forest Areas; Yli is the standardized datum of year i in year l; and Wi is the entropy weight of the i-th index.
3.2.4. Panel Vector Autoregression Model
In this paper, the panel vector autoregression model is used to analyze the transformation impact of the Northeast State-owned Forest Areas on hidden unemployment [46,47,48]. The specific formula is as follows:
Here, is an endogenous variable that includes economic transformation, social transformation, economic transformation, and hidden unemployment in the Northeast State-owned Forest Areas; is the year; represents different regions; is the intercept; is the lag order; is the parameter matrix of lag order; is an individual fixed effect; is an individual point-in-time effect; and is a random perturbation term.
3.3. Data Sources and Descriptive Statistics
A vital aspect of calculating hidden unemployment in the Northeast State-owned Forest Areas lies in the meticulous handling of pertinent data. Consequently, after establishing the calculation and cause analysis methods for hidden unemployment, specific indices are selected. A descriptive analysis and rigorous treatment of these chosen indices are conducted to furnish the fundamental data for computing the hidden unemployment rate in the Northeast State-owned Forest Areas.
3.3.1. Data Sources
This paper categorizes the data sources for hidden unemployment in forest industry groups into two segments. (1) Elasticity coefficient estimation (2000–2010): In the initial part, the elasticity coefficients of labor output and human capital output are estimated using forest industry group data from 2000 to 2010. This period was chosen for two reasons: In 2000–2010, forest industry groups experienced stable economic, social, and ecological development, with high-quality forest resources. This stability aligns well with the Cobb–Douglas production function, rendering the elasticity coefficients of labor output and human capital output more accurate. Since 2010, the robust implementation of ecological protection policies and forest management reforms has impacted the economic development of forest areas. Substantial changes in forestry industrial and employment structures occurred during this period, marking a crucial timeframe for the emergence of hidden unemployment in forest industry groups. Thus, the elasticity coefficients estimated from 2000 to 2010 provide more accurate insights. (2) Hidden unemployment rate estimation (2011–2020): The second part utilizes forest industry group data from 2011 to 2020 to estimate the hidden unemployment rate [17,19,20,38,49,50]. This timeframe encapsulates a significant period during which forest industry groups underwent hidden unemployment production. The definition of variables of hidden unemployment is showed as Table 1.

Table 1.
Definition of variables.
3.3.2. Descriptive Statistics
The basic data of the elasticity coefficient of labor output of the Northeast State-owned Forest Areas from 2000 to 2010 are shown in Table 2.
Table 2.
Sample data for the elasticity coefficient estimation of labor output of the Northeast State-owned Forest Areas.
According to Table 2, from 1999 to 2010, the Longjiang Forest Industry Group exhibited the highest added value among the enterprises, at CNY 321.495 billion, while the Jilin Forest Industry Group recorded the lowest, at CNY 12.8931 billion. The Longjiang Forest Industry Group had the highest year-end employee count, with 302,779 people, whereas the Jilin Forest Industry Group had the lowest, with 20,839 people. The Longjiang Forest Industry Group’s capital stock reached its pinnacle at CNY 125.3978 billion, while the Changbai Mountain Forest Industry Group reported the lowest capital stock at CNY 7.5184 billion. The human capital stock varied, with the highest observed for the Longjiang Forest Industry Group at CNY 6,454,300 and the lowest observed for the Jilin Forest Industry Group at CNY 30,200. In terms of the average wage, the Longjiang Forest Industry Group ranked highest at CNY 229.5672 million, while the Jilin Forest Industry Group had the lowest at CNY 21.0212 million.
Table 3 shows that between 2011 and 2020, the Longjiang Forest Industry Group recorded CNY 607.290 billion in enterprise added value, while the Changbai Mountain Forest Industry Group reported only CNY 34.8564 billion. With 240,035 employees at the year’s end, the Longjiang Forest Industry Group had the largest workforce, while the Jilin Forest Industry Group had the smallest, with 16,826 employees. The Longjiang Forest Industry Group had the greatest average wage of CNY 533,540, while the Jilin Forest Industry Group had the lowest at CNY 54,460.
Table 3.
Sample data for hidden unemployment estimation of the Northeast State-owned Forest Areas from 2011 to 2020.
We selected indicators that are relevant to the transformation of the Northeast State-owned Forest Areas based on scientific rigor, practicality, comprehensiveness, representativeness, operability, and data availability. The indicators selected originate from well-established frameworks, including the modern forestry development index system [51,52,53,54,55,56], economic transformation index system [57,58,59], resource-based city transformation ability index system [60,61,62], and transformation index system of state-owned forest areas [3,6,7,8,10,36,37,63], as suggested by several scholars. The indicators are organized based on three characteristics that reflect the capacity of state-owned forestlands to undergo change. In addition, this article utilizes entropy weight methodology to determine the weights of economic transformation, social transformation, and ecological transformation indicators for the Northeast State-owned Forest Areas. The analysis covers the period from 2011 to 2020, and the specific findings are reported in Table 4.
Table 4.
Sample data of cause analysis of hidden unemployment in the Northeast State-owned Forest Areas from 2011 to 2020.
4. Empirical Results
The preceding theoretical analysis, model configuration, and data compilation are used to estimate the elasticity coefficient of labor output for the Northeast State-owned Forest Areas. Subsequently, the hidden unemployment number and hidden unemployment rate of the Northeast State-owned Forest Areas from 2011 to 2020 are computed. Expanding on this, this study incorporates the heterogeneity of the entire labor force, calculating the rate of hidden unemployment within the context of labor force heterogeneity. Finally, this research delves into the analysis of the causes of hidden unemployment and evaluates the contribution of transformation measures at different levels.
4.1. Hidden Unemployment Calculation Results
4.1.1. Labor Heterogeneity
Utilizing microscopic data from reform monitoring of the Northeast State-owned Forest Areas, this study employs comprehensive indicators based on the age, years of education, and physical health of forestry employees’ families. These indicators are treated as normal distribution functions, and their μ (mean) value is determined. The results are shown in Table 5:
Table 5.
Test of normal distribution results.
4.1.2. Hidden Unemployment Outcomes
Employing panel data from the China Forestry and Grassland Statistical Yearbook spanning from 2000 to 2010, this study separately estimates the output elasticity of the labor force and human capital for the Northeast State-owned Forest Areas. The regression results are presented in Table 6.
Table 6.
Logarithmic regression results of the two production functions.
By integrating the above formula and regression results, we derive the hidden unemployment rate under four distinct scenarios: considering the labor force and labor force homogeneity, considering the labor force and labor force heterogeneity, considering human capital and labor force homogeneity, and considering human capital and labor force heterogeneity.
Table 7 reveals that under these four conditions, the hidden unemployment rate of the Northeast State-owned Forest Areas exhibits a similar change trend. However, the values of the hidden unemployment rate differ, highlighting two key observations. First, when employing the production function calculation, the hidden unemployment rate calculated considering only the labor force is greater than that calculated considering human capital. Second, under the condition of a homogeneous labor force, the hidden unemployment rate of the Northeast State-owned Forest Areas is lower than that under the condition of a heterogeneous labor force. The former discrepancy arises from the fact that the elasticity coefficient of human capital output is greater than that of labor output when human capital is considered. The latter disparity occurs because under the condition of labor force heterogeneity, a high-quality labor force can secure work tasks first, reducing the demand for the labor force in terms of quantity. In reality, differences in labor quality and human capital have an objective influence. Consequently, the hidden unemployment rate calculated under the fourth case (considering human capital and the heterogeneous labor force) is deemed more reasonable [20,36,37,38,40,41,42].
Table 7.
Comparison of the hidden unemployment rate results for four different scenarios in the Northeast State-owned Forest Areas.
The four estimates of hidden unemployment in forest areas align closely. From 2011 to 2020, the hidden unemployment rates in the Northeast State-owned Forest Areas remained consistent between 30% and 45%. The lowest hidden unemployment rate was recorded in 2011 at 24.712% (considering the labor force and heterogeneous labor force), while the highest rate occurred in 2015, reaching 49.559% (considering human capital and the homogeneous labor force). Among the specific forest industry groups, the Inner Mongolia Forest Industry Group exhibited hidden unemployment rates ranging from 30% to 50%, with the lowest rate occurring in 2011, at 11.003% (considering the labor force and heterogeneous labor force), and the highest occurring in 2017, at 49.877% (considering human capital and the homogeneous labor force).
The hidden unemployment rates of the Jilin Forest Industry Group fell between 33% and 45%, reaching their lowest point in 2013, at 10.036% (considering the labor force and heterogeneous labor force), and their highest in 2018, at 43.159% (considering human capital and homogeneous labor force), averaging 23.322%. The Changbai Mountain Forest Industry Group’s hidden unemployment rates were generally between 30% and 45%, with the lowest recorded in 2012 at 12.582% (considering the labor force and heterogeneous labor force) and the highest in 2019 at 46.754% (considering human capital and homogeneous labor force), averaging 27.655%.
The Longjiang Forest Industry Group exhibited hidden unemployment rates ranging from 20% to 60%, with the lowest rate recorded in 2011, at 20.176% (considering the labor force and heterogeneous labor force), and the highest in 2012, at 48.893% (considering human capital and the homogeneous labor force). The hidden unemployment rates of the Greater Khingan Mountains Forest Industry Group hovered between 30% and 50%, with the lowest rate observed in 2014, at 12.161% (considering the labor force and heterogeneous labor force), and the highest, at 48.973% (considering human capital and homogeneous labor force), in 2018. Overall, the hidden unemployment rates of the Northeast State-owned Forest Areas have shown an upward trend.
The hidden unemployment rate of the five forest industry groups was generally on the rise, especially after 2015. Ecological functional zones in the Xing’an Mountains and Xiaoxing’an Mountains implemented by the government in 2010 made the ecological protection of the Northeast State-owned Forest Areas a priority, suppressing the development of logging-related mining and processing industries, and hidden unemployment gradually increased. The comprehensive logging cessation policy implemented in 2015 further stunted the leading industry of the forest industry group, hindering the effective utilization of labor previously engaged in logging-related activities. At present, forest industry groups are in their nascent stages of transformation, struggling to adapt their workforce to the evolving industry landscape, leading to a surge in hidden unemployment. Among these groups, the Jilin Forest Industry Group boasts the lowest hidden unemployment rate due to its distinct operational model. It operates as an enterprise rather than a government entity, undergoing early restructuring and long-term market adaptation. Thus, the Changbai Mountain Forest Industry Group, which separated from the Jilin Forest Industry Group in 2013, faced challenges in swiftly adjusting to market and policy changes, resulting in significant hidden unemployment. Similarly, the Inner Mongolia Forest Industry Group, the Longjiang Forest Industry Group, and the Greater Khingan Mountains Forest Industry Group, all government run, have encountered greater challenges in the context of institutional reforms and forestry transformation compared to the Jilin Forestry Industry Group.
4.2. The Causes of Hidden Unemployment Analysis
This article explored the relationship between implicit unemployment and transformation in state-owned forest areas in Northeast China, and the data used have passed the test. Then, this paper delved into the relationship between the transformation and hidden unemployment of the Northeast State-owned Forest Areas through a Granger causality test. The specific results are presented in Table 8.
Table 8.
Results of the Granger causality test.
Analyzing the outcomes from Table 8, it is evident that when the explanatory variables include hidden unemployment and when the explained variables include economic transformation, social transformation, and ecological transformation in the Northeast State-owned Forest Areas, the ecological transformation exacerbates hidden unemployment. This contradicts the initial hypothesis that ecological transformation is not a cause of hidden unemployment. Conversely, when the explanatory variables are economic transformation, social transformation, and ecological transformation, and the explained variable is hidden unemployment, hidden unemployment promotes economic transformation and ecological transformation in the Northeast State-owned Forest Areas. This goes against the notion that hidden unemployment is not a cause of economic transformation or ecological transformation.
In summary, there is a bidirectional causal relationship between ecological transformation and hidden unemployment in the Northeast State-owned Forest Areas. Simultaneously, there is a unidirectional cause-and-effect relationship between hidden unemployment and economic transformation in the Northeast State-owned Forest Areas. This phenomenon arises because climate change and the deterioration of forestry resources necessitate transformation in the Northeast State-owned Forest Areas. This transformation leads to changes in the forestry industrial structure, but the alteration in the employment structure occurs gradually, and the unique employment system contributes to the emergence of hidden unemployment in the Northeast State-owned Forest Areas. The emergence of hidden unemployment promotes economic transformation and labor diversion in the Northeast State-owned Forest Areas. Throughout this process, the focus is on ecological construction shifts, influencing the transformation of the ecological employment structure in the Northeast State-owned Forest Areas.
By analyzing the impact of variables at various transformation levels on the degree of hidden unemployment in the Northeast State-owned Forest Areas, deeper insights into the variations in the degree of contribution of hidden unemployment at different levels can be gained. This understanding can assist in formulating policies to address the issue of hidden unemployment in the Northeast State-owned Forest Areas in the future. The specific results of the predicted variance decomposition are shown in Table 9.
Table 9.
Predictive variance decomposition results for hidden unemployment in the Northeast State-owned Forest Areas during the transformations.
Table 9 shows that in the last ten forecasted periods, economic transformation, social transformation, and ecological transformation impacted hidden unemployment in the Northeast State-owned Forest Areas. However, the degree of this impact varied over time. Notably, the impact of economic and ecological transformations on hidden unemployment initially increased and then declined, while the impact of social transformation gradually rose. Furthermore, social transformation in the Northeast State-owned Forest Areas had the largest contribution to hidden unemployment, averaging 49.619. This was followed by economic transformation, with an average contribution rate of 16.866, and ecological transformation, with an average contribution of 7.347.
As the ecological transformation of the Northeast State-owned Forest Areas gradually stabilizes, the future employment structure may not undergo significant changes. However, the region still needs to develop further, necessitating a shift in its economic structure. With economic transformation, the employment structure will also change, requiring the redirection of hidden unemployment. Simultaneously, challenges such as the placement of a surplus labor force and social security need to be addressed. Therefore, the most substantial contribution to hidden unemployment in the later period comes from the social transformation of the Northeast State-owned Forest Areas.
5. Conclusions and Implications
During the Northeast State-owned Forest Areas’ transformation and institutional reform, there has been a phenomenon wherein the labor force employed during the transformation process is not fully utilized, resulting in the actual demand for labor being lower than the number of employed workers. The implementation of the current comprehensive logging ban policy led to significant changes in the management mode of the forest industry groups, further exacerbating the hidden unemployment level within the group. Forest industry groups are not only legal entities of economic organizations but also exercise forest resource supervision and management functions on behalf of the country. They also have management functions when it comes to social and administrative affairs in forest areas under their jurisdiction [6,7,8]. The unique corporate structure and management system of the Northeast State-owned Forest Areas pose challenges in adapting the labor force to market shifts, leading to hidden unemployment. This, in turn, diminishes the production efficiency of forest industry groups and drives up costs. Studying hidden unemployment in these areas can expedite reform within forest industry groups and enhance their ability to respond to market changes, fostering a fairer and more competitive labor market environment.
This study began by estimating the output elasticity of hidden unemployment labor force and human capital using panel data from the China Forestry and Grassland Statistical Yearbook spanning from 2000 to 2010. Leveraging microscopic data from reform monitoring in the Northeast State-owned Forest Areas and considering labor force heterogeneity, four hidden unemployment rates for the region were estimated from 2011 to 2020. The hidden unemployment rate was found to initially rise and then decline over time. To analyze the causes of hidden unemployment in the Northeast State-owned Forest Areas, a Granger causality test was employed to examine the causal relationships between economic transformation, social transformation, ecological transformation, and hidden unemployment in the region. The findings reveal a two-way cause-and-effect relationship between ecological transformation and hidden unemployment and a one-way cause-and-effect relationship between economic transformation and hidden unemployment in the Northeast State-owned Forest Areas. In the variance decomposition analysis, social transformation emerged as the most influential factor predicting hidden unemployment, followed by economic transformation, with ecological transformation exerting the smallest impact.
The Northeast State-owned Forest Areas have undergone extensive reforms and industrial transformations. However, this has resulted in a mismatch between the forestry industry and employment patterns, leading to hidden unemployment and impeding sustainable progress in the region. This study investigated the current status, underlying causes, and extent of hidden unemployment in the Northeast State-owned Forest Areas. It also explored the intricate relationship between transformation efforts and hidden unemployment, as well as the varied impacts of different levels of change on hidden unemployment in subsequent stages. These findings offer insights into how hidden unemployment can be addressed and how vital reform measures can be implemented for different phases of development in the Northeast State-owned Forest Areas. However, it is important to note that this paper’s analysis of the origins of hidden unemployment was limited to broad changes, without delving into specific influencing factors. Additionally, a more comprehensive analysis of the subsequent reform trajectory, including decisions regarding industrial and employment structure transformation, is necessary.
This article provides policy insights by examining the evolving impacts of economic, ecological, and social transformations on hidden unemployment in the Northeast State-owned Forest Areas. The emergence of hidden unemployment has altered the outcomes of economic, ecological, and social changes. Currently, social and economic changes have significant effects and make substantial contributions, warranting focused attention on these areas. Strategic planning is crucial for the economic development of the forestry industry. This involves establishing comprehensive strategies, developing specific forest-related industries, optimizing forest product utilization, creating integrated industrial clusters to expand the tertiary forestry sector, and forming new clusters within the tertiary industry to absorb excess labor.
Addressing surplus labor on a societal level can be achieved by providing vocational training to young individuals and facilitating their transition to reemployment through investment in new sectors, legislative support, and skill development. Prioritizing social security reform for the aging surplus labor force through forest system reforms, government activity divestiture, and successful reintegration of aged surplus laborers into society is essential. Implementing social security reforms in forest areas should entail adjusting contribution ratios, expanding coverage, and ensuring the sustainability of forest areas. Moreover, revising forestry laws from an ecological standpoint is necessary, focusing on forestry tending, management, conservation, and projecting future resources. Providing technical training to surplus laborers can enhance labor security in future forest resource management efforts.
Author Contributions
Conceptualization, C.W., J.C. and J.W.; formal analysis, C.W., J.C. and J.W.; methodology, C.W., J.C. and J.W.; original manuscript draft, C.W. and J.C.; writing—review and editing, C.W., J.C. and J.W. All authors have read and agreed to the published version of the manuscript.
Funding
This research was primarily funded by the China Social Science Foundation, grant number 21BJY013 and Shanghai Philosophy and Social Science Foundation, grant number 2020BJB017.
Institutional Review Board Statement
Not applicable.
Informed Consent Statement
Informed consent was obtained from all the subjects involved in this study.
Data Availability Statement
Data available on request due to restrictions.
Acknowledgments
The authors thank the anonymous reviewers for helping to improve the quality of this article.
Conflicts of Interest
The authors declare no conflicts of interest.
References
- Su, H.; Zheng, H.; Giessen, L. Policy forum: Challenges and ways forward in implementing “a guide on sustainable overseas forest management and utilization by Chinese enterprises”. For. Policy Econ. 2019, 102, 114–118. [Google Scholar] [CrossRef]
- Zhang, Q.; Cheng, B.; Diao, G.; Tao, C.; Wang, C. Does China’s natural forest logging ban affect the stability of the timber import trade network? For. Policy Econ. 2023, 152, 102974. [Google Scholar] [CrossRef]
- Yang, H.; Yuan, T.; Zhang, X.; Li, S. A Decade Trend of Total Factor Productivity of Key State-Owned Forestry Enterprises in China. Forests 2016, 7, 5–97. [Google Scholar] [CrossRef]
- Zhao, J.; Liu, J.; Giessen, L. How China adopted eco-friendly forest development: Lens of the dual-track mechanism. For. Policy Econ. 2023, 149, 102931. [Google Scholar] [CrossRef]
- Zhang, P.; Zhao, J.; Krott, M. Strictest nature conservation: China’s national park policy underpinned by power shift and turf dynamic. For. Policy Econ. 2023, 54, 103033. [Google Scholar] [CrossRef]
- Wu, Z. Study on the Countermeasures of Rebuilding the Relationship between Government and Enterprises in State-owned Forest Industry Enterprises. World For. Res. 2004, 6, 60–64. (In Chinese) [Google Scholar]
- Wei, Y.; Jiang, M. Exploration on the management system reform of key state-owned forest areas in Northeast China and Inner Mongolia. J. For. Sci. 2005, 41, 163–168. (In Chinese) [Google Scholar]
- Geng, Y.; Wu, Z.; Wei, L. Research on the reform progress and policy of state-owned forest areas-taking Longjiang Forest Industry Group and Daxinganling Forestry Group as examples. J. For. Econ. 2017, 39, 3–11. (In Chinese) [Google Scholar]
- Aguilar, F.X.; Wen, Y. Socio-economic and ecological impacts of China’s forest sector policies. For. Policy Econ. 2021, 127, 102454. [Google Scholar] [CrossRef]
- Jiang, Y.; Su, H. The Status, Trend, and Global Position of China’s Forestry Industry: An Anatomy Based on the Global Value Chain Paradigm. Forests 2023, 14, 102040. [Google Scholar] [CrossRef]
- Long, H.; de Jong, W.; Yiwen, Z.; Liu, J. Institutional choices between private management and user group management during forest devolution: A case study of forest allocation in China. For. Policy Econ. 2021, 132, 102586. [Google Scholar] [CrossRef]
- Zhang, Y.; Zhang, T.; Zeng, Y.; Cheng, B.; Li, H. Designating National Forest Cities in China: Does the policy improve the urban living environment? For. Policy Econ. 2021, 125, 102400. [Google Scholar] [CrossRef]
- Ma, B.; Zhang, Y.; Huang, Y.; Wen, Y. Socioeconomic and ecological direct and spillover effects of China’s giant panda nature reserves. For. Policy Econ. 2020, 121, 102313. [Google Scholar] [CrossRef]
- He, W.; Cheng, Y.; Lin, Y.; Zhang, H. Microeconomic effects of designating National Forest Cities: Evidence from China’s publicly traded manufacturing companies. For. Policy Econ. 2022, 136, 102669. [Google Scholar] [CrossRef]
- Rosenstein-Rodan, P.N. Europe Versus America: Implications of the “New Order”. Int. Aff. Rev. Suppl. 1942, 19, 555–556. [Google Scholar] [CrossRef]
- Lewis, W.A. Economic Development with Unlimited Supplies of Labor. Manch. Sch. Econ. Soc. Stud. 1954, 22, 139–191. [Google Scholar] [CrossRef]
- Farmer, B.H.; Yong, S.C. ‘Disguised Unemployment’ in Underdeveloped Areas with Special Reference to South Korean Agriculture; University of California Press: Berkeley, CA, USA; Los Angeles, CA, USA, 1963; pp. 6–163. [Google Scholar]
- Mathur, A. The anatomy of disguised unemployment. Oxf. Econ. Pap. 1964, 16, 161–193. [Google Scholar] [CrossRef]
- Fei, J.H.; Ranis, G. Development of the Labor Surplus Economy: Theory and Policy. Econ. J. 1967, 77, 480–482. [Google Scholar]
- Feld, L.P.; Kirchgässner, G. Official and hidden unemployment and the popularity of the government: An econometric analysis for the Kohl government. Elect. Stud. 2000, 19, 333–347. [Google Scholar] [CrossRef]
- Simonova, M.; Lyachenkov, Y.; Kostikova, E. Regional Labor Market: Supply and Demand in the Context of Digitalization; Springer: Cham, Switzerland; New York, NY, USA, 2021. [Google Scholar]
- Pastuszka, S.; Skrzypek, J. Convergence or Divergence of Italian Regions? Gospod. Nar. 2017, 288, 101–130. [Google Scholar] [CrossRef]
- Berveno, O.V.; Yurchenko, L.S. The Main Directions of the Employment Promotion Policy in the Conditions of Economy Digitalization. Probl. Econ. 2020, 4, 351–356. [Google Scholar] [CrossRef]
- Tsaurkubule, Z.L.; Mahmudova, J.A. Socio-economic problems and disparities of the Latvian labor market. Sotsiologicheskie Issled. 2017, 10, 133–140. [Google Scholar]
- Koodziejczak, W. An Attempt to Assess the Scale of Hidden Unemployment in Polish Agriculture in 2017. J. Agric. Rural Dev. 2018, 50, 395–401. [Google Scholar] [CrossRef]
- Koodziejczak, W. Hidden Unemployment in Polish Agriculture in 2005–2018—A Simulation of the Scale of the Problem. Rocz. Nauk. Stowarzyszenia Ekon. Rol. I Agrobiznesu 2020, XXII, 170–180. [Google Scholar] [CrossRef]
- Leibenstein, H. The Theory of Underemployment in Backward, Economies. J. Political Econ. 1957, 65, 91–103. [Google Scholar] [CrossRef]
- Mazumdar, D. The Marginal Productivity Theory of Wages and Disguised Unemployment. Rev. Econ. Stud. 1959, 26, 190–197. [Google Scholar] [CrossRef]
- Jasny, N.; Moore, W.E. Economic demography of eastern and southern Europe. J. Farm Econ. 1946, 28, 871–892. [Google Scholar] [CrossRef]
- Rottenberg, S. Income and Leisure in an Underdeveloped Economy. J. Political Econ. 1952, 60, 95–101. [Google Scholar] [CrossRef]
- Eckaus, R.S. The Factor Proportions Problem in Underdeveloped Areas. Am. Econ. Rev. 1945, 45, 539–565. [Google Scholar]
- Foster, A.D.; Rosenzweig, M.R. Is There Surplus Labor in Rural India? Working Papers; Yale University, Department of Economics: New Haven, CT, USA, 2010; p. 85. [Google Scholar]
- Himes, N.E. The population problem in Egypt. A study of population trends and conditions in modern Egypt. Eugen. Rev. 1938, 30, 66. [Google Scholar]
- Li, Z.; Xiao, J.; Lu, G.; Sun, W.; Ma, C.; Jin, Y. Productivity and profitability of Larix principis-rupprechtii and Pinus tabuliformis plantation forests in Northeast China. For. Policy Econ. 2020, 121, 102314. [Google Scholar] [CrossRef]
- Nathan, I.; Chen, J.; Hansen, C.P.; Xu, B.; Li, Y. Facing the complexities of the global timber trade regime: How do Chinese wood enterprises respond to international legality verification requirements, and what are the implications for regime effectiveness? For. Policy Econ. 2018, 92, 169–180. [Google Scholar] [CrossRef]
- Cao, J.; Wang, Y.; Cao, B.; Li, J. Calculation of hidden unemployment in Jilin Forest Industry Group and analysis of its influencing factors-based on the perspective of production function. For. Econ. 2022, 44, 17–33. [Google Scholar]
- Cao, J.; Wang, Y.; Chen, H. Causes and impacts of hidden unemployment in key state-owned forest areas in China. World For. Res. 2020, 35, 124–129. (In Chinese) [Google Scholar]
- Yuan, Z.; Lu, M. Hidden Unemployment Theory; Lixin Accounting Publishing House: Shanghai, China, 1998. (In Chinese) [Google Scholar]
- Zhao, K.; Wu, Y.; Kuang, Z. Dynamic evolution and impact mechanism of human capital mismatch in strategic emerging industries: Evidence from the Yangtze River Delta region of China. Heliyon 2023, 9, e21684. [Google Scholar] [CrossRef]
- Liu, H.; Liao, Z. Study on the influence mechanism of learning-application matching of graduates from private institutions: Based on human capital and family capital perspectives. Heliyon 2023, 9, e22077. [Google Scholar] [CrossRef]
- Zhang, Y.; Li, S.; Wang, X.; Wu, W. Research on human capital and energy development caused by decarbonization. Renew. Sustain. Energy Rev. 2023, 187, 113720. [Google Scholar] [CrossRef]
- Bosi, S.; Camacho, C.; Ha-Huy, T. Balanced growth and degrowth with human capital. Econ. Lett. 2023, 232, 111348. [Google Scholar] [CrossRef]
- Zhai, S.; Li, G.; Wu, G.; Hou, M.; Jia, Q. Cooperative task allocation for multi heterogeneous aerial vehicles using particle swarm optimization algorithm and entropy weight method. Appl. Soft Comput. 2023, 148, 110918. [Google Scholar] [CrossRef]
- Han, G.; Feng, G.; Chen, C.; Pan, C.; Zhou, W. Evaluation of the ventilation mode in an ISO class 6 electronic cleanroom by the AHP-entropy weight method. Energy 2023, 284, 128586. [Google Scholar] [CrossRef]
- Yang, B.; Wu, X.; Hao, J.; Xu, D.; Liu, T.; Xie, Q. Estimation of wood failure percentage under shear stress in bamboo-wood composite bonded by adhesive using a deep learning and entropy weight method. Ind. Crops Prod. 2023, 197, 116617. [Google Scholar] [CrossRef]
- Poh, S.C.; Siong, H.L.; Irwan, T.; Jamal, W.; Sylviana, M.D.; Bruno, S.S. Dynamic linkages among transparency, income inequality and economic growth in developing countries: Evidence from panel vector autoregressive (PVAR) model. Res. Int. Bus. Financ. 2022, 69, 101599. [Google Scholar]
- Wang, M.; Zhang, H.; Zhang, M. Industrial Structure Servitization, Financial Structure Marketization and Economic Growth—Based on PVAR Model. Procedia Comput. Sci. 2023, 221, 1432–1439. [Google Scholar] [CrossRef]
- Emad, K.; José, A.F.; Matheus, K.; Mohammad, T.A.I. Relationship between the share of renewable electricity consumption, economic complexity, financial development, and oil prices: A two-step club convergence and PVAR model approach. Int. Econ. 2023, 173, 260–275. [Google Scholar]
- Errington, A. Disguised unemployment in British agriculture. J. Rural Stud. 1988, 4, 1–7. [Google Scholar] [CrossRef]
- Cao, J.; Wang, Y.; Chen, H. Evaluation and difference analysis of transformation ability of forest industry groups in the key state-owned forest areas. J. Agric. For. Econ. Manag. 2020, 19, 77–86. (In Chinese) [Google Scholar]
- Šálka, J.; Longauer, R.; Lacko, M. The effects of property transformation on forestry entrepreneurship and innovation in the context of Slovakia. For. Policy Econ. 2006, 8, 716–724. [Google Scholar] [CrossRef]
- Arne, P. Transformation to continuous cover forestry in a changing environment. For. Ecol. Manag. 2006, 224, 227–228. [Google Scholar] [CrossRef]
- Jin, M.; Chen, N.; Wang, S.; Cao, F. Does forestry industry integration promote total factor productivity of forestry industry? Evidence from China. J. Clean. Prod. 2023, 415, 137767. [Google Scholar] [CrossRef]
- Lippe, R.S.; Luna, T.O.; Katajamäki, W.; Jörg, S. Labor informality in forestry: A longitudinal (2009–2020) cross-country analysis of determinants in 70 developing countries. For. Policy Econ. 2023, 156, 103056. [Google Scholar] [CrossRef]
- Bishnu, H.P.; Dil, B.K.; Dinesh, P.; Kristina, M.; Sanjaya, K. Examining Forest transition and collective action in Nepal’s community forestry. Land Use Policy 2023, 134, 106872. [Google Scholar]
- Kristina, J.; Maria, J.; Elias, A. All talk and no action? Making change and negotiating gender equality in Swedish forestry. For. Policy Econ. 2023, 154, 103013. [Google Scholar]
- Zhang, Y.; Zhao, F.; Zhang, J.; Wang, Z. Fluctuation in the transformation of economic development and the coupling mechanism with the environmental quality of resource-based cities—A case study of Northeast China. Resour. Policy 2021, 72, 102128. [Google Scholar] [CrossRef]
- Samin, A.M.; Ali, B.; Ali, R.M.B. Reducing vulnerability to the climate change—Reversibility and transformation adopting in a hydro-economic model. Environ. Dev. 2023, 47, 100893. [Google Scholar]
- Weronika, D.; Aleksandra, Z. The spatial dimension of coal phase-out: Exploring economic transformation and city pathways in Poland. Energy Res. Soc. Sci. 2023, 99, 103058. [Google Scholar]
- Zhou, J.; Zhang, Z.; Xu, X.; Chang, D. Does the transformation of resource-dependent cities promote the realization of the carbon-peaking goal? An analysis based on typical resource-dependent city clusters in China. J. Clean. Prod. 2022, 365, 132731. [Google Scholar] [CrossRef]
- He, T.; Song, H.; Chen, W. Recognizing the transformation characteristics of resource-based cities using night-time light remote sensing data: Evidence from 126 cities in China. Resour. Policy 2023, 85 Pt A, 104013. [Google Scholar] [CrossRef]
- Wang, Z.; Fu, H.; Zhou, L. Multiple urban resilience evaluation of resource-based cities’ sustainable transformation effect Resources. Conserv. Recycl. 2023, 191, 106912. [Google Scholar] [CrossRef]
- Chen, Y.; Ji, X. The evaluation of the synergetic degree of ecology economy society system of China forestry during the last decade. J. Sustain. For. 2017, 36, 2822–2828. [Google Scholar] [CrossRef]
Disclaimer/Publisher’s Note: The statements, opinions and data contained in all publications are solely those of the individual author(s) and contributor(s) and not of MDPI and/or the editor(s). MDPI and/or the editor(s) disclaim responsibility for any injury to people or property resulting from any ideas, methods, instructions or products referred to in the content. |
© 2024 by the authors. Licensee MDPI, Basel, Switzerland. This article is an open access article distributed under the terms and conditions of the Creative Commons Attribution (CC BY) license (https://creativecommons.org/licenses/by/4.0/).