
The Probability of Ship Collision during the Fully Submerged Towing Process of Floating Offshore Wind Turbines


Abstract
1. Introduction
- The towing process establishes a flexible connection between FOWTs and tugboats, implying that the relevant operations of the towing vessel cannot rigidly transmit to the FOWTs. Consequently, the motion of FOWTs is uncontrolled and primarily governed by inertia and resistance. In contrast, the transportation form provided by engineering vessels does not encounter such concerns as all components are on the engineering vessel and can be considered integral to the hull.
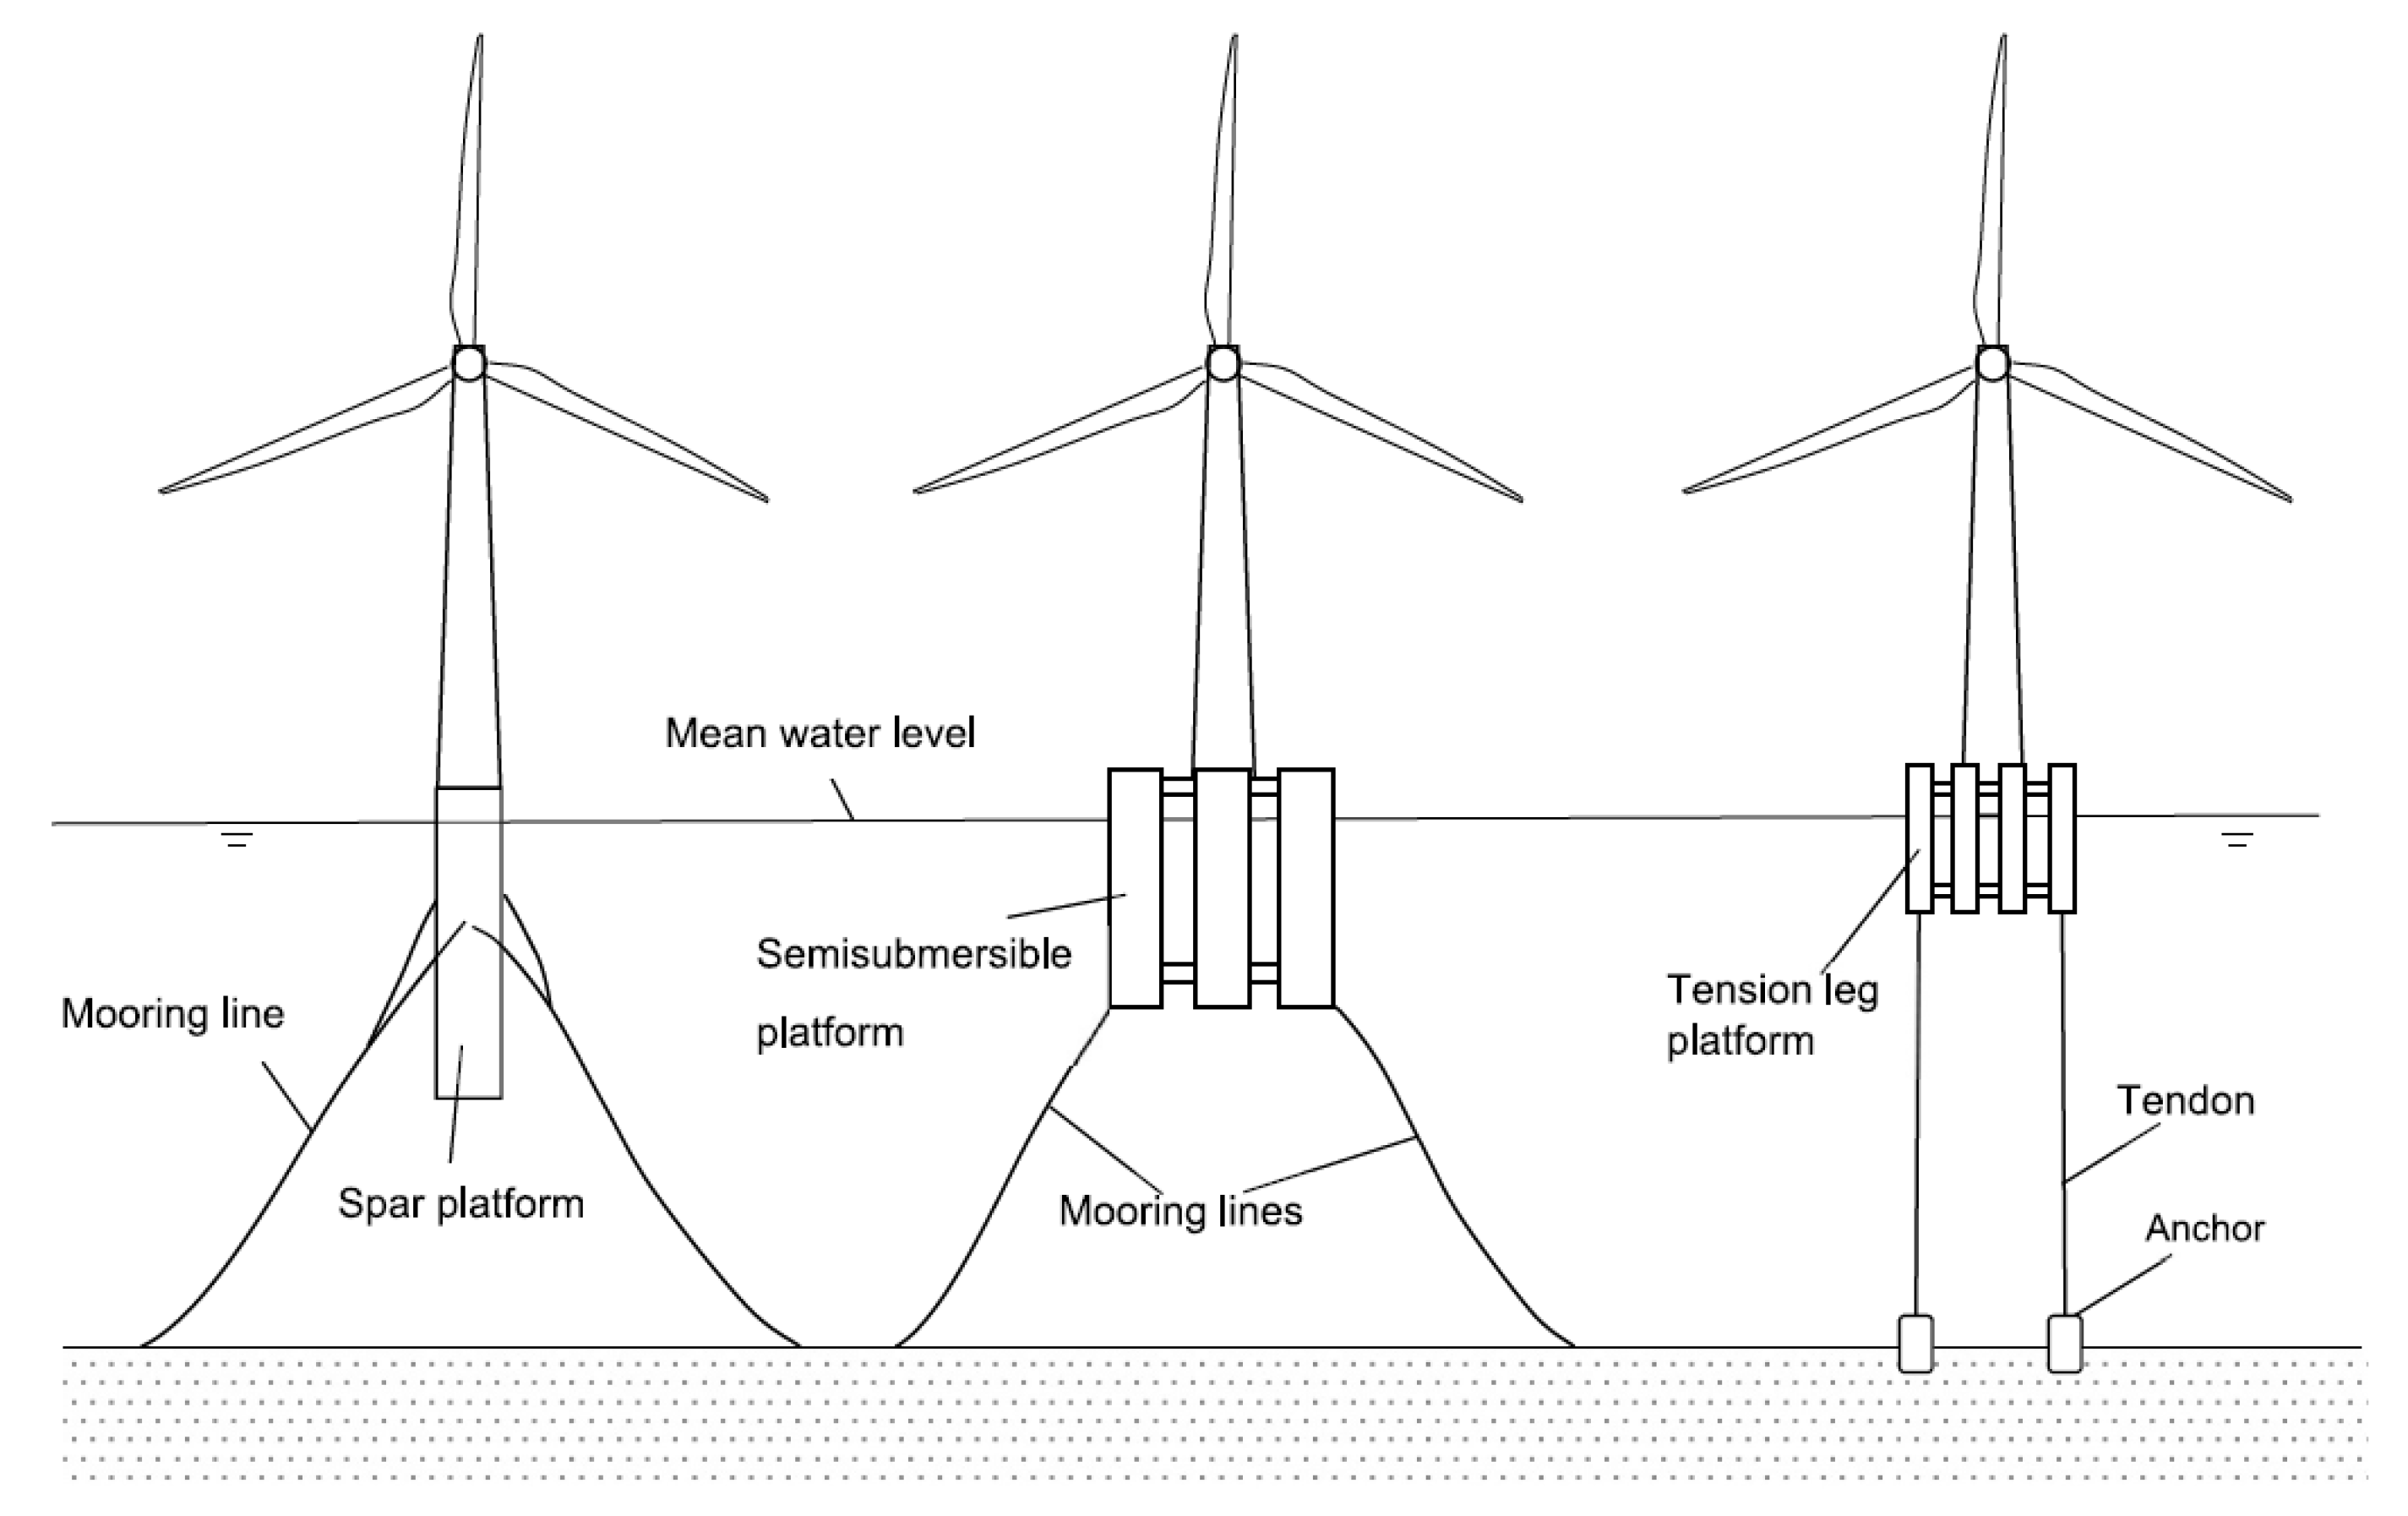
- Spar-type floating structures exhibit less conspicuous visual targets during the towing transport process, thereby increasing the likelihood of collisions with other vessels.
- Due to the higher center of gravity during the transportation procedure, Semi-Submersible and TLP-type FOWTs experience larger wave loads during the towing process, and these effects are more pronounced. This implies that these two types of FOWTs are less suitable for transportation via towing methods in regions with adverse sea conditions.
2. Materials and Methods
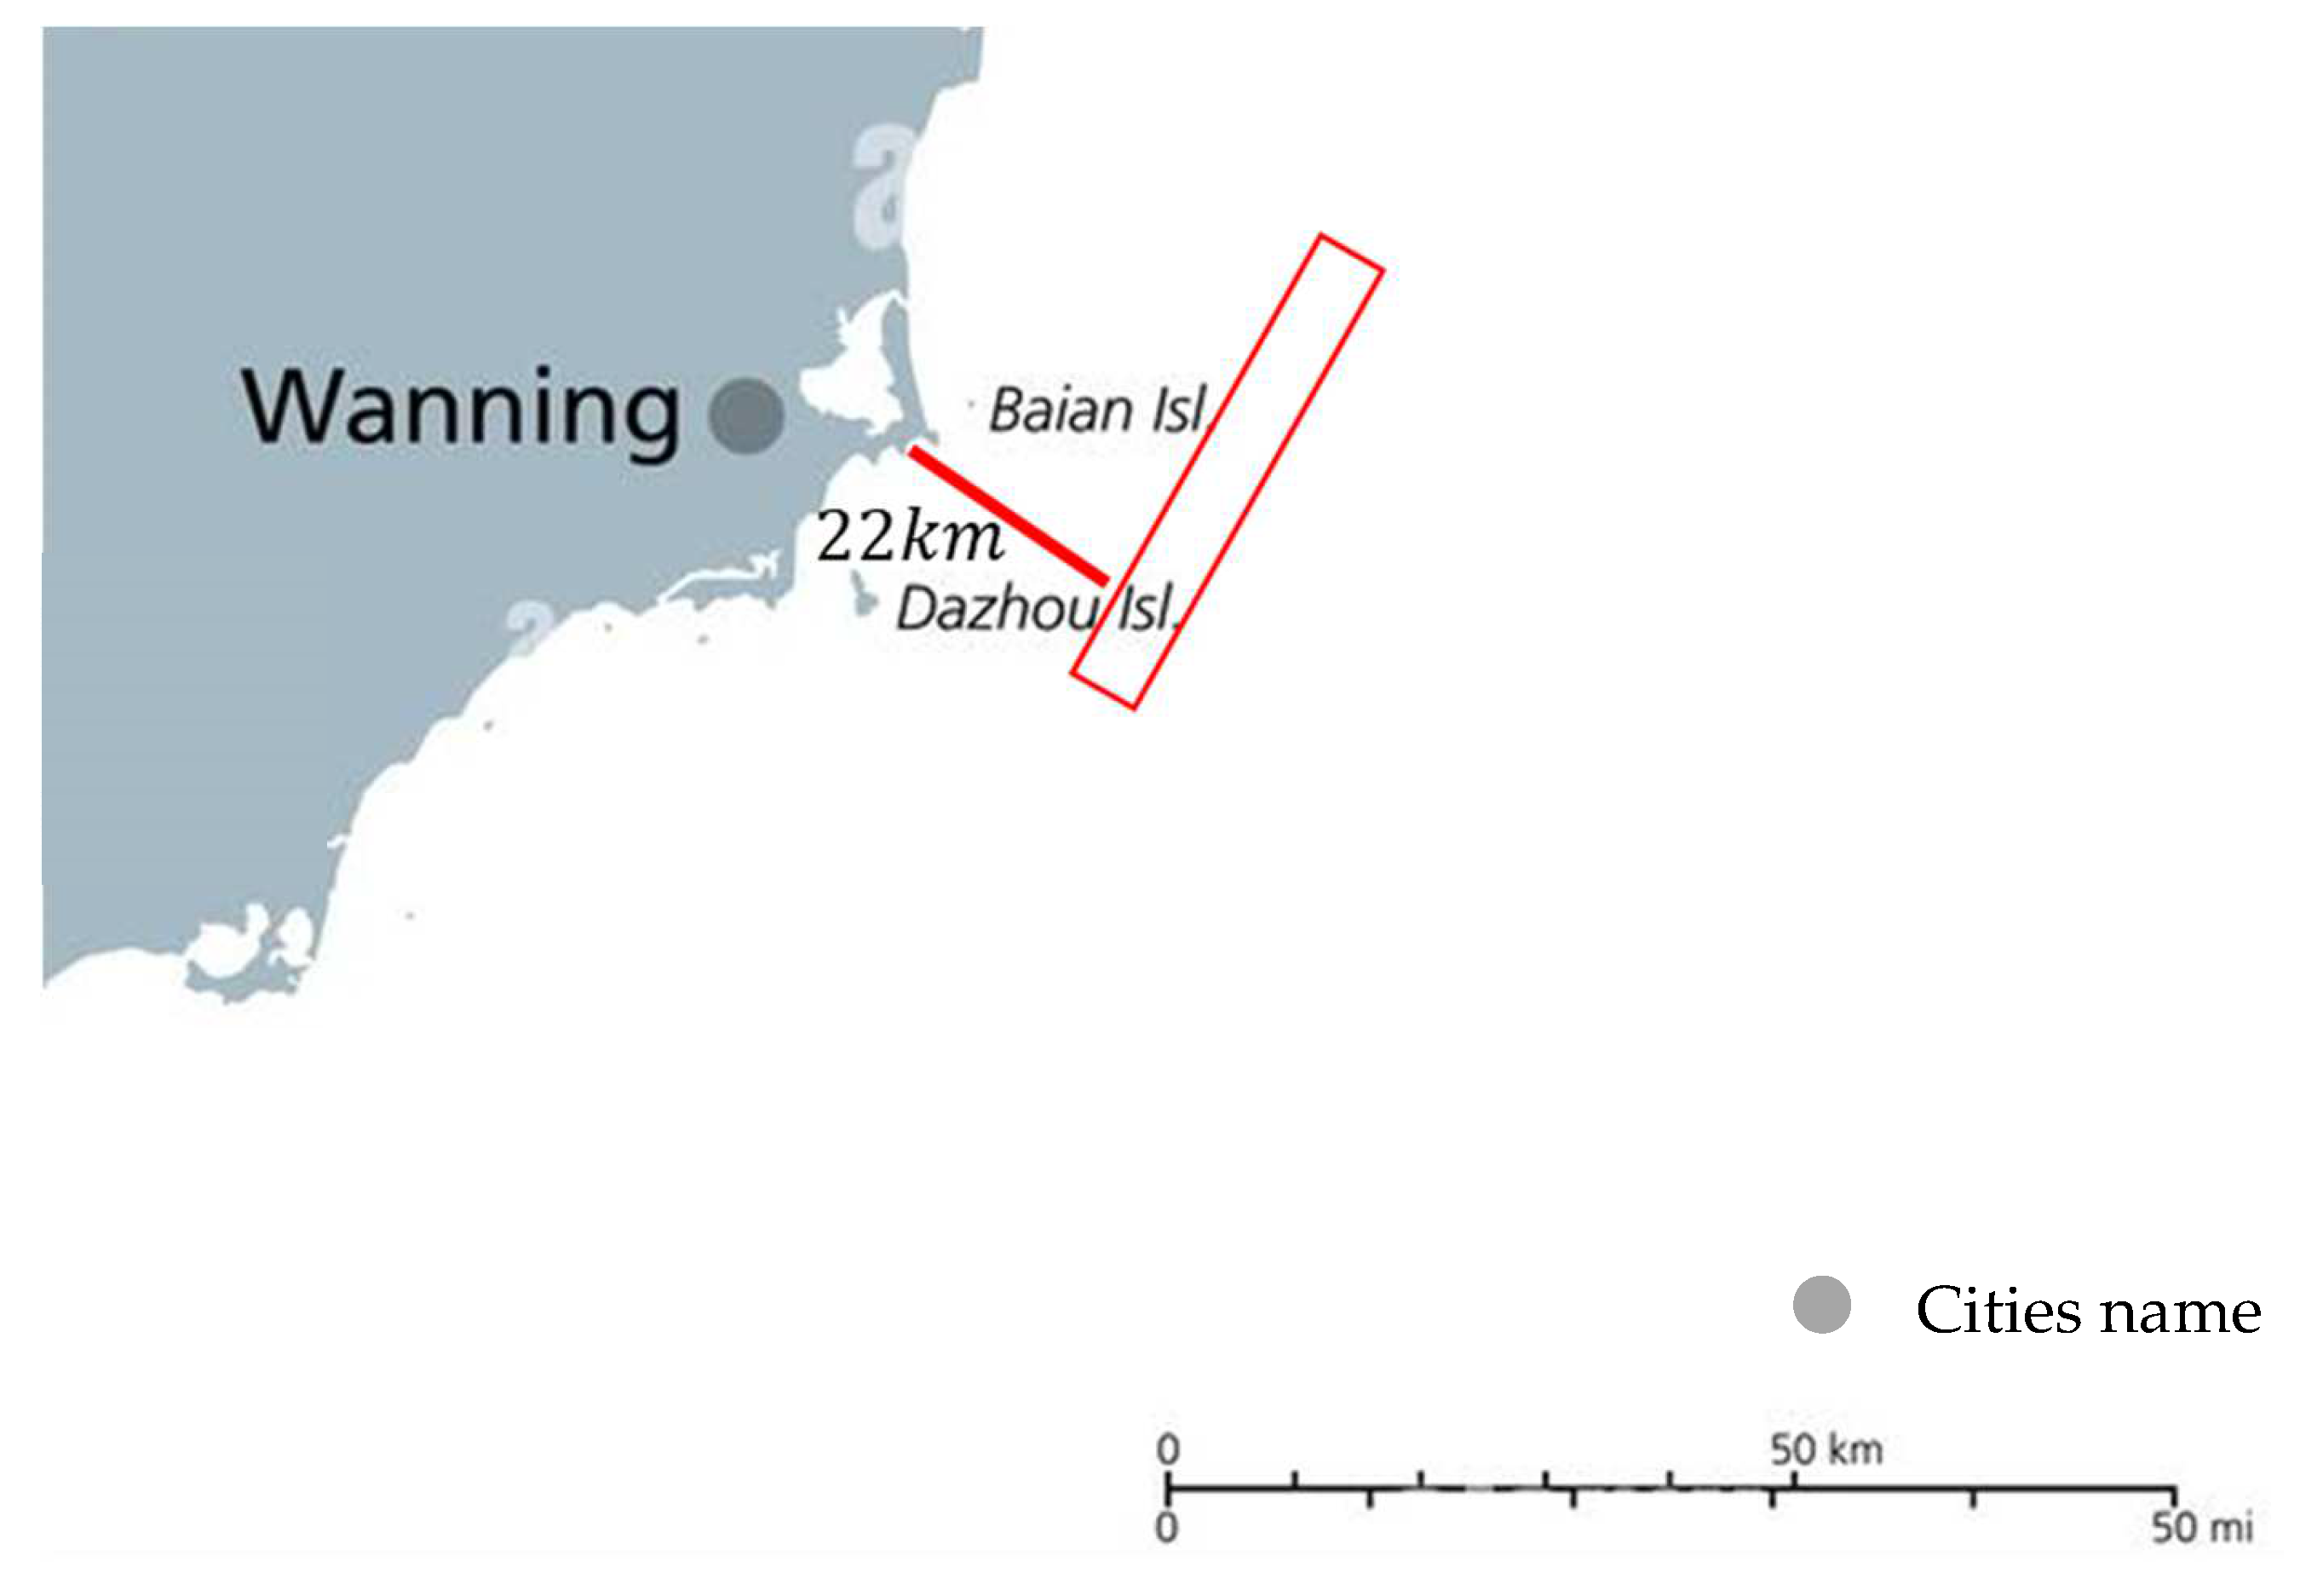
2.1. Case and Site Introduction
2.2. Ship Collision Analytical Model
- Ship operators are expected to actively endeavor to prevent accidents.
- Ship operators are anticipated to adhere to applicable legal and regulatory frameworks.
- Vessels are assumed to commence their journey without any defective equipment.
- Transportation operations will not be conducted under adverse sea conditions or within the subsequent 24 h period.
- The likelihood of a collision resulting from objects falling from the intended target and floating on the sea’s surface is not considered.
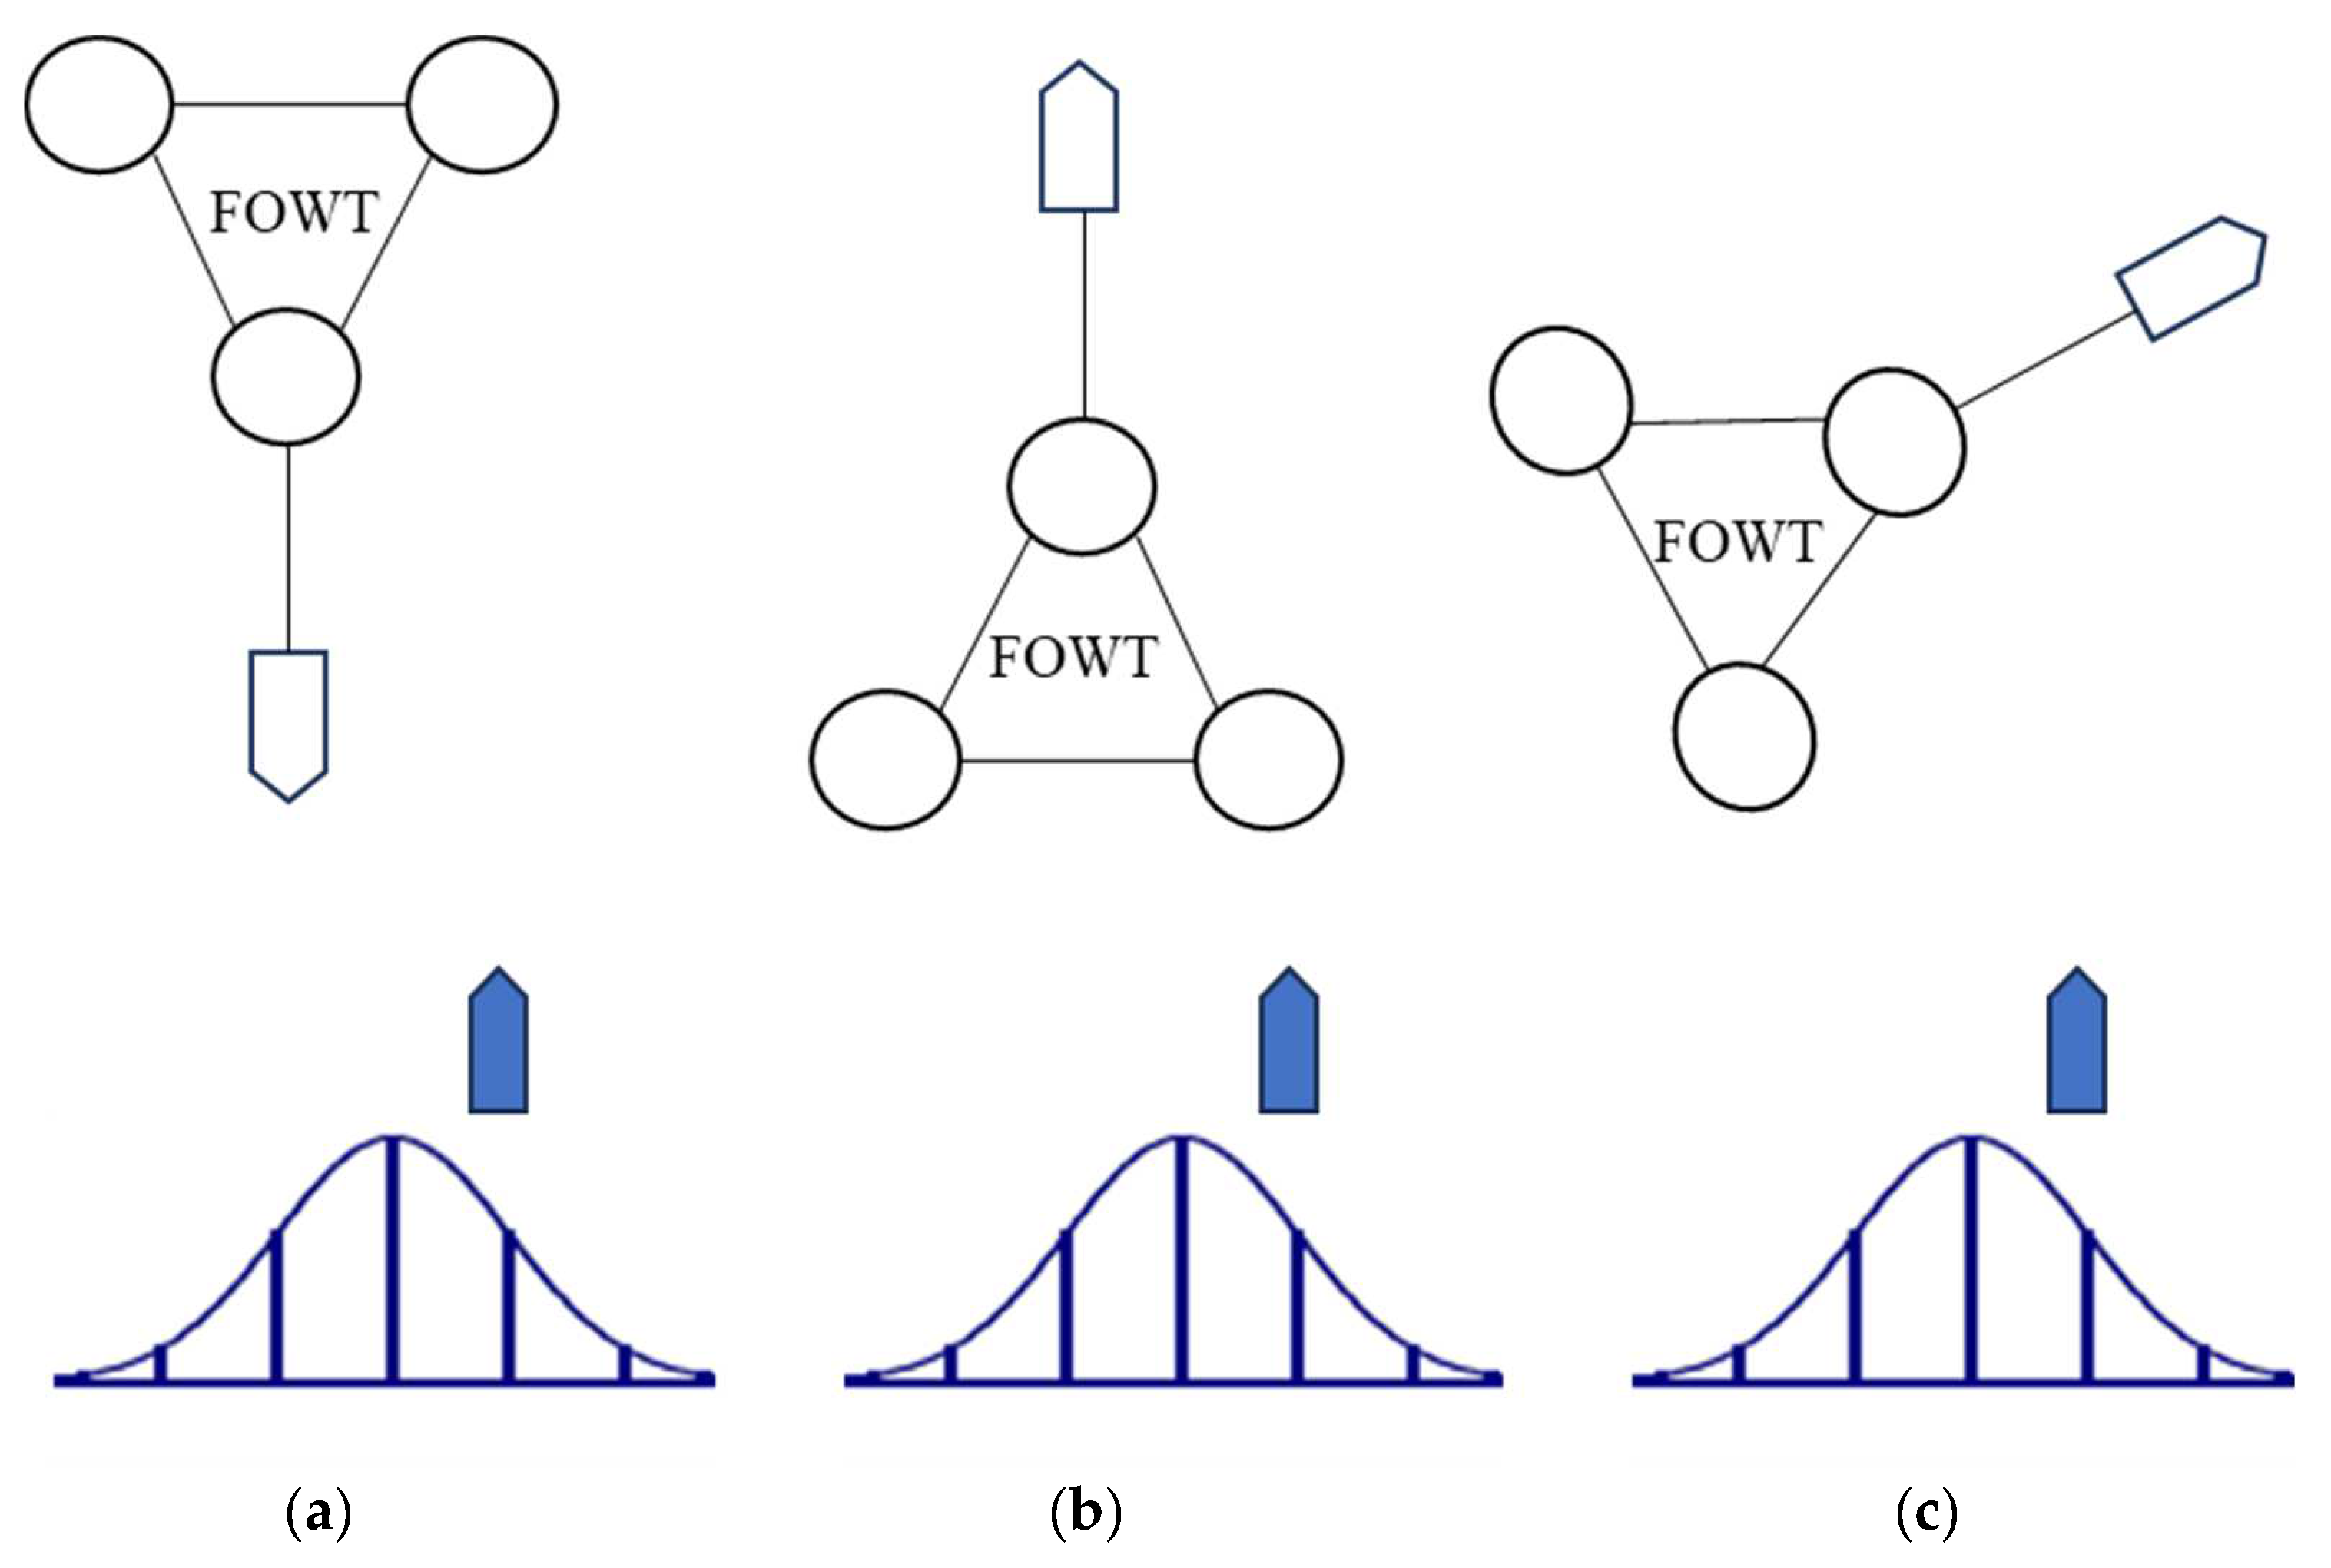
- Collisions occur as the fleet traverses the shipping channel.
- Collisions happen as the fleet approaches the shipping channel.
- Collisions take place in non-channel areas of the sea.
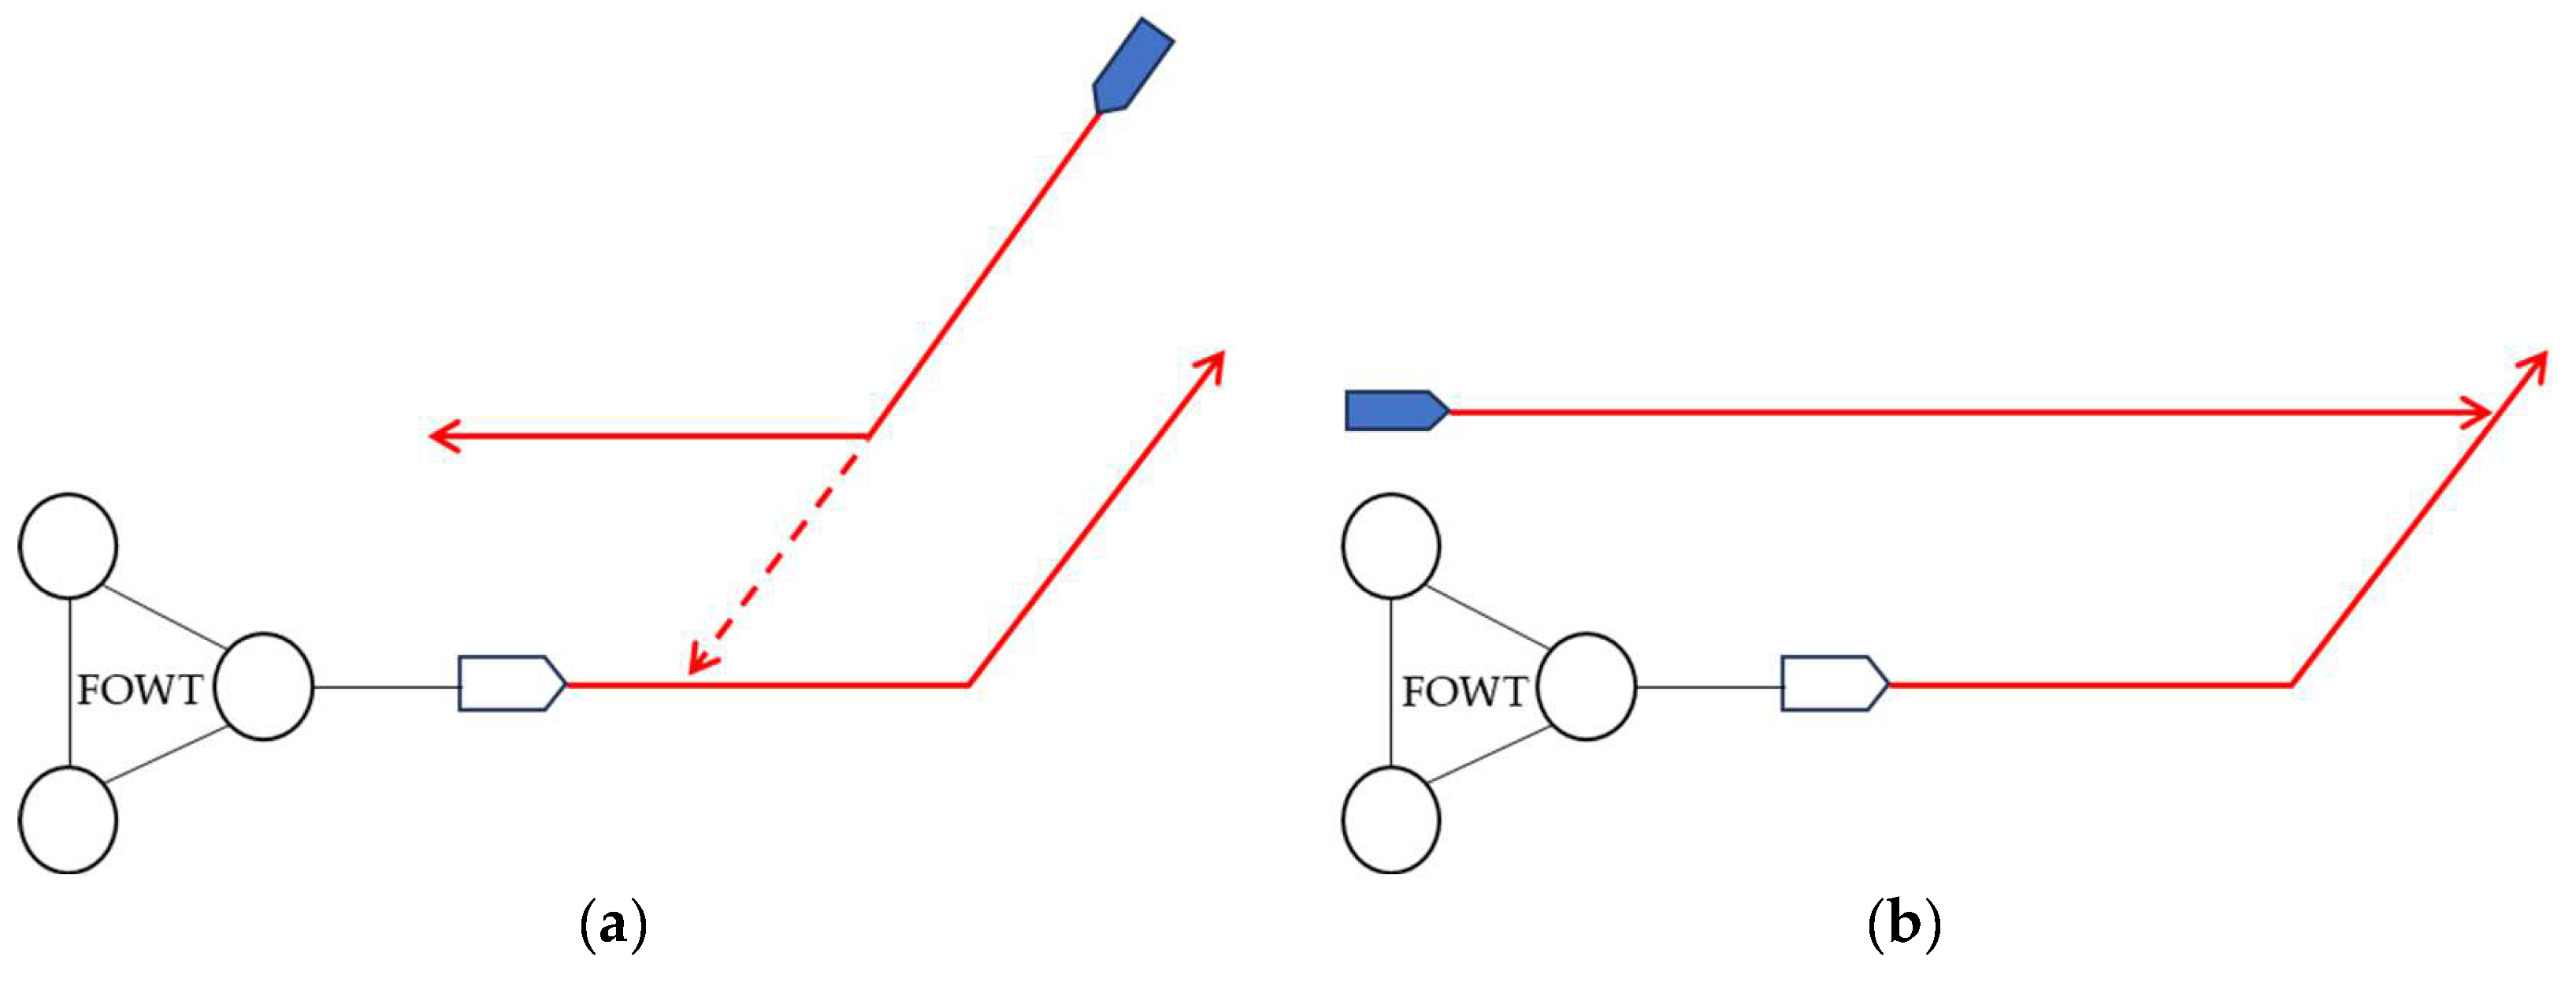
2.2.1. Channel and Near-Channel Area Collision Analytical Model
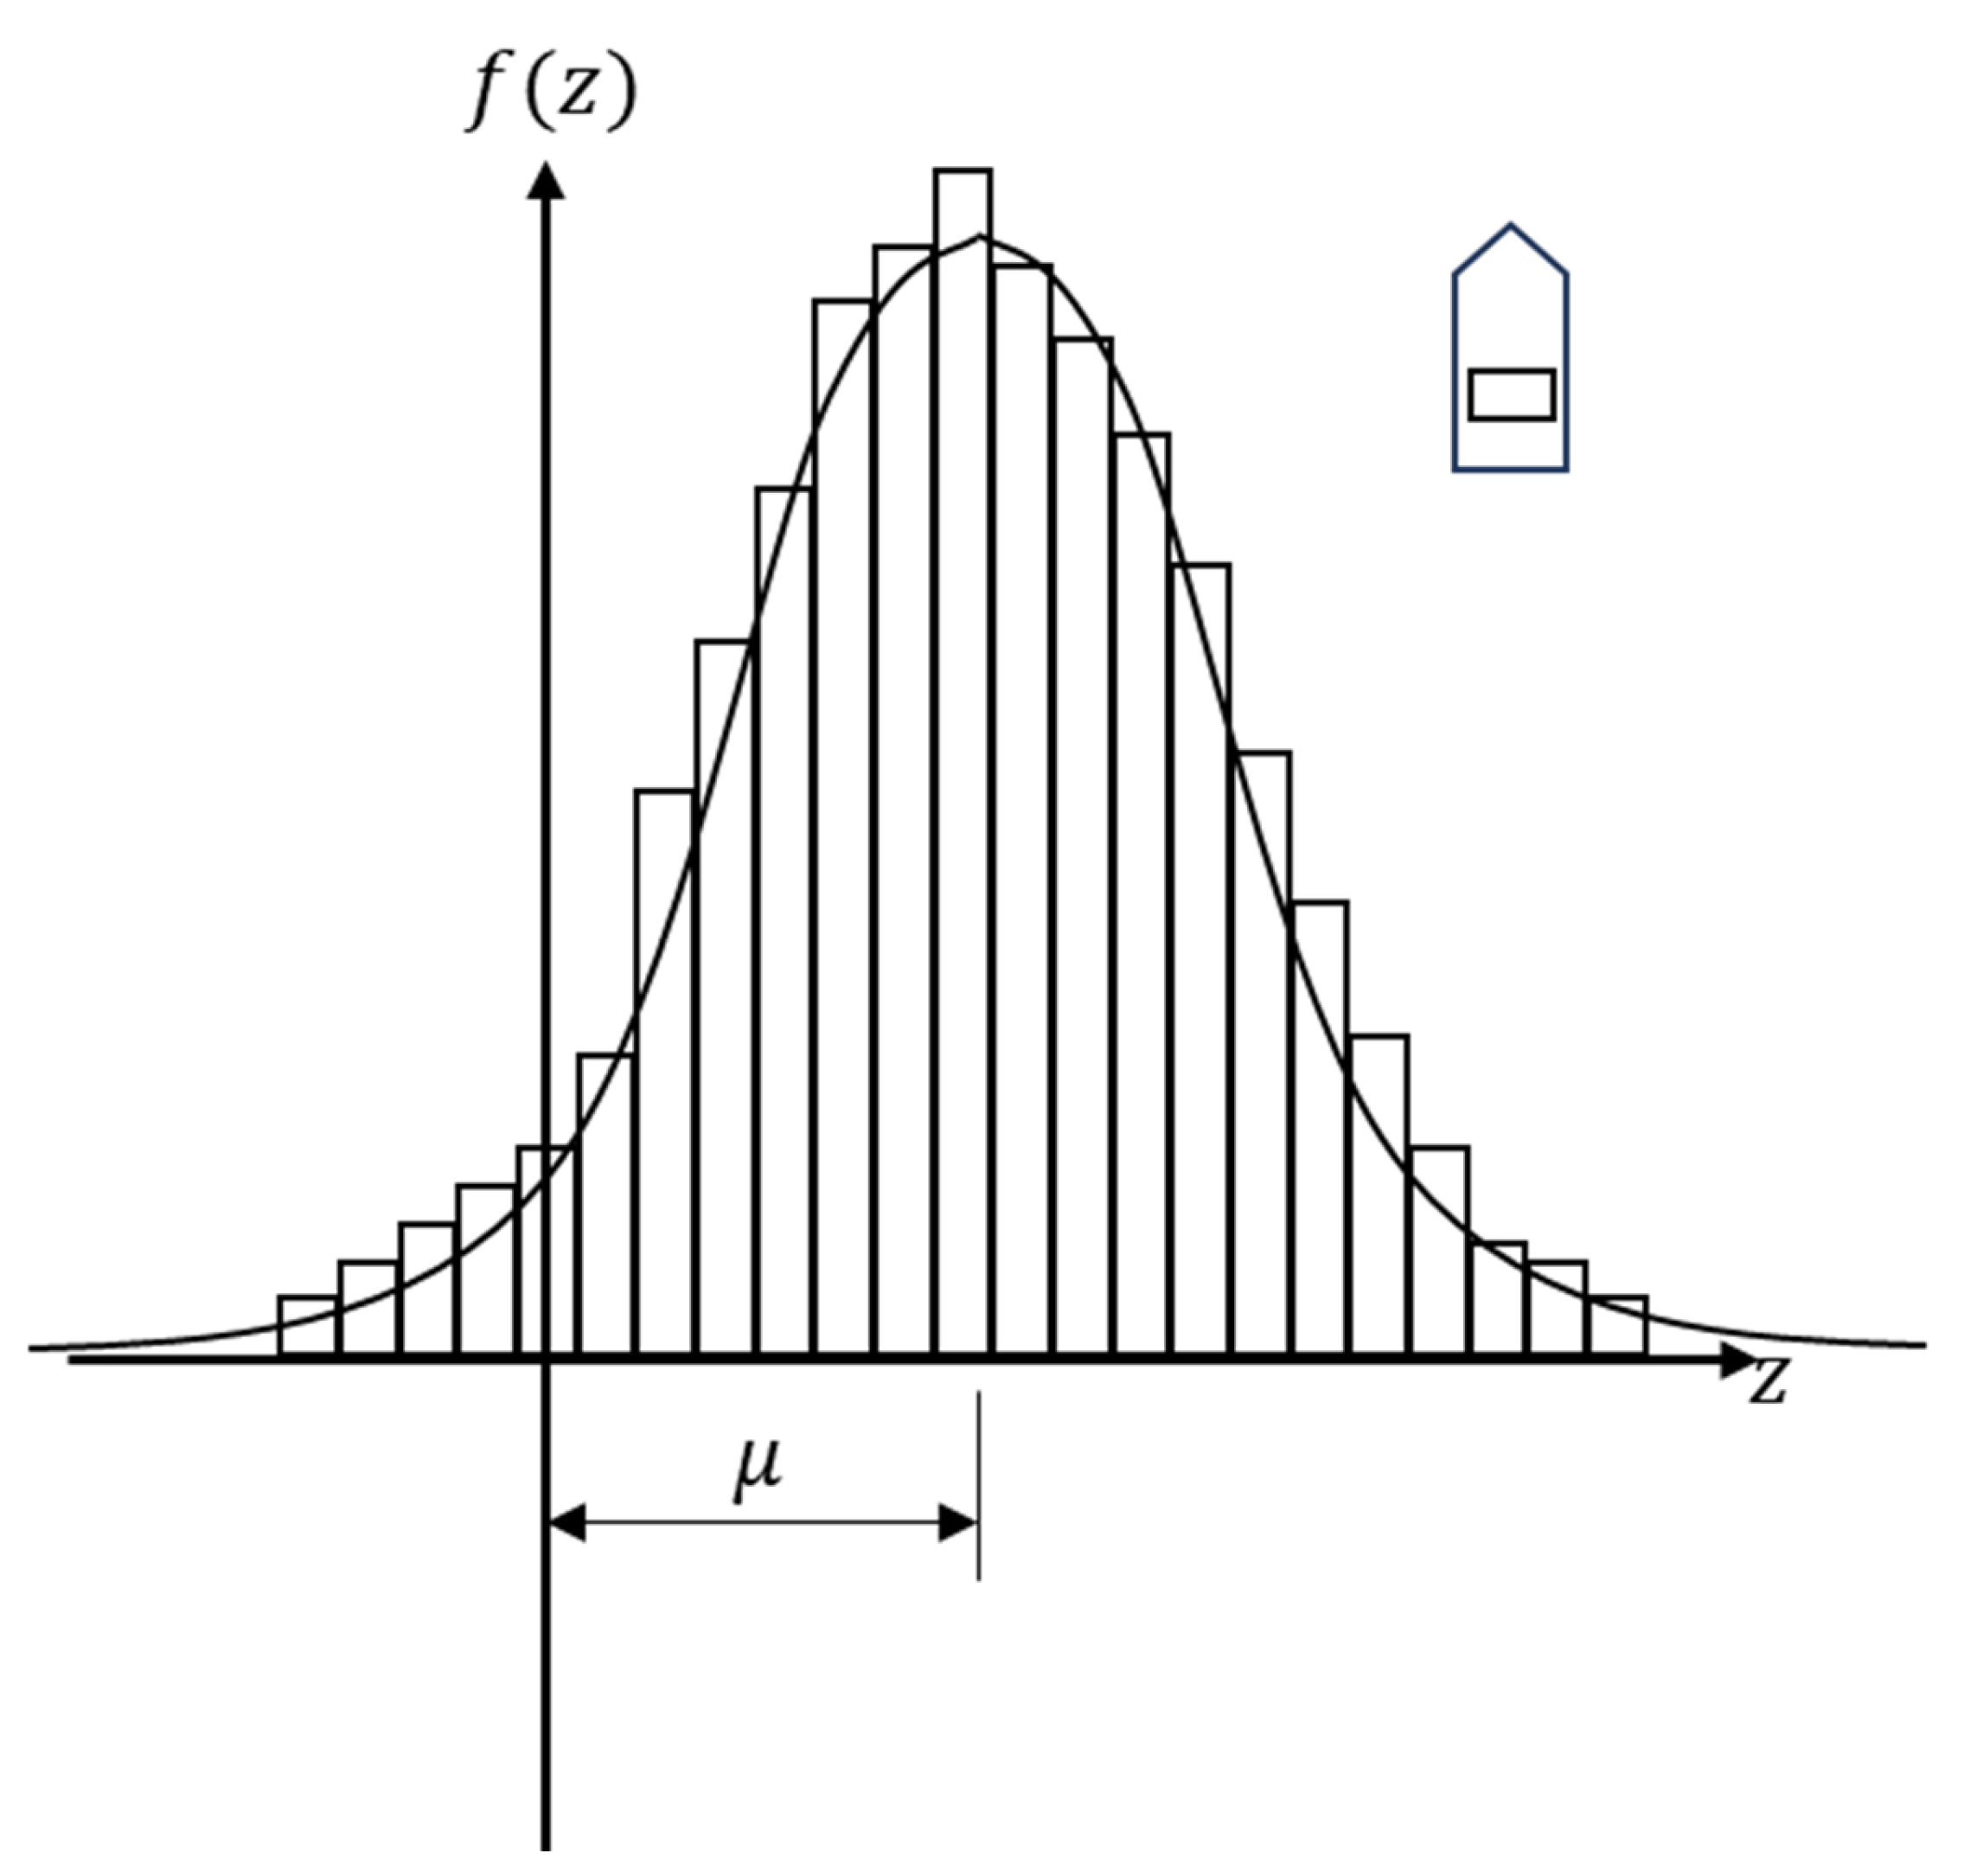
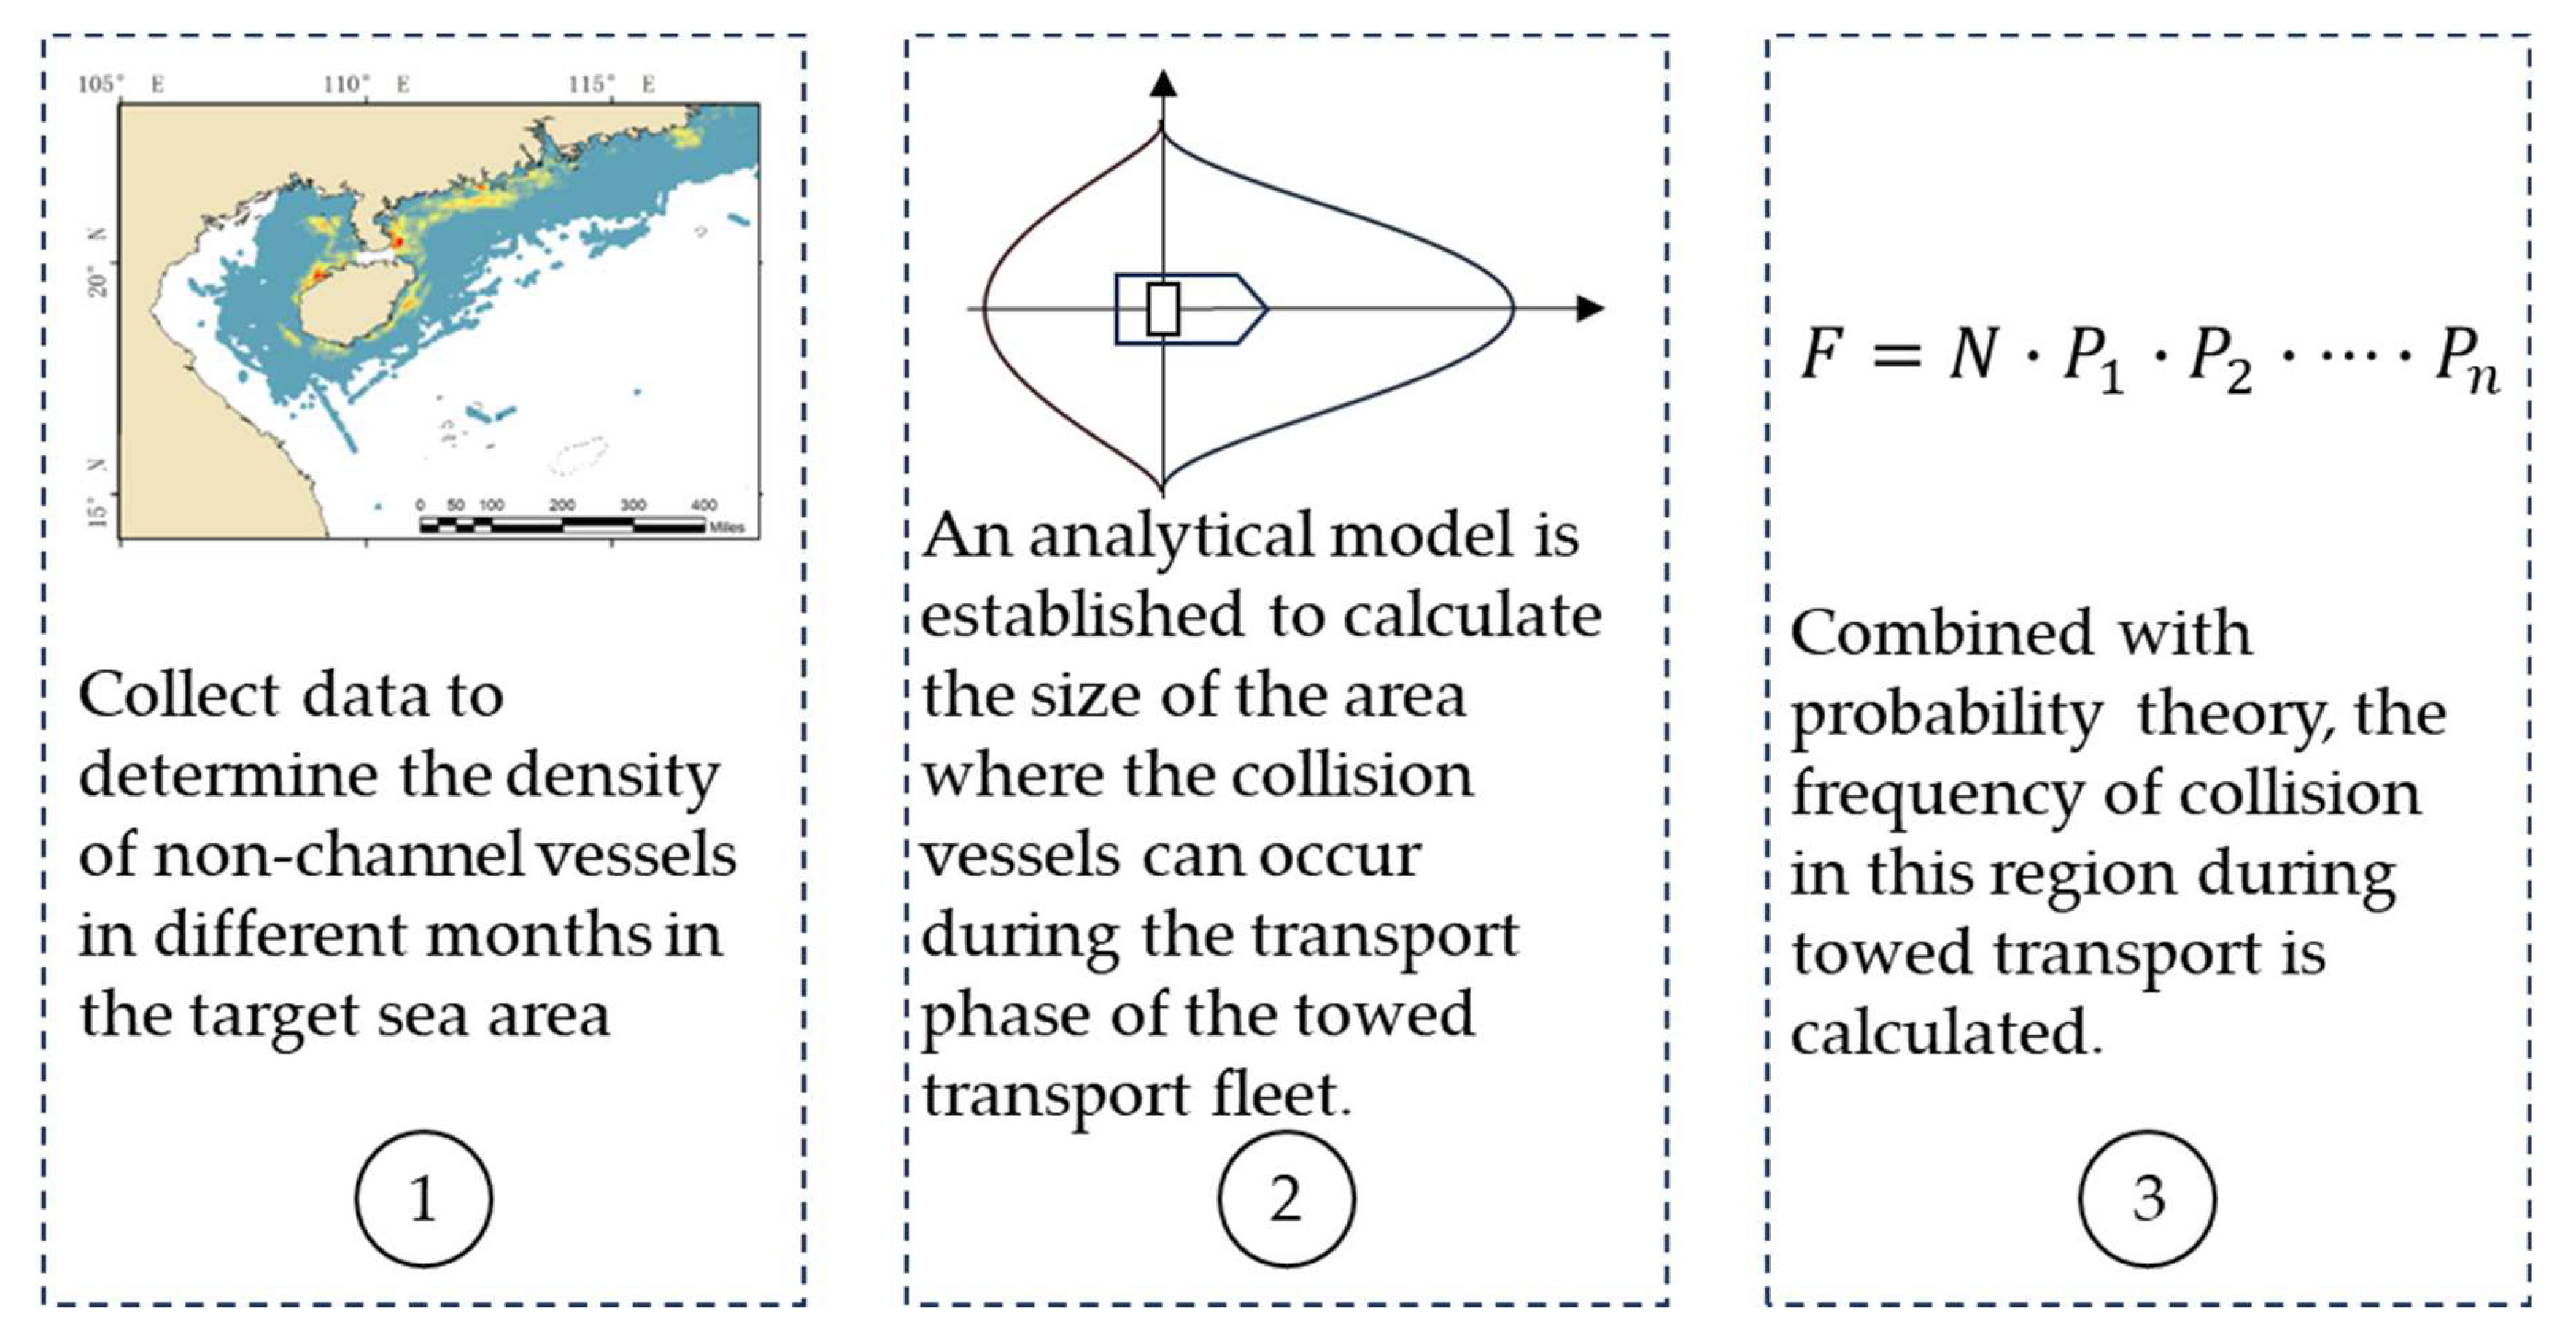
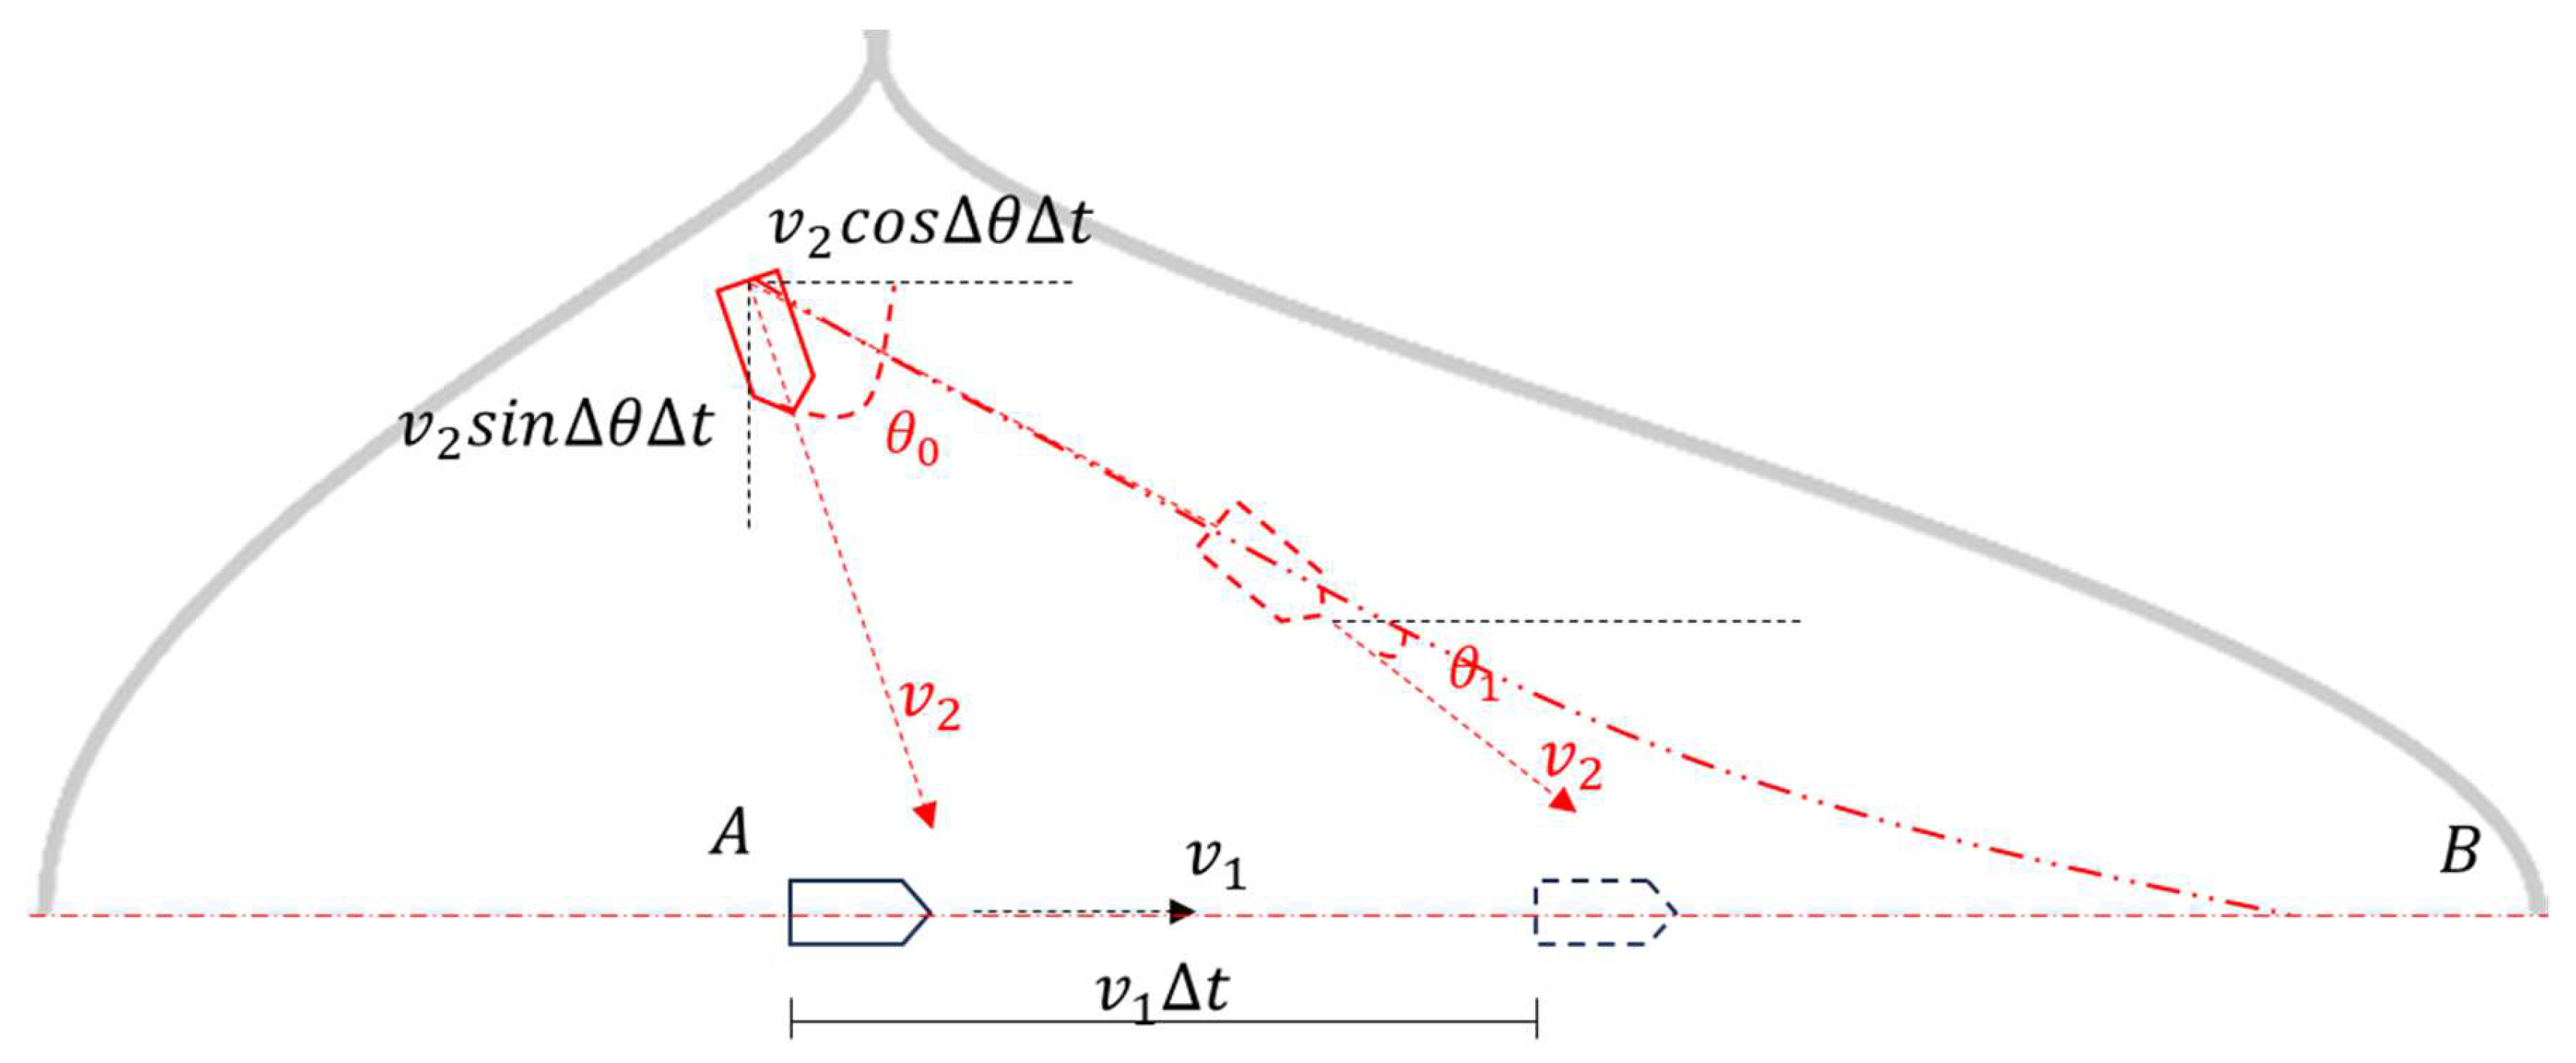
2.2.2. Non-Channel-Area Collision Analytical Model
3. Results
4. Discussion and Limitation
- Variations in vessel density across different sea areas.
- Significant differences in the sizes of vessel collisions, with the present study’s collision sizes considering scenarios in which transport vessels and FOWTs collide with other vessels.
- Methodologically induced numerical differentiation accounts for some discrepancies.
- Limitations in data usage for this study led to some bias in the results.
- Currently, all collision scenarios are simplified in that they adequately reduce the geometric and kinematic characteristics of collision candidates—that is, they do not consider three-dimensional space and focus only on the two-dimensional plane; they do not account for changes in speed and assume a constant velocity; and they significantly simplify the detailed geometric dimensions of the collision candidates. This necessarily leads to biases in the assessment results. However, there are currently no studies that demonstrate the severity of the impact of these biases;
- AIS data that correspond to the geometric and dynamic characteristics of collision candidates is often difficult to obtain; thus, statistical research in this area is more appropriately conducted by shipping professionals or organizations;
- Due to the current limitations in scientific and technological advancements, the methods for estimating human error and equipment failure probabilities in existing collision probability assessment models can be considered rather rudimentary. The implementation of digital twin technology and artificial intelligence for personnel and equipment reliability monitoring is expected to significantly enhance the estimation of such data.
- The longer the towing process, the higher the probability of ship collisions.
- The earlier ships in the domain detect the transport fleet, the more likely they are to avoid collision accidents.
- The slower the towing speed, the more likely ship collisions are.
- The faster the ships in the domain sail, the more likely they are to experience collisions.
- The ranking of the danger levels for collision types is as follows: crossing > overtaking > encounter.
- Conduct transport operations during good visibility conditions as much as possible.
- The fleet should have conspicuous markers to warn nearby ships to give way.
- If possible, arrange for peripheral patrol ships for the fleet as a warning.
- The speed during the transportation process should not be too low.
- The transport route design should be as short as possible, and the channel should be avoided as much as possible.
- Collision buffer devices should be installed on the side of the ship and the FOWT to minimize the impact force of collisions.
- Conducting transport operations during the fishing off season is safer than transporting during the fishing season.
5. Conclusions
- The validation of the feasibility of a non-channel analysis model through the utilization of more extensive site data and actual statistical data.
- An enhancement of the existing Pedersen model and the collision probability calculation model for non-channel areas by considering factors such as ship draft and the height of FOWT structures, resulting in a three-dimensional ship collision probability calculation model.
- Further research into the distribution patterns of offshore fishing vessels will be conducted, utilizing mathematical methods for induction, to derive a distribution function. This distribution function, obtained through induction, will replace the average distribution assumption employed in this study.
- The optimization of the collision probability assessment algorithm through the integration of more advanced methods tailored to the practical circumstances of the shipping industry, aiming to prevent the occurrence of collision events.
- The formulation of targeted preventive and mitigation strategies for accidents during the towing transportation of FOWTs, based on the analysis results of the model.
Author Contributions
Funding
Data Availability Statement
Acknowledgments
Conflicts of Interest
References
- Polcyn, J.; Us, Y.; Lyulyov, O.; Pimonenko, T.; Kwilinski, A. Factors Influencing the Renewable Energy Consumption in Selected European Countries. Energies 2021, 15, 108. [Google Scholar] [CrossRef]
- Taulo, J.L.; Sebitosi, A.B. Material and Energy Flow Analysis of the Malawian Tea Industry. Renew. Sustain. Energy Rev. 2016, 56, 1337–1350. [Google Scholar] [CrossRef]
- Hosseini, S.E. Fossil Fuel Crisis and Global Warming. In Fundamentals of Low Emission Flameless Combustion and Its Applications; Elsevier: Amsterdam, The Netherlands, 2022; pp. 1–11. [Google Scholar]
- Olabi, A.G.; Abdelkareem, M.A. Renewable Energy and Climate Change. Renew. Sustain. Energy Rev. 2022, 158, 112111. [Google Scholar] [CrossRef]
- Liu, Y.; Zhang, J.M.; Min, Y.T.; Yu, Y.; Lin, C.; Hu, Z.Z. A Digital Twin-Based Framework for Simulation and Monitoring Analysis of Floating Wind Turbine Structures. Ocean Eng. 2023, 283, 115009. [Google Scholar] [CrossRef]
- Nielsen, F.G. Perspectives and Challenges Related Offshore Wind Turbines in Deep Water. Energies 2022, 15, 2844. [Google Scholar] [CrossRef]
- Jiang, Z. Installation of Offshore Wind Turbines: A Technical Review. Renew. Sustain. Energy Rev. 2021, 139, 110576. [Google Scholar] [CrossRef]
- Anning, X. Research on Numerical Simulation of Transportation and Installation of Offshroe Wind Trubine in Floating Condition. Doctoral Thesis, Dalian University of Technology, Dalian, China, 2022. [Google Scholar]
- Jian, Z. Research on Towing Motion Response and Risk Analysis of Fully Submerged Floating Offshore Wind Turbine. Doctoral Thesis, Tianjin University, Tianjin, China, 2019. [Google Scholar]
- Xudong, C.; Guozhao, K. Optimized Design of Mooring System for Deep-Water Floating Wind Trubine Platform. Sh. Ocean Eng. 2023, 52, 43–51. [Google Scholar]
- Chuanyang, Z.; Hongbing, L.; Zhe, J.; Hehe, S.; Xianqiang, Q.; Hui, L. Failure Risk Analysis of Floating Offshroe Wind Trubine Mooring Systems Based on the Fault Tree Method. J. Harbin Eng. Univ. 2023, 44, 3–9. [Google Scholar]
- Ren, Z.; Zhou, H.; Li, B.; Hu, Z.; Yu, M.; Shi, W. Localization and Topological Observability Analysis of a Moored Floating Structure Using Mooring Line Tension Measurements. Ocean Eng. 2022, 266, 112706. [Google Scholar] [CrossRef]
- Liqin, L.; Weichen, J.; Zunfeng, D.; Changshui, X. Quantitative Risk Analysis of Floating Offshore Wind Turbine Foundation-Tower System Based on FTA Method. China Offshore Platf. 2019, 34, 79–87. [Google Scholar]
- Hou, G.; Xu, K.; Lian, J. A Review on Recent Risk Assessment Methodologies of Offshore Wind Turbine Foundations. Ocean Eng. 2022, 264, 112469. [Google Scholar] [CrossRef]
- Wei, G.; Yang, Y.; Jichun, M.; Xunkui, Z. Effects of Second-Rorder Hydrodynamics on the Dynamic Responses of a Semisubmersible-Type 15MW Wind Turbine. Renew. Energy Resour. 2023, 41, 333–338. [Google Scholar] [CrossRef]
- Guanqing, H. Prediction of Motion Responses for the Floating Offshroe Wind Turbine Under Extreme Conditions; Dalian University of Technology: Dalian, China, 2021. [Google Scholar]
- Changshui, X.; Liqin, L.; Weichen, J. Risk Assessment of Floating Wind Trubine Blade System Based on FTA Method. China Offshore Platf. 2019, 34, 39–46. [Google Scholar]
- Long, G. Study on Aeroelastic Response of Large Floating Offshroe Wind Trubine Based on FAST. Doctoral Thesis, Harbin Engineering University, Harbin, China, 2022. [Google Scholar]
- He, L. New FMECA and Bayesian Network Methodologies of Floating Offshore Wind Trubines’ Reliability Analysis. Doctoral Thesis, University of Electronic Science and Technology of China, Chengdu, China, 2021. [Google Scholar]
- Weichen, J. Reliability Analysis in Foundation-Tower-Blade and the Whole Risk Evaluation of Offshroe Floating Wind Trubine. Doctoral Thesis, Tianjin University, Tianjin, China, 2017. [Google Scholar]
- Salvação, N.; Soares, C.G. Floating Offshroe Wind Farms; Springer: Berlin/Heidelberg, Germany, 2016; ISBN 9783319279701. [Google Scholar]
- Myhr, A.; Bjerkseter, C.; Ågotnes, A.; Nygaard, T.A. Levelised Cost of Energy for Offshore Floating Wind Turbines in a Life Cycle Perspective. Renew. Energy 2014, 66, 714–728. [Google Scholar] [CrossRef]
- Hassan, M.; Guedes Soares, C. Dynamic Analysis of a Novel Installation Method of Floating Spar Wind Turbines. J. Mar. Sci. Eng. 2023, 11, 1373. [Google Scholar] [CrossRef]
- Yiyao, Z. Optimization of Connection and Support Sturcture for Twin-Barge Float-over Installation of Offshore Wind Trubines; China University of Petroleum: Qingdao, China, 2022. [Google Scholar]
- Presencia, C.E.; Shafiee, M. Risk Analysis of Maintenance Ship Collisions with Offshore Wind Turbines. Int. J. Sustain. Energy 2018, 37, 576–596. [Google Scholar] [CrossRef]
- Dai, L.; Ehlers, S.; Rausand, M.; Utne, I.B. Risk of Collision between Service Vessels and Offshore Wind Turbines. Reliab. Eng. Syst. Saf. 2013, 109, 18–31. [Google Scholar] [CrossRef]
- Zhang, S.; Pedersen, P.T.; Villavicencio, R. Probability of Ship Collision and Grounding; Butterworth-Heinemann: Oxford, UK, 2019; ISBN 9780128150221. [Google Scholar]
- China Maritime Safety Administration Navigation Integrated Service System. Available online: https://ais.msa.gov.cn/ (accessed on 20 December 2023).
- Wang, J.S.; Liu, Y.X.; Yang, K.; Li, M.C.; Sun, C. Extraction Method of Main Routes in South China Sea Based on Spatial Cluster Analysis. Jiaotong Yunshu Gongcheng Xuebao/J. Traffic Transp. Eng. 2016, 16, 91–98. [Google Scholar]
- Wang, J.; Li, M.; Liu, Y.; Zhang, H.; Zou, W.; Cheng, L. Safety Assessment of Shipping Routes in the South China Sea Based on the Fuzzy Analytic Hierarchy Process. Saf. Sci. 2014, 62, 46–57. [Google Scholar] [CrossRef]
- Wan, Z.; Shi, Z.; Nie, A.; Chen, J.; Wang, Z. Risk Assessment of Marine Invasive Species in Chinese Ports Introduced by the Global Shipping Network. Mar. Pollut. Bull. 2021, 173, 112950. [Google Scholar] [CrossRef]
- Guan, Y.; Zhang, J.; Zhang, X.; Li, Z.; Meng, J.; Liu, G.; Bao, M.; Cao, C. Identification of Fishing Vessel Types and Analysis of Seasonal Activities in the Northern South China Sea Based on Ais Data: A Case Study of 2018. Remote Sens. 2021, 13, 1952. [Google Scholar] [CrossRef]
- Fujii, Y. Integrated Study on Marine Traffic Accidents. Reports Work. Comm. Int. Assoc. Bridg. Struct. Eng. 1983, 42, 91–98. [Google Scholar]
- Montewka, J.; Hinz, T.; Kujala, P.; Matusiak, J. Probability Modelling of Vessel Collisions. Reliab. Eng. Syst. Saf. 2010, 95, 573–589. [Google Scholar] [CrossRef]
- Rasmussen, M.F.; Glibbery, K.K.A.; Melchild, K.; Hansen, G.M.; Jensen, K.T.; Lehn-Schioler, T.; Randrup-Thomsen, S. Quantitative Assessment of Risk to Ship Traffic in the Fehmarnbelt Fixed Link Project. J. Polish Saf. Reliab. Assoc. 2012, 3, 123–134. [Google Scholar]
- Čorić, M.; Mandžuka, S.; Gudelj, A.; Lušić, Z. Quantitative Ship Collision Frequency Estimation Models: A Review. J. Mar. Sci. Eng. 2021, 9, 533. [Google Scholar] [CrossRef]
- Fujii, Y.; Mizuki, M. Design of VTS Systems for Water with Bridges. In Ship Collision Analysis; Routledge: Oxfordshire, UK, 1998; p. 14. [Google Scholar]
- Vukša, S.; Vidan, P.; Bukljaš, M.; Pavić, S. Research on Ship Collision Probability Model Based on Monte Carlo Simulation and Bi-LSTM. J. Mar. Sci. Eng. 2022, 10, 1124. [Google Scholar] [CrossRef]


| Contents | Reference |
|---|---|
| Mooring system of FOWT | [10,11,12] |
| Foundation of FOWT | [13,14] |
| Structural dynamic response of FOWT | [15,16] |
| Blade system of FOWT | [17,18] |
| Reliability of FOWT | [19,20] |
| Subjects | Value |
|---|---|
| Distance to port (km) | 22 |
| Water depth (m) | 100 |
| Ultimate angle of generator (°) | |
| Ultimate heave (m) | |
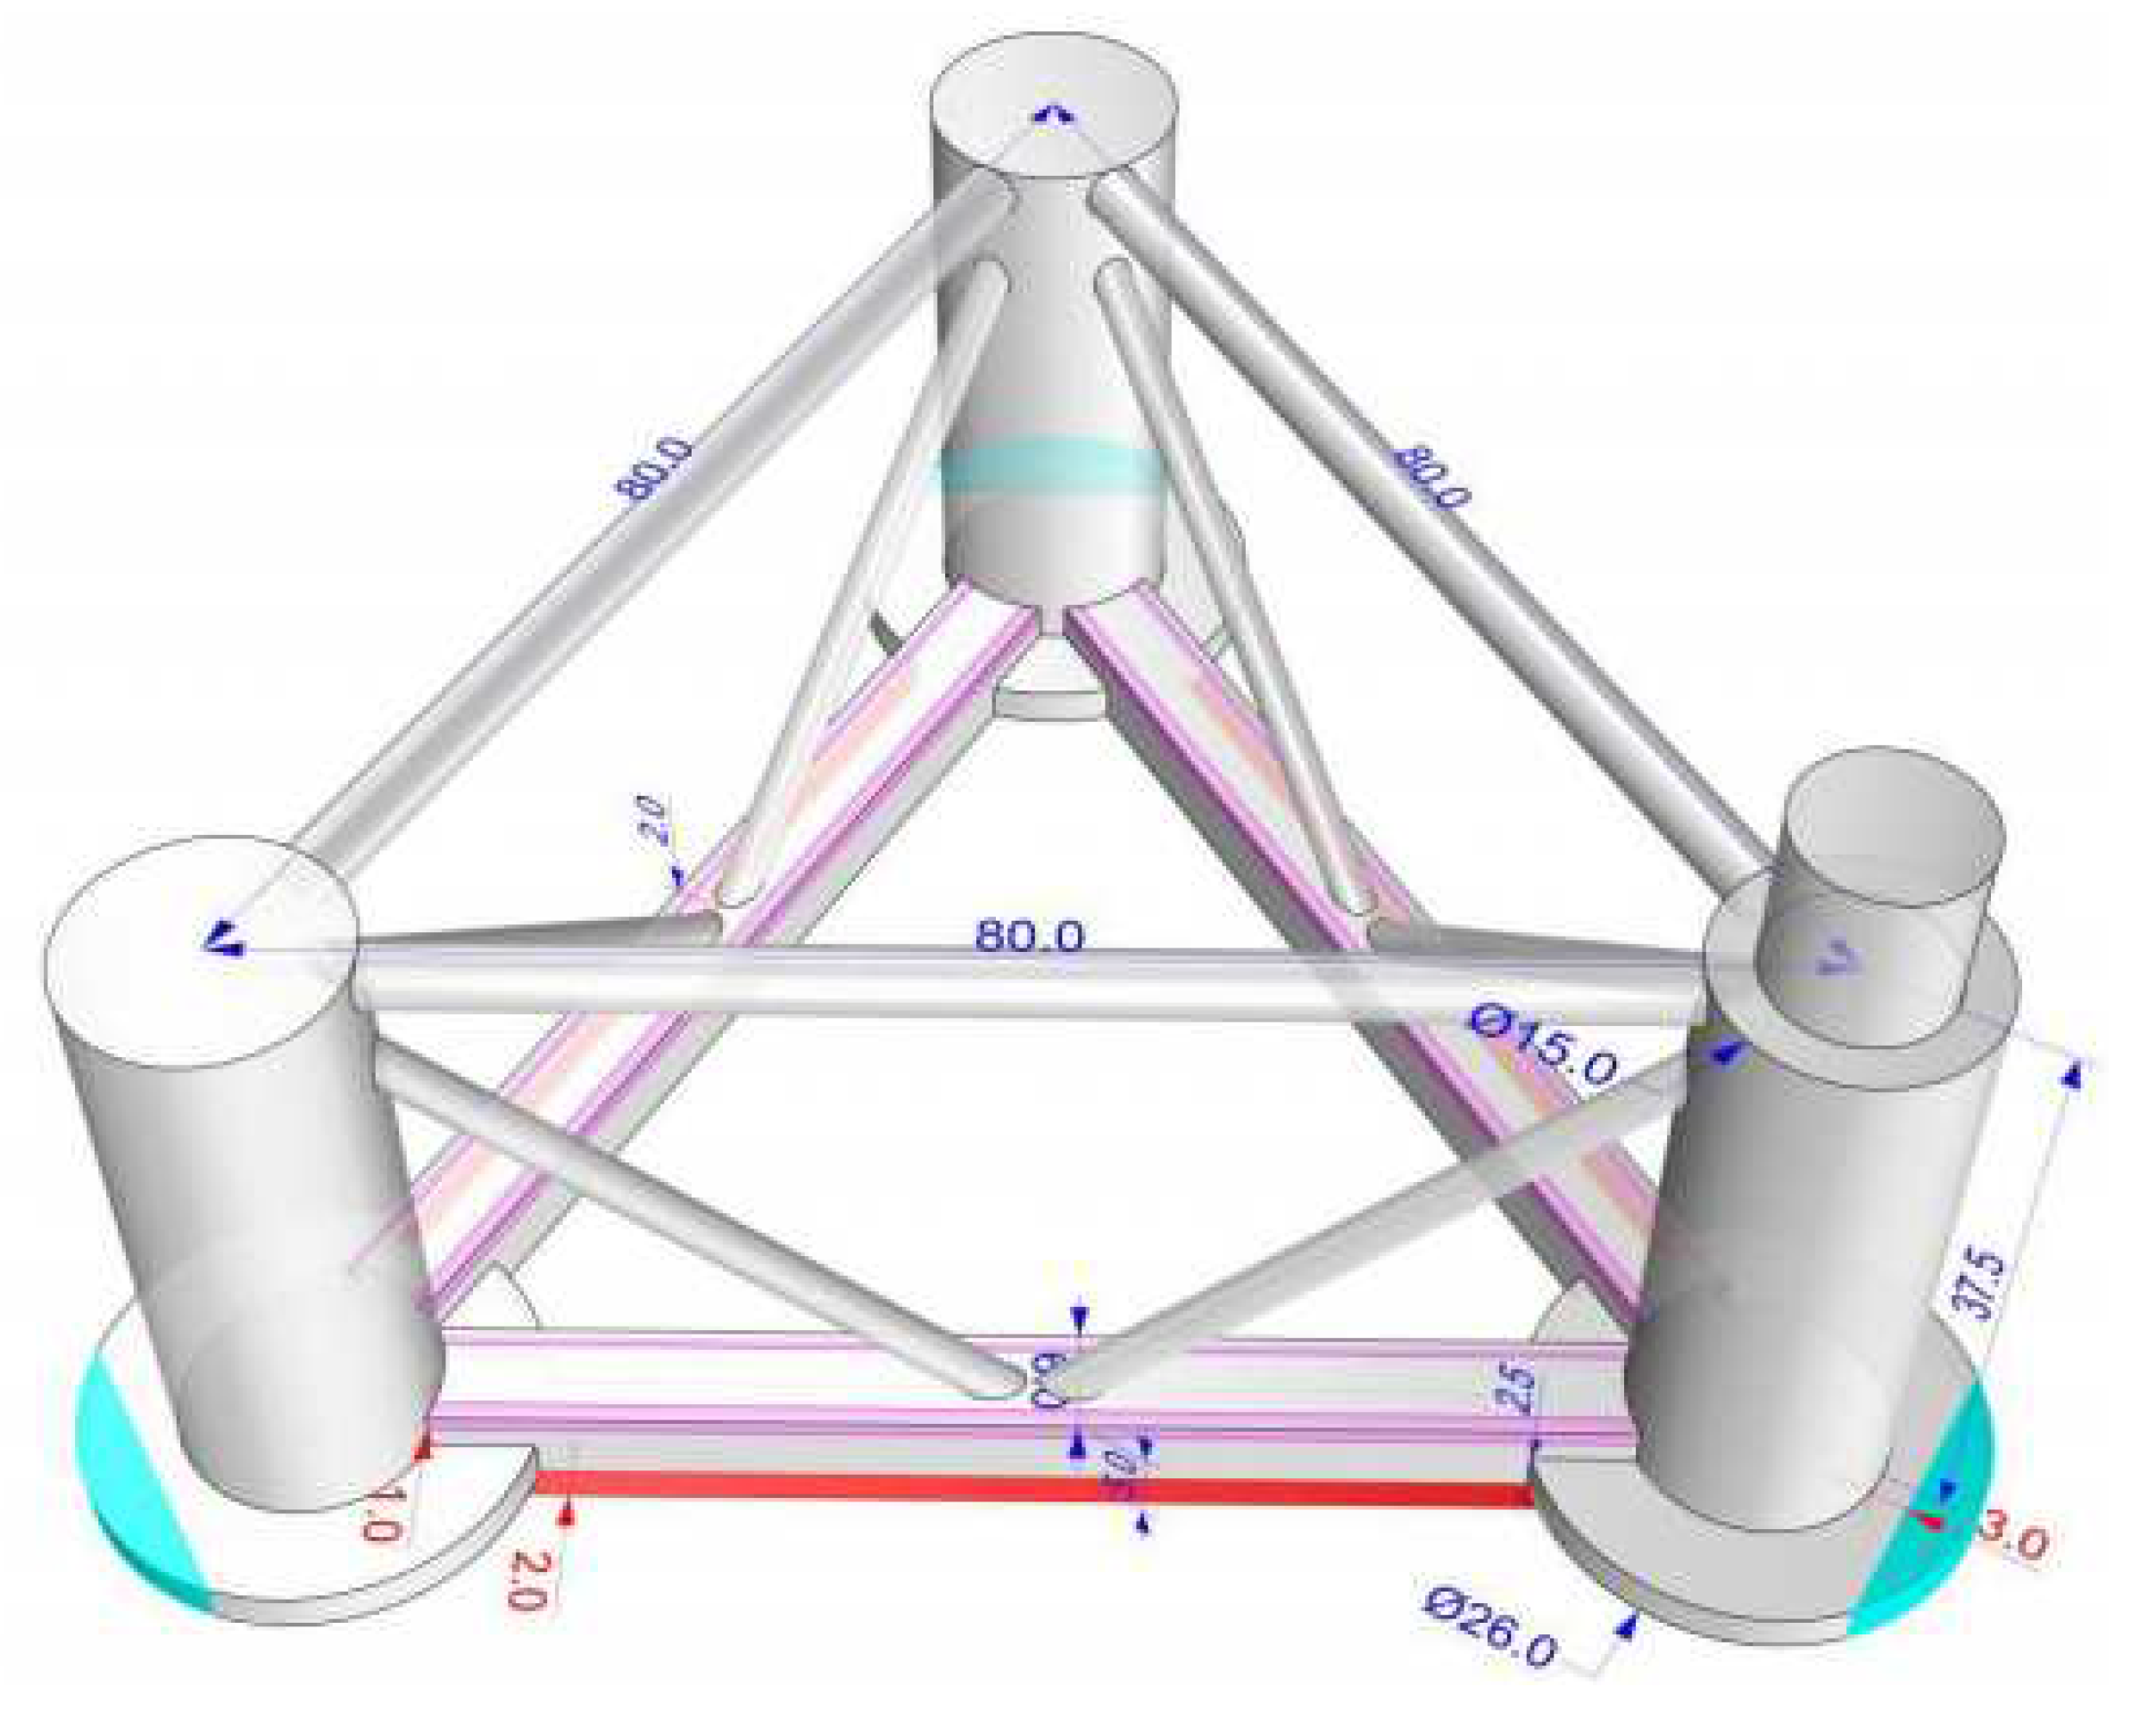
| Column radius (m) | 7.5 |
| Column height (m) | 37.5 |
| Swing plate radius (m) | 13 |
| Swing board height (m) | 2.5 |
| Column center distance (m) | 80 |
| Draft (m) | 25 |
| Blade size (m) | |
| Blade weight (t) | 55 |
| Nacelle size (m) | |
| Nacelle weight (t) | 416 |
| Hub size (m) | |
| Hub weight (t) | 124 |
| Tower height (m) | 126.2 |
| Tower weight (t) | 1132 |
| FOWT CoG (m) | 19.29 |
| FOWT CoB (m) | 8.89 |
| FOWT metacentric height (m) | 34.03 |
| Subjects | Value |
|---|---|
| Lane number | 0 |
| Vessel number (/y) | 8766 |
| Vessel length (m) | 36.8 |
| Vessel breadth (m) | 6.8 |
| Vessel tonnage (t) | 229 |
| Vessel speed (m/s) | 5.2 |
| Subjects | Symbol | Value | Source |
|---|---|---|---|
| Human failure | [33,34] | ||
| Propulsion failure | [35] | ||
| Sheering failure | [35] | ||
| Collision avoids | [36] | ||
| Repaired distribution | Equation (3) | [35] |
| Subjects | |
|---|---|
| Encounter | |
| Overtaking | |
| Crossing |
| Months | Number of Vessels | ||||
|---|---|---|---|---|---|
| Trawler | Gillnetter | Seiner | Other | Summary | |
| April | 2636 | 4085 | 1268 | 1317 | 9306 |
| June | 639 | 627 | 557 | 387 | 2210 |
| September | 1638 | 4562 | 1027 | 1805 | 9032 |
| Months | Collision Type | Ship Velocities (Knots) | |||
|---|---|---|---|---|---|
| 9 | 10 | 11 | 12 | ||
| April | Encounter | 1.42 | 2.05 | 2.83 | 3.78 |
| Overtaking | 1.86 | 2.68 | 3.70 | 4.94 | |
| Crossing | 2.00 | 2.88 | 3.97 | 5.30 | |
| Months | Collision Type | Ship Velocities (Knots) | |||
|---|---|---|---|---|---|
| 9 | 10 | 11 | 12 | ||
| June | Encounter | 0.34 | 0.49 | 0.67 | 0.90 |
| Overtaking | 0.44 | 0.64 | 0.8 8 | 1.17 | |
| Crossing | 0.47 | 0.68 | 0.94 | 1.26 | |
| Months | Collision Type | Ship Velocities (Knots) | |||
|---|---|---|---|---|---|
| 9 | 10 | 11 | 12 | ||
| September | Encounter | 1.38 | 1.99 | 2.75 | 3.67 |
| Overtaking | 1.80 | 2.60 | 3.59 | 4.79 | |
| Crossing | 1.94 | 2.79 | 3.85 | 5.14 | |
| Results | Channel Area | Non-Channel Area |
|---|---|---|
| Srđan et.al. | 9.00 | <5.00 |
| This paper | - | 6.88 |
Disclaimer/Publisher’s Note: The statements, opinions and data contained in all publications are solely those of the individual author(s) and contributor(s) and not of MDPI and/or the editor(s). MDPI and/or the editor(s) disclaim responsibility for any injury to people or property resulting from any ideas, methods, instructions or products referred to in the content. |
© 2024 by the authors. Licensee MDPI, Basel, Switzerland. This article is an open access article distributed under the terms and conditions of the Creative Commons Attribution (CC BY) license (https://creativecommons.org/licenses/by/4.0/).
Share and Cite
Li, Y.; Liu, L.; Li, S.; Hu, Z.-Z. The Probability of Ship Collision during the Fully Submerged Towing Process of Floating Offshore Wind Turbines. Sustainability 2024, 16, 1705. https://doi.org/10.3390/su16041705
Li Y, Liu L, Li S, Hu Z-Z. The Probability of Ship Collision during the Fully Submerged Towing Process of Floating Offshore Wind Turbines. Sustainability. 2024; 16(4):1705. https://doi.org/10.3390/su16041705
Chicago/Turabian StyleLi, Yihong, Longxiang Liu, Sunwei Li, and Zhen-Zhong Hu. 2024. "The Probability of Ship Collision during the Fully Submerged Towing Process of Floating Offshore Wind Turbines" Sustainability 16, no. 4: 1705. https://doi.org/10.3390/su16041705
APA StyleLi, Y., Liu, L., Li, S., & Hu, Z.-Z. (2024). The Probability of Ship Collision during the Fully Submerged Towing Process of Floating Offshore Wind Turbines. Sustainability, 16(4), 1705. https://doi.org/10.3390/su16041705