1. Introduction
The increase in global trade not only stimulates economic growth but also leads to an increase in air pollutants and greenhouse gas emissions, especially in developing countries [
1,
2,
3]. Early studies on the coordinated effects (co-effects) of air pollutants and greenhouse gases were primarily focused on developed countries [
1,
2,
3,
4,
5]. Pursuing synergies may be even more critical for developing countries compared to developed ones [
6]. For China, on the one hand, the world’s largest developing country, in 2012, the proportion of inter-provincial trade to GDP was as high as 72%. On the other hand, while inter-provincial trade plays an increasingly important role in connecting production and consumption, alleviating regional resource shortages, and stimulating consumption and economic growth [
7,
8], changes in production and consumption patterns have made it challenging to address the “emission transfer” and “emission leakage” caused by inter-provincial trade in terms of reducing carbon dioxide and atmospheric pollutants [
9,
10]. At the same time, the impact of trade on the environment is complex and diverse, posing greater challenges to the coordinated control of both [
11,
12,
13]. However, discussions on the co-effects of embodied emissions and their environmental impacts from the perspective of inter-provincial trade are limited, especially in China. Therefore, understanding the trends and interactions of different environmental impacts is of significant importance for achieving multi-regional coordinated emission reduction in China.
To achieve the goals of reducing CO
2 and air pollutants, some scholars have begun to study the coordinated effects (co-benefits, trade-offs, and co-damage) among various environmental impacts [
14,
15,
16,
17,
18,
19,
20,
21]. Co-effects refer to the positive impacts that policies or measures aimed at achieving a specific goal may have on other goals, thereby increasing the overall benefits to society or the environment. Extensive research has been conducted to analyze co-effects related to the environment, suggesting that synergies are of significant importance in improving air quality and mitigating climate change, especially in specific industries [
14,
15,
16,
17], such as the supply industry, transportation sector, and industrial domains [
18,
19,
20,
21]. Research indicates substantial variations in the co-effects across different industries [
18,
20]. Furthermore, due to significant differences in air pollution control measures and related policies among different countries and regions, the environmental impact of co-benefits varies at different scales [
22], and it may even lead to trade-offs and co-damage [
23]. Compared to co-benefits, it is contended that trade-offs and co-damages are prevalent in environmental impacts [
23,
24,
25]. Efforts to transform trade-offs and co-damage into co-benefits can help reduce the costs of air pollution control measures [
25]. However, traditional collaborative emission reduction models have not adequately considered the emission issues arising from inter-regional trade. This may result in localized reductions but an overall increase in emissions, or a reduction in one pollutant with an increase in others. For China, the significant differences in emissions levels among provinces make the emission issues triggered by inter-provincial trade even more prominent [
26,
27,
28]. Therefore, studying the co-effects between embodied CO
2 and air pollutants holds significant importance for promoting reduction in pollution and carbon.
In recent years, with the deepening of scientific research, there has been an increasing focus on how to more effectively reduce embodied carbon dioxide and atmospheric pollutant emissions. A series of measures have been taken to reveal the driving factors behind the changes in embodied emissions [
10,
29,
30,
31,
32,
33]. There are mainly two methods for decomposing influencing factors: one is index decomposition analysis (IDA) [
34], and the other is structural decomposition analysis (SDA) [
35]. While IDA can explain the driving factors of emission changes, its decomposition path is limited, and it overlooks the study of other socio-economic factors [
34]. SDA can effectively address these limitations. Through the analysis of emission intensity, changes in industrial structure, and final demand, SDA can better demonstrate the emission changes driven by trade [
35]. In addition, some studies have introduced more socio-economic factors to explore the inherent connections between regions, enriching our understanding of regional cooperation and supply chains [
36,
37]. Although there is a rich body of research on the driving factors of embodied carbon dioxide and atmospheric pollutant emissions, previous research related to SDA has mainly focused on a single emission type, neglecting the synergy among various emissions under the influence of the same driving factors [
31,
32,
33]. This, to some extent, has limited the application of policies related to synergistic emission reductions.
In summary, a study area encompassing 30 provinces of China (excluding Tibet, Taiwan, Hong Kong, Macau, and Taiwan) was selected for this work, which focused on SO2, NOx, PM2.5, and CO2. Based on a modified multi-regional input–output model (MRIO), for the first time, we calculated provincial-level CO2 and air pollutant emission leakage in 2012 and 2017. We found three types of co-effects and categorized them as co-benefits, trade-offs, and co-damage to reveal provincial differences. Combined with SDA, we calculated the interannual variation in trade-induced emissions and identified the key driving factors of provincial-level co-effects in inter-provincial trade from 2012 to 2017.
3. Results
3.1. Emission Leakage Caused by Embodied Emission Transfer in Inter-Provincial Trade
The emission leakage of embodied CO2 and air pollutants in 2012 and 2017 was estimated by taking the difference of values from before and after the emission transfer. From a national perspective, in 2012, there was an increase in nationwide emission leakage for PM2.5, SO2, and NOx (+3.2%, +3.8%, +0.3%), while national CO2 emissions decreased (−0.2%). In 2017, there was an increase in nationwide emission leakage for CO2, PM2.5, and SO2 emissions (+0.1%, +0.8%, +2.0%), but national NOx emissions decreased (−0.6%). It is evident that, apart from CO2 emissions, emission leakage of air pollutants has been decreasing from 2012 to 2017. This indicates that air pollutant control reduced air pollutant emissions in the provinces from 2012 to 2017. The reduction in SO2 emissions is the most significant. However, with the increase in total energy consumption, CO2 emissions have risen, leading to a noticeable increase in CO2 emission leakage as well.
In this study, China’s 30 provinces were divided into five regions based on geographical location and economic development levels. The regional aggregation map can be found in
Supplementary Figure S1. Due to significant differences in resources, economic development levels, industrial structures, and energy structures among the provinces in China, there are noticeable variations in CO
2 and air pollutant emission leakage across these provinces.
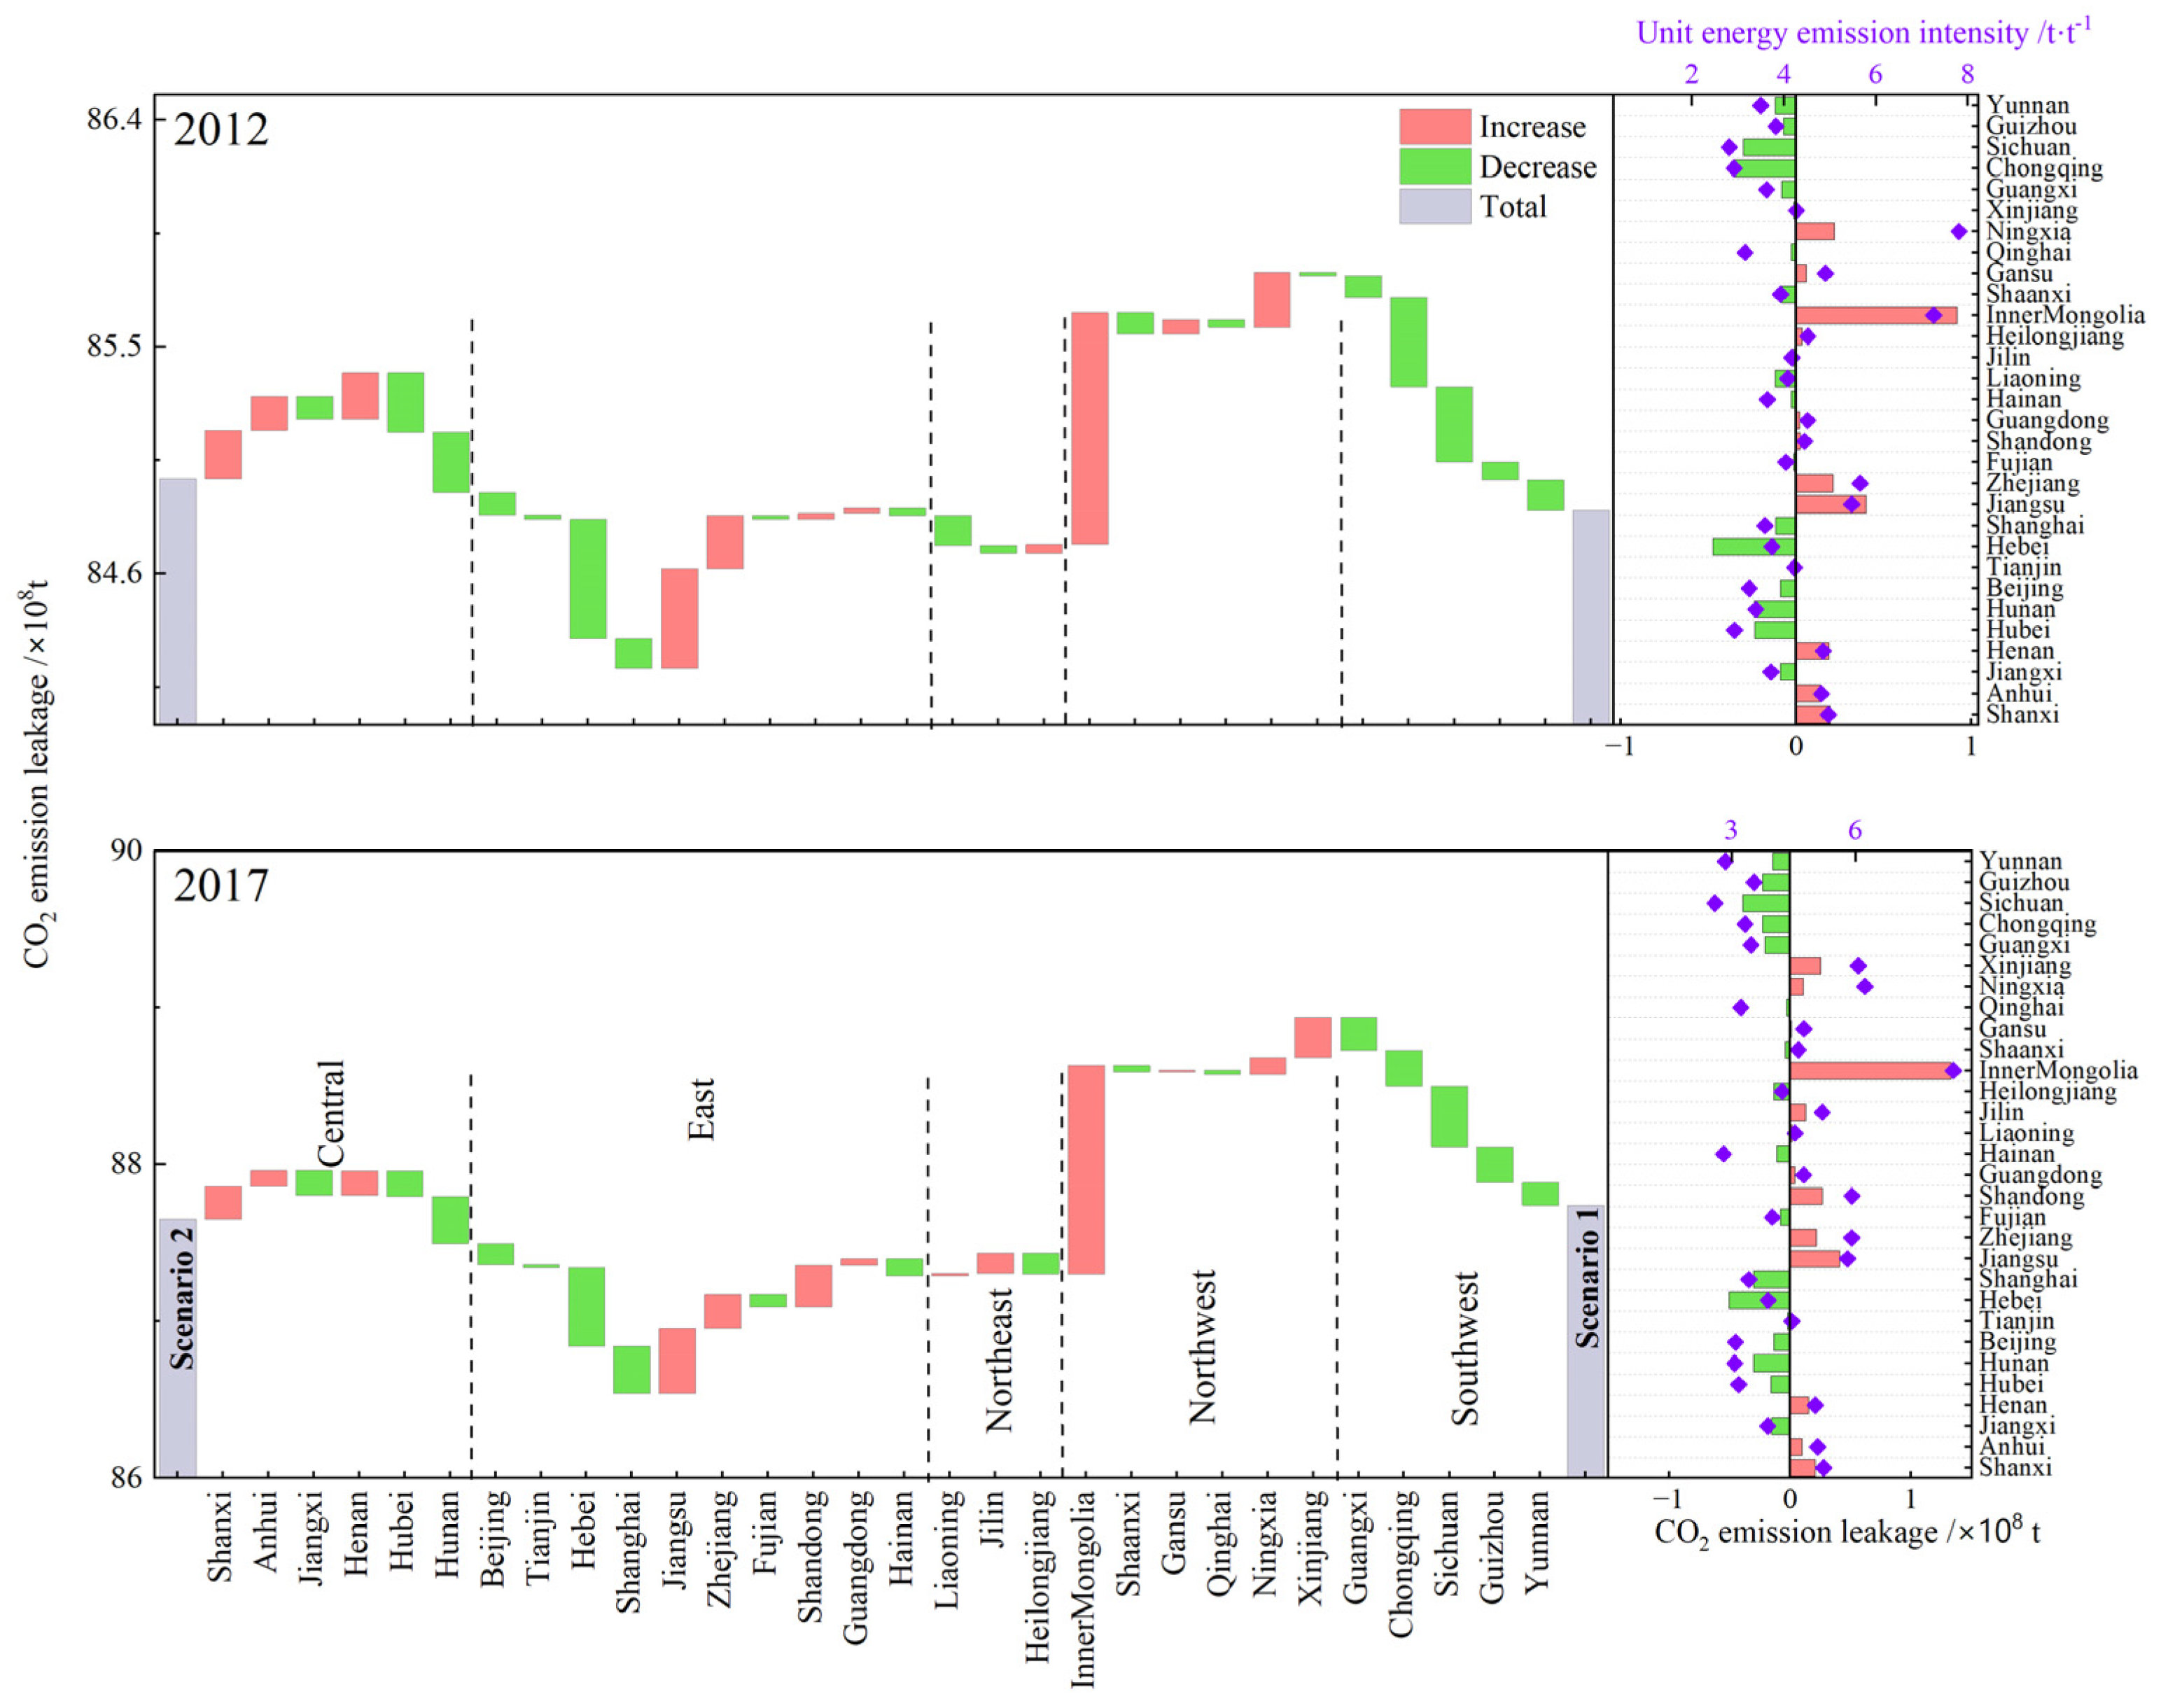
Figure 1 illustrates the “emission leakage” situation for CO
2 in each province. Red indicates positive leakage, while green indicates negative leakage. Purple squares represent the UEI for each province, and the central axis line in the small graph on the right represents the national average emission intensity.
The results indicate that “emission leakage” caused by inter-provincial trade shows significant variations across different provinces. Emission leakage can be categorized as positive and negative. Taking CO
2 as an example (see
Figure 1), during the period of 2012, some provinces in the central (Shanxi, Anhui, Henan), coastal (Jiangsu, Zhejiang, Shandong), and northwest (Inner Mongolia) regions exhibited significant positive leakage. The CO
2 leakage from these provinces accounted for 2.8% (2.4 × 10
8 t) of the national total CO
2 emissions. Notably, Inner Mongolia’s leakage accounted for 38.4% (0.9 × 10
8 t) of this total. These provinces rely extensively on abundant, inexpensive labor and inputs of energy and resources to supply other regions with highly pollutant-intensive products such as steel and cement. Furthermore, in 2017, the trend of CO
2 “emission leakage” in each province was similar to that in 2012. It is worth noting that in 2017, the leakage status of the three northeastern provinces and Xinjiang and Qinghai was exactly opposite to that in 2012, possibly due to adjustments in their energy and industrial structures. It is also observed that some provinces have UEI significantly higher than the national average emission intensity, but they do not experience severe emission leakage. Examples include Ningxia and Qinghai. This could be because these regions lack exportable resources, and their heavy industries are less advanced, resulting in fewer exports of pollution-intensive products. The inter-provincial export trade volume of Ningxia accounts for a mere 0.4% of the national inter-provincial export trade, with Qinghai at 0.04%. This reflects that the emission contribution of provincial-level emission intensity differences is not only dependent on emission intensity but also, to some extent, related to trade patterns.
Inter-provincial trade−related NO
x emission leakage is similar to that of CO
2 (see
Figure S2), but NO
x emissions show smaller variations. This is because all combustion of carbon-related fuels releases CO
2, and CO
2 emissions lack backend control and treatment measures. Among the provinces, Anhui, Henan, Jiangsu, Zhejiang, Shandong, Jilin, and Inner Mongolia show positive leakage for NO
x. For SO
2 and PM
2.5, due to the “Clean Production Action” implemented by the Chinese government from 2012 to 2017, there have been significant changes in PM
2.5 and SO
2 emissions in each province, with substantial reductions in annual emissions (see
Figures S3 and S4). Emission leakage of PM
2.5 in inter-provincial trade mainly exacerbated environmental pressures in the central (Shanxi, Anhui, Henan, Hunan) and southwestern (Guizhou, Guangxi) regions. The leakage status in 2012 for Jiangsu, Hubei, and Chongqing was exactly opposite to that in 2017. Emission leakage of SO
2 in inter-provincial trade mainly intensified environmental pressures in the central (Shanxi), coastal (Shandong), southwestern (Guizhou, Chongqing), and northwestern (Inner Mongolia, Shaanxi) regions.
3.2. Co-Effect Analysis of Embodied Emission Changes
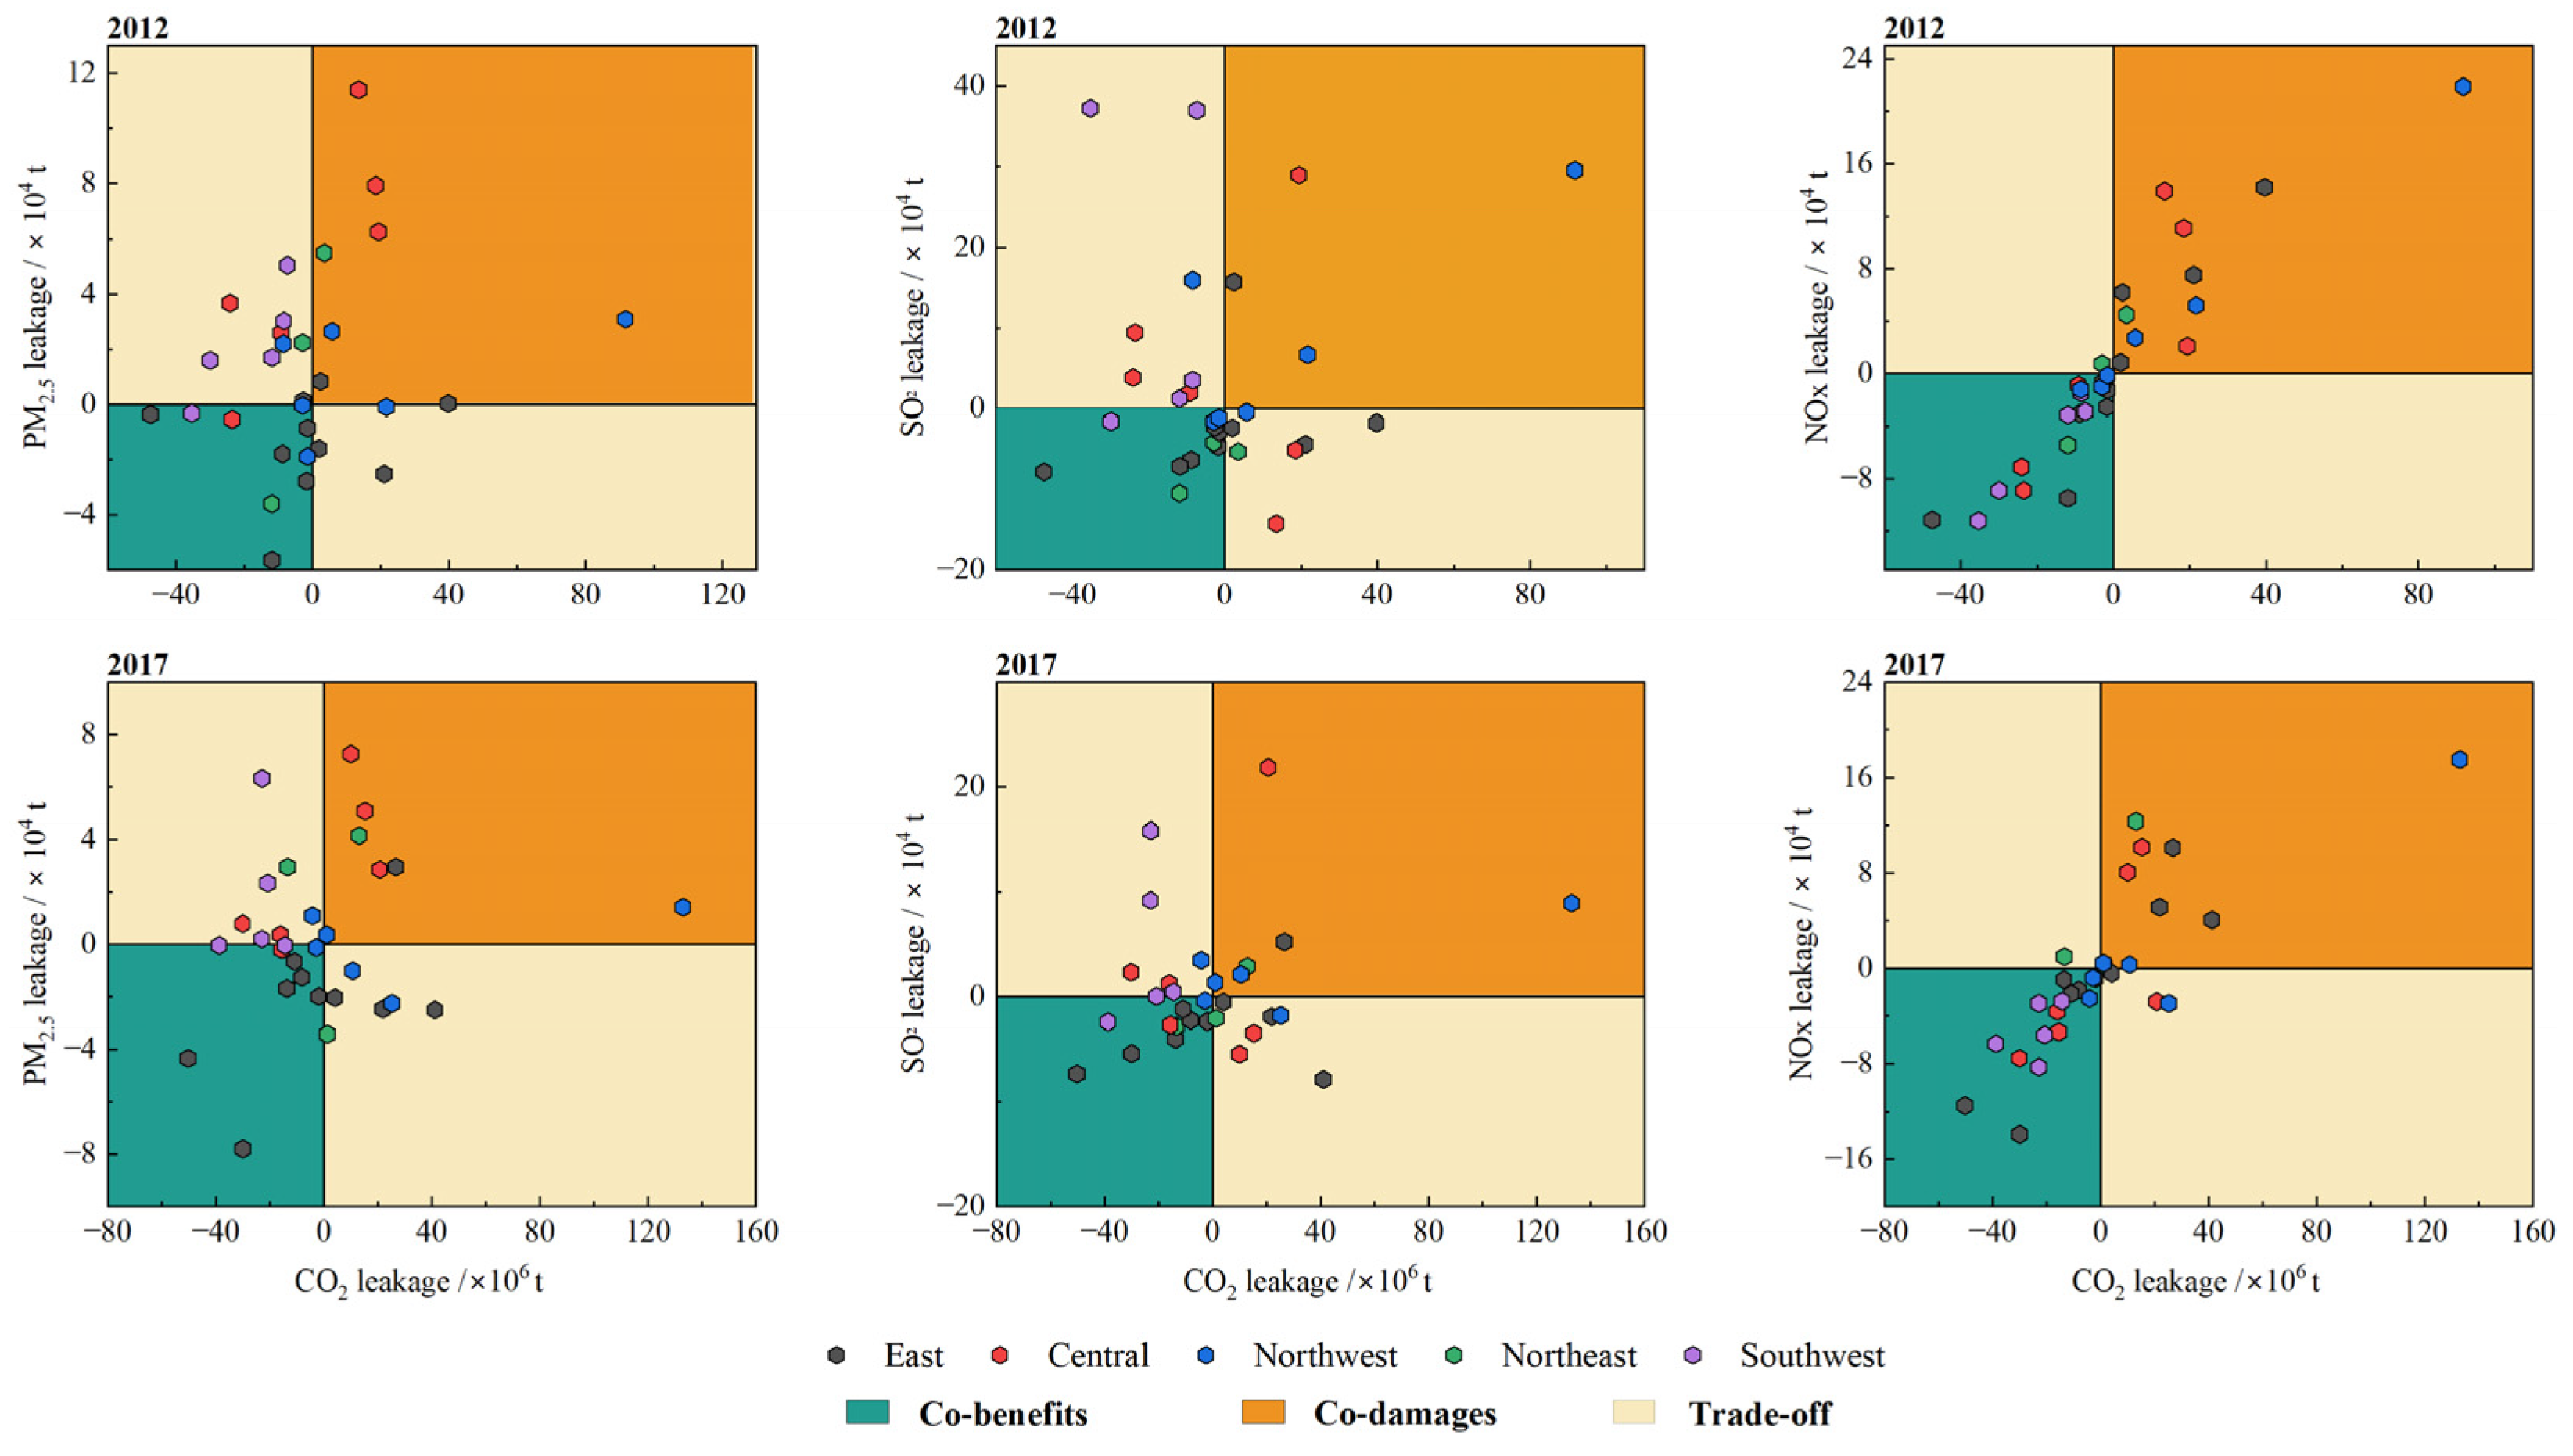
A co-effect coordinate system was used in this study to analyze the co-effects between CO2 and air pollutant emissions in inter-provincial trade. Co-effects are categorized as co-benefits, co-detriments, and trade-offs. The horizontal axis measures CO2 emissions, while the vertical axis measures emissions of air pollutants (PM2.5, NOx, SO2). Points in the first quadrant represent situations where inter-provincial trade simultaneously increases both CO2 and air pollutant emissions, indicating co-detriments. Points in the second and fourth quadrants represent situations where inter-provincial trade increases emissions of one pollutant while decreasing emissions of another pollutant, indicating trade-offs (lack of coordination). Points in the third quadrant represent situations where inter-provincial trade simultaneously reduces both CO2 and air pollutant emissions, indicating co-benefits. Based on these definitions, the co-effects of CO2 and air pollutant emission leakage in inter-provincial trade can be determined.
Figure 2 illustrates the co-effects of emission leakage in inter-provincial trade. For CO
2 and PM
2.5/SO
2, provinces that exhibited co-benefits in emission leakage caused by inter-provincial trade in 2012 and 2017 include Beijing, Shanghai, Tianjin, Hainan, and others. Provinces that showed co-detriments are Shanxi, Guizhou, Inner Mongolia, Gansu, and regions in the central and southwestern parts of China. However, some provinces demonstrated trade-offs, primarily Jiangsu, Zhejiang, Anhui, and others. This reflects the complexity and diversity of the co-effects induced by emission leakage from inter-provincial trade. On the other hand, for CO
2 and NO
x, emission leakage caused by inter-provincial trade in 2012 and 2017 showed both co-detriments and co-benefits, with only a few provinces experiencing trade-offs. This indicates synchronicity in emission leakage of CO
2 and NO
x in inter-provincial trade.
In summary, we found significant variations in the co-effects of provincial-level embodied CO2 and air pollutant emission leakage in 2012 and 2017, and the synergy levels of NOx/CO2 were greater than those of PM2.5/CO2 and SO2/CO2. The emission leakage of both CO2 and air pollutants from environmentally regulated and strictly monitored coastal developed provinces to central and western provinces is particularly pronounced. The former achieves emissions overflow of both CO2 and air pollutants by consuming products from other provinces through inter-provincial trade, with key provinces primarily concentrated in economically developed coastal regions with high environmental regulations and strict monitoring. The latter, which is dominated by heavy industry, bears the emissions of CO2 and air pollutants generated by the consumption demands of other provinces in inter-provincial trade. Key provinces in this category are mainly concentrated in the economically unbalanced, highly polluting, high-emission, and low-value-added central and western regions. Hence, enhancing coordinated control over trade-induced emissions of both CO2 and air pollutants in key provinces is a crucial step towards achieving multi-regional emission reduction through coordinated efforts.
3.3. Analysis of the Driving Factors of Embodied Emissions
In provincial trade, due to the influence of trade volume, industrial structures, energy structures, and emission coefficient differences among Chinese provinces, there are significant differences in the changes in embodied emissions among provinces. We used SDA to decompose the driving factors of embodied emission changes.
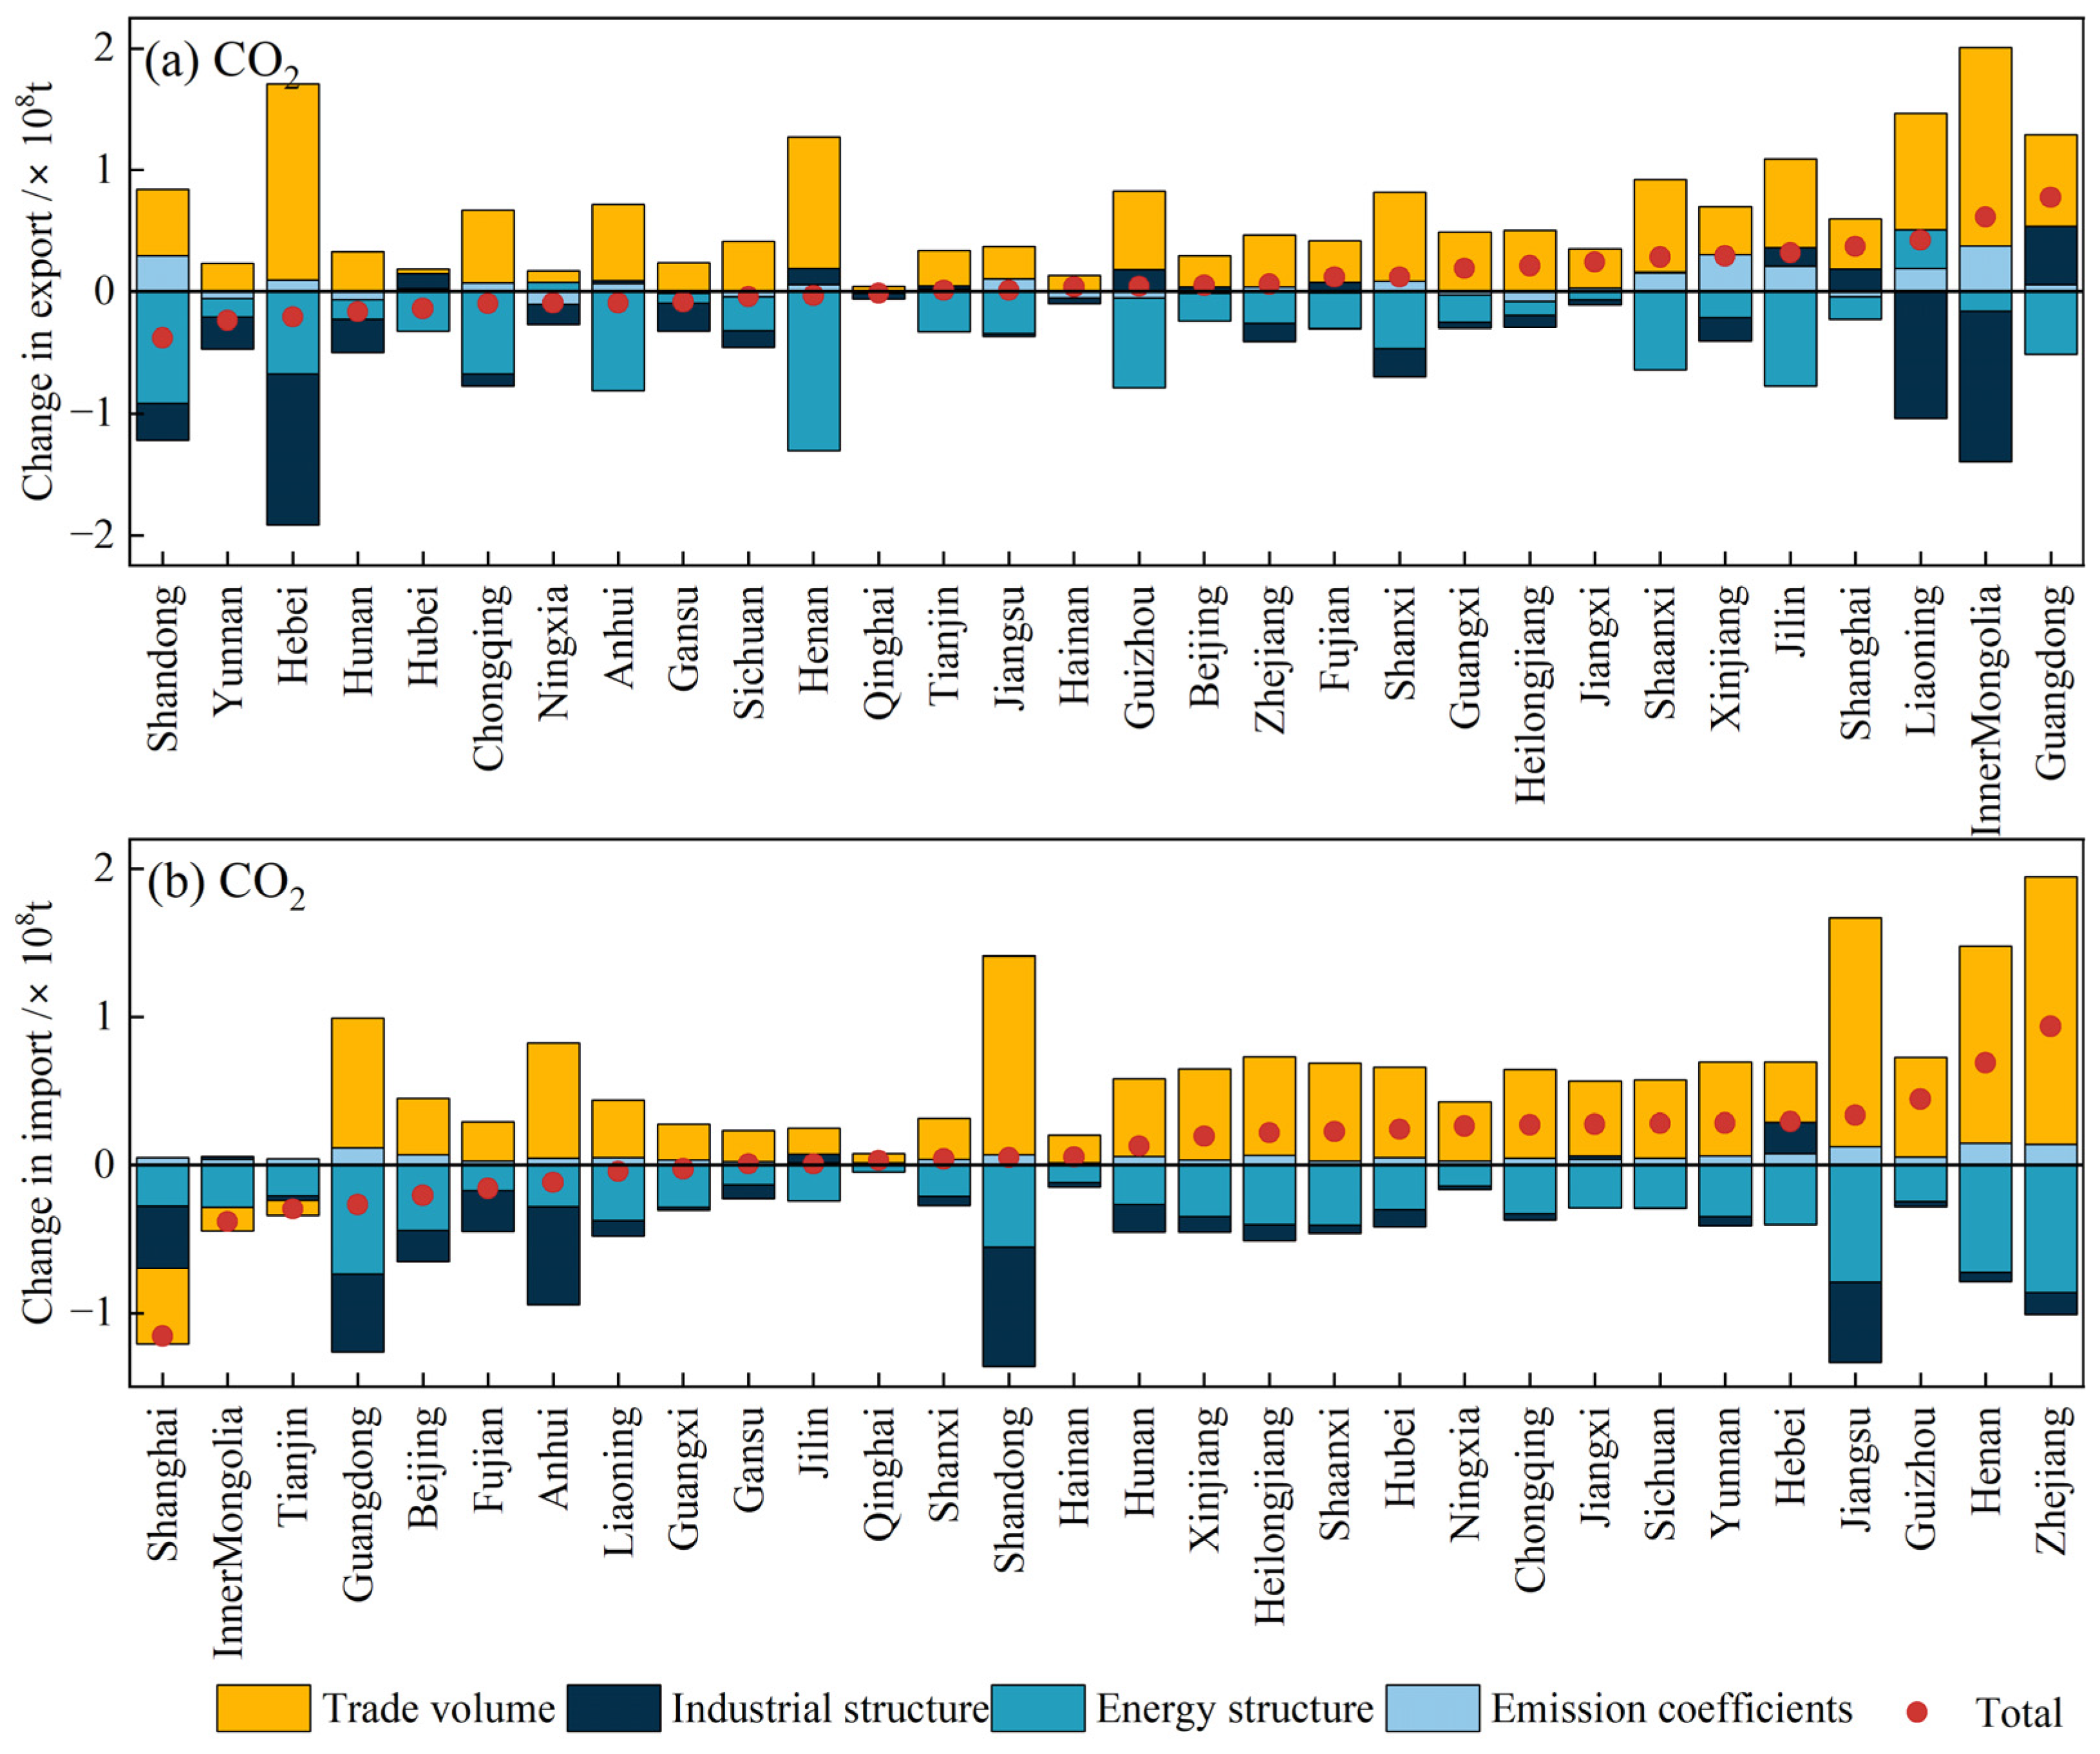
Figure 3a,b depict the changes in CO
2 emissions in inter-provincial exports (a) and imports (b) in different driving factors during the period from 2012 to 2017. It can be seen that, under the influence of different driving factors, CO
2 emissions (import or export) in various provinces have been affected to varying degrees.
For exports (
Figure 3a), the energy structure and industrial structure have different impacts on inter-provincial export CO
2 emissions for various provinces. In terms of the energy structure, Jilin, Anhui, Shandong, Henan, and Guizhou had the largest reduction in emissions, accounting for 43.1% of the total reduction in emissions from the energy structure. These provinces achieved more significant CO
2 emission reduction from the energy structure compared to the industrial structure. For instance, by the end of 2017, Shandong had reduced its total coal consumption by 20 Mt compared to 2012. Guizhou increased the proportion of clean energy usage in urban areas. In terms of the industrial structure, Hebei, Inner Mongolia, Liaoning, Shandong, and Hunan had the largest reduction in emissions, accounting for 92.3% of the total reduction in emissions from the industrial structure. For instance, after eliminating outdated production capacity and promoting industrial transformation and upgrading, by 2017, Hebei phased out conventional coal-fired units with a capacity below 10 × 10
4 kilowatts and reduced steel production capacity by 60 Mt. Inner Mongolia implemented relocation and transformation for heavily polluting enterprises in sectors such as thermal power, steel, and construction materials, while strictly controlling the addition of new capacity in the “two high” industries. During the period from 2012 to 2017, the trade volume played a dominant role in increasing inter-provincial export CO
2 emissions for various provinces. According to MRIO estimates, inter-provincial exports in these provinces increased by 78.4% during the period from 2012 to 2017. Some of this increase was offset by the energy structure and the industrial structure. Looking at imports (
Figure 3b), trade volume increased inter-provincial import CO
2 emissions for most provinces. The trade volume reduced import CO
2 emissions for Shanghai, Inner Mongolia, and Tianjin by 50.7 × 10
6 t, 15.9 × 10
6 t, and 10.1 × 10
6 t, respectively. The energy structure dominated the decreasing trend in import-related CO
2 emissions for various provinces. Additionally, it was observed that the emission coefficients had a limited impact on reducing CO
2 emissions for various provinces, as there were limited end-of-pipe control measures for CO
2.
For air pollutants, the changes in embodied emissions driven by provincial trade are different from CO
2 emission changes (see
Figures S5–S7). In terms of emission coefficients, because there are limited end-of-pipe control measures for CO
2, there are more control measures for air pollutants. The emission coefficients can reduce embodied emissions of PM
2.5, SO
2, and NO
x for almost all provinces; however, the impact of the emission coefficients varies among provinces. Furthermore, due to the fewer control measures for NO
x in provinces compared to PM
2.5 and SO
2, the emission coefficients have a smaller impact on NO
x than on PM
2.5 and SO
2. Additionally, we have observed that the impact of the trade volume on PM
2.5, SO
2, and NOx mirrors that on CO
2, resulting in an increase of 2.3 × 10
6 t for PM
2.5, 5.6 × 10
6 t for SO
2, 5.5 × 10
6 t for NO
x, and 15.9 × 10
8 t for CO
2. This signifies that the trade volume predominantly drives the escalation in both air pollutant and CO
2 emissions.
3.4. Co-Effect Analysis of the Driving Factors
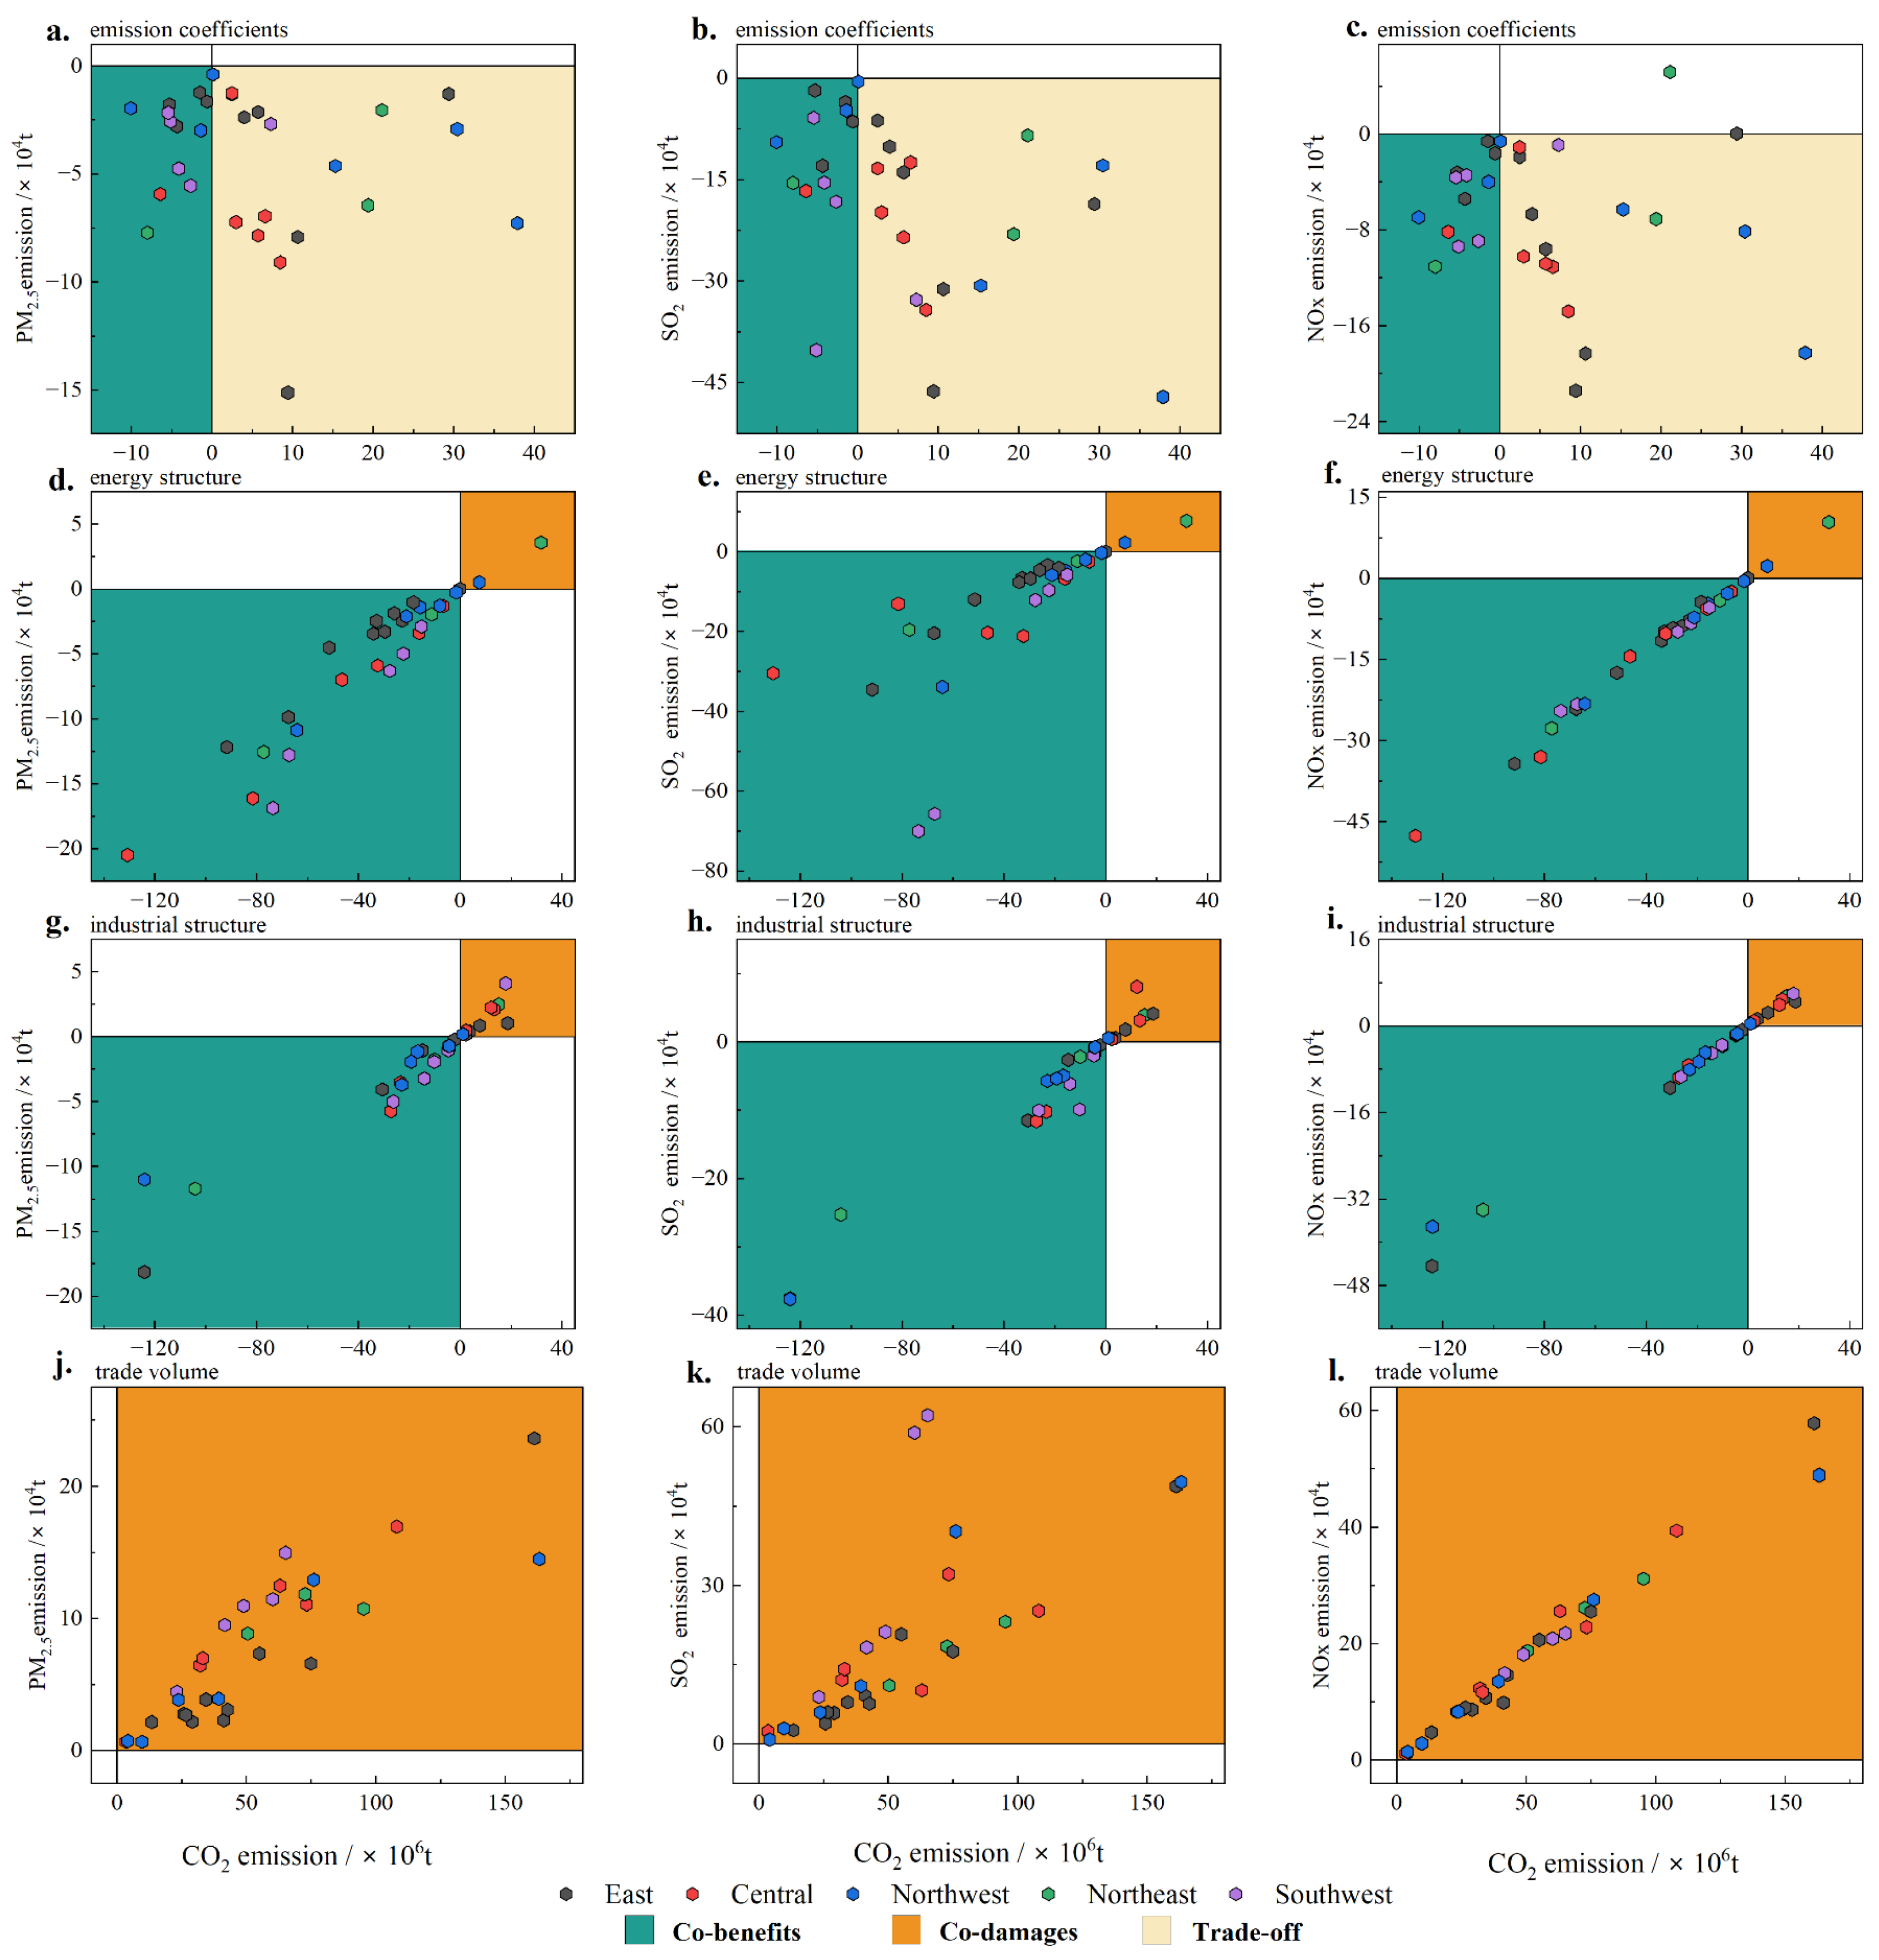
Figure 4 illustrates the coordination of various driving factors in inter-provincial trade. At the provincial level, there are significant differences in the coordination of driving factors for both CO
2 and air pollutant emissions.
In terms of emission coefficients, from 2012 to 2017, the changes in emission coefficients were a primary driver of the increase in embodied CO2 emissions and the decrease in air pollutant emissions for most provinces; a total of 16 provinces experienced trade-off. In other words, emission coefficients had a suppressive effect on embodied PM2.5, SO2, and NOx emissions in these regions. However, in Beijing, Shanghai, Fujian, Heilongjiang, Hunan, Guangxi, Sichuan, Gansu, Guizhou, Yunnan, and Ningxia, emission coefficients also brought varying degrees of co-benefits.
Regarding the energy structure, changes in the energy structure were the main drivers of decreased CO2 emissions and decreased air pollutant emissions in most provinces. Except for Liaoning, Hainan, and Ningxia, all regions generated co-benefits, accounting for 94% of the national consumption of primary petrochemical energy.
In terms of the industrial structure, changes in the industrial structure were the main drivers of increased or decreased CO2/air pollutant emissions. The industrial structure led to co-damage in 11 regions, mainly including coastal provinces (Beijing, Tianjin, Shanghai, Fujian, Guangdong) and central and western provinces (Anhui, Henan, Hubei, Guizhou, Shaanxi, Hebei). The reasons for this result might be the differences in regional economic development stages, industrial structures, and production technology levels.
Changes in the trade volume were the main drivers of increased CO2/air pollutant emissions. The trade volume led to co-damage in all provinces. This was due to the increase in consumption demand in all provinces from 2012 to 2017, leading to an increase in embodied CO2/air pollutant emissions.
3.5. Case Analysis
In
Section 3.4, we demonstrated through structural decomposition analysis that changes in the energy structure had the greatest co-benefits among all factors. The industrial structural and emission coefficients only produced co-benefits in specific provinces. This implies that adjusting the energy structure and improving the energy effect can facilitate the transformation from co-damage and trade-offs to co-benefits, thereby resulting in more co-benefits.
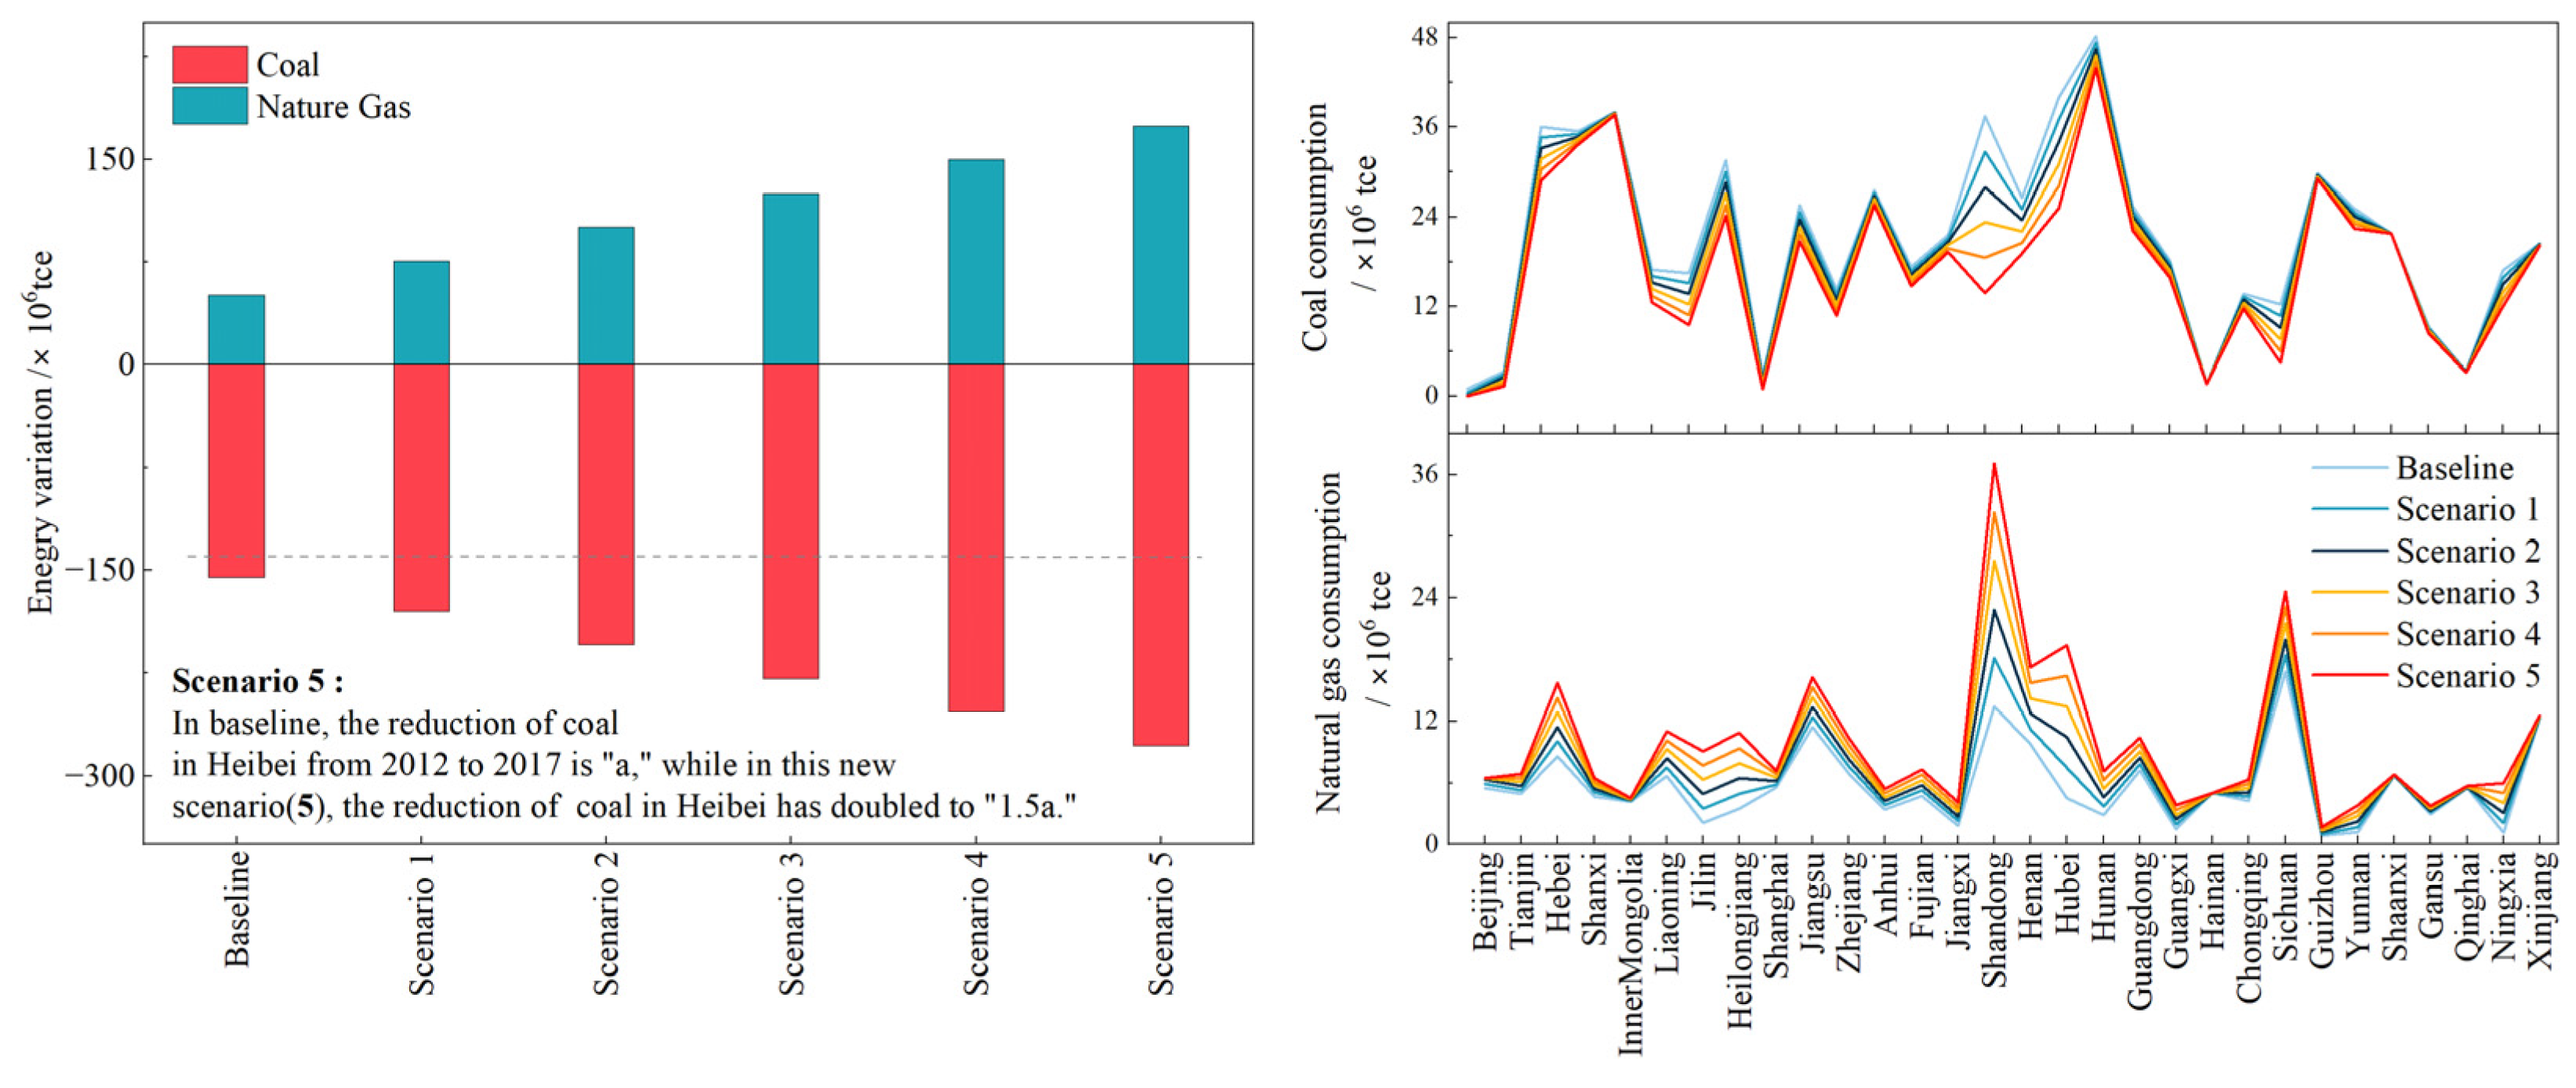
The scenario design principles were as follows: (1) Research Objective: The research objective was to demonstrate that changes in the energy structure can drive the transformation of co-damage or trade-offs into co-benefits to a certain extent. (2) Assumptions: It was assumed that the changes in total national and provincial energy consumption remain constant, meaning a reduction in coal consumption and a corresponding increase in natural gas consumption. (3) Basis: From 2012 to 2017, natural gas increased by 74 million tons of standard coal, and from 2017 to 2021, it increased by 104 million tons of standard coal. Therefore, in this scenario, natural gas can increase by a maximum of 178 million tons of standard coal. (4) Scenario Settings: Baseline Scenario: From 2012 to 2017, coal reduction is “a”, and natural gas increase is “a”. Scenario 1: Coal reduction is 1.1a, and natural gas increase is 1.1a. Scenario 2: Coal reduction is 1.2a, and natural gas increase is 1.2a. Scenario 3: Coal reduction is 1.3a, and natural gas increase is 1.3a. Scenario 4: Coal reduction is 1.4a, and natural gas increase is 1.4a. Scenario 5: Coal reduction is 1.5a, and natural gas increase is 1.5a. The goal was to ensure consistent changes in total national and provincial energy consumption in different scenarios. Therefore, a total of six scenarios were set, as shown in
Figure 5, related to the consumption of coal and natural gas in different scenarios relative to 2012.
Figure 6 illustrates the co-effects between the changes in CO
2 and air pollutant emissions in different scenarios. We found that substituting natural gas for coal can partially alleviate emission reduction pressures in certain provinces. It also facilitates the transformation of trade-offs and co-damage into co-benefits. Regarding CO
2 and PM
2.5/SO
2, only Guangdong province experienced co-damage. In Scenario 1, only Tianjin and Jiangsu transformed the trade-off between CO
2 and PM
2.5/SO
2 into co-benefits. In Scenario 3, Zhejiang also converted the trade-off between CO
2 and PM
2.5/SO
2 into co-benefits. For CO
2 and NO
x, in the context of continuous growth in energy consumption, Beijing, Shanghai, Fujian, and Guangdong experienced co-damages, while ten provinces, including Shanxi, Inner Mongolia, and Liaoning, exhibited trade-offs. This reflects that adjusting the energy structure cannot easily reverse the increase in CO
2 emissions brought about by the growing energy consumption. In Scenario 1, only Tianjin and Jiangsu transformed the trade-off between CO
2 and NOx into co-benefits, and Liaoning converted the co-damage between CO
2 and NO
x into trade-offs. In Scenario 3, Zhejiang converted the trade-off between CO
2 and NO
x into co-benefits.
Comparing different scenarios, it was found that Inner Mongolia, Shanxi, Hubei, and Hunan experienced the largest reductions in coal consumption, while Shandong, Sichuan, Hubei, and Jiangsu saw the most significant increases in natural gas consumption. However, the provinces that witnessed the transformation of synergies were Tianjin, Liaoning, Jiangsu, and Zhejiang. This demonstrates that substituting natural gas for coal not only helps alleviate local emission reduction pressures but also reduces pollutant emissions in other provinces, facilitating the transformation of trade-offs and co-damage into co-benefits in those provinces. In summary, for provincial-level co-effects, the impact of inter-provincial trade needs to be considered. Adjusting key synergistic driving factors not only benefits local reductions in CO2 and air pollutants but also encourages other provinces to transform trade-offs and co-damage into co-benefits. Therefore, inter-provincial trade helps us achieve more co-benefits.
4. Discussion
4.1. Uncertainty and Limitations
Despite our detailed analysis of the co-effects of embodied CO2 and air pollutant emissions in inter-provincial trade, our results still have uncertainties and limitations due to data and methodological constraints.
First, there is uncertainty in emission data. The Multi-resolution Emission Inventory for China (MEIC;
http://www.meicmodel.org/ accessed on 1 November 2023) was utilized in this study, and air pollutant emissions were estimated based on provincial sub-sector energy consumption proportions. To mitigate uncertainty from energy consumption data, we ensured input–output tables between provinces were equivalent based on the energy balance table for different sectors. While uncertainty persists, this approach has improved the accuracy of emissions to some extent.
Second, there is uncertainty in the SDA method. Inaccurate or incomplete data, due to limitations in economic data, may introduce uncertainty that impacts the accuracy of results. Economic data from the CEADs, which combine single-region table data and customs statistics data, were used in this study, enhancing data quality.
Furthermore, this study has some shortcomings that will be further explored in future related research.
First, the co-effects of embodied CO2 and air pollutant emissions in inter-provincial trade are subject to data timeliness and require regular updates to address this issue. The national input–output table (42 sectors) is currently updatable until the year 2020. However, the multi-regional input–output table (30 provinces, 42 sectors) was only updated until 2017, and the multi-regional input–output table for China in 2021 has not been published yet. The multi-regional input–output table used in this study is sourced from the China Emission Accounts and Datasets (CEADs). Second, policy recommendations related to coordinated control do not incorporate constraints from future economic development, energy consumption, and other factors. Third, a structural decomposition analysis method was employed in this study to explore differences in the co-effects of emission coefficients, the energy structure, the industry structure effect, and the trade volume. However, the driving factors behind co-effects in embodied CO2 and air pollutant emissions also include other economic factors, population factors, and more, which need further investigation. Fourth, this study primarily focuses on the provincial-level co-effects and does not consider sector-level co-effects because sector-level co-effects are not the main focus of this paper. Nevertheless, sector-level co-effects still warrant in-depth exploration in future research.
4.2. Discussion
Between 2012 and 2017, the Chinese government formulated and implemented various measures to control air pollution, such as the 2013 promulgation of the “Action Plan for Air Pollution Prevention and Control”; terminal control devices were installed for pollution-intensive industries (thermal power, non-metallic and metallic smelting and processing, and chemical engineering), leading to a reduction in the emission of air pollutants in central and western provinces such as Shandong, Inner Mongolia, and Hebei. However, the central and western regions played a dominant role in supporting the development of downstream industries in coastal areas. These regions directly or indirectly imported a large amount of raw materials or energy for coastal areas through trade [
47,
51]. This implies that, to some extent, the central and western regions have become a “pollution haven” for the consumption and industrial transfer of coastal provinces, consistent with previous research results [
10,
52]. Despite the strict emission reduction measures implemented by the Chinese government, the central and western regions still face new environmental issues when integrating into the national supply chain. Emission leakage caused by inter-provincial trade is often overlooked, leading to a lack of overall co-benefits.
We explored the co-effects between embodied CO2 and air pollutant emission leakage at the provincial level, filling a research gap in this field. At the provincial level, identifying co-damages or trade-offs at the provincial level through inter-provincial trade is beneficial for further reducing CO2 or air pollutant emissions. Provinces such as Beijing, Shanghai, and Guangdong not only transferred emission-intensive industries through trade but also increased the share of clean energy, resulting in co-benefits occurring only in these provinces. For the central and western regions, despite a significant improvement in production technology, leading to a reduction in air pollutant and CO2 emissions, the co-benefit remains much lower than that in key provinces (eastern regions, Beijing–Tianjin–Hebei, Yangtze River Delta). Additionally, they need to consume more resources and energy to support downstream industries in coastal areas. The substantial industrial CO2 produced during energy consumption and raw material production processes is challenging to reduce through production technology upgrades or specialized equipment, leading to trade-offs and co-damages in most central and western regions. Therefore, urgent action is needed to reduce CO2 emissions, crucial for alleviating and avoiding trade-offs and co-damages during the development process. Furthermore, due to significant differences in industrial structure, environmental protection policies, and production technologies among provinces, the impact of measures such as eliminating outdated capacity, restricting high-energy-consuming products, and increasing the proportion of clean energy is more significant on high-energy-consuming provinces like Inner Mongolia, Shanxi, Hebei, Shandong, while having a smaller impact on less developed provinces (Qinghai, Gansu). For these less developed provinces, upgrading industrial structures and technological progress may be essential pathways to change the current situation. Against this backdrop, the regional differences in inter-provincial co-effects deserve further attention.
At the same time, we identified the key driving factors of provincial co-effects by applying SDA, which is crucial for the Chinese government to formulate more effective emission reduction policies. The results indicate that changes in the energy structure are critical factors in reducing CO
2 and air pollutant emissions. Secondly, changes in emission coefficients and the industrial structure are also significant. The changes in the trade volume are the main drivers increasing CO
2 and air pollutant emissions. Furthermore, through case studies, it is demonstrated that changes in the energy structure can reduce embodied CO
2 and air pollutants, thus achieving multi-regional coordinated control (see
Figure 6). In other words, the proportion of natural gas to coal in the energy structure is also an essential factor affecting coordinated control, especially for SO
2 and CO
2. For instance, in regions with high coal consumption such as Jiangsu, Liaoning, and Zhejiang, replacing coal with natural gas not only helps alleviate local emission reduction pressure but also reduces the consumption of coal. This not only benefits local emission reduction but also reduces embodied air pollutant and CO
2 emissions, facilitating the transformation of co-damage and trade-offs into co-benefits. Therefore, the government should pay more attention to the differences in provincial-level co-effects, which are crucial for reducing CO
2 and air pollutant emissions and promoting regional environmental equity.
4.3. Policy Implications
The new findings of factors, attributes, and regional disparities of co-effects in this study provide some significant policy implications.
Firstly, policies should be aimed at converting trade-offs and co-damage to co-benefits. The high-energy-consumption and emission-intensive production methods in underdeveloped central and western provinces constitute a primary driver of environmental pollution in China. Transforming the co-damage of consumption to co-benefits is possible via green supply chains and clean production. Downstream provinces in the supply chain should expedite the development of green technologies to reduce both air pollution and CO2 emissions. Provinces with significant emission intensity and transfer, such as Hebei, Inner Mongolia, Shandong, and Heilongjiang, where emission-intensive industries constitute a substantial proportion of industrial activities, necessitate government efforts to promote technological innovation. This involves increasing subsidies to support technological innovation by enterprises and providing fiscal support for industrial upgrades. Simultaneously, imposing environmental taxes on locally emission-intensive enterprises would incentivize the adoption of cleaner production technologies and the implementation of clean technology production to reduce pollutant emissions.
Secondly, based on the principles of production and consumption accounting, within the current joint prevention and control mechanism for air pollution, establishing a combined responsibility for production and consumption is essential. This implies that economic entities must bear not only the emission responsibility as producers but also the emission responsibility as consumers. Through producer responsibility, pollution costs serve as constraints, encouraging producers to adopt cleaner production methods. Through consumer responsibility, consumers drive producers to implement clean production practices. Moreover, in the supply chain, combining shared responsibility between upstream and downstream enterprises requires upstream enterprises to jointly bear the environmental impact of downstream enterprises during the production process, thereby reducing emissions. For example, upstream enterprises may prefer downstream enterprises with lower emission intensity, higher resource efficiency, and lower pollution emissions. Therefore, shared responsibility may achieve emission equality among different regions.
Thirdly, enhancing inter-regional cooperation and establishing compensation policies for atmospheric pollutant governance at the provincial level, along with pollution emission rights trading, is crucial. On one hand, due to the transfer of emissions caused by developed coastal provinces importing low-cost intermediate products to meet their consumption needs, substantial economic support or compensation for atmospheric pollution governance in underdeveloped provinces can be provided through funds, technology, or environmental taxes. On the other hand, promoting emission reduction initiatives in underdeveloped provinces can be facilitated through emissions trading. In the trading market, underdeveloped provinces can obtain emission quotas through their advantages and receive compensation by selling resources and high-energy-consuming products. Conversely, developed provinces can promote cleaner production in other provinces by selling advanced production technologies and acquiring products from other provinces.
5. Conclusions
Transforming co-damage and trade-offs into co-benefits through inter-provincial trade may be a new strategy for promoting pollution reduction and carbon mitigation. In this study, we observed that from 2012 to 2017, inter-provincial trade-induced emission leakage of air pollutants (PM2.5/SO2/NOx) gradually decreased in its contribution to national emissions, while inter-provincial trade-induced emission leakage of CO2 increased in its contribution to national emissions. Furthermore, we categorized the co-effects between embodied CO2 and air pollutant emissions into co-benefits, trade-offs, and co-damage to reveal the variations among provinces. Co-damage and trade-offs were primarily concentrated in central and western provinces, while co-benefits occurred in specific provinces only.
More importantly, the key driving factors of provincial-level co-effects from 2012 to 2017 were identified. Among these factors, changes in the energy structure had the most significant co-benefits among all factors, while the industrial structure and emission coefficients only generated co-benefits in specific provinces. Changes in the trade volume led to more co-damage. However, due to the growth in energy consumption, emission coefficients became the primary driver of trade-offs in all provinces.
The case analysis demonstrated that by focusing on key driving factors, inter-provincial trade can not only reduce CO2 and air pollutants in Tianjin, Liaoning, Jiangsu, and Zhejiang but also promote the transformation of provincial-level co-damage and trade-offs into co-benefits.


