
Assessment of Student Quality of Life in Relation to University Campus


Abstract
1. Introduction
- What is the influence of the university’s built environment and students’ satisfaction with campus life on QoL, given students’ personal characteristics, and how do these factors interrelate?
- What is the influence of the indoor and outdoor areas of the university campus on student QoL? Which spaces have a more significant impact on QoL, and how does satisfaction with these spaces correlate with each other, as well as with academic achievement and social life?
- What is the extent and orientation of the influence of education spaces on academic progress, contentment with campus life, perception of administrative management, and QoL?
- What impact do social and recreational facilities on the university campus have on students’ satisfaction with their social life, academic growth, and general perception of QoL?
- How does the quality of the housing environment affect the satisfaction, social life, and QoL of the students?
- What factors influence students’ perception of academic achievement and administrative management, and how do they affect QoL?
2. Literature Review Regarding Life Satisfaction, Health and Built Environment Satisfaction in University Campuses
2.1. Overall QoL and Healthy Life at University
2.2. Satisfaction with Food-Beverage Areas and Residence Life on University Campus
2.3. Effect of Personal Characteristics on Life Satisfaction
2.4. Research Regarding Effects of Green Areas and Recreational Facilities on Health and Life Satisfaction
2.5. QoL Regarding Transportation
2.6. Parameters Affecting Satisfaction with Built Environment in University
2.7. Satisfaction and Academic Performance Regarding Classroom Spaces

| Area of Focus | Author | Aim/Focus | Methodology | Findings |
|---|---|---|---|---|
| Overall QoL and healthy life at university | Sirgy et al. 2007 [45,48] | To investigate satisfaction with academic and social life, university facilities, and overall QoL | Survey of students using the developed QoL model, which assessed their satisfaction with various aspects of college life (such as social, academic, and service satisfaction) in the US. | Satisfaction with college life is related to satisfaction with academic and social aspects on campus, which emerges as related to satisfaction with the facilities and services of college. |
| Dodd et al. 2024 [45] | To explore the priorities of students and how different components of the university campus (physical, social, and academic) contribute to the overall QoL of students | Survey of students through a conceptual model that integrates different components of the university environment (physical, social, and academic) and their impact on student well-being. | A supportive university environment, with high-quality physical spaces, strong social networks, and effective academic support, as well as financial independence, enhances students’ QoL. | |
| Rodrigues et al. 2009 [50] | To develop a model to assess university campus life quality and to help university management analyze and improve public spaces, facilities, and structure of campuses. | To propose a multi-dimensional analysis of campus QoL from user opinions. A model is developed to evaluate future campus interventions. A web-based system monitored the QoL at the university in Portıgal. | The system demonstrated its utility as a decision-making tool by allowing campus managers to compare the effects of different planning scenarios on QoL dimensions. Safety is emphasized as a significant variable in the perception of QoL. | |
| Ramón-Arbués et al. 2022 [52] | To evaluate the QoL of a group of Spanish university students and investigate the sociodemographic, behavioral, and academic factors that impact their QoL | Survey with 868 Spanish students using the WHOQOL-BREF questionnaire, as well as self-esteem (Rosenberg Self-Esteem Scale), physical activity (International Physical Activity Questionnaire), diet (Spanish Index of Healthy Eating), alcohol consumption (CAGE questionnaire), and sleep quality (Pittsburgh Sleep Quality Index) | Personal variables such as body mass index and age, as well as satisfaction with academic performance, sleep quality, and a healthy diet, substantially impact the QoL. Also, students who are younger and have better academic performance have enhanced QoL. | |
| Tavakoly et al. 2021 [53] | To examine how subjective norms, general health, optimism, and attitude affect life satisfaction and QoL in university students. | A questionnaire was applied to students in five universities in Iran | Subjective norms, general health, optimism, and attitude significantly predict students’ QoL. General health and life satisfaction showed the strongest association with QOL. | |
| Effect of personal characteristics on life satisfaction | Chow, 2005 [56] | To examine the life satisfaction of university students | A questionnaire survey was conducted with 315 university students exploring social relationships, academic experience, and socio-economic status | Life satisfaction included higher socio-economic status, better academic performance, self-esteem, and good relationships with family and significant persons. Additionally, satisfaction with their living environment and living conditions also contributed to higher levels of life satisfaction. |
| Hong and Giannakopoulos, 1994 [57] | To examine differences in life satisfaction based on age, sex, and university status | Satisfaction With Life Scale developed by Diener et al. (1985) was administered to participants. | No significant differences in life satisfaction were detected by sex or university status. However, life satisfaction was higher in 30–40-year-olds. Age, sex, and university status did not interact significantly. The findings indicate that maturity and age affect life satisfaction more than sex or academic rank. | |
| Al-Shaer et al. 2024 [58] | To investigate how religiosity and social connectedness influence the mental health and overall QoL of university students with disabilities | Surveys measuring religiosity, levels of social connectedness, mental health (using standardized mental health scales), and QoL (using the WHOQOL-BREF scale) were administered to students with disabilities at various universities. | Religion and social connection significantly decreased the mental health and QoL impacts of disability. Religious and socially connected students had superior mental health and QoL scores. Religion provided emotional resilience, whereas social connectedness reduced loneliness, improving mental health. | |
| Satisfaction with on-campus residence life | Botha et al. 2015 [54] | To identify the determinants of student satisfaction with their campus residence life and to assess how these factors contribute to overall student well-being and academic success. | The 2011 Quality of Residence Life (QoRL) Survey was utilized with approximately respondents at a South African university. The characteristics of the residential environment, drugs and alcohol, safety, and individual characteristics are addressed. | Housing type, residential environment quality, drug and alcohol problems, and campus and residence safety all affect student satisfaction. The pleasure and peacefulness of the home environment, along with its well-maintained and clean surroundings, increase housing-life happiness, even if no significant differences were found by race or gender. Safe campus walks and safe residence rooms increase residence-life satisfaction. |
| Satisfaction with food—beverage | Noh et al. 2023 [55] | To investigate the key factors influencing student satisfaction with food services | A survey was distributed to students at the UiTM Puncak Alam campus in Malaysia. The survey was based on the DINESERV instrument, which evaluates multiple service quality dimensions such as food quality, service quality, ambiance, and price. | Convenience of location is the most important factor affecting satisfaction with food and beverage facilities, followed by price, service quality, and ambiance. |
| Effects of green areas on health | Giles-Corti and Donovan, 2002 [63] | To examine the relative influence of individual, social, and physical environmental factors on recreational physical activity, assessing the importance of recreational facilities. | A community survey was conducted to assess individual (e.g., motivation, demographic factors), social (e.g., social support), and physical environmental (e.g., access to recreational facilities) determinants of physical activity in Australia. | Individual and social environmental factors were the strongest predictors of physical activity with the physical environment. The impact of green spaces on health is influenced by factors such as their size, appeal to diverse persons, safety, and aesthetic aspects. The findings suggest that strategies to promote physical activity should address not only environmental access but also individual motivation and social support systems |
| Lachowycz and Jones, 2013 [64] | To clarify the mediators and moderators involved in the relationship between greenspace and health, such as physical activity and psychological well-being, while addressing gaps in the existing literature | By reviewing existing empirical studies on the effects of green space exposure, drawing on social-ecological theories to identify potential mediators (use of greenspace, perceptions of the living environment) and moderators (gender, socio-economic status, greenspace type), a conceptual framework is proposed. | Mediators like the use of greenspace and perceptions of the environment drive the association between greenspace and both physical and psychological health. Moderators such as socio-economic factors, greenspace type, and living context can influence the strength of these relationships. | |
| White et al. 2017 [65] | To examine the impact of the quality and proximity of green spaces on people’s frequency of visits and their well-being | A nationally representative survey of urban and peri-urban residents in England was conduced. The study assessed three types of exposure to natural environments: neighborhood exposure, frequency of visits, and specific visits. | The study found that visit frequency to natural environments was associated with higher eudaimonic well-being, and a specific visit to nature was linked to higher positive experiential well-being. | |
| Andreucci et al. 2019 [68] | To illustrate how urban green–blue infrastructure can support mental health and healthy aging | A review of case studies from international projects that focus on “mental health-sensitive” open space design is made to investigate the contribution of nature to mental health, particularly for elderly people diagnosed with mental disorders. | Well-designed urban green–blue infrastructure can significantly support mental health and the overall well-being of elderly populations. | |
| Mitchell, 2013 [69] | To investigate if regular physical activity in natural environments is associated with better mental health outcomes compared to physical activity in non-natural environments | Data from the 2008 Scottish Health Survey was utilized, which included information on the environments in which respondents were physically active. | Physical activity in natural environments is associated with a significantly lower risk of poor mental health compared to physical activity in other environments. | |
| Recreational facilities of campus environment | Hajrasouliha, 2017 [51] | To develop and validate the Campus Score index to measure the quality of university campuses in terms of urbanism, greenness, and on-campus living and to assess how these are related to educational outcomes | Campus Score was calculated using three latent variables: Urbanism, Greenness, and On-Campus Living, with 10 indicators. The index was applied to universities in the US. | The quality of a university’s physical campus environment can have a measurable impact on student success. The campus score index developed in this study establishes a design framework that highlights the physical attributes necessary for generating secure and sustainable campus environments. |
| Aydin and Er, 2008 [70] | To assess the quality of the university campus as an outdoor space, exploring its role in providing individual and social benefits for campus users. | A survey was conducted with students in Turkey, inquiring about their use of outdoor campus spaces, the qualities they valued, and their purposes and frequency of campus usage. | Well-maintained, accessible, and aesthetically pleasing outdoor spaces significantly contribute to enhancing user experience. | |
| Ellis et al. 2002 [61] | To examine how frequently participating in campus recreation services correlates with health and QoL among university students. | Survey data were collected from a random sample of students from a Western university. The survey assessed six measures of health and QoL, including satisfaction with life, time usage, university experience, energy levels, and how emotional and physical health affected social functioning. | Students who participated more frequently in campus recreation had better overall satisfaction with life and social functioning. There is a correlation between health and QoL and satisfaction with the university. | |
| Hipp et al. 2016 [60] | To explore the relationship between students’ perceptions of the greenness and restorative qualities of their university campus and how these perceptions affect their QoL. | A survey was conducted with students measuring the perceived greenness of their campus, the perceived restorativeness of campus environments, and their QoL using the World Health Organization QoL Scale. | Students who perceived their campus as greener reported higher levels of QoL. | |
| Holt et al. 2019 [59] | To explore the relationship between different types of green space usage and indicators of health and well-being among university students | A survey was conducted with undergraduate students at a university with accessible green spaces. | Students who frequently engaged with green spaces actively reported higher levels of QoL, better overall mood, and lower levels of perceived stress. | |
| McFarland et al. 2008 [62] | To investigate how the use of campus green spaces correlates with university students’ perceptions of their overall QoL, including factors like life satisfaction and satisfaction with the university environment | A survey was conducted with undergraduate students at a university in Texas, gathering data on their frequency of use of campus green spaces and their QoL using a questionnaire. | Students who frequently used campus green spaces reported higher levels of QoL compared to those who rarely used them. | |
| Transportation | Iamtrakul et al. 2023 [71] | To explore how the built environment influences transportation-related QoL in an urban setting, using a case study in Bangkok, Thailand. | The study utilized GIS for spatial analysis and deep learning techniques with face-to-face interviews using a questionnaire survey to evaluate the built environment’s impact on QoLT. | Satisfaction with transportation-related QoL was significantly influenced by the built environment, including accessibility to transport systems, safety, and transport costs. |
| Satisfaction with Built Environment in University | Hamad, 2019 [72] | To assess the impact of the university’s built environment on female students’ quality of academic life, particularly focusing on a Saudi university context. | A case study was made involving surveys and observations of female students. | The quality of the built environment, particularly academic space availability and design, significantly influenced student satisfaction with academic life. Well-designed spaces improved academic achievement and well-being, while poor design or inadequate facilities adversely affected students. |
| Kim et al. 2018 [73] | To understand the relationships between students’ space choices, space rejections, and their overall satisfaction with campus facilities. | Surveys and post-occupancy evaluations from 330 university students to gather data about their daily activities and space preferences on campus. The data analysis identified patterns of space use, rejection, and satisfaction, focusing on various types of campus spaces. | Factors like space layout, environmental performance, and equipment adequacy influenced the satisfaction with space. | |
| Jasić and Kaludjerović, 2015 [74] | To assess the QoL of students at the University of Tuzla by analyzing various dimensions such as physical and psychological health, independence, social relationships, and environmental factors | A survey that measured students’ self-assessments of their QoL using Cummins’ four domains of life quality was conducted. | QoL is adversely affected by high levels of dissatisfaction with the university environment. | |
| Effects of classroom spaces on learning | Marchand et al. 2014 [75] | To examine whether environmental comfort factors in classroom settings, when set either within or outside of a comfort zone, would influence undergraduate student learning, mood, and perceptions of the classroom’s impact on their performance | An experimental study was conducted that manipulated classroom environmental conditions. Participants were undergraduate students who engaged in listening and reading tasks, and their performance on these tasks was assessed. | Optimal classroom environmental conditions are essential for improving student performance and well-being. |
| Scott-Webber et al. 2013 [76] | Using a post-occupancy evaluation method to assess whether an intentionally designed active learning environment would influence student engagement compared to traditional classrooms. | An evaluation instrument was used to measure student engagement before and after implementing new learning spaces designed for active learning. | New active learning environments had a positive impact on student engagement. | |
| Dyck, 2002 [77] | To examine the impact of the physical characteristics of the space on student outcomes | Review of the literature and observations considering six spatial dimensions: aesthetics, spatial factors, light, noise, color, and temperature | Well-designed facilities with enough space and arrangement facilitate learning. Natural lighting, minimal noise, color psychology, and suitable temperatures affect students’ concentration, academic performance, and well-being. |
3. Case Study
3.1. Study Area
3.1.1. Student Life on University Campus
3.1.2. Built Environment of University Campus: Socio-Cultural and Recreational Facilities
3.1.3. Built Environment: Education Buildings
3.1.4. Built Environment in University: Accommodation Facilities
3.2. Methodology
3.3. Data Analysis
4. Results
4.1. Data Regarding Personal Characteristics
4.2. Data Regarding the Opinions on the Dimensions of the QoL Scale
4.3. Data on the Comparison of QoL Scale Dimensions and Personal Characteristics
4.4. Data on the Correlations between QoL Scale Dimensions and the Overall Scale
5. Discussion
6. Limitations
7. Conclusions and Recommendations
- The university’s built environment, life in the university, and individual characteristics are all effective in the QoL assessment of university students in interaction.
- The sub-dimensions affecting QoL, sorted from highest to lowest, are satisfaction with campus life, education spaces, personal (academic) development, socio-physical amenities, social perception, administrative management, accessibility and transportation, and accommodation.
- High-quality education, the primary factor for university preference, is also significant for student QoL. Students who perceived the quality of education as very good had enhanced academic development and social perception, as well as higher satisfaction with educational spaces and socio-physical facilities.
- While satisfaction with the sizes, spatial arrangement, and availability of equipment in educational spaces is essential, the effective utilization of green areas, satisfaction with dining and socializing spaces, the diversity and spatial attractiveness of social facilities, along with accessibility and affordability on campus, should be ensured for students’ QoL.
- In the context of the university life dimension influencing QoL, the perception of an inclusive and multicultural environment and safety were closely linked to social perceptions.
- Satisfaction with administrative management significantly impacts all aspects of QoL, which differ among faculties.
- The statistics indicate that overpopulation in dormitories adversely affects spatial organization, comfort, personal space, and security, hence diminishing QoL.
Funding
Institutional Review Board Statement
Informed Consent Statement
Data Availability Statement
Conflicts of Interest
Appendix A. Tables Including Data
| Scale Mean When the Item Is Deleted | Item-Total Correlation When the Item Is Deleted | Corrected Item-Total Correlation | Multiple Correlation | Cronbach’s Alpha When Item Deleted | |
|---|---|---|---|---|---|
| i1 | 178.35 | 909.37 | 0.59 | 0.58 | 0.95 |
| i2 | 178.56 | 914.01 | 0.51 | 0.50 | 0.95 |
| i3 | 178.36 | 914.11 | 0.50 | 0.48 | 0.95 |
| i4 | 178.34 | 913.45 | 0.53 | 0.60 | 0.95 |
| i5 | 178.28 | 917.76 | 0.47 | 0.45 | 0.95 |
| i6 | 178.03 | 916.67 | 0.49 | 0.50 | 0.95 |
| i7 | 178.60 | 909.66 | 0.54 | 0.55 | 0.95 |
| i8 | 178.58 | 911.00 | 0.54 | 0.54 | 0.95 |
| i9 | 178.45 | 919.57 | 0.37 | 0.34 | 0.95 |
| i10 | 178.92 | 908.89 | 0.50 | 0.54 | 0.95 |
| i11 | 178.77 | 911.91 | 0.45 | 0.51 | 0.95 |
| i12 | 178.52 | 910.71 | 0.53 | 0.57 | 0.95 |
| i13 | 178.61 | 911.04 | 0.54 | 0.54 | 0.95 |
| i14 | 178.61 | 913.20 | 0.50 | 0.41 | 0.95 |
| i15 | 178.74 | 906.48 | 0.55 | 0.51 | 0.95 |
| i16 | 178.35 | 910.29 | 0.56 | 0.54 | 0.95 |
| i17 | 178.67 | 908.60 | 0.57 | 0.57 | 0.95 |
| i18 | 178.78 | 919.62 | 0.35 | 0.41 | 0.95 |
| i19 | 178.63 | 916.12 | 0.43 | 0.41 | 0.95 |
| i20 | 178.25 | 919.02 | 0.39 | 0.42 | 0.95 |
| i21 | 178.29 | 916.58 | 0.43 | 0.39 | 0.95 |
| i22 | 178.49 | 919.37 | 0.40 | 0.37 | 0.95 |
| i23 | 178.58 | 924.54 | 0.37 | 0.29 | 0.95 |
| i24 | 178.57 | 917.83 | 0.41 | 0.41 | 0.95 |
| i25 | 178.68 | 914.05 | 0.50 | 0.49 | 0.95 |
| i26 | 179.09 | 913.62 | 0.50 | 0.64 | 0.95 |
| i27 | 179.07 | 915.33 | 0.49 | 0.62 | 0.95 |
| i28 | 178.54 | 916.57 | 0.47 | 0.45 | 0.95 |
| i29 | 179.00 | 911.31 | 0.49 | 0.46 | 0.95 |
| i31 | 179.24 | 916.48 | 0.41 | 0.43 | 0.95 |
| i32 | 178.81 | 918.36 | 0.43 | 0.47 | 0.95 |
| i33 | 178.75 | 916.39 | 0.46 | 0.67 | 0.95 |
| i34 | 178.77 | 914.49 | 0.49 | 0.68 | 0.95 |
| i35 | 178.53 | 927.05 | 0.36 | 0.50 | 0.95 |
| i36 | 178.67 | 932.80 | 0.30 | 0.55 | 0.95 |
| i37 | 178.55 | 931.53 | 0.33 | 0.48 | 0.95 |
| i38 | 178.72 | 931.84 | 0.36 | 0.45 | 0.95 |
| i39 | 178.34 | 921.83 | 0.37 | 0.43 | 0.95 |
| i40 | 178.28 | 917.28 | 0.45 | 0.51 | 0.95 |
| i41 | 178.46 | 913.80 | 0.51 | 0.53 | 0.95 |
| i42 | 178.20 | 917.48 | 0.44 | 0.44 | 0.95 |
| i43 | 178.97 | 912.51 | 0.43 | 0.45 | 0.95 |
| i44 | 178.56 | 914.22 | 0.55 | 0.45 | 0.95 |
| i46 | 178.81 | 917.70 | 0.41 | 0.33 | 0.95 |
| i48 | 178.72 | 916.00 | 0.46 | 0.60 | 0.95 |
| i49 | 178.78 | 910.71 | 0.53 | 0.69 | 0.95 |
| i50 | 178.91 | 904.77 | 0.62 | 0.64 | 0.95 |
| i51 | 178.41 | 909.49 | 0.57 | 0.61 | 0.95 |
| i52 | 178.44 | 908.01 | 0.61 | 0.62 | 0.95 |
| i53 | 178.64 | 908.65 | 0.59 | 0.61 | 0.95 |
| i54 | 178.61 | 905.16 | 0.62 | 0.58 | 0.95 |
| i55 | 178.46 | 912.25 | 0.53 | 0.61 | 0.95 |
| i56 | 178.36 | 907.36 | 0.62 | 0.68 | 0.95 |
| i57 | 178.48 | 906.62 | 0.58 | 0.62 | 0.95 |
| i58 | 178.41 | 906.30 | 0.62 | 0.66 | 0.95 |
| i59 | 178.59 | 907.25 | 0.57 | 0.57 | 0.95 |
| i60 | 178.67 | 914.98 | 0.45 | 0.42 | 0.95 |
| Item Number | Dimension1 | Dimension2 | Dimension3 | Dimension4 | Dimension5 | Dimension6 | Dimension7 | Dimension8 |
|---|---|---|---|---|---|---|---|---|
| I56 | 0.75 | |||||||
| I55 | 0.72 | |||||||
| I58 | 0.70 | |||||||
| I57 | 0.66 | |||||||
| I59 | 0.64 | |||||||
| I54 | 0.61 | |||||||
| I60 | 0.52 | |||||||
| I52 | 0.46 | |||||||
| I46 | 0.36 | |||||||
| I13 | 0.72 | |||||||
| I11 | 0.70 | |||||||
| I12 | 0.70 | |||||||
| I10 | 0.68 | |||||||
| I18 | 0.61 | |||||||
| I17 | 0.57 | |||||||
| I16 | 0.55 | |||||||
| I15 | 0.55 | |||||||
| I14 | 0.50 | |||||||
| I19 | 0.46 | |||||||
| I9 | 0.35 | |||||||
| I4 | 0.72 | |||||||
| I3 | 0.68 | |||||||
| I5 | 0.67 | |||||||
| I1 | 0.64 | |||||||
| I7 | 0.62 | |||||||
| I8 | 0.60 | |||||||
| I2 | 0.58 | |||||||
| I6 | 0.57 | |||||||
| I51 | 0.41 | |||||||
| I26 | 0.67 | |||||||
| I27 | 0.65 | |||||||
| I31 | 0.63 | |||||||
| I34 | 0.62 | |||||||
| I33 | 0.61 | |||||||
| I29 | 0.60 | |||||||
| I32 | 0.56 | |||||||
| I25 | 0.48 | |||||||
| I24 | 0.44 | |||||||
| I28 | 0.40 | |||||||
| I49 | 0.75 | |||||||
| I48 | 0.73 | |||||||
| I50 | 0.60 | |||||||
| I53 | 0.59 | |||||||
| I41 | 0.71 | |||||||
| I40 | 0.65 | |||||||
| I42 | 0.63 | |||||||
| I39 | 0.59 | |||||||
| I43 | 0.50 | |||||||
| I44 | 0.42 | |||||||
| I36 | 0.82 | |||||||
| I37 | 0.79 | |||||||
| I38 | 0.74 | |||||||
| I35 | 0.70 | |||||||
| I20 | 0.68 | |||||||
| I21 | 0.58 | |||||||
| I22 | 0.54 | |||||||
| I23 | 0.38 |
| Relationships | Standard Regression Weight | Factor Loadings | S.E. | C.R. | p | ||
|---|---|---|---|---|---|---|---|
| F1 | <--- | Quality of life | 0.43 | 0.84 | 0.04 | 11.55 | *** |
| F2 | <--- | Quality of life | 1.00 | 0.86 | |||
| F3 | <--- | Quality of life | 0.64 | 0.84 | 0.04 | 17.69 | *** |
| F4 | <--- | Quality of life | 0.53 | 0.79 | 0.04 | 14.06 | *** |
| F6 | <--- | Quality of life | 0.49 | 0.81 | 0.04 | 13.65 | *** |
| F5 | <--- | Quality of life | 0.68 | 0.76 | 0.04 | 18.65 | *** |
| F7 | <--- | Quality of life | 0.27 | 0.42 | 0.03 | 9.12 | *** |
| F8 | <--- | Quality of life | 0.36 | 0.75 | 0.03 | 10.96 | *** |
| i19 | <--- | F2 | 1.00 | 0.76 | |||
| i18 | <--- | F2 | 0.68 | 0.61 | 0.04 | 17.31 | *** |
| i17 | <--- | F2 | 0.79 | 0.76 | 0.03 | 23.61 | *** |
| i16 | <--- | F2 | 0.75 | 0.75 | 0.03 | 23.14 | *** |
| i15 | <--- | F2 | 0.82 | 0.74 | 0.04 | 22.48 | *** |
| i14 | <--- | F2 | 0.67 | 0.66 | 0.03 | 19.48 | *** |
| i13 | <--- | F2 | 0.82 | 0.79 | 0.03 | 25.02 | *** |
| i12 | <--- | F2 | 0.83 | 0.78 | 0.03 | 24.67 | *** |
| i11 | <--- | F2 | 0.84 | 0.72 | 0.04 | 21.79 | *** |
| i10 | <--- | F2 | 0.85 | 0.74 | 0.04 | 22.57 | *** |
| i9 | <--- | F2 | 0.52 | 0.51 | 0.04 | 14.03 | *** |
| i51 | <--- | F3 | 0.98 | 0.68 | 0.06 | 16.18 | *** |
| i8 | <--- | F3 | 1.00 | 0.68 | |||
| i7 | <--- | F3 | 1.08 | 0.71 | 0.06 | 16.97 | *** |
| i6 | <--- | F3 | 0.93 | 0.68 | 0.06 | 16.29 | *** |
| i5 | <--- | F3 | 0.92 | 0.68 | 0.06 | 16.22 | *** |
| i4 | <--- | F3 | 1.10 | 0.78 | 0.06 | 18.40 | *** |
| i3 | <--- | F3 | 1.02 | 0.71 | 0.06 | 16.88 | *** |
| i2 | <--- | F3 | 0.91 | 0.64 | 0.06 | 15.47 | *** |
| i1 | <--- | F3 | 1.13 | 0.78 | 0.06 | 18.46 | *** |
| i24 | <--- | F4 | 1.00 | 0.58 | |||
| i25 | <--- | F4 | 1.07 | 0.65 | 0.08 | 13.22 | *** |
| i26 | <--- | F4 | 1.16 | 0.70 | 0.08 | 13.81 | *** |
| i27 | <--- | F4 | 1.10 | 0.68 | 0.08 | 13.56 | *** |
| i28 | <--- | F4 | 0.94 | 0.59 | 0.08 | 12.26 | *** |
| i29 | <--- | F4 | 1.23 | 0.68 | 0.09 | 13.51 | *** |
| i31 | <--- | F4 | 1.05 | 0.58 | 0.09 | 12.21 | *** |
| i32 | <--- | F4 | 0.94 | 0.58 | 0.08 | 12.15 | *** |
| i33 | <--- | F4 | 0.97 | 0.60 | 0.08 | 12.45 | *** |
| i34 | <--- | F4 | 1.00 | 0.61 | 0.08 | 12.55 | *** |
| i39 | <--- | F6 | 1.00 | 0.56 | |||
| i40 | <--- | F6 | 1.16 | 0.65 | 0.09 | 12.60 | *** |
| i41 | <--- | F6 | 1.34 | 0.74 | 0.10 | 13.66 | *** |
| i42 | <--- | F6 | 1.19 | 0.66 | 0.09 | 12.80 | *** |
| i43 | <--- | F6 | 1.27 | 0.60 | 0.11 | 11.94 | *** |
| i44 | <--- | F6 | 1.07 | 0.65 | 0.09 | 12.66 | *** |
| i46 | <--- | F1 | 1.00 | 0.45 | |||
| i52 | <--- | F1 | 1.48 | 0.69 | 0.13 | 11.22 | *** |
| i54 | <--- | F1 | 1.65 | 0.74 | 0.14 | 11.48 | *** |
| i55 | <--- | F1 | 1.64 | 0.76 | 0.14 | 11.60 | *** |
| i56 | <--- | F1 | 1.87 | 0.85 | 0.16 | 12.09 | *** |
| i57 | <--- | F1 | 1.87 | 0.80 | 0.16 | 11.84 | *** |
| i58 | <--- | F1 | 1.86 | 0.83 | 0.16 | 11.98 | *** |
| i59 | <--- | F1 | 1.79 | 0.77 | 0.15 | 11.68 | *** |
| i60 | <--- | F1 | 1.43 | 0.63 | 0.13 | 10.72 | *** |
| i53 | <--- | F5 | 0.91 | 0.74 | 0.04 | 20.53 | *** |
| i50 | <--- | F5 | 1.07 | 0.05 | 23.26 | *** | |
| i49 | <--- | F5 | 1.13 | 0.05 | 24.74 | *** | |
| i48 | <--- | F5 | 1.00 | ||||
| i38 | <--- | F7 | 1.00 | ||||
| i37 | <--- | F7 | 1.06 | 0.07 | 15.45 | *** | |
| i36 | <--- | F7 | 1.10 | 0.07 | 16.12 | *** | |
| i35 | <--- | F7 | 0.97 | 0.06 | 15.15 | *** | |
| i23 | <--- | F8 | 1.00 | ||||
| i22 | <--- | F8 | 1.50 | 0.14 | 10.42 | *** | |
| i21 | <--- | F8 | 1.60 | 0.15 | 10.62 | *** | |
| i20 | <--- | F8 | 1.49 | 0.15 | 10.26 | *** | |
| Fit Index | Value after Modification | Acceptable Fit | Good Fit |
|---|---|---|---|
| CMIN/df | 3.48 | ≤5 | ≤3 |
| GFI | 0.87 | ≥0.85 | ≥0.90 |
| IFI | 0.92 | ≥0.90 | ≥0.95 |
| TLI | 0.91 | ≥0.90 | ≥0.95 |
| CFI | 0.95 | ≥0.95 | ≥0.97 |
| RMSEA | 0.06 | ≤0.08 | ≤0.05 |
| NFI | 0.911 | ≥0.90 | ≥0.95 |
| Kolmogorov-Smirnov | Skewness | Kurtosis | Mean | S.Deviation | |||
|---|---|---|---|---|---|---|---|
| Statistics | Sd | p | |||||
| Satisfaction with educational spaces | 0.08 | 685 | 0.00 | −0.30 | −0.05 | 34.58 | 8.13 |
| (Satisfaction with) Academic development | 0.10 | 685 | 0.00 | −0.60 | 0.44 | 30.54 | 6.53 |
| Satisfaction with socio-physical facilities | 0.04 | 685 | 0.02 | −0.05 | −0.06 | 29.31 | 6.98 |
| Social perception | 0.08 | 685 | 0.00 | −0.27 | 0.13 | 19.89 | 4.35 |
| Campus life satisfaction | 0.09 | 685 | 0.00 | −0.45 | −0.02 | 29.21 | 6.99 |
| Accessibility and satisfaction with transportation | 0.11 | 685 | 0.00 | −0.50 | 0.34 | 13.51 | 2.98 |
| Satisfaction with dormitory/housing | 0.27 | 685 | 0.00 | 0.27 | 1.23 | 12.66 | 2.84 |
| Satisfaction with administration management. | 0.12 | 685 | 0.00 | −0.36 | −0.33 | 12.08 | 3.59 |
| General QoLsatisfaction | 0.04 | 685 | 0.01 | −0.41 | 0.89 | 181.78 | 30.77 |
| Expressions | Strongly Disagree | Disagree | Neither Agree nor Disagree | Agree | Strongly Agree | ±Sd | ||||||
|---|---|---|---|---|---|---|---|---|---|---|---|---|
| n | % | n | % | n | % | n | % | n | % | |||
| Satisfaction with academic development | I am satisfied with the quality of teaching in my department | 45 | 6.57 | 74 | 10.80 | 171 | 24.96 | 330 | 48.18 | 65 | 9.49 | 3.43 ± 1.02 |
| Current technological methods and tools are used in teaching | 42 | 6.13 | 123 | 17.96 | 206 | 30.07 | 266 | 38.83 | 48 | 7.01 | 3.23 ± 1.02 | |
| In my department, classroom interaction is good, and students participate actively. | 36 | 5.26 | 97 | 14.16 | 176 | 25.69 | 296 | 43.21 | 80 | 11.68 | 3.42 ± 1.04 | |
| The lecturers try to help me get the most out of the course. | 34 | 4.96 | 84 | 12.26 | 180 | 26.28 | 316 | 46.13 | 71 | 10.36 | 3.45 ± 1.00 | |
| My workload as a student in my department is appropriate for the profession for which I am a candidate. | 33 | 4.82 | 74 | 10.80 | 164 | 23.94 | 345 | 50.36 | 69 | 10.07 | 3.50 ± 0.98 | |
| Lecturers are qualified, knowledgeable, and experienced in their fields of specialization | 25 | 3.65 | 50 | 7.30 | 134 | 19.56 | 334 | 48.76 | 142 | 20.73 | 3.76 ± 0.98 | |
| Regular feedback is provided to students based on their academic performance | 51 | 7.45 | 135 | 19.71 | 207 | 30.22 | 223 | 32.55 | 69 | 10.07 | 3.18 ± 1.09 | |
| The university gives me enough information for my personal development and career planning | 44 | 6.42 | 134 | 19.56 | 209 | 30.51 | 232 | 33.87 | 66 | 9.64 | 3.21 ± 1.07 | |
| Satisfaction with eduction spaces | I am satisfied with the location of my department at the university | 50 | 7.30 | 133 | 19.42 | 121 | 17.66 | 298 | 43.50 | 83 | 12.12 | 3.34 ± 1.14 |
| The physical facilities of the building where I study are adequate and comfortable for the educational environment | 114 | 16.64 | 153 | 22.34 | 173 | 25.26 | 199 | 29.05 | 46 | 6.72 | 2.87 ± 1.20 | |
| Class size is good for the number of students | 110 | 16.06 | 116 | 16.93 | 172 | 25.11 | 231 | 33.72 | 56 | 8.18 | 3.01 ± 1.22 | |
| I am satisfied with the location of my classroom in the building | 61 | 8.91 | 95 | 13.87 | 191 | 27.88 | 279 | 40.73 | 59 | 8.61 | 3.26 ± 1.09 | |
| Classroom organization is efficient for the education | 59 | 8.61 | 115 | 16.79 | 200 | 29.20 | 271 | 39.56 | 40 | 5.84 | 3.17 ± 1.06 | |
| The building where I study is clean and well-maintained | 56 | 8.32 | 122 | 17.81 | 200 | 29.20 | 254 | 37.08 | 52 | 7.59 | 3.18 ± 1.08 | |
| Projector, board, computer, screen, etc.) are sufficient and of good quality | 77 | 11.24 | 155 | 22.63 | 168 | 24.53 | 229 | 33.43 | 56 | 8.18 | 3.04 ± 1.16 | |
| The lighting level of my classroom is sufficient | 32 | 4.67 | 104 | 15.18 | 171 | 24.96 | 294 | 42.92 | 84 | 12.26 | 3.43 ± 1.04 | |
| The acoustic environment of the classroom is comfortable for learning | 54 | 7.88 | 140 | 20.44 | 219 | 31.97 | 216 | 31.53 | 56 | 8.18 | 3.12 ± 1.07 | |
| My classroom is warm in winter and not too hot in summer, climatic comfort is good | 95 | 13.87 | 145 | 21.17 | 180 | 26.28 | 192 | 28.03 | 73 | 10.66 | 3.00 ± 1.21 | |
| There are comfortable study areas on campus where I can work outside of class. | 56 | 8.18 | 149 | 21.75 | 182 | 26.57 | 228 | 33.28 | 70 | 10.22 | 3.16 ± 1.12 | |
| Accessibility and satisfaction with public transportation | The campus is easy to reach from where I live. | 46 | 6.72 | 82 | 11.97 | 137 | 20.00 | 301 | 43.94 | 119 | 17.37 | 3.53 ± 1.11 |
| The campus is a walkable campus; I can reach most places on campus on foot | 42 | 6.13 | 93 | 13.58 | 146 | 21.31 | 296 | 43.21 | 108 | 15.77 | 3.49 ± 1.10 | |
| Transportation facilities are adequate and affordable | 49 | 7.15 | 110 | 16.06 | 191 | 27.88 | 262 | 38.25 | 73 | 10.66 | 3.29 ± 1.08 | |
| Parking space is sufficient on campus | 30 | 4.38 | 114 | 16.64 | 277 | 40.44 | 218 | 31.82 | 46 | 6.72 | 3.20 ± 0.94 | |
| Satisfaction with socio-physical facilities | Green space on campus is sufficient and of good quality | 53 | 7.74 | 138 | 20.15 | 173 | 25.26 | 250 | 36.50 | 71 | 10.36 | 3.22 ± 1.12 |
| The campus is clean and well-maintained | 55 | 8.03 | 138 | 20.15 | 213 | 31.09 | 241 | 35.18 | 38 | 5.55 | 3.10 ± 1.04 | |
| Outdoor sports facilities are adequate and useful | 102 | 14.89 | 184 | 26.86 | 245 | 35.77 | 128 | 18.69 | 26 | 3.80 | 2.70 ± 1.05 | |
| Indoor sports areas are adequate and useful | 100 | 14.60 | 164 | 23.94 | 276 | 40.29 | 125 | 18.25 | 20 | 2.92 | 2.71 ± 1.02 | |
| Club facilities for students are adequate and good. | 46 | 6.72 | 105 | 15.33 | 228 | 33.28 | 249 | 36.35 | 57 | 8.32 | 3.24 ± 1.03 | |
| I am satisfied with the food and beverage facilities on campus | 112 | 16.35 | 178 | 25.99 | 177 | 25.84 | 183 | 26.72 | 35 | 5.11 | 2.78 ± 1.16 | |
| Recreational activities for students on campus are sufficient. | 146 | 21.17 | 216 | 31.53 | 164 | 23.94 | 124 | 18.10 | 35 | 5.11 | 2.54 ± 1.16 | |
| On-campus housing is adequate and reasonably priced | 70 | 10.22 | 128 | 18.69 | 283 | 41.31 | 157 | 22.92 | 47 | 6.86 | 2.98 ± 1.05 | |
| I am satisfied with the health services offered at my university | 69 | 10.07 | 111 | 16.20 | 271 | 39.56 | 194 | 28.32 | 40 | 5.84 | 3.04 ± 1.04 | |
| I am satisfied with the comfort of the place where I receive health services at my university | 77 | 11.24 | 106 | 15.47 | 272 | 39.71 | 190 | 27.74 | 40 | 5.84 | 3.01 ± 1.06 | |
| Satisfaction with dormitory/housing | My dormitory is safe | 32 | 4.67 | 32 | 4.67 | 418 | 61.02 | 139 | 20.29 | 64 | 9.34 | 3.25 ± 0.87 |
| My dormitory is well-maintained and clean. | 41 | 5.99 | 62 | 9.05 | 406 | 59.27 | 128 | 18.69 | 48 | 7.01 | 3.12 ± 0.89 | |
| I am satisfied with the location of my dormitory | 34 | 4.96 | 50 | 7.30 | 394 | 57.52 | 134 | 19.56 | 73 | 10.66 | 3.24 ± 0.92 | |
| The room I stay in is generally comfortable and suitable for my needs. | 51 | 7.45 | 70 | 10.22 | 397 | 57.96 | 120 | 17.52 | 47 | 6.86 | 3.06 ± 0.92 | |
| Social perception | I am satisfied with the multicultural diversity in my faculty | 44 | 6.42 | 72 | 10.51 | 194 | 28.32 | 287 | 41.90 | 88 | 12.85 | 3.44 ± 1.05 |
| I am satisfied with gender equality among students | 42 | 6.13 | 72 | 10.51 | 159 | 23.21 | 327 | 47.74 | 85 | 12.41 | 3.50 ± 1.04 | |
| I feel physically and emotionally safe on campus | 41 | 5.99 | 100 | 14.60 | 209 | 30.51 | 265 | 38.69 | 70 | 10.22 | 3.33 ± 1.04 | |
| The campus is safe until dark (daytime). | 36 | 5.26 | 76 | 11.09 | 131 | 19.12 | 336 | 49.05 | 106 | 15.47 | 3.58 ± 1.04 | |
| The campus is safe after dark (at night) | 128 | 18.69 | 157 | 22.92 | 177 | 25.84 | 161 | 23.50 | 62 | 9.05 | 2.81 ± 1.24 | |
| Student organizations (unions, clubs, etc.) and facilities are supported by the university | 31 | 4.53 | 107 | 15.62 | 277 | 40.44 | 217 | 31.68 | 53 | 7.74 | 3.22 ± 0.96 | |
| I regularly participate in university-related leisure activities (such as sports or fairs) | 68 | 9.93 | 176 | 25.69 | 193 | 28.18 | 200 | 29.20 | 48 | 7.01 | 2.98 ± 1.11 | |
| Administrative management sat. | Administrative staff (such as student affairs) have sufficient knowledge about their duties. | 79 | 11.53 | 99 | 14.45 | 243 | 35.47 | 229 | 33.43 | 35 | 5.11 | 3.06 ± 1.07 |
| Administrative staff treat students with care | 85 | 12.41 | 109 | 15.91 | 245 | 35.77 | 210 | 30.66 | 36 | 5.26 | 3.00 ± 1.08 | |
| Questions and issues are effectively addressed at the university | 85 | 12.41 | 162 | 23.65 | 227 | 33.14 | 174 | 25.40 | 37 | 5.40 | 2.88 ± 1.09 | |
| Satisfaction with campus life | I am satisfied with the quality of the lecturers, compared to my expectations | 44 | 6.42 | 88 | 12.85 | 196 | 28.61 | 283 | 41.31 | 74 | 10.80 | 3.37 ± 1.05 |
| I am satisfied with the academic programs, compared to my expectations | 39 | 5.69 | 100 | 14.60 | 202 | 29.49 | 276 | 40.29 | 68 | 9.93 | 3.34 ± 1.03 | |
| I am satisfied with the administrative staff compared to my expectations | 57 | 8.32 | 118 | 17.23 | 220 | 32.12 | 251 | 36.64 | 39 | 5.69 | 3.14 ± 1.04 | |
| I am satisfied with campus life compared to my expectations | 53 | 7.74 | 132 | 19.27 | 199 | 29.05 | 245 | 35.77 | 56 | 8.18 | 3.17 ± 1.08 | |
| I am generally satisfied with my university life | 31 | 4.53 | 131 | 19.12 | 177 | 25.84 | 278 | 40.58 | 68 | 9.93 | 3.32 ± 1.04 | |
| I am happy to belong to this university | 34 | 4.96 | 91 | 13.28 | 200 | 29.20 | 274 | 40.00 | 86 | 12.55 | 3.42 ± 1.03 | |
| I feel like a member of the university community | 51 | 7.45 | 112 | 16.35 | 184 | 26.86 | 257 | 37.52 | 81 | 11.82 | 3.30 ± 1.11 | |
| I would recommend my university to someone else | 46 | 6.72 | 86 | 12.55 | 200 | 29.20 | 275 | 40.15 | 78 | 11.39 | 3.37 ± 1.06 | |
| If I faced the same choice again, I would choose the same university | 62 | 9.05 | 105 | 15.33 | 231 | 33.72 | 212 | 30.95 | 75 | 10.95 | 3.19 ± 1.11 | |
| Scale and Dimension | Group | n | ± SD | t | Sd | p |
|---|---|---|---|---|---|---|
| Satisfaction with education spaces | Female | 294 | 35.93 ± 7.93 | 3.82 | 682 | 0.00 |
| Male | 390 | 33.55 ± 8.16 | ||||
| Academic development | Female | 294 | 29.62 ± 6.67 | −3.19 | 682 | 0.00 |
| Male | 390 | 31.22 ± 6.36 | ||||
| Socio-physical facility satisfaction | Female | 294 | 29.53 ± 7.11 | 0.76 | 682 | 0.45 |
| Male | 390 | 29.12 ± 6.88 | ||||
| Social perception | Female | 294 | 19.90 ± 4.55 | 0.13 | 682 | 0.90 |
| Male | 390 | 19.86 ± 4.20 | ||||
| Campus life satisfaction | Female | 294 | 28.52 ± 7.34 | −2.22 | 682 | 0.03 |
| Male | 390 | 29.72 ± 6.68 | ||||
| Accessibility and public transportation satisfaction | Female | 294 | 13.62 ± 2.98 | 0.81 | 682 | 0.42 |
| Male | 390 | 13.43 ± 2.99 | ||||
| Dormitory/housing satisfaction | Female | 294 | 12.40 ± 2.93 | −2.14 | 682 | 0.03 |
| Male | 390 | 12.87 ± 2.76 | ||||
| Administrative management perception | Female | 294 | 11.73 ± 3.82 | −2.21 | 682 | 0.03 |
| Male | 390 | 12.34 ± 3.39 | ||||
| General QoL | Female | 294 | 181.26 ± 31.74 | −0.36 | 682 | 0.72 |
| Male | 390 | 182.12 ± 30.07 |
| Scale and Dimension | Group | n | ± Sd | z | p |
|---|---|---|---|---|---|
| Satisfaction with education spaces | Between ages 18 and 24 | 646 | 34.37 ± 8.09 | −2.50 | 0.01 |
| Between ages 24 and 28 | 38 | 37.97 ± 8.37 | |||
| Academic development | Between ages 18 and 24 | 646 | 30.46 ± 6.51 | −1.22 | 0.22 |
| Between ages 24 and 28 | 38 | 32.37 ± 6.47 | |||
| Socio-physical facility satisfaction | Between ages 18 and 24 | 646 | 29.26 ± 7.01 | −1.20 | 0.23 |
| Between ages 24 and 28 | 38 | 30.39 ± 6.39 | |||
| Social perception | Between ages 18 and 24 | 646 | 19.87 ± 4.31 | −0.13 | 0.89 |
| Between ages 24 and 28 | 38 | 20.03 ± 5.13 | |||
| Campus life satisfaction | Between ages 18 and 24 | 646 | 29.23 ± 6.90 | −0.45 | 0.65 |
| Between ages 24 and 28 | 38 | 29.32 ± 8.02 | |||
| Accessibility and public transportation satisfaction | Between ages 18 and 24 | 646 | 13.46 ± 2.95 | −2.24 | 0.03 |
| Between ages 24 and 28 | 38 | 14.42 ± 3.41 | |||
| Dormitory/housing satisfaction | Between ages 18 and 24 | 646 | 12.70 ± 2.87 | −1.45 | 0.15 |
| Between ages 24 and 28 | 38 | 12.03 ± 2.28 | |||
| Administrative management perception | Between ages 18 and 24 | 646 | 12.06 ± 3.58 | −0.40 | 0.69 |
| Between ages 24 and 28 | 38 | 12.55 ± 3.81 | |||
| General QoL | Between ages 18 and 24 | 646 | 181.41 ± 30.60 | −1.15 | 0.25 |
| Between ages 24 and 28 | 38 | 189.08 ± 32.88 |
| Scale and Dimension | Group | n | ± Sd | z | p |
|---|---|---|---|---|---|
| Satisfaction with education spaces | TR | 629 | 34.45 ± 8.17 | −0.86 | 0.39 |
| Syria | 56 | 36.02 ± 7.66 | |||
| Academic development | TR | 629 | 30.52 ± 6.51 | −0.04 | 0.96 |
| Syria | 56 | 30.79 ± 6.82 | |||
| Socio-physical facility satisfaction | TR | 629 | 29.16 ± 7.01 | −1.92 | 0.05 |
| Syria | 56 | 31.04 ± 6.39 | |||
| Social perception | TR | 629 | 19.85 ± 4.33 | −0.68 | 0.49 |
| Syria | 56 | 20.30 ± 4.56 | |||
| Campus life satisfaction | TR | 629 | 29.16 ± 6.97 | −0.40 | 0.69 |
| Syria | 56 | 29.70 ± 7.17 | |||
| Accessibility and public transportation satisfaction | TR | 629 | 13.44 ± 2.97 | −2.40 | 0.02 |
| Syria | 56 | 14.34 ± 2.96 | |||
| Dormitory/housing satisfaction | TR | 629 | 12.65 ± 2.87 | −0.25 | 0.80 |
| Syria | 56 | 12.80 ± 2.52 | |||
| Administrative management perception | TR | 629 | 12.09 ± 3.56 | −0.36 | 0.72 |
| Syria | 56 | 12.02 ± 3.98 | |||
| General QoL | TR | 629 | 181.32 ± 30.56 | −0.96 | 0.34 |
| Syria | 56 | 187.00 ± 32.82 |
| Scale and Dimension | Group | n | ± Sd | F | p | Difference |
|---|---|---|---|---|---|---|
| Satisfaction with education spaces | At home with my family | 189 | 35.79 ± 8.28 | 2.88 | 0.02 | 1 > 2 |
| Apart flat | 106 | 32.96 ± 7.74 | ||||
| At home with my friends | 106 | 35.54 ± 8.06 | ||||
| State dormitory | 187 | 34.13 ± 8.43 | ||||
| Private dormitory | 97 | 33.77 ± 7.43 | ||||
| Academic development | At home with my family | 189 | 31.25 ± 6.59 | 1.15 | 0.33 | |
| Apart flat | 106 | 30.35 ± 5.13 | ||||
| At home with my friends | 106 | 30.40 ± 6.48 | ||||
| State dormitory | 187 | 30.53 ± 6.90 | ||||
| Private dormitory | 97 | 29.55 ± 7.08 | ||||
| Socio-physical facility satisfaction | At home with my family | 189 | 29.83 ± 6.97 | 0.79 | 0.53 | |
| Apart flat | 106 | 28.48 ± 7.27 | ||||
| At home with my friends | 106 | 28.99 ± 7.05 | ||||
| State dormitory | 187 | 29.58 ± 6.79 | ||||
| Private dormitory | 97 | 29.05 ± 6.99 | ||||
| Social perception | At home with my family | 189 | 20.10 ± 4.80 | 0.56 | 0.70 | |
| Apart flat | 106 | 19.89 ± 3.89 | ||||
| At home with my friends | 106 | 19.63 ± 3.97 | ||||
| State dormitory | 187 | 19.62 ± 4.39 | ||||
| Private dormitory | 97 | 20.26 ± 4.27 | ||||
| Campus life satisfaction | At home with my family | 189 | 28.99 ± 7.54 | 0.25 | 0.91 | |
| Apart flat | 106 | 29.35 ± 7.08 | ||||
| At home with my friends | 106 | 29.19 ± 6.66 | ||||
| State dormitory | 187 | 29.56 ± 6.97 | ||||
| Private dormitory | 97 | 28.82 ± 6.20 | ||||
| Accessibility and public transportation satisfaction | At home with my family | 189 | 13.19 ± 3.11 | 2.06 | 0.08 | |
| Apart flat | 106 | 13.55 ± 2.99 | ||||
| At home with my friends | 106 | 13.90 ± 2.71 | ||||
| State dormitory | 187 | 13.83 ± 2.95 | ||||
| Private dormitory | 97 | 13.08 ± 2.99 | ||||
| Dormitory/housing satisfaction | At home with my family | 189 | 12.16 ± 1.50 | 14.74 | 0.00 | 5 > 1, 2, 3, 4 |
| Apart flat | 106 | 13.01 ± 2.55 | ||||
| At home with my friends | 106 | 12.00 ± 1.96 | ||||
| State dormitory | 187 | 12.41 ± 3.56 | ||||
| Private dormitory | 97 | 14.48 ± 3.56 | ||||
| Administrative management perception | At home with my family | 189 | 12.00 ± 3.57 | 0.96 | 0.43 | |
| Apart flat | 106 | 12.44 ± 3.60 | ||||
| At home with my friends | 106 | 11.87 ± 3.61 | ||||
| State dormitory | 187 | 12.32 ± 3.61 | ||||
| Private dormitory | 97 | 11.64 ± 3.57 | ||||
| General QoL | At home with my family | 189 | 183.31 ± 32.22 | 0.24 | 0.92 | |
| Apart flat | 106 | 180.03 ± 28.06 | ||||
| At home with my friends | 106 | 181.51 ± 28.20 | ||||
| State dormitory | 187 | 181.97 ± 32.69 | ||||
| Private dormitory | 97 | 180.66 ± 30.01 |
| Scale and Dimension | Group | n | ± Sd | KW | p | Difference |
|---|---|---|---|---|---|---|
| Satisfaction with education spaces | Görükle 1 | 358 | 33.99 ± 8.12 | 6.34 | 0.00 | 4 > 1, 2, 5 |
| Nilüfer 2 | 195 | 34.12 ± 8.22 | ||||
| Osmangazi 3 | 75 | 36.37 ± 6.78 | ||||
| Yıldırım 4 | 36 | 40.22 ± 6.66 | ||||
| Other 5 | 21 | 32.71 ± 10.10 | ||||
| Academic development | Görükle 1 | 358 | 30.36 ± 6.61 | 5.80 | 0.00 | 4 > 1, 2, 5 and 1, 2, 3 > 5 |
| Nilüfer 2 | 195 | 30.48 ± 6.09 | ||||
| Osmangazi 3 | 75 | 30.84 ± 5.95 | ||||
| Yıldırım 4 | 36 | 34.50 ± 5.42 | ||||
| Other 5 | 21 | 26.29 ± 9.47 | ||||
| Socio-physical facility satisfaction | Görükle 1 | 358 | 29.15 ± 7.12 | 2.95 | 0.02 | 4 > 1, 2 |
| Nilüfer 2 | 195 | 28.85 ± 6.84 | ||||
| Osmangazi 3 | 75 | 29.84 ± 6.42 | ||||
| Yıldırım 4 | 36 | 32.94 ± 4.93 | ||||
| Other 5 | 21 | 28.33 ± 9.15 | ||||
| Social perception | Görükle 1 | 358 | 19.70 ± 4.15 | 2.14 | 0.07 | |
| Nilüfer 2 | 195 | 19.89 ± 4.33 | ||||
| Osmangazi 3 | 75 | 20.77 ± 4.47 | ||||
| Yıldırım 4 | 36 | 20.83 ± 4.55 | ||||
| Other 5 | 21 | 18.24 ± 6.32 | ||||
| Campus life satisfaction | Görükle 1 | 358 | 29.51 ± 7.04 | 2.91 | 0.06 | |
| Nilüfer 2 | 195 | 28.21 ± 6.55 | ||||
| Osmangazi 3 | 75 | 29.91 ± 6.56 | ||||
| Yıldırım 4 | 36 | 31.47 ± 7.11 | ||||
| Other 5 | 21 | 26.90 ± 9.57 | ||||
| Accessibility and public transportation satisfaction | Görükle 1 | 358 | 13.62 ± 2.87 | 1.69 | 0.15 | |
| Nilüfer 2 | 195 | 13.46 ± 3.07 | ||||
| Osmangazi 3 | 75 | 13.37 ± 3.06 | ||||
| Yıldırım 4 | 36 | 13.92 ± 2.98 | ||||
| Other 5 | 21 | 12.00 ± 3.46 | ||||
| Dormitory/housing satisfaction | Görükle 1 | 358 | 12.78 ± 2.95 | 1.90 | 0.11 | |
| Nilüfer 2 | 195 | 12.86 ± 3.01 | ||||
| Osmangazi 3 | 75 | 12.03 ± 2.49 | ||||
| Yıldırım 4 | 36 | 12.03 ± 0.70 | ||||
| Other 5 | 21 | 12.24 ± 2.47 | ||||
| Administrative management perception | Görükle 1 | 358 | 12.26 ± 3.74 | 4.01 | 0.00 | 3 > 2 |
| Nilüfer 2 | 195 | 11.38 ± 3.37 | ||||
| Osmangazi 3 | 75 | 12.85 ± 2.86 | ||||
| Yıldırım 4 | 36 | 13.06 ± 3.64 | ||||
| Other 5 | 21 | 11.19 ± 4.26 | ||||
| General QoL | Görükle 1 | 358 | 181.37 ± 30.79 | 4.67 | 0.00 | 4 > 1, 2, 5 |
| Nilüfer 2 | 195 | 179.24 ± 28.93 | ||||
| Osmangazi 3 | 75 | 185.99 ± 27.80 | ||||
| Yıldırım 4 | 36 | 198.97 ± 27.59 | ||||
| Other 5 | 21 | 167.90 ± 47.75 |
| Scale and Dimension | Group | n | ± Sd | KW | p | Difference |
|---|---|---|---|---|---|---|
| Satisfaction with education spaces | Faculty of Education | 39 | 36.59 ± 8.87 | 4.32 | 0.00 | 2, 6 > 3 |
| Fac. of Economics and Administrative Sciences | 81 | 36.04 ± 8.15 | ||||
| Faculty of Architecture | 250 | 32.51 ± 8.41 | ||||
| Faculty of Medicine | 73 | 35.38 ± 6.00 | ||||
| Fcaulty of Fine Arts | 12 | 35.08 ± 9.05 | ||||
| Faculty of Engineering | 128 | 36.88 ± 7.30 | ||||
| Faculty of Arts & Sciences | 53 | 33.49 ± 8.71 | ||||
| Faculty of Sports Sciences | 22 | 35.18 ± 7.90 | ||||
| Faculty of Agriculture | 26 | 34.96 ± 7.95 | ||||
| Academic development | Faculty of Education | 39 | 32.49 ± 6.66 | 2.75 | 0.01 | 4 > 6 |
| Fac. of Economics and Administrative Sciences | 81 | 30.07 ± 6.49 | ||||
| Faculty of Architecture | 250 | 31.05 ± 6.91 | ||||
| Faculty of Medicine | 73 | 32.01 ± 5.74 | ||||
| Fcaulty of Fine Arts | 12 | 32.17 ± 6.51 | ||||
| Faculty of Engineering | 128 | 28.88 ± 6.05 | ||||
| Faculty of Arts & Sciences | 53 | 28.98 ± 5.73 | ||||
| Faculty of Sports Sciences | 22 | 30.27 ± 7.62 | ||||
| Faculty of Agriculture | 26 | 31.27 ± 5.78 | ||||
| Socio-physical facility satisfaction | Faculty of Education | 39 | 31.79 ± 7.56 | 3.14 | 0.00 | 1, 4 > 3 |
| Fac. of Economics and Administrative Sciences | 81 | 29.78 ± 7.13 | ||||
| Faculty of Architecture | 250 | 27.87 ± 7.33 | ||||
| Faculty of Medicine | 73 | 31.10 ± 6.37 | ||||
| Fcaulty of Fine Arts | 12 | 29.92 ± 6.88 | ||||
| Faculty of Engineering | 128 | 30.08 ± 6.48 | ||||
| Faculty of Arts & Sciences | 53 | 28.26 ± 5.54 | ||||
| Faculty of Sports Sciences | 22 | 30.64 ± 4.97 | ||||
| Faculty of Agriculture | 26 | 29.92 ± 8.03 | ||||
| Social perception | Faculty of Education | 39 | 21.03 ± 4.47 | 1.87 | 0.06 | |
| Fac. of Economics and Administrative Sciences | 81 | 19.83 ± 5.01 | ||||
| Faculty of Architecture | 250 | 19.46 ± 4.02 | ||||
| Faculty of Medicine | 73 | 20.85 ± 4.96 | ||||
| Fcaulty of Fine Arts | 12 | 20.50 ± 3.21 | ||||
| Faculty of Engineering | 128 | 19.72 ± 4.18 | ||||
| Faculty of Arts & Sciences | 53 | 18.98 ± 3.59 | ||||
| Faculty of Sports Sciences | 22 | 21.23 ± 5.76 | ||||
| Faculty of Agriculture | 26 | 20.88 ± 3.95 | ||||
| Campus life satisfaction | Faculty of Education | 39 | 30.44 ± 6.39 | 2.46 | 0.01 | 4 > 7 |
| Fac. of Economics and Administrative Sciences | 81 | 30.31 ± 7.09 | ||||
| Faculty of Architecture | 250 | 29.35 ± 7.32 | ||||
| Faculty of Medicine | 73 | 31.32 ± 5.88 | ||||
| Fcaulty of Fine Arts | 12 | 27.17 ± 7.16 | ||||
| Faculty of Engineering | 128 | 28.26 ± 6.33 | ||||
| Faculty of Arts & Sciences | 53 | 27.17 ± 6.97 | ||||
| Faculty of Sports Sciences | 22 | 27.86 ± 8.35 | ||||
| Faculty of Agriculture | 26 | 28.27 ± 6.42 | ||||
| Accessibility and public transportation satisfaction | Faculty of Education | 39 | 13.92 ± 3.65 | 1.54 | 0.14 | |
| Fac. of Economics and Administrative Sciences | 81 | 13.47 ± 3.19 | ||||
| Faculty of Architecture | 250 | 13.33 ± 2.99 | ||||
| Faculty of Medicine | 73 | 13.70 ± 2.60 | ||||
| Fcaulty of Fine Arts | 12 | 12.50 ± 2.54 | ||||
| Faculty of Engineering | 128 | 13.83 ± 2.90 | ||||
| Faculty of Arts & Sciences | 53 | 14.17 ± 2.44 | ||||
| Faculty of Sports Sciences | 22 | 12.91 ± 3.22 | ||||
| Faculty of Agriculture | 26 | 12.35 ± 3.21 | ||||
| Dormitory/housing satisfaction | Faculty of Education | 39 | 12.49 ± 3.49 | 1.53 | 0.14 | |
| Fac. of Economics and Administrative Sciences | 81 | 12.62 ± 3.18 | ||||
| Faculty of Architecture | 250 | 12.68 ± 2.74 | ||||
| Faculty of Medicine | 73 | 13.56 ± 2.60 | ||||
| Fcaulty of Fine Arts | 12 | 12.83 ± 3.07 | ||||
| Faculty of Engineering | 128 | 12.68 ± 2.82 | ||||
| Faculty of Arts & Sciences | 53 | 12.17 ± 2.15 | ||||
| Faculty of Sports Sciences | 22 | 11.68 ± 1.73 | ||||
| Faculty of Agriculture | 26 | 12.31 ± 3.74 | ||||
| Administrative managemenet | Faculty of Education | 39 | 12.85 ± 4.11 | 4.01 | 0.01 | 3 > 6 |
| Fac. of Economics and Administrative Sciences | 81 | 11.95 ± 3.52 | ||||
| Faculty of Architecture | 250 | 12.82 ± 3.38 | ||||
| Faculty of Medicine | 73 | 12.47 ± 3.71 | ||||
| Fcaulty of Fine Arts | 12 | 12.25 ± 3.02 | ||||
| Faculty of Engineering | 128 | 11.08 ± 3.39 | ||||
| Faculty of Arts & Sciences | 53 | 11.19 ± 3.29 | ||||
| Faculty of Sports Sciences | 22 | 10.77 ± 3.58 | ||||
| Faculty of Agriculture | 26 | 11.31 ± 4.44 | ||||
| General QoL | Faculty of Education | 39 | 191.59 ± 36.10 | 1.92 | 0.06 | |
| Fac. of Economics and Administrative Sciences | 81 | 184.06 ± 35.43 | ||||
| Faculty of Architecture | 250 | 179.08 ± 32.65 | ||||
| Faculty of Medicine | 73 | 190.38 ± 25.27 | ||||
| Faculty of Fine Arts | 12 | 182.42 ± 30.75 | ||||
| Faculty of Engineering | 128 | 181.40 ± 25.76 | ||||
| Faculty of Arts & Sciences | 53 | 174.42 ± 24.98 | ||||
| Faculty of Sports Sciences | 22 | 180.55 ± 29.68 | ||||
| Faculty of Agriculture | 26 | 181.27 ± 31.03 |
| Scale and Dimension | Group | n | ± Sd | KW | p | Difference |
|---|---|---|---|---|---|---|
| Satisfaction with education spaces | My family and/or close friends live here | 82 | 35.07 ± 8.19 | 4.85 | 0.00 | 5 > 3, 4, 6 |
| I think there are more job opportunities in Bursa after graduation | 95 | 34.88 ± 7.70 | ||||
| I find it easier to study university in Bursa in terms of life opportunities | 68 | 32.93 ± 7.95 | ||||
| I find it more attractive to study at university in Bursa than in my hometown | 62 | 32.29 ± 8.91 | ||||
| I find the education quality of the university very good | 110 | 36.75 ± 8.17 | ||||
| My university exam score was good enough here | 22 | 29.45 ± 9.11 | ||||
| Academic development | My family and/or close friends live here | 82 | 31.05 ± 5.11 | 7.08 | 0.00 | 5 > 3, 4, 6 |
| I think there are more job opportunities in Bursa after graduation | 95 | 31.08 ± 5.83 | ||||
| I find it easier to study university in Bursa in terms of life opportunities | 68 | 30.28 ± 6.68 | ||||
| I find it more attractive to study at university in Bursa than in my hometown | 62 | 28.27 ± 7.38 | ||||
| I find the education quality of the university very good | 110 | 33.23 ± 7.02 | ||||
| My university exam score was good enough here | 22 | 26.77 ± 4.80 | ||||
| Socio-physical facility satisfaction | My family and/or close friends live here | 82 | 30.32 ± 5.86 | 5.40 | 0.00 | 5 > 3, 4, 6 |
| I think there are more job opportunities in Bursa after graduation | 95 | 29.87 ± 7.05 | ||||
| I find it easier to study university in Bursa in terms of life opportunities | 68 | 28.09 ± 6.78 | ||||
| I find it more attractive to study at university in Bursa than in my hometown | 62 | 27.60 ± 6.63 | ||||
| I find the education quality of the university very good | 110 | 31.84 ± 6.99 | ||||
| My university exam score was good enough here | 22 | 26.36 ± 7.53 | ||||
| Social perception | My family and/or close friends live here | 82 | 19.90 ± 4.08 | 3.16 | 0.01 | 5 > 4, 6 |
| I think there are more job opportunities in Bursa after graduation | 95 | 19.96 ± 4.74 | ||||
| I find it easier to study university in Bursa in terms of life opportunities | 68 | 19.74 ± 4.31 | ||||
| I find it more attractive to study at university in Bursa than in my hometown | 62 | 18.66 ± 4.39 | ||||
| I find the education quality of the university very good | 110 | 20.79 ± 4.34 | ||||
| My university exam score was good enough here | 22 | 17.59 ± 3.49 | ||||
| Campus life satisfaction | My family and/or close friends live here | 82 | 28.99 ± 6.65 | 9.99 | 0.00 | 1, 3 > 6/2 > 4, 6/3, 4 < 5 |
| I think there are more job opportunities in Bursa after graduation | 95 | 30.62 ± 6.88 | ||||
| I find it easier to study university in Bursa in terms of life opportunities | 68 | 28.37 ± 7.66 | ||||
| I find it more attractive to study at university in Bursa than in my hometown | 62 | 26.06 ± 6.86 | ||||
| I find the education quality of the university very good | 110 | 31.60 ± 6.61 | ||||
| My university exam score was good enough here | 22 | 23.00 ± 5.44 | ||||
| Accessibility and public transportation satisfaction | My family and/or close friends live here | 82 | 13.65 ± 2.83 | 0.84 | 0.52 | |
| I think there are more job opportunities in Bursa after graduation | 95 | 13.68 ± 3.16 | ||||
| I find it easier to study university in Bursa in terms of life opportunities | 68 | 13.50 ± 2.18 | ||||
| I find it more attractive to study at university in Bursa than in my hometown | 62 | 13.29 ± 3.00 | ||||
| I find the education quality of the university very good | 110 | 13.85 ± 3.41 | ||||
| My university exam score was good enough here | 22 | 12.55 ± 3.57 | ||||
| Administrative managemenet | My family and/or close friends live here | 82 | 12.17 ± 2.88 | 2.98 | 0.01 | 5 > 4 |
| I think there are more job opportunities in Bursa after graduation | 95 | 12.11 ± 3.61 | ||||
| I find it easier to study university in Bursa in terms of life opportunities | 68 | 11.57 ± 3.84 | ||||
| I find it more attractive to study at university in Bursa than in my hometown | 62 | 11.35 ± 4.05 | ||||
| I find the education quality of the university very good | 110 | 13.13 ± 3.67 | ||||
| My university exam score was good enough here | 22 | 11.14 ± 2.78 | ||||
| General QoL | My family and/or close friends live here | 82 | 183.38 ± 29.45 | 8.77 | 0.00 | 1, 2 > 6/5 > 3, 4, 6 |
| I think there are more job opportunities in Bursa after graduation | 95 | 184.85 ± 27.97 | ||||
| I find it easier to study university in Bursa in terms of life opportunities | 68 | 176.50 ± 29.38 | ||||
| I find it more attractive to study at university in Bursa than in my hometown | 62 | 170.05 ± 31.24 | ||||
| I find the education quality of the university very good | 110 | 194.25 ± 32.32 | ||||
| My university exam score was good enough here | 22 | 159.45 ± 26.66 |
| Scale and Dimension | Group | n | ± Sd | KW | p | Difference |
|---|---|---|---|---|---|---|
| Satisfaction with education spaces | To be close to my friends | 22 | 35.64 ± 8.19 | 1.40 | 0.24 | |
| Because it’s my dream job | 208 | 34.37 ± 8.39 | ||||
| Because there are more job opportunities after graduation | 88 | 36.03 ± 7.39 | ||||
| My university exam score was good enough here | 90 | 33.70 ± 8.77 | ||||
| Academic development | To be close to my friends | 22 | 27.09 ± 7.67 | 5.16 | 0.00 | 2, 3 > 1 |
| Because it’s my dream job | 208 | 31.66 ± 6.58 | ||||
| Because there are more job opportunities after graduation | 88 | 31.83 ± 6.04 | ||||
| My university exam score was good enough here | 90 | 29.62 ± 6.56 | ||||
| Socio-physical facility satisfaction | To be close to my friends | 22 | 28.32 ± 4.29 | 1.75 | 0.16 | |
| Because it’s my dream job | 208 | 30.05 ± 7.13 | ||||
| Because there are more job opportunities after graduation | 88 | 31.00 ± 6.25 | ||||
| My university exam score was good enough here | 90 | 28.93 ± 7.49 | ||||
| Social perception | To be close to my friends | 22 | 18.77 ± 2.64 | 4.98 | 0.00 | 3 > 4 |
| Because it’s my dream job | 208 | 19.89 ± 4.43 | ||||
| Because there are more job opportunities after graduation | 88 | 21.16 ± 4.44 | ||||
| My university exam score was good enough here | 90 | 18.78 ± 4.31 | ||||
| Campus life satisfaction | To be close to my friends | 22 | 27.00 ± 7.52 | 5.78 | 0.00 | 3 > 4 |
| Because it’s my dream job | 208 | 30.07 ± 7.38 | ||||
| Because there are more job opportunities after graduation | 88 | 30.59 ± 6.56 | ||||
| My university exam score was good enough here | 90 | 26.98 ± 6.80 | ||||
| Accessibility and public transportation satisfaction | To be close to my friends | 22 | 13.18 ± 1.82 | 1.29 | 0.28 | |
| Because it’s my dream job | 208 | 13.68 ± 3.05 | ||||
| Because there are more job opportunities after graduation | 88 | 14.01 ± 3.11 | ||||
| My university exam score was good enough here | 90 | 13.19 ± 3.08 | ||||
| Dormitory/housing satisfaction | To be close to my friends | 22 | 12.23 ± 2.18 | 1.06 | 0.37 | |
| Because it’s my dream job | 208 | 12.50 ± 2.80 | ||||
| Because there are more job opportunities after graduation | 88 | 13.02 ± 2.72 | ||||
| My university exam score was good enough here | 90 | 12.44 ± 2.56 | ||||
| Administrative managemenet | To be close to my friends | 22 | 11.82 ± 3.74 | 0.12 | 0.95 | |
| Because it’s my dream job | 208 | 12.28 ± 3.68 | ||||
| Because there are more job opportunities after graduation | 88 | 12.18 ± 3.40 | ||||
| My university exam score was good enough here | 90 | 12.14 ± 3.62 | ||||
| General QoL | To be close to my friends | 22 | 174.05 ± 25.84 | 3.85 | 0.01 | 3 > 4 |
| Because it’s my dream job | 208 | 184.50 ± 33.13 | ||||
| Because there are more job opportunities after graduation | 88 | 189.83 ± 28.37 | ||||
| My university exam score was good enough here | 90 | 175.79 ± 28.84 |
References
- World Health Organizaton. The World Health Organization Quality of Life Assessment (WHOQOL): Position Paper from the World Health Organization. Soc. Sci. Med. 1995, 41, 1403–1409. [Google Scholar] [CrossRef] [PubMed]
- Szalai, A.A.F.M. The Quality of Life: Comparative Studies; Sage: Newbury Park, CA, USA, 1980. [Google Scholar]
- Van Kamp, I.; Leidelmeijer, K.; Marsman, G.; De Hollander, A. Urban environmental quality and human well-being Towards a conceptual framework and demarcation of concepts; a literature study. Landsc. Urban Plan. 2003, 65, 5–18. [Google Scholar] [CrossRef]
- Veenhoven, R. The four qualities of life. Ordering concepts and measures of the good life. J. Happiness Stud. 2000, 1, 1–39. [Google Scholar] [CrossRef]
- Veenhoven, R. Quality-of-Life in the Modern Society Measured with Happy Life Years. In Happiness and Public Policy; Palgrave Macmillan: New York, NY, USA, 2006; pp. 19–44. [Google Scholar] [CrossRef]
- Larsen, R.J.; Eid, M. Ed Diener and the Science of Subjective Well-Being. In The Science of Subjective Well-Being; Eid, M., Larsen, R.J., Eds.; The Guilford Press: New York, NY, USA, 2008; pp. 1–13. [Google Scholar]
- Diener, E.W.D.; Wirtz, D.; Biswas-Diener, R.; Tov, W. New Measures of Well-Being. In Assessing Well-Being; Springer: New York, NY, USA, 2009. [Google Scholar]
- World Health Organization. WHOQOL Measuring Quality of Life. In Division of Mental Health and Prevention of Substance Abuse; World Health Organization: New York, NY, USA, 1997. [Google Scholar]
- Revicki, D.A.; Osoba, D.; Fairclough, D.; Barofsky, I.; Berzon, R.; Leidy, N.K.; Rothman, M. Recommendations on health-related quality of life research to support labeling and promotional claims in the United States. Qual. Lİfe Res. 2000, 9, 887–900. [Google Scholar] [CrossRef]
- Sprangers, M.A.G.; Schwartz, C.E. Integrating response shift into health-related quality of life research: A theoretical model. Soc. Sci. Med. 1999, 48, 1507–1515. [Google Scholar] [CrossRef] [PubMed]
- Carr, A.J.; Gibson, B.; Robinson, P.G. Measuring quality of life: Is quality of life determined by expectations or experience? BMJ 2001, 322, 1240–1243. [Google Scholar] [CrossRef]
- Jalili, S.; Martínez-Tur, V.; Estreder, Y.; Moliner, C.; Gracia, E.; Fajardo-Castro, L.V. Trust and quality of life: A study in organizations for individuals with intellectual disability. Res. Dev. Disabil. 2024, 151, 104782. [Google Scholar] [CrossRef]
- Verdugo, M.A.; Schalock, R.L. From a concept to a theory: The six eras of quality of life research and application. Res. Dev. Disabil. 2024, 150, 104763. [Google Scholar] [CrossRef]
- Marans, R.W. Understanding environmental quality through quality of life studies: The 2001 DAS and its use of subjective and objective indicators. Landsc. Urban Plan. 2003, 65, 73–83. [Google Scholar] [CrossRef]
- Sirgy, M.J.; Cornwell, T. How neighborhood features affect quality of life. Soc. Indic. Res. 2002, 59, 79–114. [Google Scholar] [CrossRef]
- Duque, J.A.G.; Panagopoulos, T. Urban Planning throughout environmental quality and human well-being. In Spatial and Organizational Dynamics Discussion Papers; University of Algarve: Faro, Portugal, 2010; pp. 7–20. [Google Scholar]
- Westaway, M.S. A longitudinal investigation of satisfaction with personal and environmental quality of life in an informal South African housing settlement, Doornkop, Soweto. Habitat. Int. 2006, 30, 175–189. [Google Scholar] [CrossRef]
- Ülengin, B.; Ülengin, F.; Güvenç, Ü. A multidimensional approach to urban quality of life: The case of Istanbul. Eur. J. Oper. Res. 2001, 130, 361–374. [Google Scholar] [CrossRef]
- Wesz, J.G.B.; Miron, L.I.G.; Delsante, I.; Tzortzopoulos, P. Urban Quality of Life: A Systematic Literature Review. Urban. Sci. 2023, 7, 56. [Google Scholar] [CrossRef]
- Cerletti, P.; Eze, I.C.; Keidel, D.; Schaffner, E.; Stolz, D.; Gasche-Soccal, P.M.; Rothe, T.; Imboden, M.; Probst-Hensch, N. Perceived built environment, health-related quality of life and health care utilization. PLoS ONE 2021, 16, e0251251. [Google Scholar] [CrossRef]
- Fleming, R.; Goodenough, B.; Low, L.F.; Chenoweth, L.; Brodaty, H. The relationship between the quality of the built environment and the quality of life of people with dementia in residential care. Dementia 2016, 15, 663–680. [Google Scholar] [CrossRef]
- Evans, G.W. The Built Environment and Mental Health. J. Urban. Health 2003, 80, 536–555. [Google Scholar] [CrossRef]
- Mohit, M.A. Quality of Life in Natural and Built Environment—An Introductory Analysis. Procedia Soc. Behav. Sci. 2013, 101, 33–43. [Google Scholar] [CrossRef]
- Esfandiari, M.; Mohamed Zaid, S.; Ismail, M.A. Investigating the Indoor Environment Quality Parameters and Their Relationship with Occupants’ Satisfaction in Office Buildings: A Review. J. Des. Built Environ. 2017, 29, 181–194. [Google Scholar] [CrossRef]
- Muhajarine, N.; Labonte, R.; Williams, A.; Randall, J. Person, Perception, and Place: What Matters to Health and Quality of Life. Soc. Indic. Res. 2008, 85, 53–80. [Google Scholar] [CrossRef]
- Salleh, A.G. Neighbourhood factors in private low-cost housing in Malaysia. Habitat. Int. 2008, 32, 485–493. [Google Scholar] [CrossRef]
- Kowaltowski, D.C.C.K.; da Silva, V.G.; Pina, S.A.M.G.; Labaki, L.C.; Ruschel, R.C.; de Carvalho Moreira, D. Quality of life and sustainability issues as seen by the population of low-income housing in the region of Campinas, Brazil. Habitat. Int. 2006, 30, 1100–1114. [Google Scholar] [CrossRef]
- Murdie, R.A.; Rhyne, D.; Bates, J. Modelling Quality of Life Indicators in Canada: A Feasibility Analysis; Centre for Future Studies in Housing and Living Environments, Canada Mortgage and Housing Corporation: Ottawa, ON, Canada, 1992. [Google Scholar]
- Cuadrado-Ballesteros, B.; García-Sánchez, I.M.; Prado-Lorenzo, J.M. Effects of different modes of local public services delivery on quality of life in Spain. J. Clean. Prod. 2012, 37, 68–81. [Google Scholar] [CrossRef]
- Bonaiuto, M.; Fornara, F.; Bonnes, M. Indexes of perceived residential environment quality and neighbourhood attachment in urban environments: A confirmation study on the city of Rome. Landsc. Urban Plan 2003, 65, 41–52. [Google Scholar] [CrossRef]
- Oktay, D.; Rüstemli, A.; Marans, R. Neighborhood satisfaction, sense of community, and attachment: Initial findings from Famagusta quality of urban life study. A|Z ITU J. Fac. Archit. 2009, 6, 6–20. [Google Scholar]
- Greenberg, M.; Crossney, K. Perceived neighborhood quality in the United States: Measuring outdoor, housing and jurisdictional influences. Socio-Econ. Plan. Sci. 2007, 41, 181–194. [Google Scholar] [CrossRef]
- de Hollander, A.E.M.; Hoeymans, N.; Melse, J.M.; van Oers, J.A.M.; Polder, J.J. Care for Health: The 2006 Dutch Public Health Status and Forecasts Report; RIVM Centrum VTV: Bilthoven, The Netherlands, 2007. [Google Scholar]
- Pacione, M. Urban environmental quality and human wellbeing—A social geographical perspective. Landsc. Urban Plan 2003, 65, 19–30. [Google Scholar] [CrossRef]
- Mazumdar, S. Sense of Place Consideration for Quality of Urban Life. In Quality of Urban Life Policy Versus Practice; Gülersoy, N.Z., Esin, N., Özsoy, A., Eds.; Istanbul Technical University: Istanbul, Turkey, 2003. [Google Scholar]
- Chen, Y.; Li, M.; Lu, J.; Chen, B. Influence of residential indoor environment on quality of life in China. Build Environ. 2023, 232, 110068. [Google Scholar] [CrossRef]
- Becerik-Gerber, B.; Lucas, G.; Aryal, A.; Awada, M.; Bergés, M.; Billington, S.L.; Boric-Lubecke, O.; Ghahramani, A.; Heydarian, A.; Jazizadeh, F.; et al. Ten questions concerning human-building interaction research for improving the quality of life. Build Environ. 2022, 226, 109681. [Google Scholar] [CrossRef]
- Je, H.; Lee, J.; Cheong, S.; Shin, S.W. A Study on Residential Quality Index of Super High-Rise Apartment Housing through Survey with Experts. In Proceedings of the International Conference on Sustainable Building Asia, Seoul, Republic of Korea, 27–29 June 2007. [Google Scholar]
- Li, S.M.; Song, Y.L. Redevelopment, Displacement, Housing Conditions, and Residential Satisfaction: A Study of Shanghai. Environ. Plan. A Econ. Space 2009, 41, 1090–1108. [Google Scholar] [CrossRef]
- Shan, X.; Melina, A.N.; Yang, E.H. Impact of indoor environmental quality on students’ wellbeing and performance in educational building through life cycle costing perspective. J. Clean. Prod. 2018, 204, 298–309. [Google Scholar] [CrossRef]
- Končeková, D.; Rollová, L. Design of School Environment in the 21st Century. Adv. Mat. Res. 2014, 899, 302–306. [Google Scholar] [CrossRef]
- Baba, A.; Shahrour, I.; Baba, M. Indoor Environmental Quality for Comfort Learning Environments: Case Study of Palestinian School Buildings. Buildings 2024, 14, 1296. [Google Scholar] [CrossRef]
- Theodosiou, T.G.; Ordoumpozanis, K.T. Energy, comfort and indoor air quality in nursery and elementary school buildings in the cold climatic zone of Greece. Energy Build. 2008, 40, 2207–2214. [Google Scholar] [CrossRef]
- Santos, P.; Carvalho Pereira, A.; Gervásio, H.; Bettencourt, A.; Mateus, D. Assessment of health and comfort criteria in a life cycle social context: Application to buildings for higher education. Build Environ. 2017, 123, 625–648. [Google Scholar] [CrossRef]
- Dodd, A.L.; Punton, G.; McLaren, J.M.A.; Sillence, E.; Byrom, N. How Can the University Environment Support Student Quality of Life? A Novel Conceptual Model. Educ. Sci. 2024, 14, 547. [Google Scholar] [CrossRef]
- Karadag, I.; Güzelci, O.Z.; Alaçam, S. EDU-AI: A twofold machine learning model to support classroom layout generation. Constr. Innov. 2023, 23, 898–914. [Google Scholar] [CrossRef]
- Güzelci, O.Z.; Şen Bayram, A.K.; Alaçam, S.; Güzelci, H.; Akkuyu, E.I.; Şencan, İ. Design tactics for enhancing the adaptability of primary and middle schools to the new needs of postpandemic reuse. Archnet-IJAR Int. J. Archit. Res. 2020, 15, 148–166. [Google Scholar] [CrossRef]
- Sirgy, M.J.; Grzeskowiak, S.; Rahtz, D. Quality of college life (QCL) of students: Developing and validating a measure of well-being. Soc. Indic. Res. 2007, 80, 343–360. [Google Scholar] [CrossRef]
- Martin, F. Perceptions of Links Between Quality of Life Areas: Implications for Measurement and Practice. Soc. Indic. Res. 2012, 106, 95–107. [Google Scholar] [CrossRef]
- Rodrigues, D.S.; Ramos, R.A.; Rodrigues, D.S.; Ramos, R.A.R.; Mendes, J.F.G. Multi-dimensional evaluation model of quality of life in campus. WSEAS Trans. Inf. Sci. Appl. 2009, 6, 1882–1892. Available online: http://www.civil.uminho.pt (accessed on 9 August 2024).
- Hajrasouliha, A. Campus score: Measuring university campus qualities. Landsc. Urban Plan. 2017, 158, 166–176. [Google Scholar] [CrossRef]
- Ramón-Arbués, E.; Echániz-Serrano, E.; Martínez-Abadía, B.; Antón-Solanas, I.; Cobos-Rincón, A.; Santolalla-Arnedo, I.; Juárez-Vela, R.; Adam Jerue, B. Predictors of the Quality of Life of University Students: A Cross-Sectional Study. Int. J. Environ. Res. Public Health 2022, 19, 12043. [Google Scholar] [CrossRef]
- Tavakoly Sany, S.B.; Aman, N.; Jangi, F.; Lael-Monfared, E.; Tehrani, H.; Jafari, A. Quality of life and life satisfaction among university students: Exploring, subjective norms, general health, optimism, and attitude as potential mediators. J. Am. Coll. Health 2023, 71, 1045–1052. [Google Scholar] [CrossRef]
- Botha, F.; Snowball, J.; de Klerk, V.; Radloff, S. Determinants of Student Satisfaction with Campus Residence Life at a South African University. In A New Research Agenda for Improvements in Quality of Life; Springer: New York, NY, USA, 2015; pp. 17–35. [Google Scholar] [CrossRef]
- Noh, I.; Alim, N.M.; Abdul Latip, M.S.; Lenggogini, S. Defining University Student’s Satisfaction Towards Campus Food Service: A Study at Food Outlet UiTM Cawangan Selangor, Puncak Alam Campus (DINESERV). Int. J. Acad. Res. Bus. Soc. Sci. 2023, 13, 317–325. [Google Scholar] [CrossRef]
- Chow, H.P.H. Life satisfaction among university students in a Canadian prairie city: A multivariate analysis. Soc. Indic. Res. 2005, 70, 139–150. [Google Scholar] [CrossRef]
- Hong, S.M.; Giannakopoulos, E. Effects of age, sex and university status on life-satisfaction. Psychol. Rep. 1994, 74, 99–103. [Google Scholar] [CrossRef]
- Al-Shaer, E.A.; Aliedan, M.M.; Zayed, M.A.; Elrayah, M.; Moustafa, M.A. Mental Health and Quality of Life among University Students with Disabilities: The Moderating Role of Religiosity and Social Connectedness. Sustainability 2024, 16, 644. [Google Scholar] [CrossRef]
- Holt, E.W.; Lombard, Q.K.; Best, N.; Smiley-Smith, S.; Quinn, J.E. Active and passive use of green space, health, and well-being amongst university students. Int. J. Environ. Res. Public Health 2019, 16, 424. [Google Scholar] [CrossRef]
- Hipp, J.A.; Gulwadi, G.B.; Alves, S.; Sequeira, S. The Relationship Between Perceived Greenness and Perceived Restorativeness of University Campuses and Student-Reported Quality of Life. Environ. Behav. 2016, 48, 1292–1308. [Google Scholar] [CrossRef]
- Ellis, G.D.; Compton, D.M.; Tyson, B.; Bohlig, M. Campus Recreation Participation, Health, and Quality of Life. Recreat. Sports J. 2002, 26, 51–60. [Google Scholar] [CrossRef]
- Mcfarland, A.L.; Waliczek, T.M.; Zajicek, J.M. The Relationship Between Student Use of Campus Green Spaces and Perceptions of Quality of Life. Hort. Technol. 2018, 18, 233–238. [Google Scholar] [CrossRef]
- Giles-Corti, B.; Donovan, R.J. The relative influence of individual, social and physical environment determinants of physical activity. Soc. Sci. Med. 2002, 54, 1793–1812. [Google Scholar] [CrossRef] [PubMed]
- Lachowycz, K.; Jones, A.P. Towards a better understanding of the relationship between greenspace and health: Development of a theoretical framework. Landsc. Urban Plan. 2013, 118, 62–69. [Google Scholar] [CrossRef]
- White, M.P.; Pahl, S.; Wheeler, B.W.; Depledge, M.H.; Fleming, L.E. Natural environments and subjective wellbeing: Different types of exposure are associated with different aspects of wellbeing. Health Place. 2017, 45, 77–84. [Google Scholar] [CrossRef] [PubMed]
- Beatley, T. Handbook of Biophilic City Planning and Design; Island Press: Washington, DC, USA, 2016. [Google Scholar]
- Ahmed, S.M.; Mishra, G.D.; Moss, K.M.; Mouly, T.A.; Yang, I.A.; Knibbs, L.D. Association between residential greenspace and health-related quality of life in children aged 0–12 years. Environ. Res. 2022, 214, 113759. [Google Scholar] [CrossRef]
- Andreucci, M.B.; Russo, A.; Olszewska-Guizzo, A. Designing Urban Green Blue Infrastructure for Mental Health and Elderly Wellbeing. Sustainability 2019, 11, 6425. [Google Scholar] [CrossRef]
- Mitchell, R. Is physical activity in natural environments better for mental health than physical activity in other environments? Soc. Sci. Med. 2013, 91, 130–134. [Google Scholar] [CrossRef]
- Aydin, D.; Er, U.T. Outdoor space quality: Case study of a university campus plaza. ArchNet-IJAR 2008, 2, 189–203. [Google Scholar]
- Iamtrakul, P.; Chayphong, S.; Kantavat, P.; Hayashi, Y.; Kijsirikul, B.; Iwahori, Y. Exploring the Spatial Effects of Built Environment on Quality of Life Related Transportation by Integrating GIS and Deep Learning Approaches. Sustainability 2023, 15, 2785. [Google Scholar] [CrossRef]
- Hamad, E.O. Dose the university built environment matter for students’ quality of academic life: A case study of female students in a Saudi University. In XIII CTV 2019 Proceedings: XIII International Conference on Virtual Cityand Territory: “Challenges and Paradigms of the Contemporary City”: UPC, Barcelona, Spain, 2–4 October 2019; Centre de Politica de Sol i Valoracions, CPSV/Universitat Politècnica de Catalunya; UPC: Barcelona, Spain, 2019. [Google Scholar] [CrossRef]
- Kim, T.W.; Cha, S.; Kim, Y. Space choice, rejection and satisfaction in university campus. Indoor Built Environ. 2018, 27, 233–243. [Google Scholar] [CrossRef]
- Jasic, O.; Kaludjerovic, Z. Perception of quality of life among student population at the University of Tuzla. Kom 2015, 4, 57–77. [Google Scholar] [CrossRef]
- Marchand, G.C.; Nardi, N.M.; Reynolds, D.; Pamoukov, S. The impact of the classroom built environment on student perceptions and learning. J. Environ. Psychol. 2014, 40, 187–197. [Google Scholar] [CrossRef]
- Scott-Webber, L.; Strickland, A.; Kapitula, L.R. Built Environments Impact Behaviors Results of an Active Learning Post-Occupancy Evaluation. Plan. High. Educ. J. 2013, 42, 28. [Google Scholar]
- Dyck, J.A. The Built Environment’s Effect on Learning: Applying Current Research. Montessori Life 2002, 14, 53–56. [Google Scholar]
- Available online: https://uludag.edu.tr/ (accessed on 9 August 2024).
- Gür, M. Post-pandemic lifestyle changes and their interaction with resident behavior in housing and neighborhoods: Bursa, Turkey. J. Hous. Built Environ. 2022, 37, 823–862. [Google Scholar] [CrossRef]
- Gür, M.; Erbil, Y. Konut ve konut çevresine ilişkin kullanıcı memnuniyeti araştırması: Bursa/Yıldırım. Int. J. Soc. Humanit. Sci. Res. (JSHSR) 2018, 5, 4135–4148. [Google Scholar] [CrossRef]
- Mutlu, E.; Varol, Ç. Socio-Economic Differentiation And Spatial Segregation: Analysis Of Bursa Metropolitan Area. Megaron 2017, 12, 87–105. [Google Scholar] [CrossRef]
- Marans, R. Kentsel yaşam kalitesinin ölçülmesi. Mimarlık J. 2007, 335. Available online: http://www.mimarlikdergisi.com/index.cfm?sayfa=mimarlik&DergiSayi=53&RecID=1326 (accessed on 9 August 2024).
- Altomonte, S.; Allen, J.; Bluyssen, P.M.; Brager, G.; Heschong, L.; Loder, A.; Schiavon, S.; Veitch, J.A.; Wang, L.; Wargocki, P. Ten questions concerning well-being in the built environment. Build Environ. 2020, 180, 106949. [Google Scholar] [CrossRef]
- Hoernig, H.; Seasons, M. Monitoring of indicators in local and regional planning practice: Concepts and issues. Plan. Pract. Res. 2004, 19, 81–99. [Google Scholar] [CrossRef]
- Büyüköztürk, Ş. Sosyal Bilimler Için Veri Analizi El Kitabı; Pegem Academy Publications: Ankara, Turkey, 2007. [Google Scholar]
- Field, A.P. Discovering Statistics Using SPSS (and Sex and Drugs and Rock “n” Roll), 3rd ed.; SAGE: Thousand Oaks, CA, USA, 2009. [Google Scholar]
- İslamoğlu, A.H.; Alnıaçık, Ü. Sosyal Bilimlerde Araştırma Yöntemleri (Research Methods in Social Sciences); Beta Publishing: Brussels, Belgium, 2009. [Google Scholar]
- Comrey, A.L.; Lee, H.B. A First Course in Factor Analysis, 2nd ed.; Lawrence Erlbaum Associates, Inc.: Mahwah, NJ, USA, 1992. [Google Scholar]
- George, D.; Mallery, P. SPSS for Windows Step by Step: A Simple Guide and Reference, 10th ed.; Pearson: San Antonio, TX, USA, 2016. [Google Scholar]
- Tabachnick, B.; Fidell, L.S. Using Multivariate Statistics, 6th ed.; Pearson: San Antonio, TX, USA, 2015. [Google Scholar]
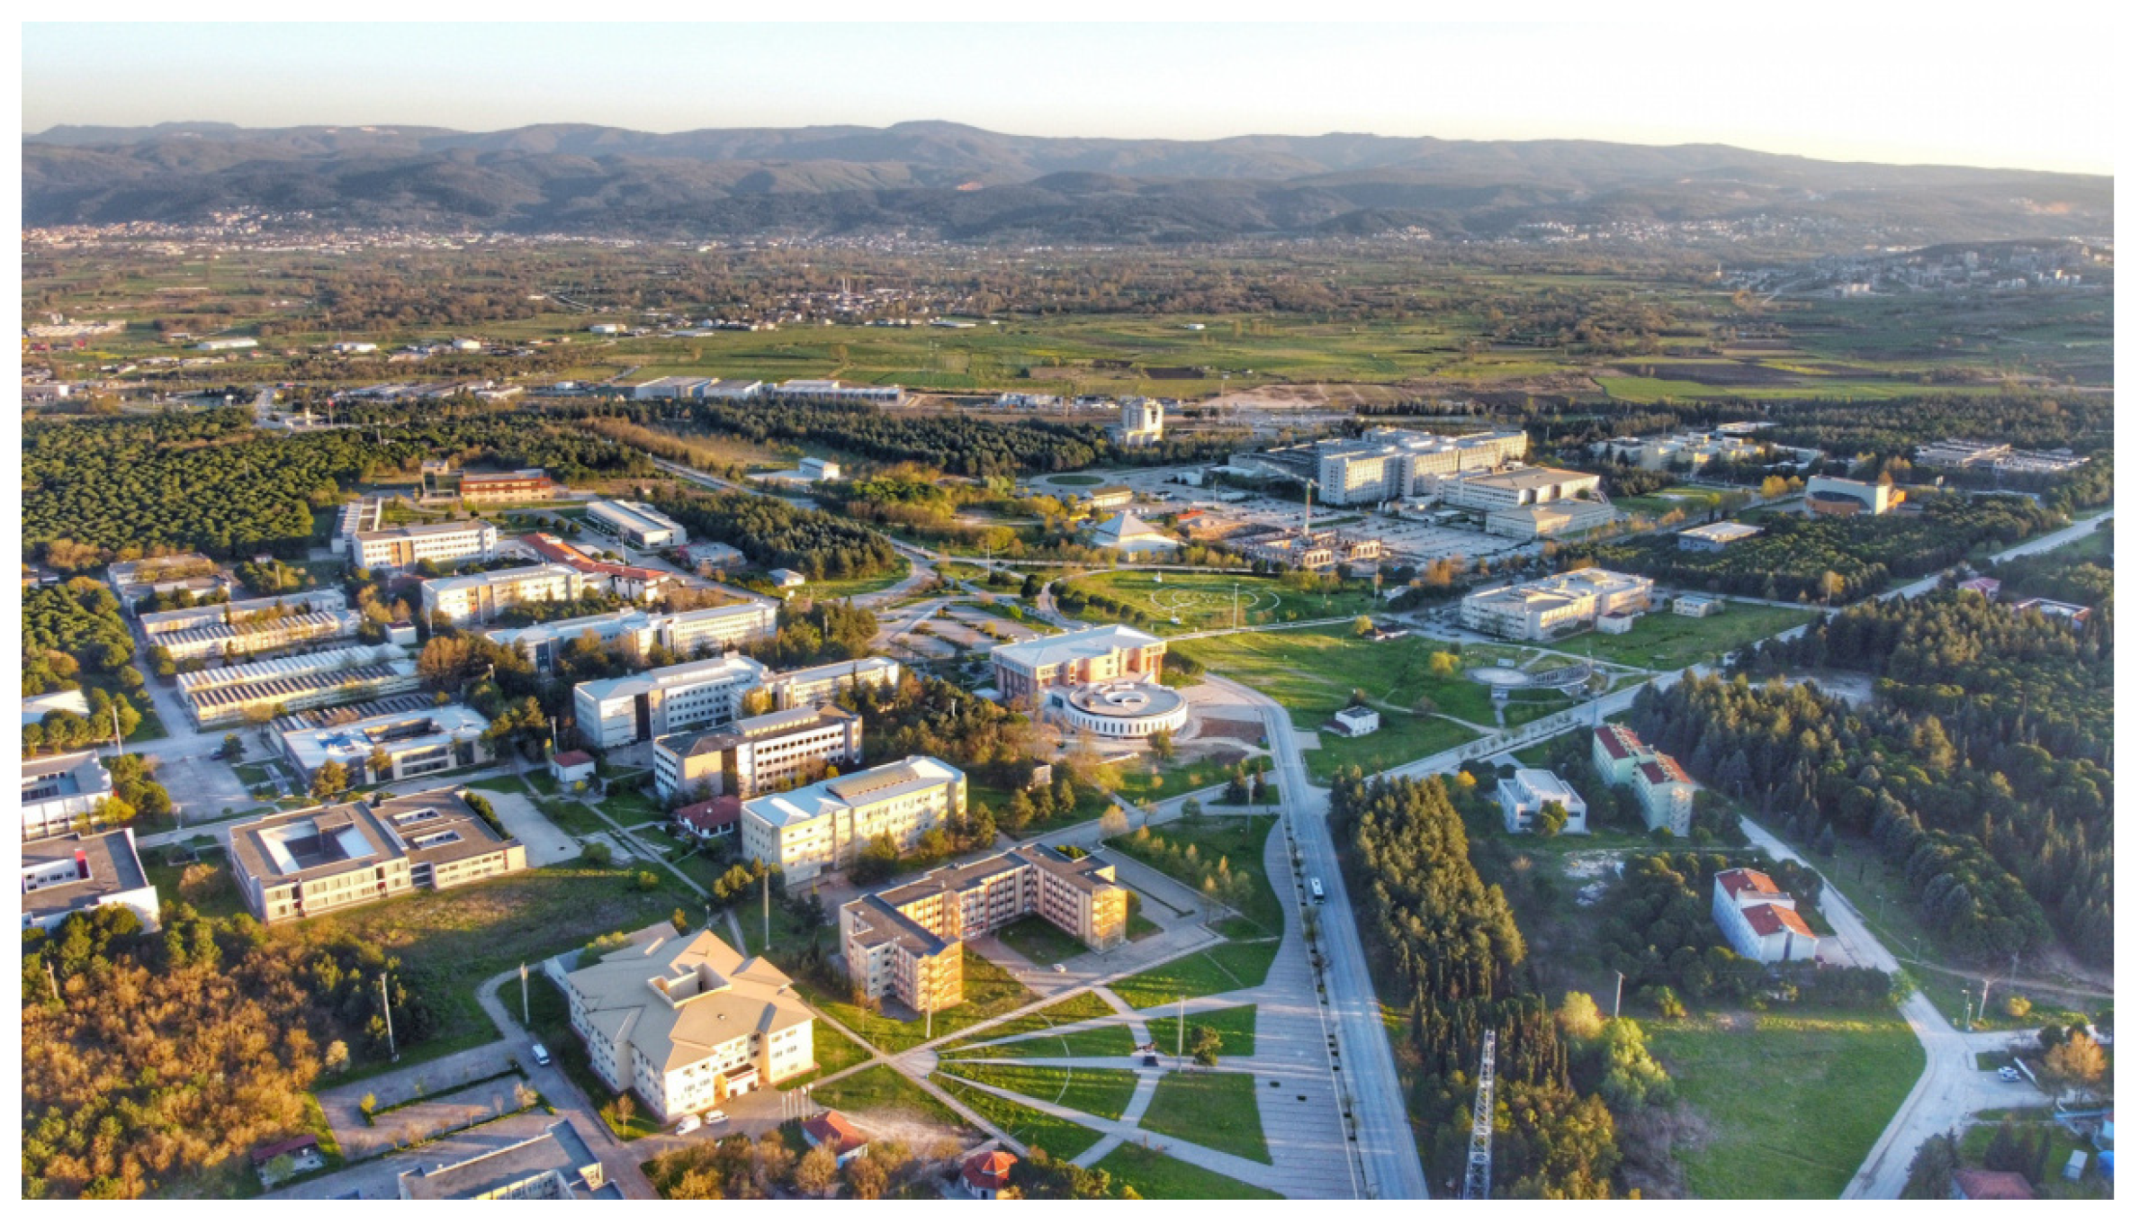
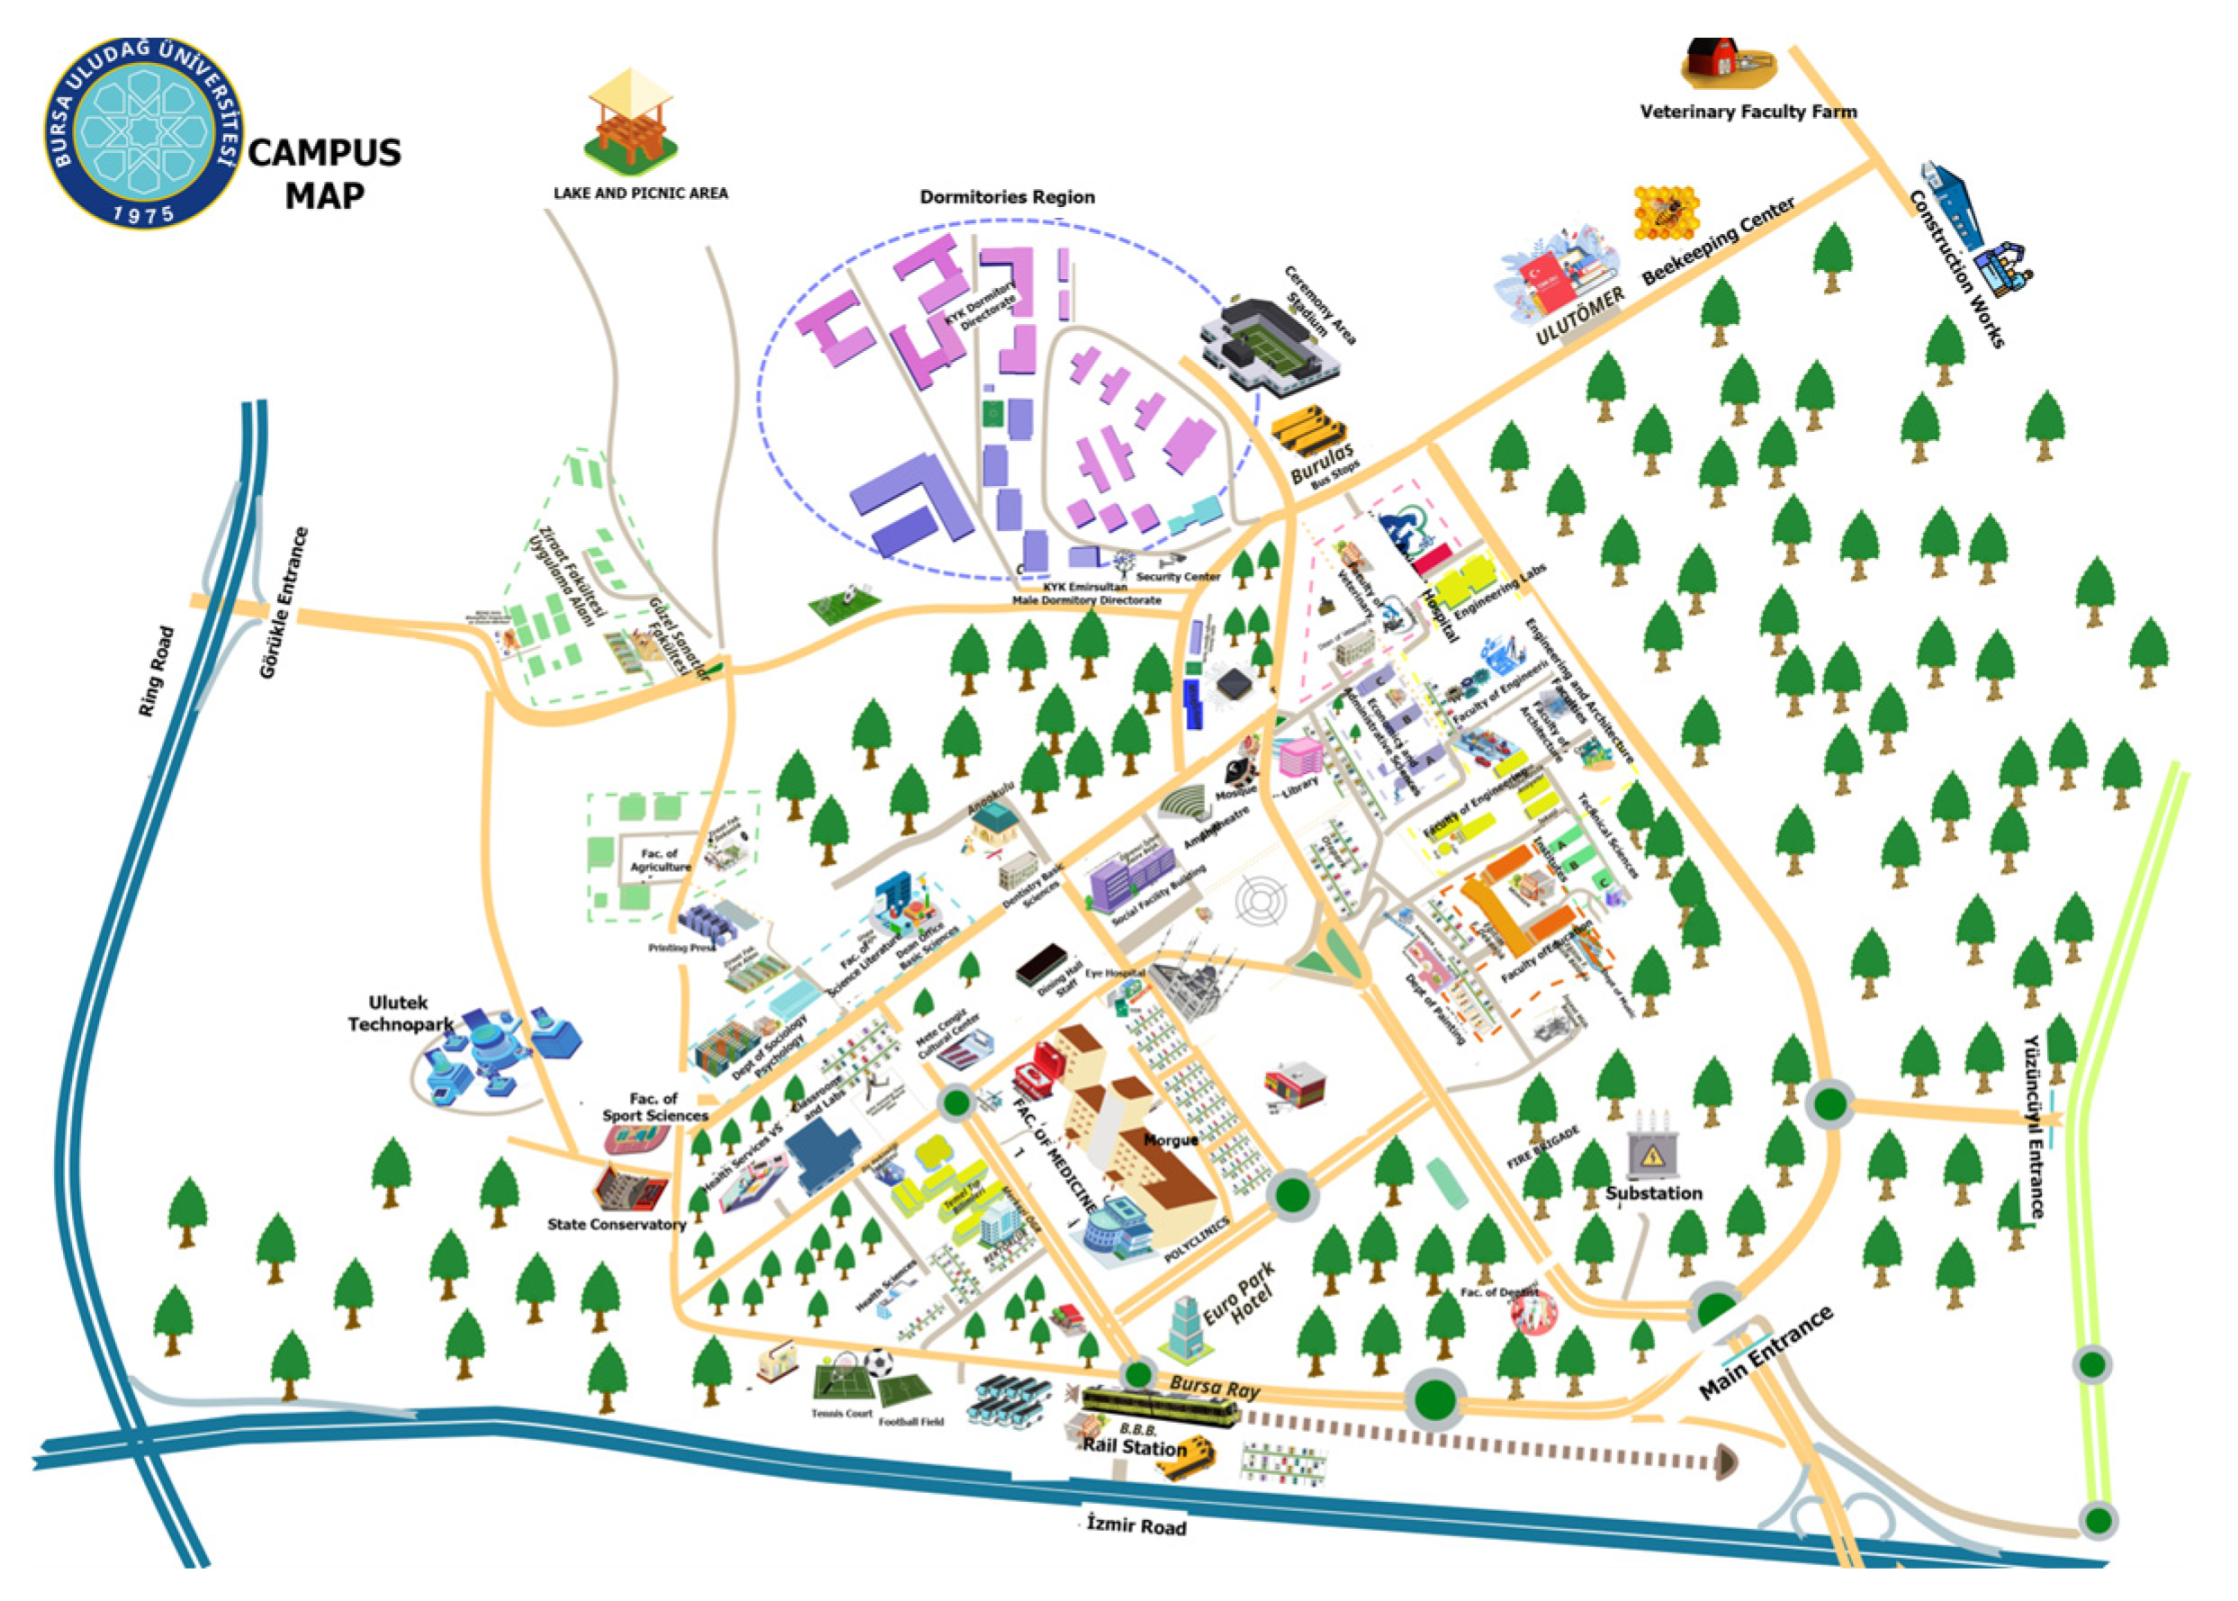
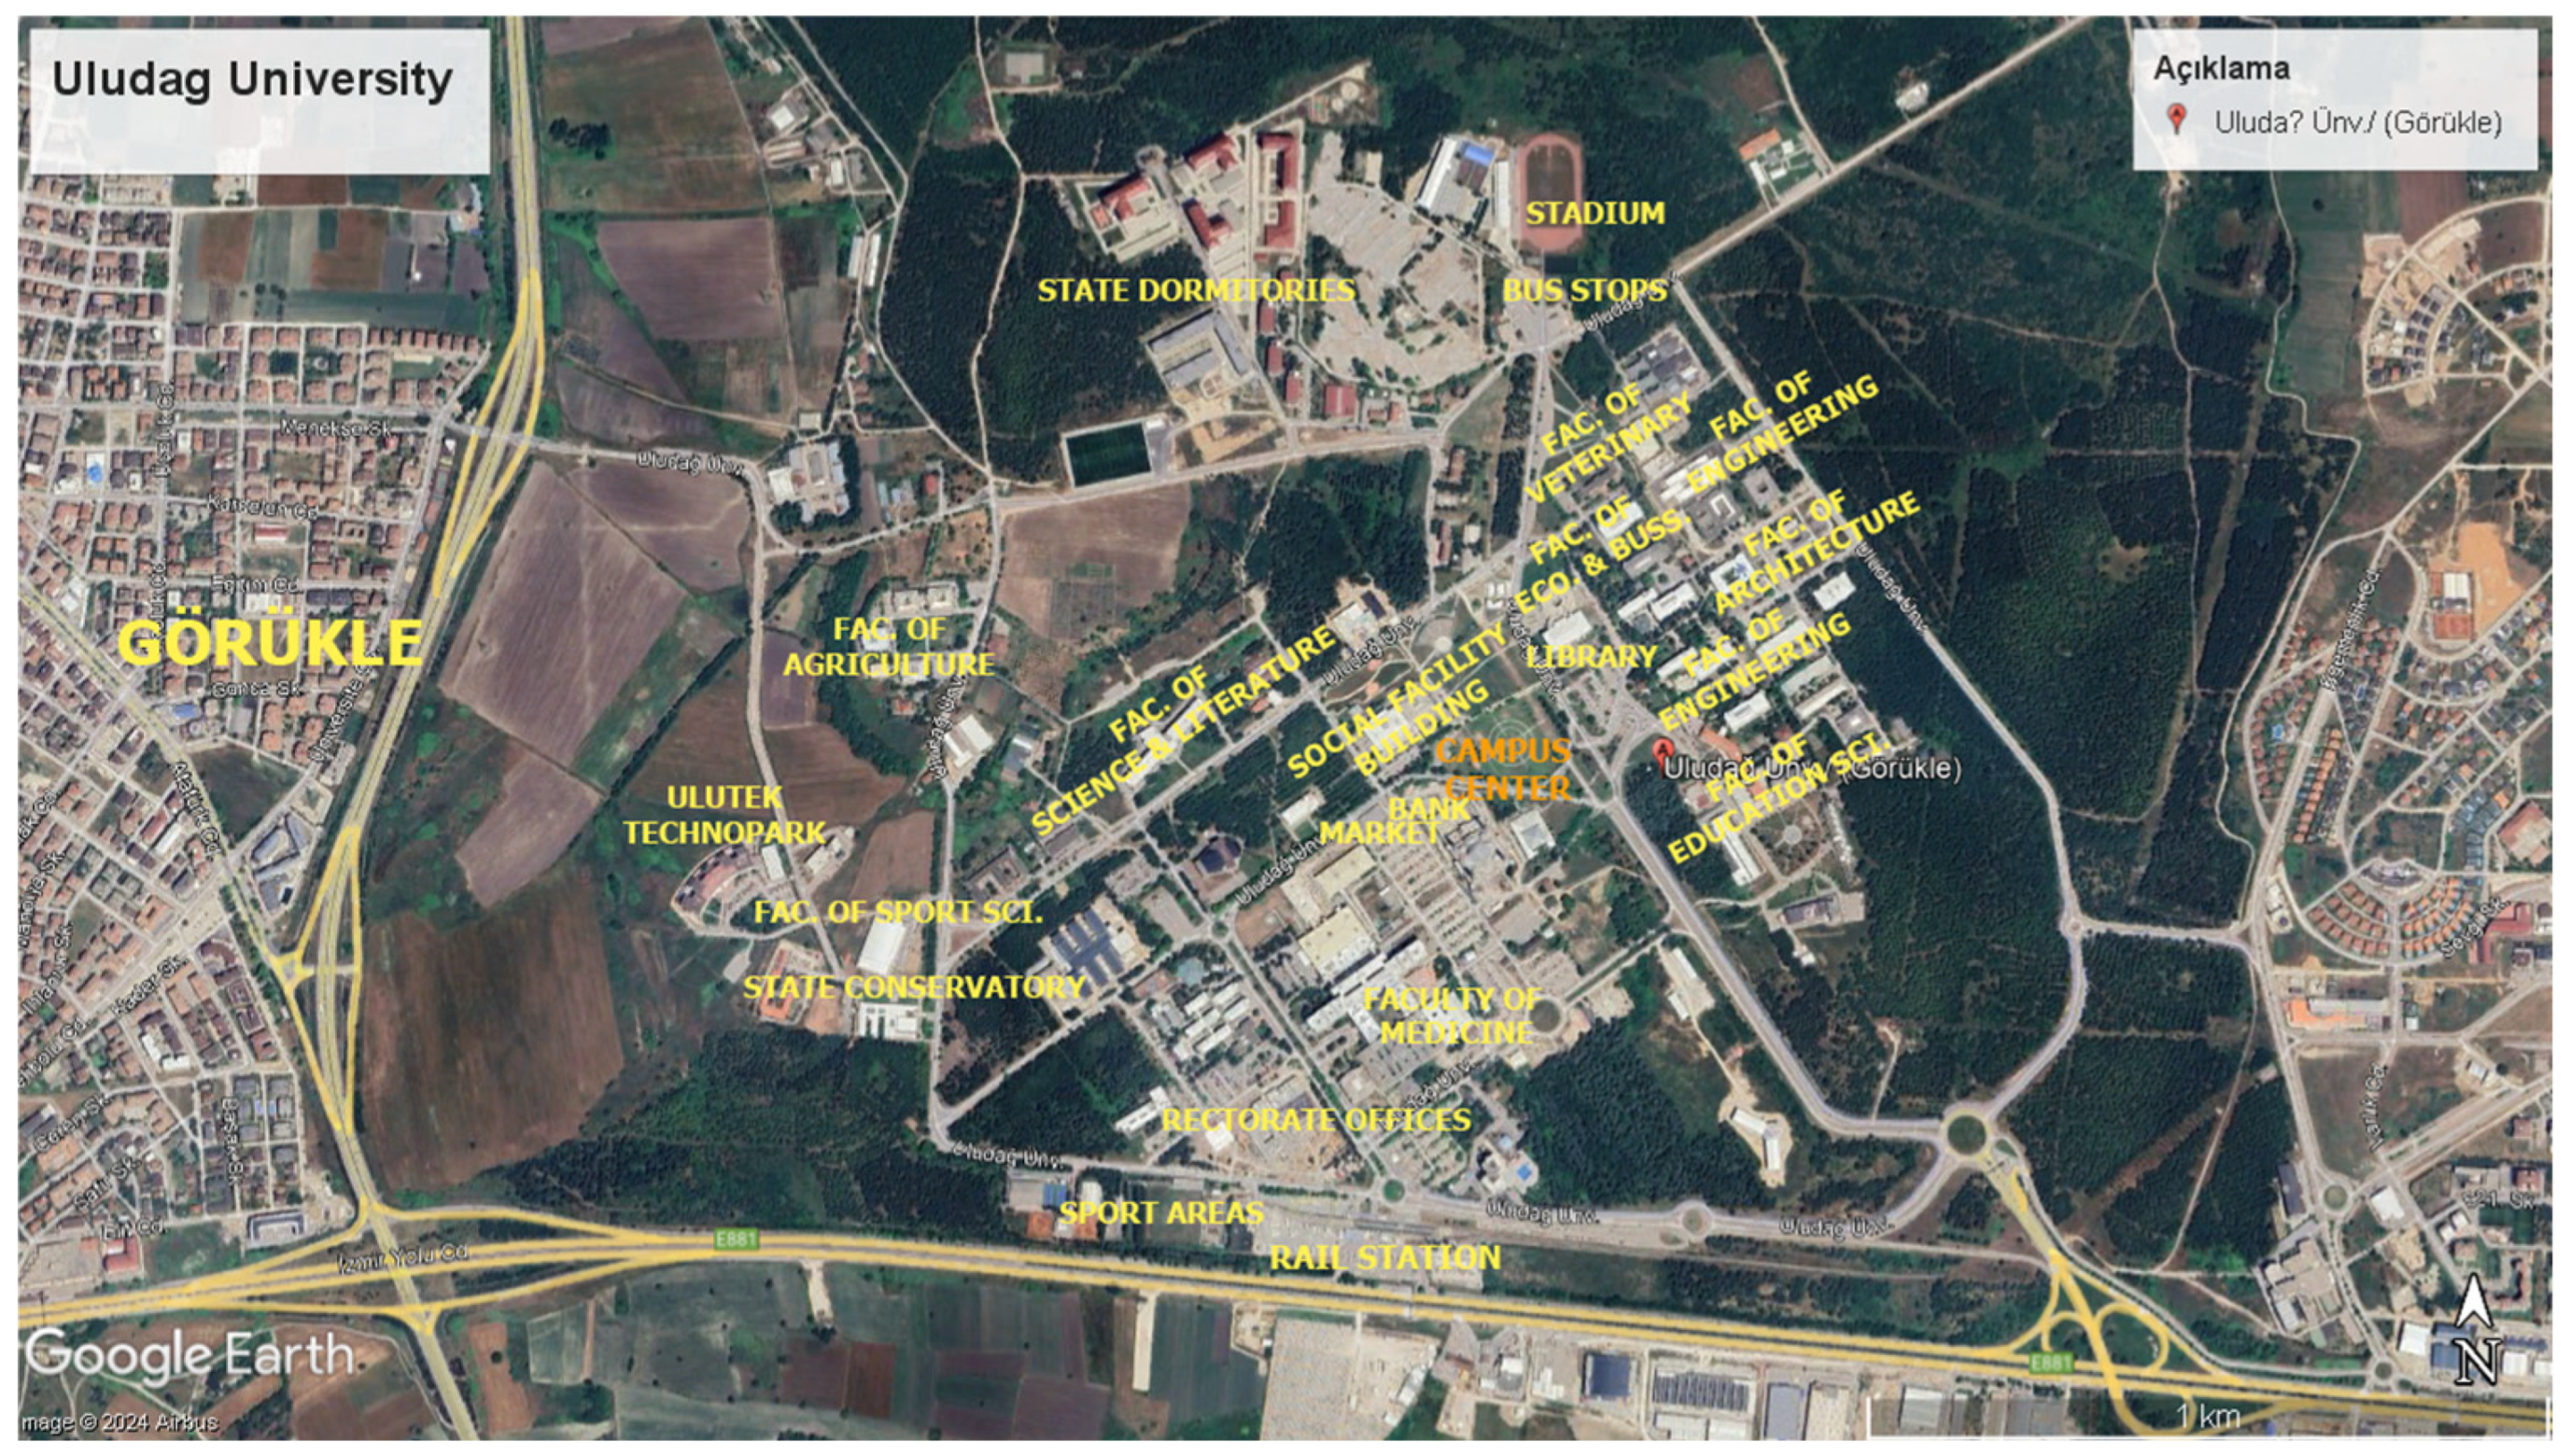
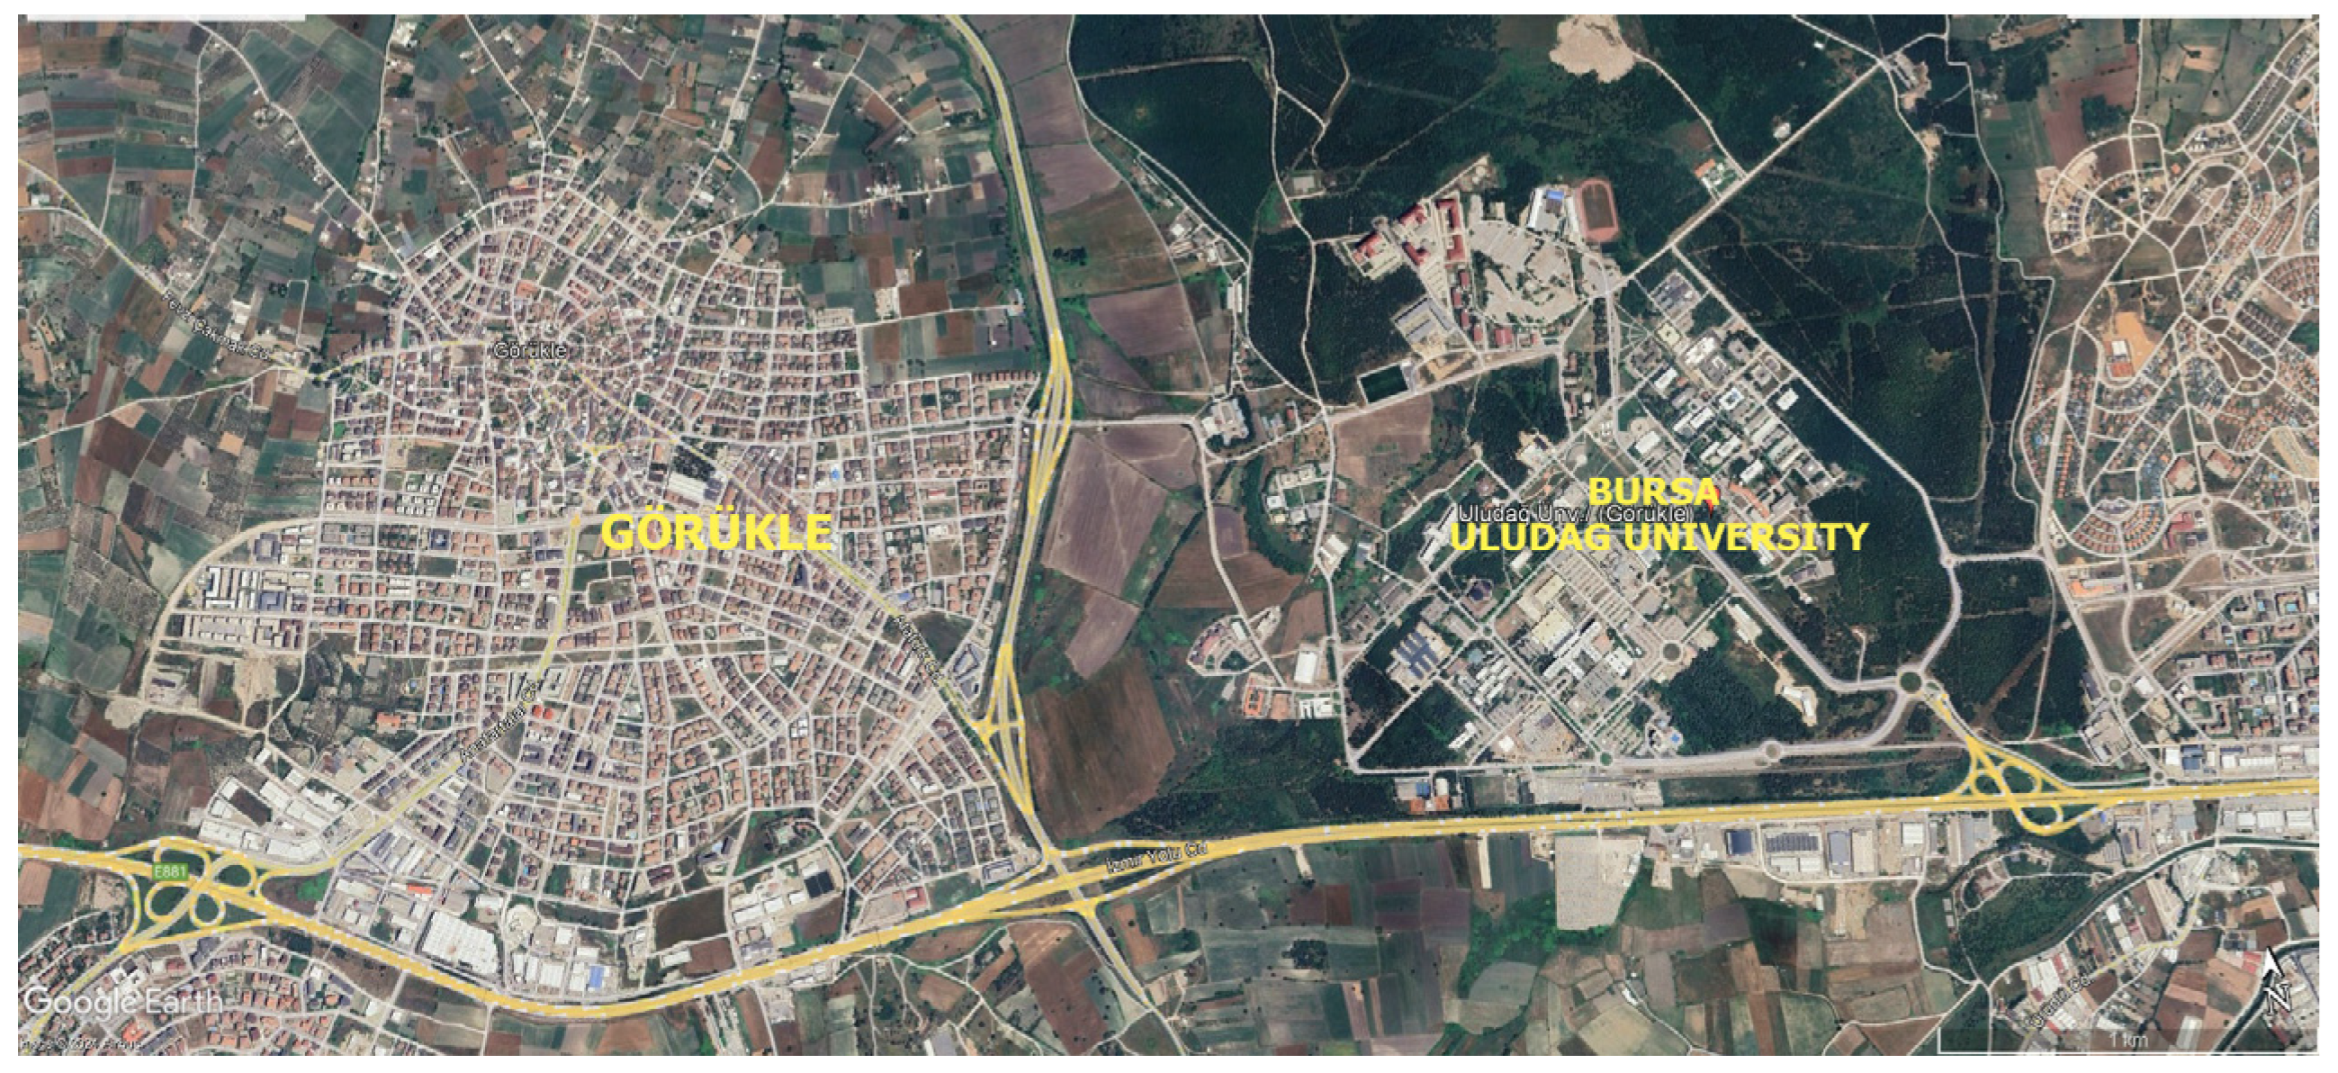
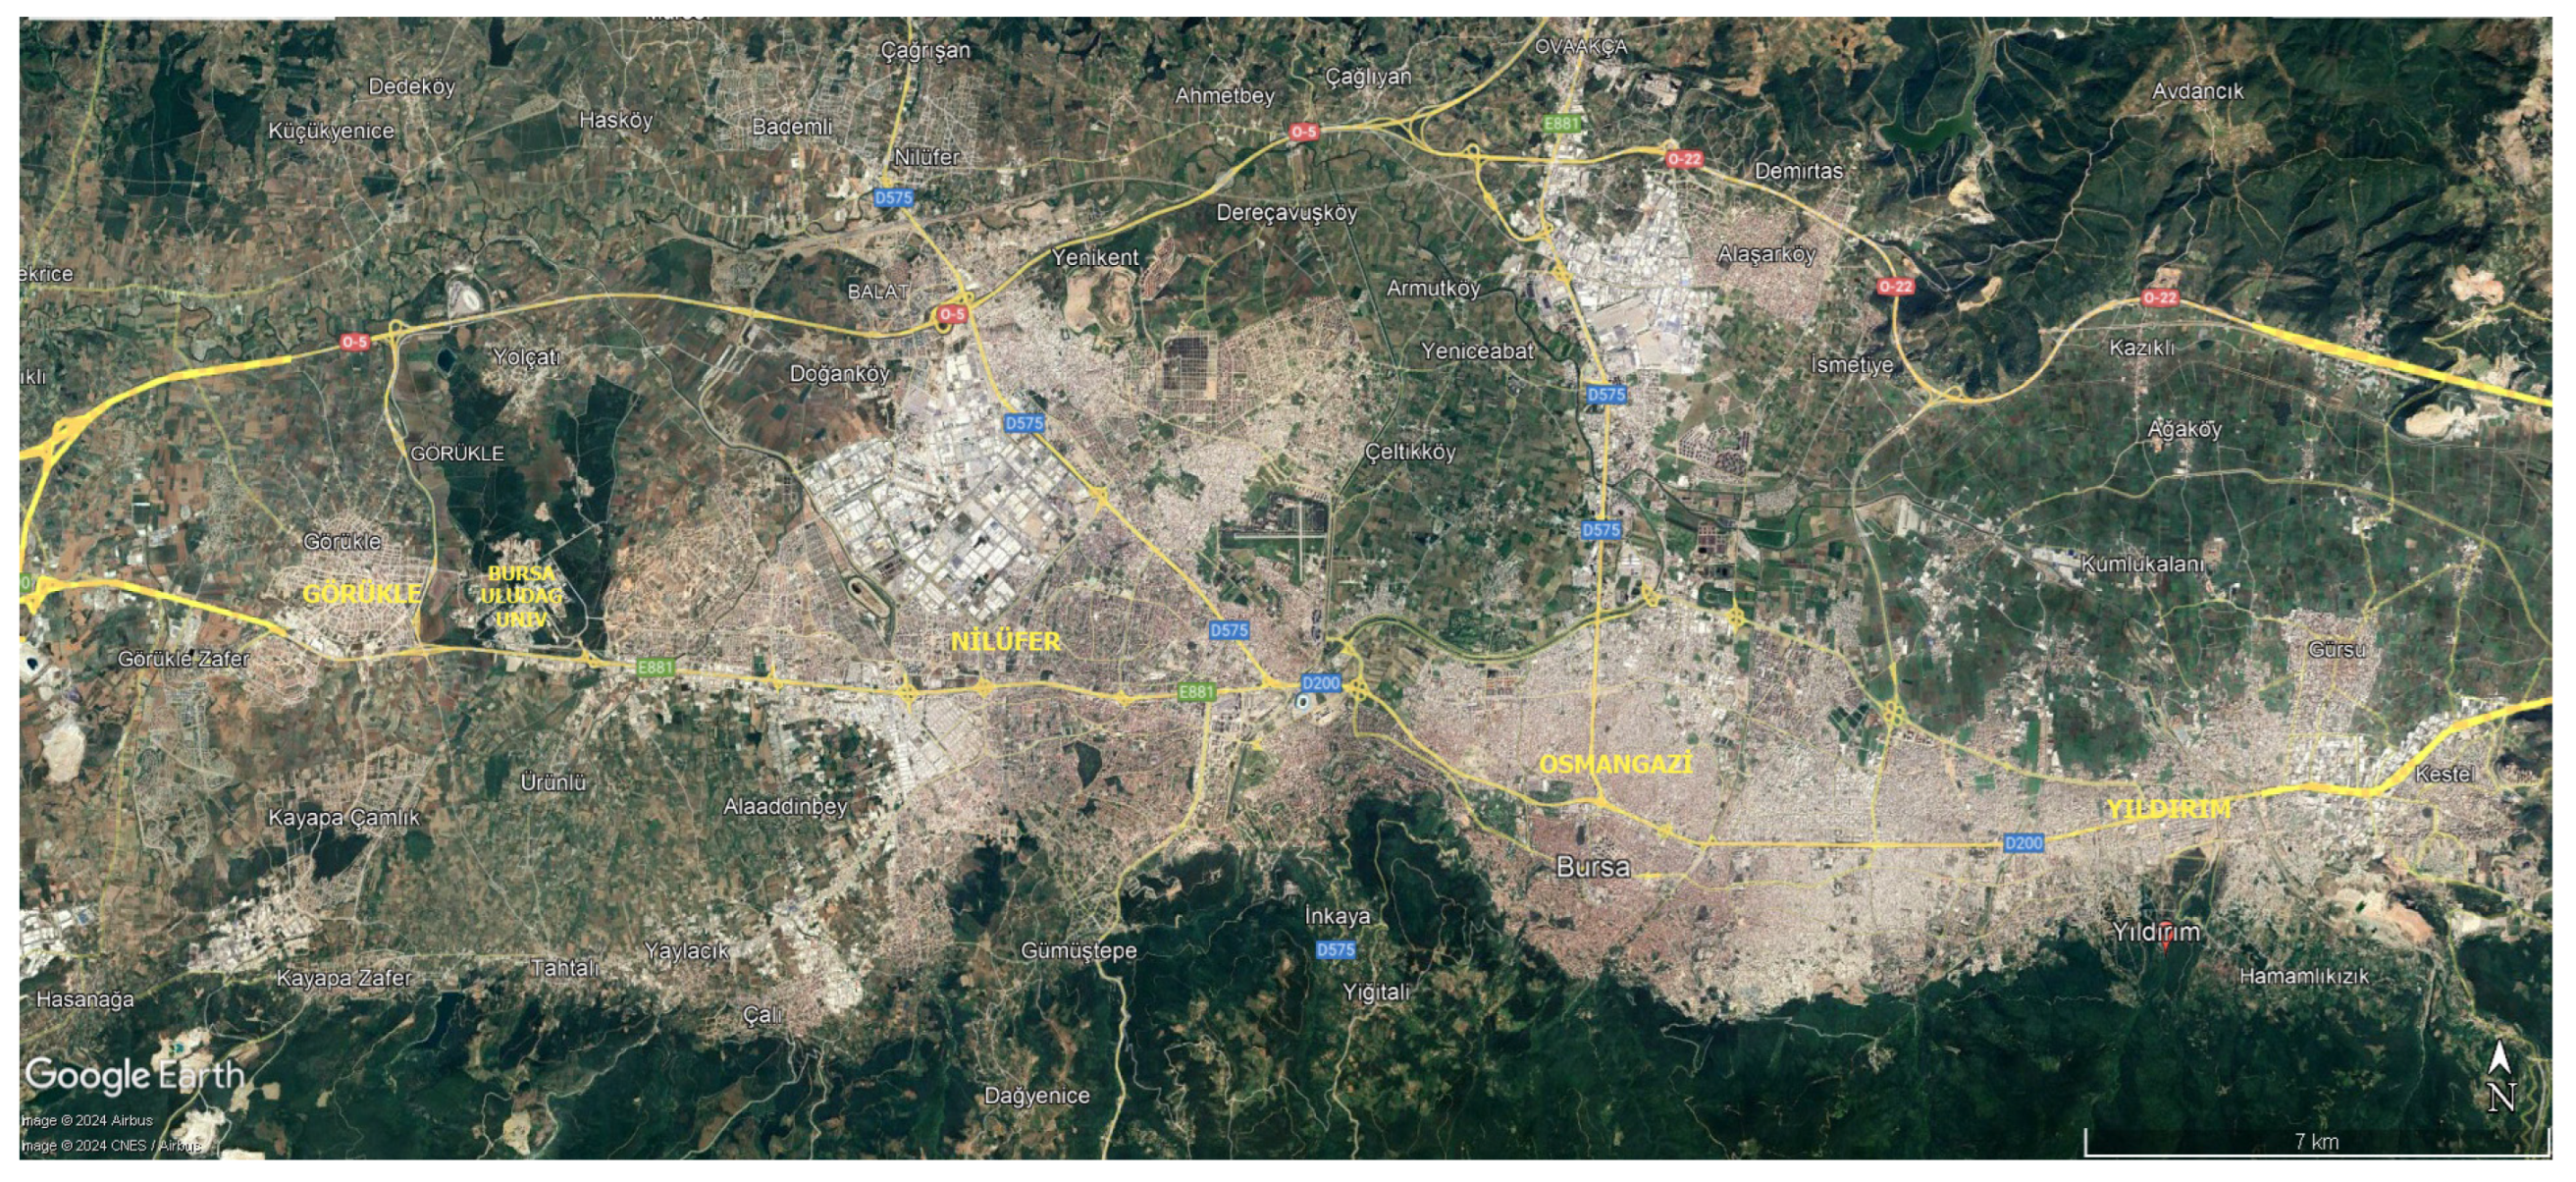

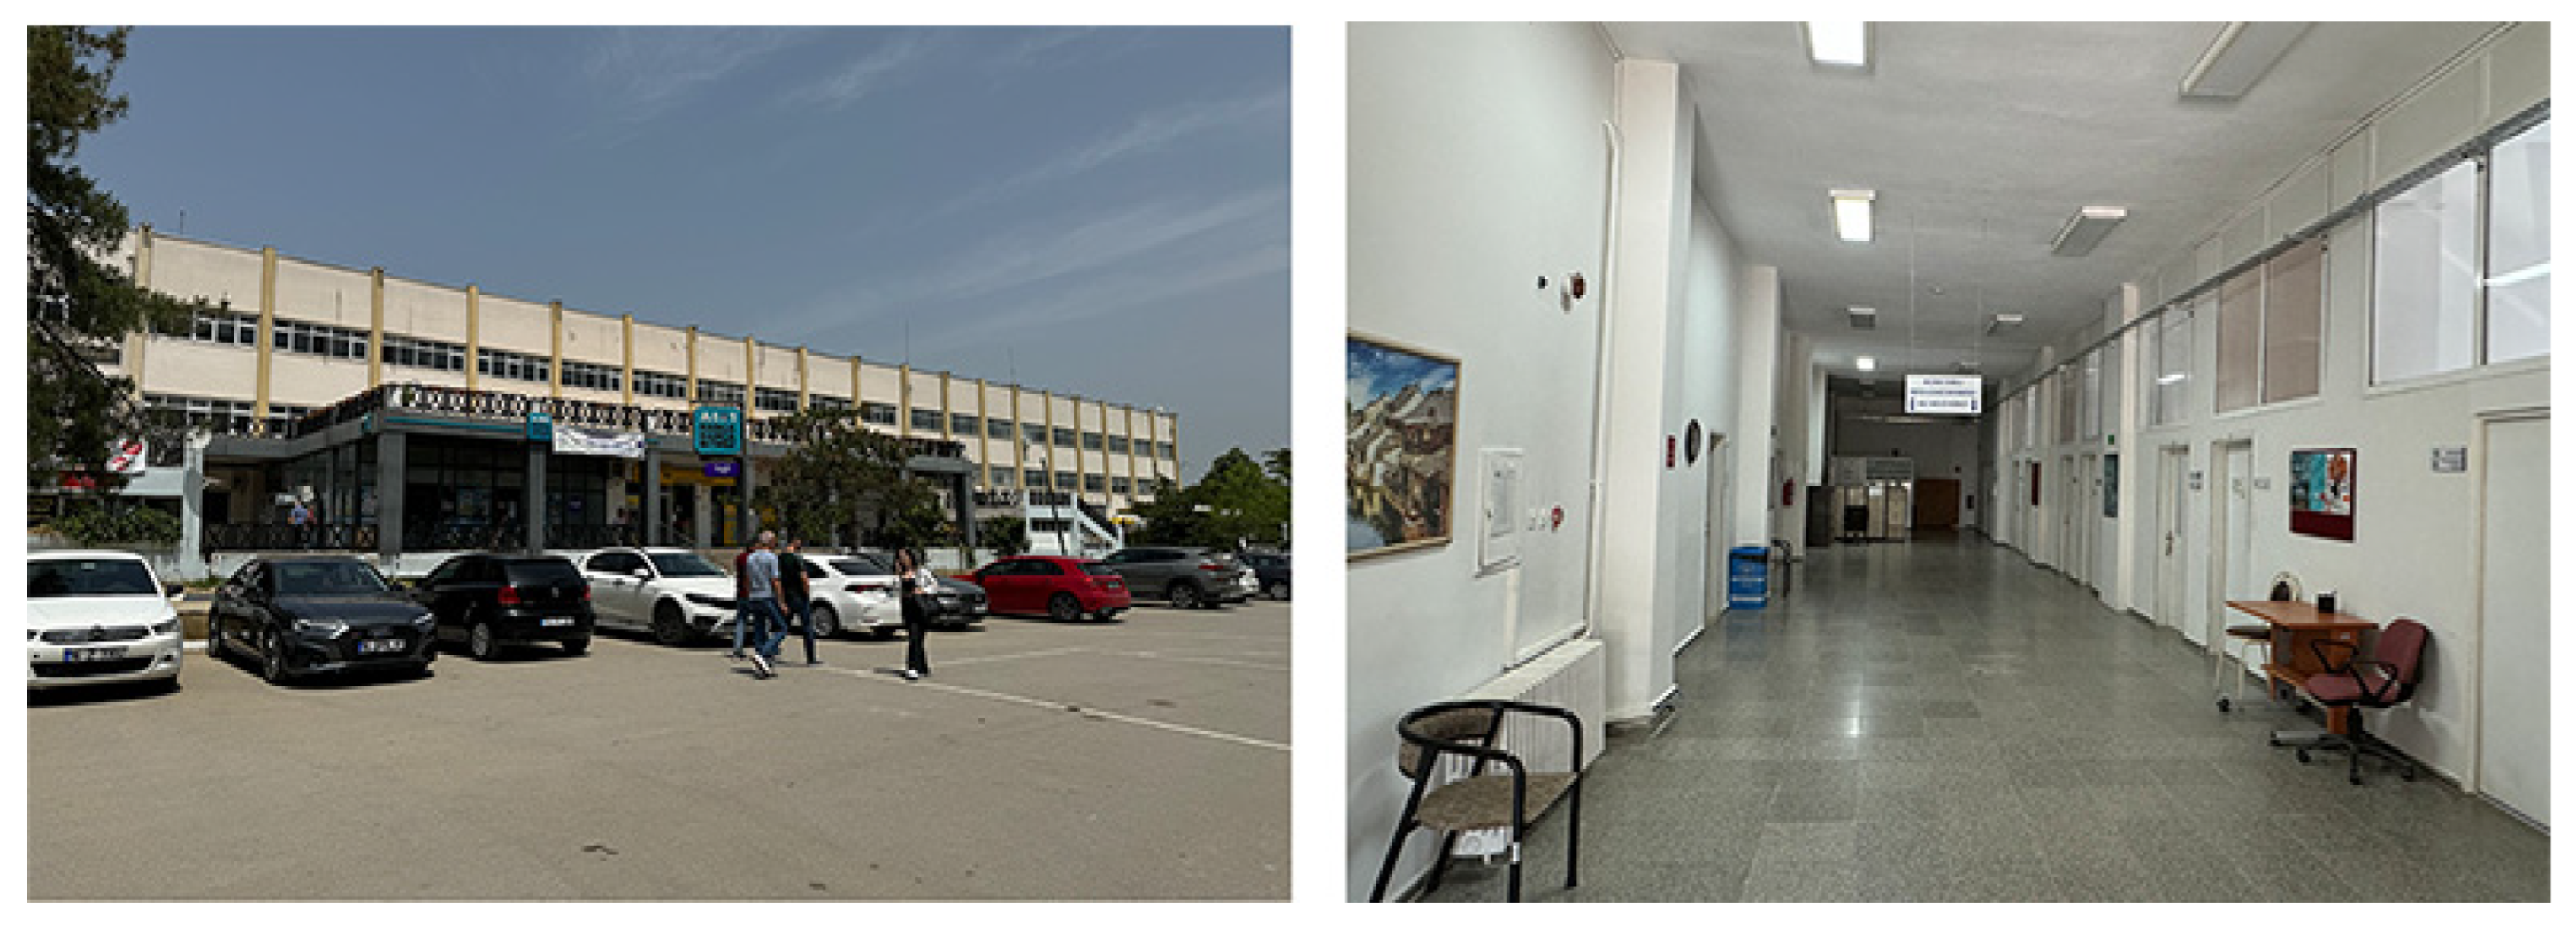
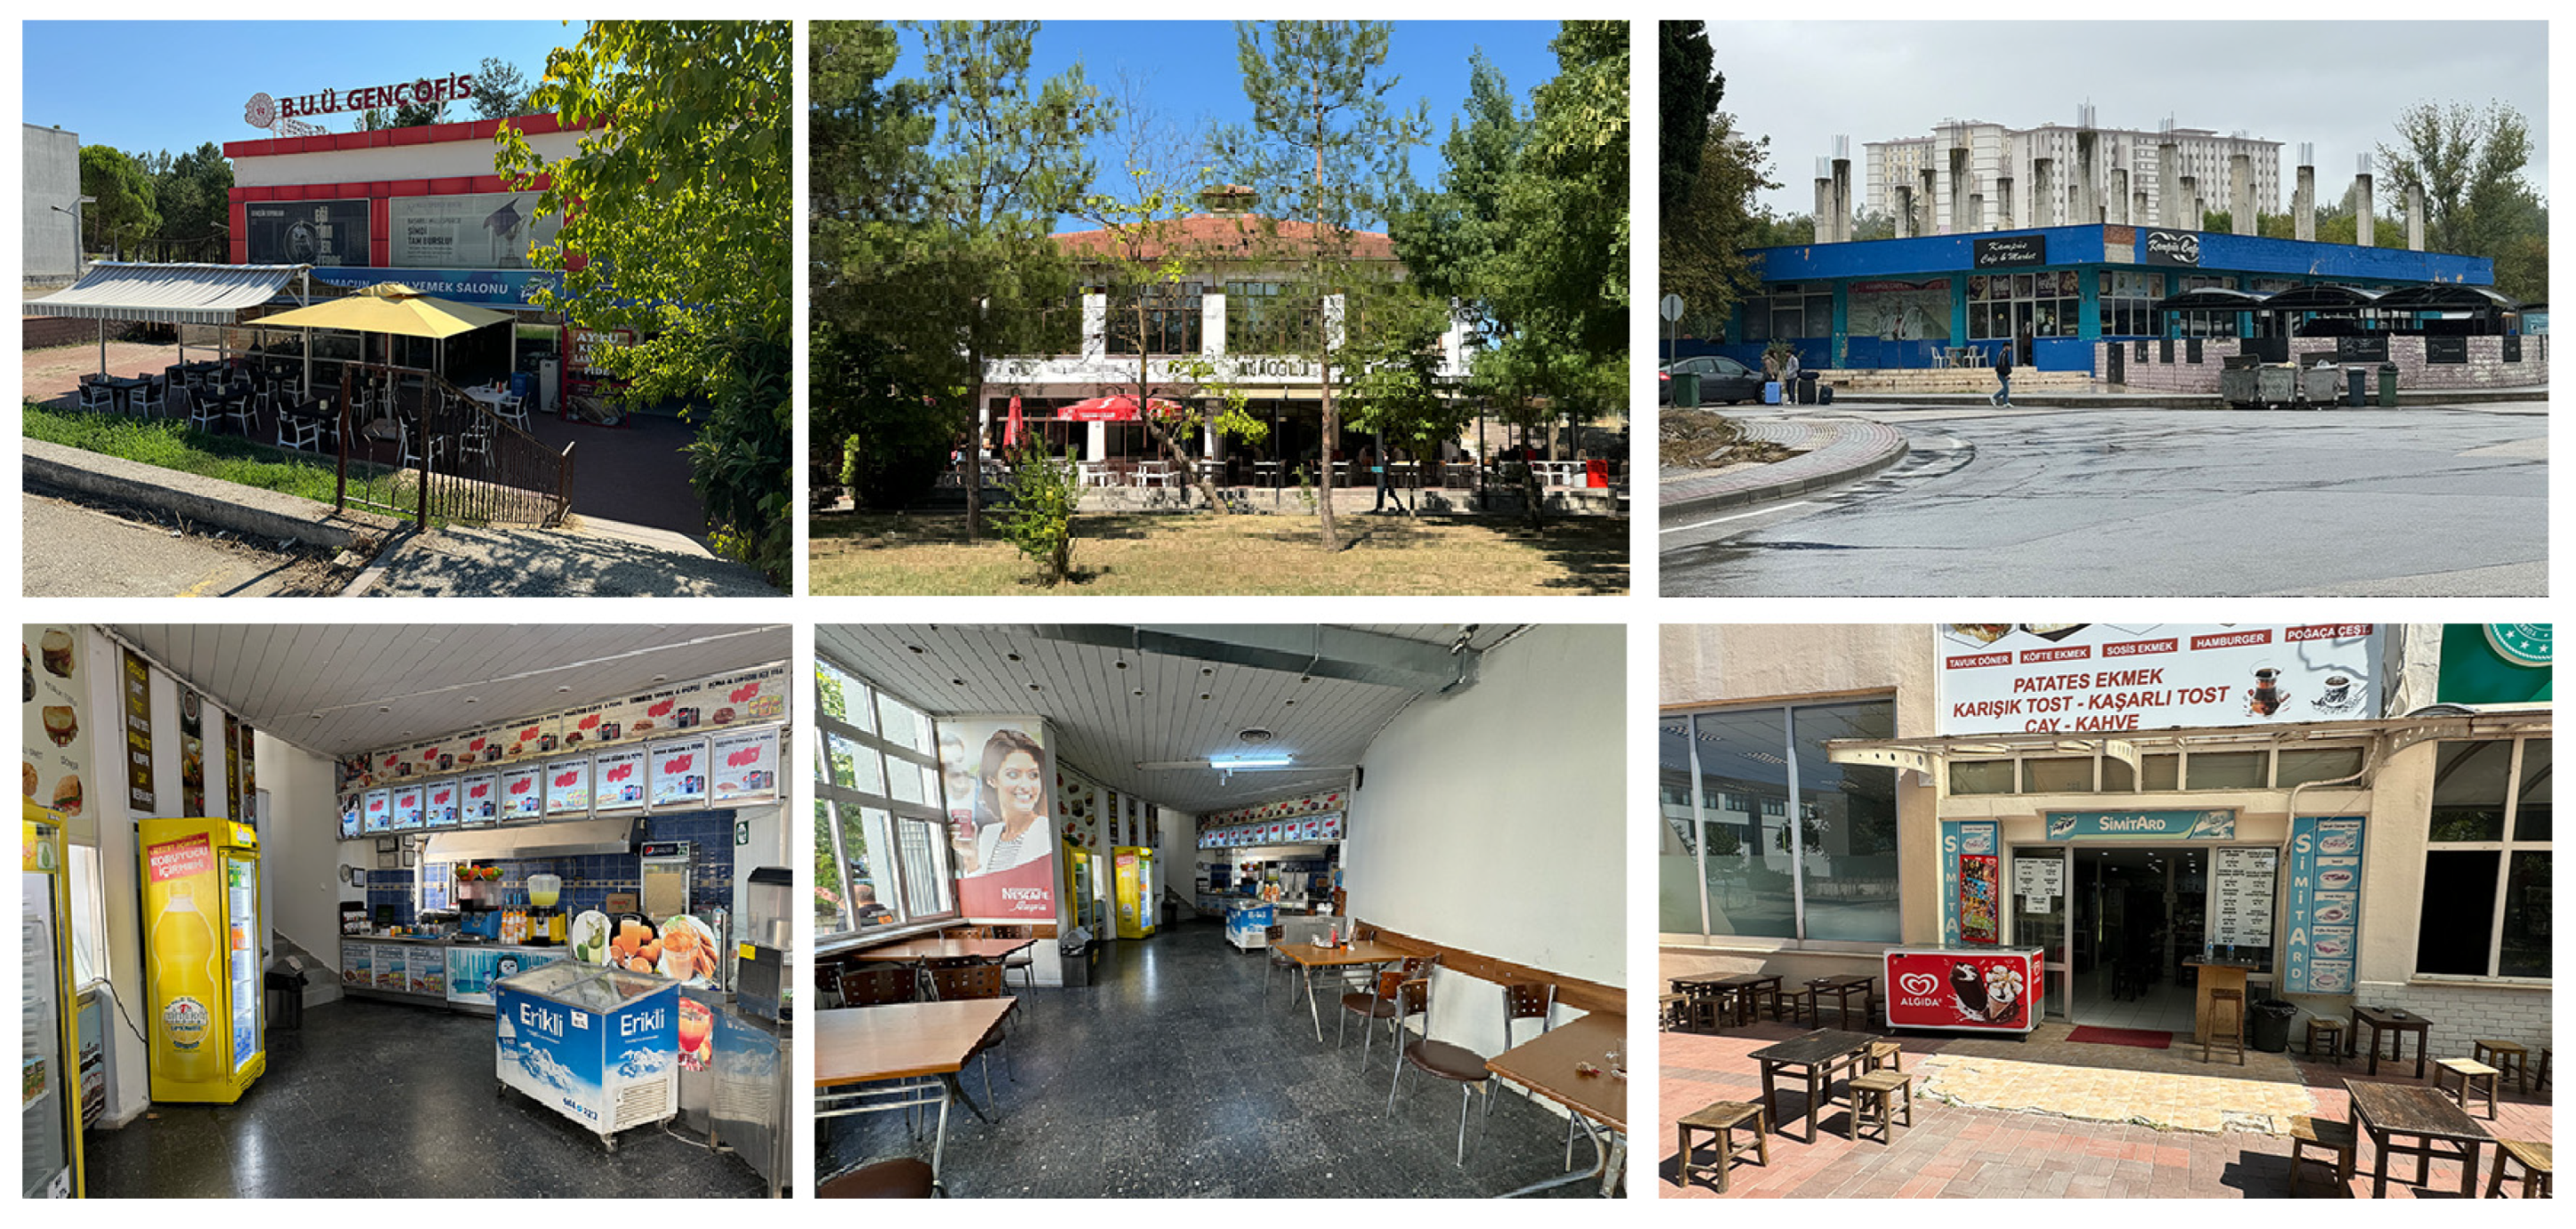
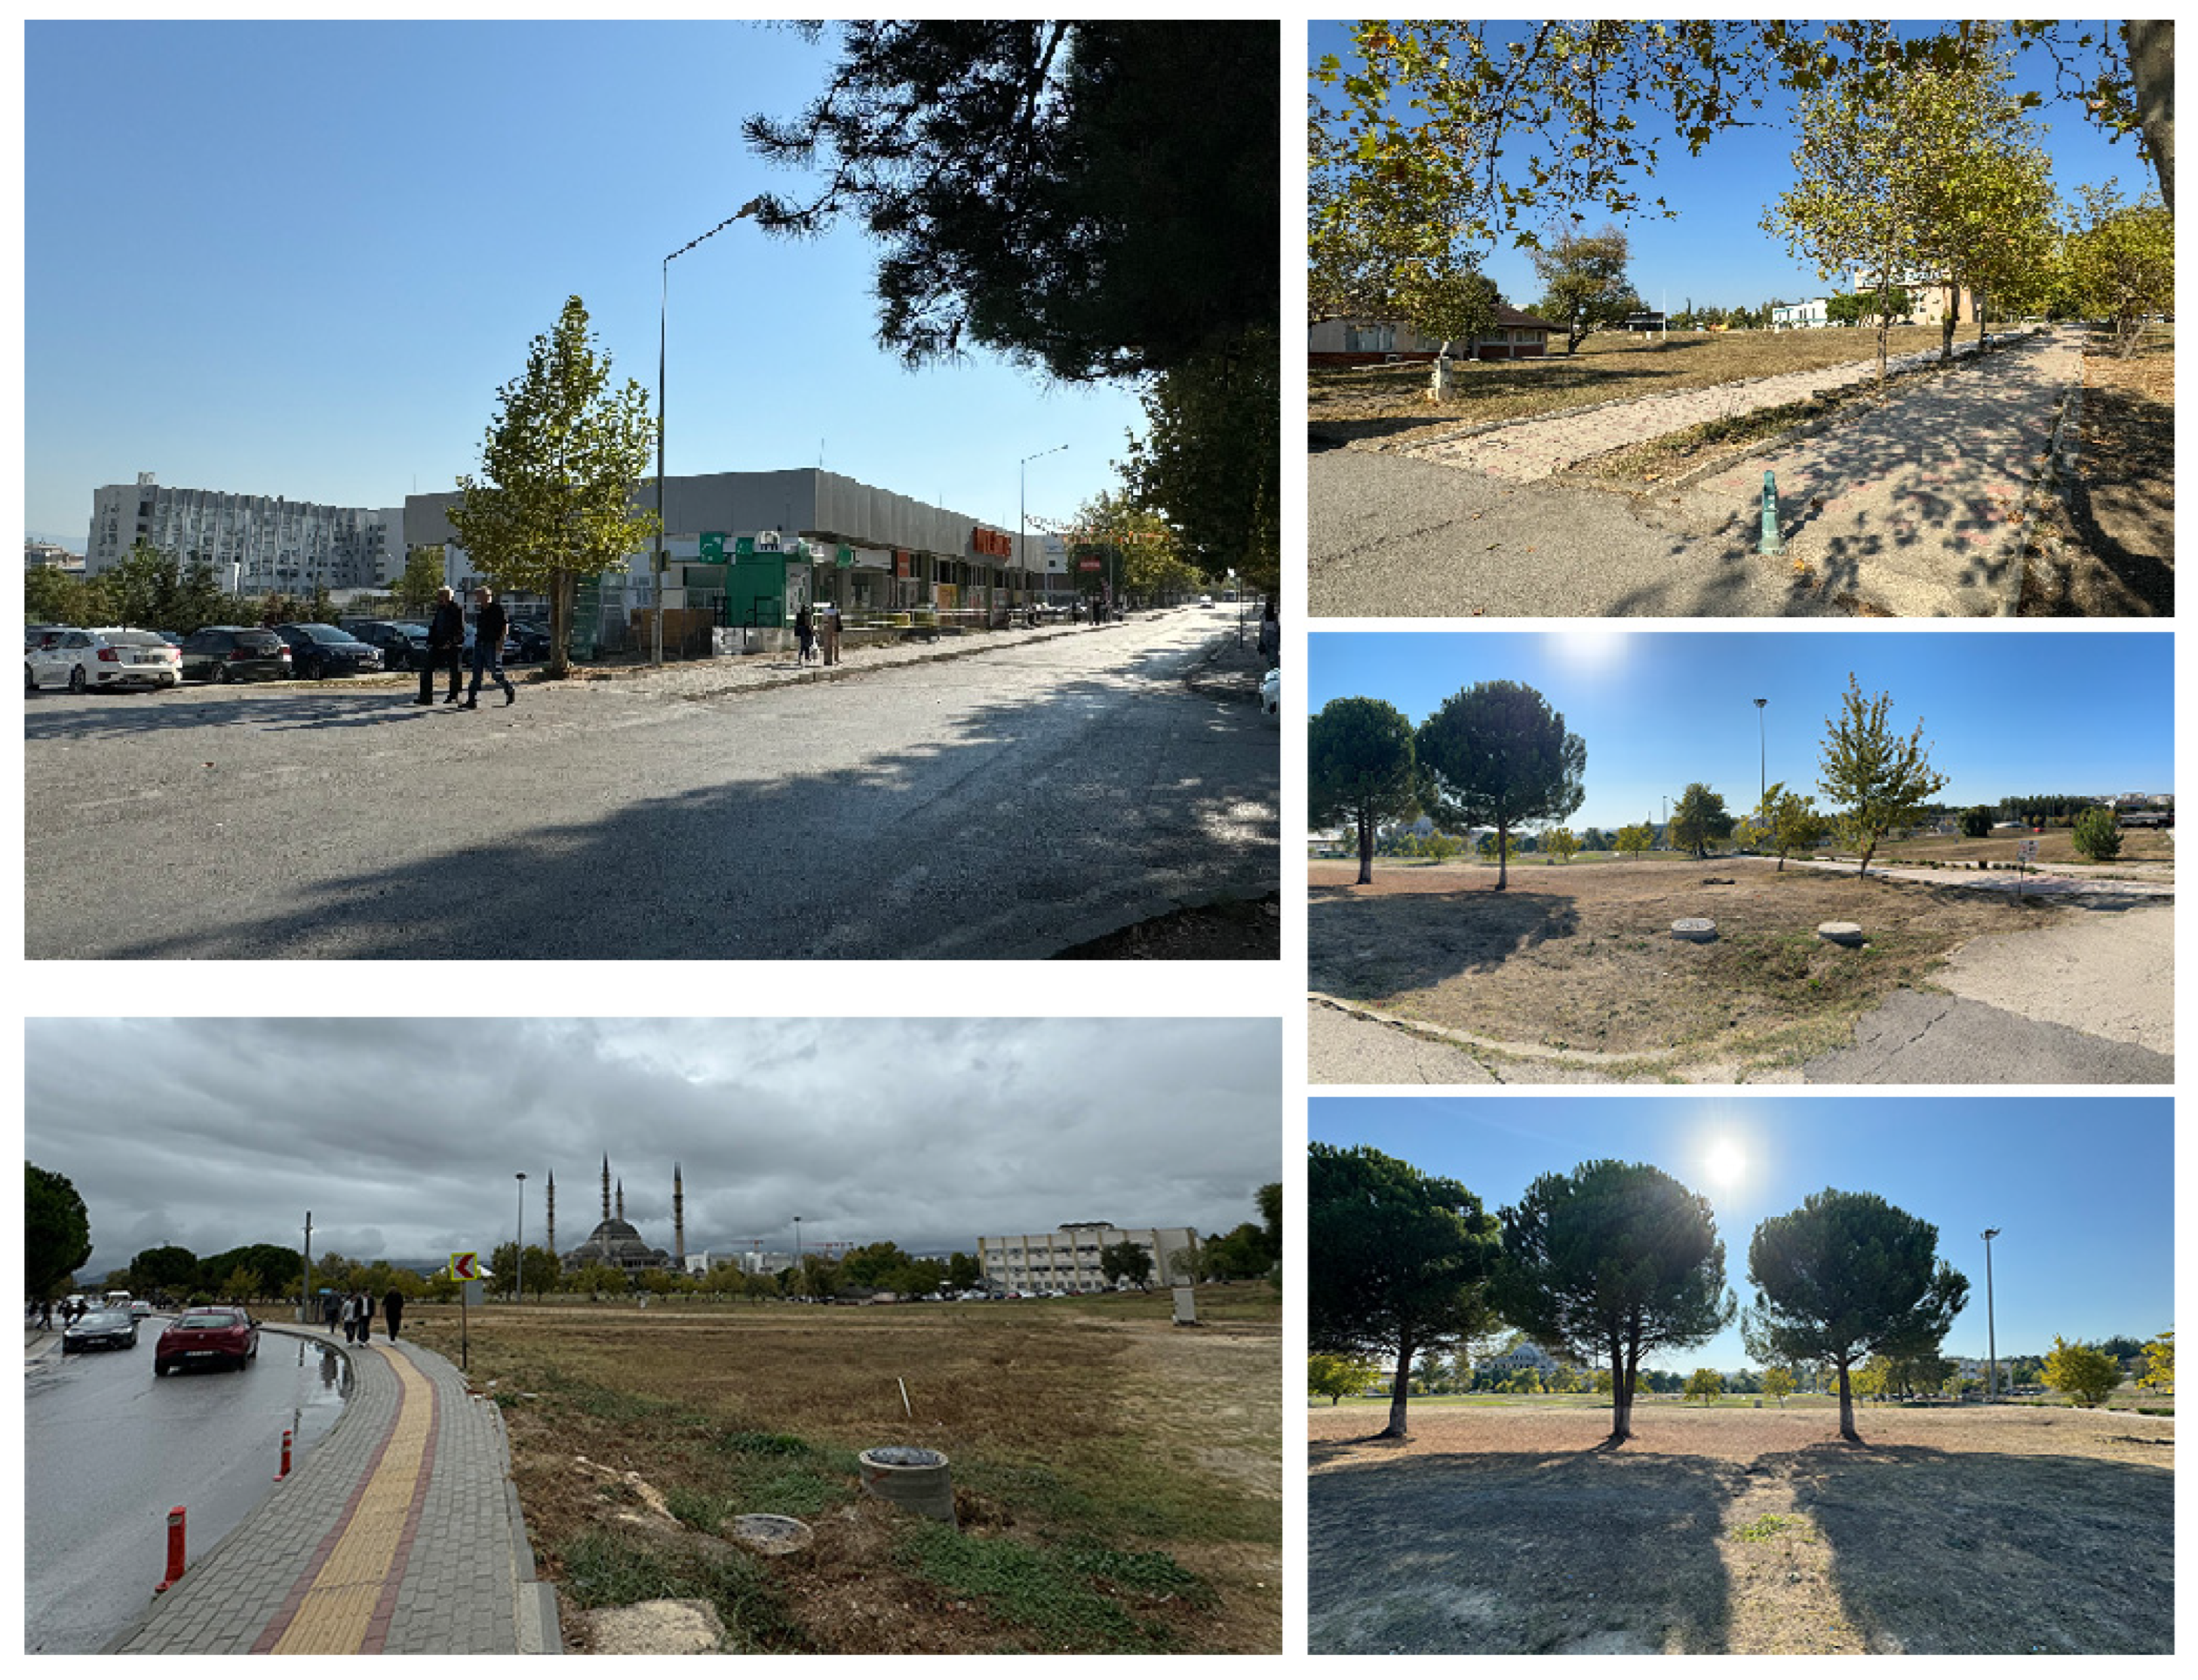
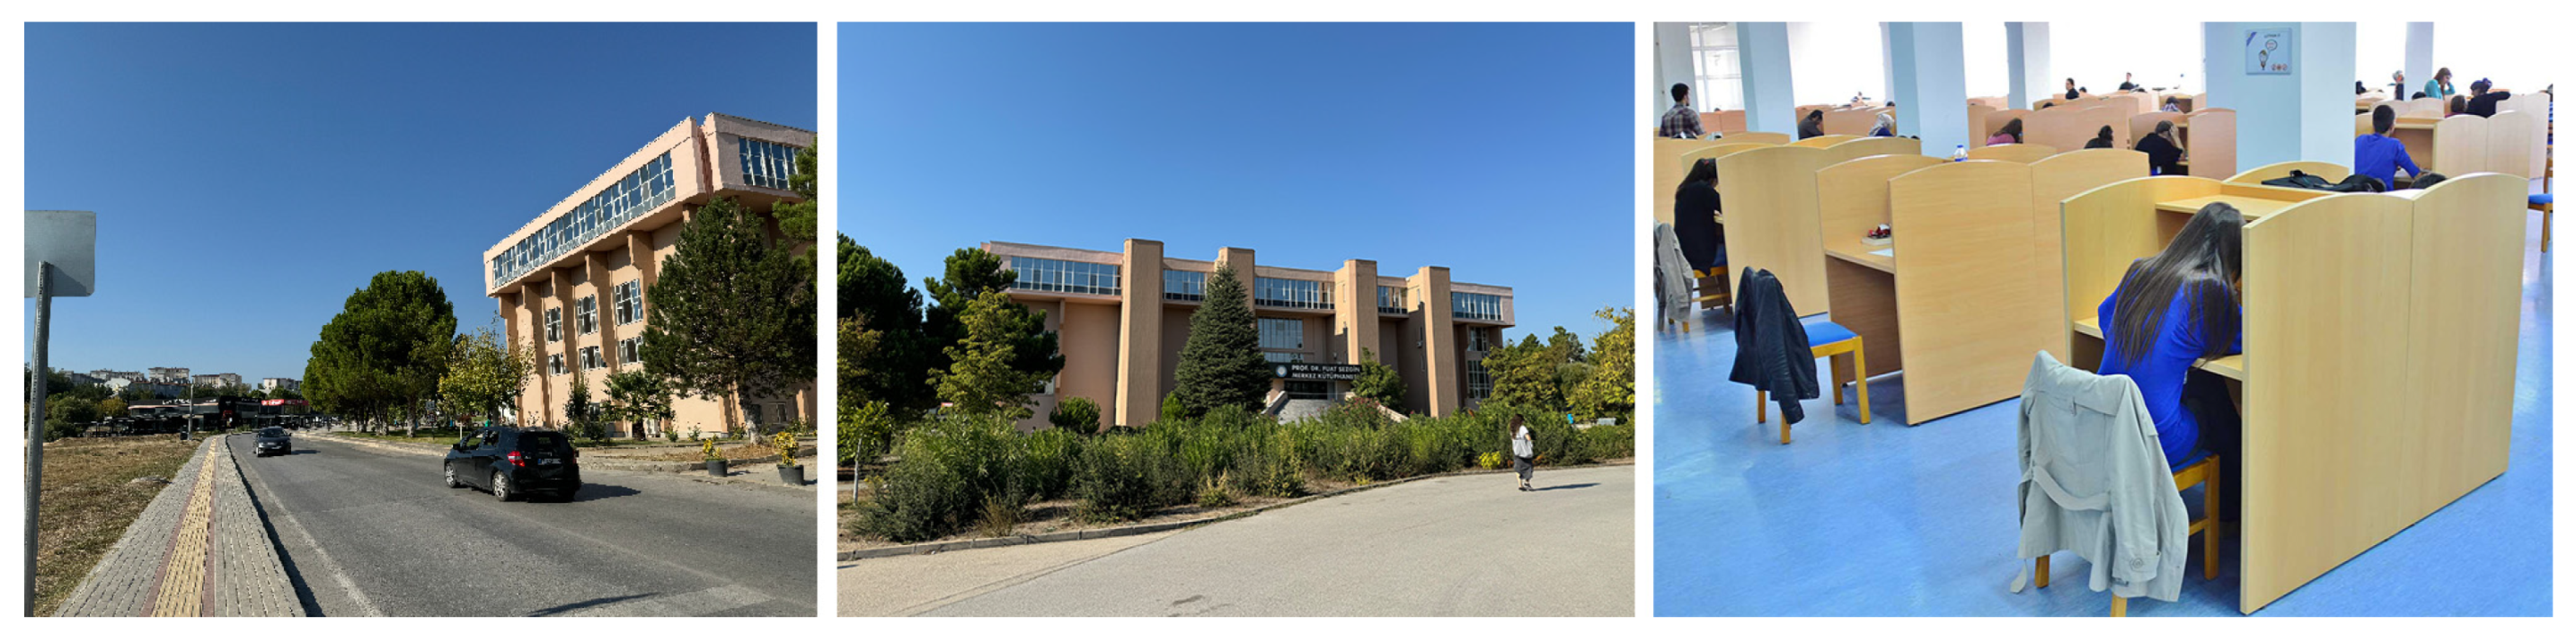

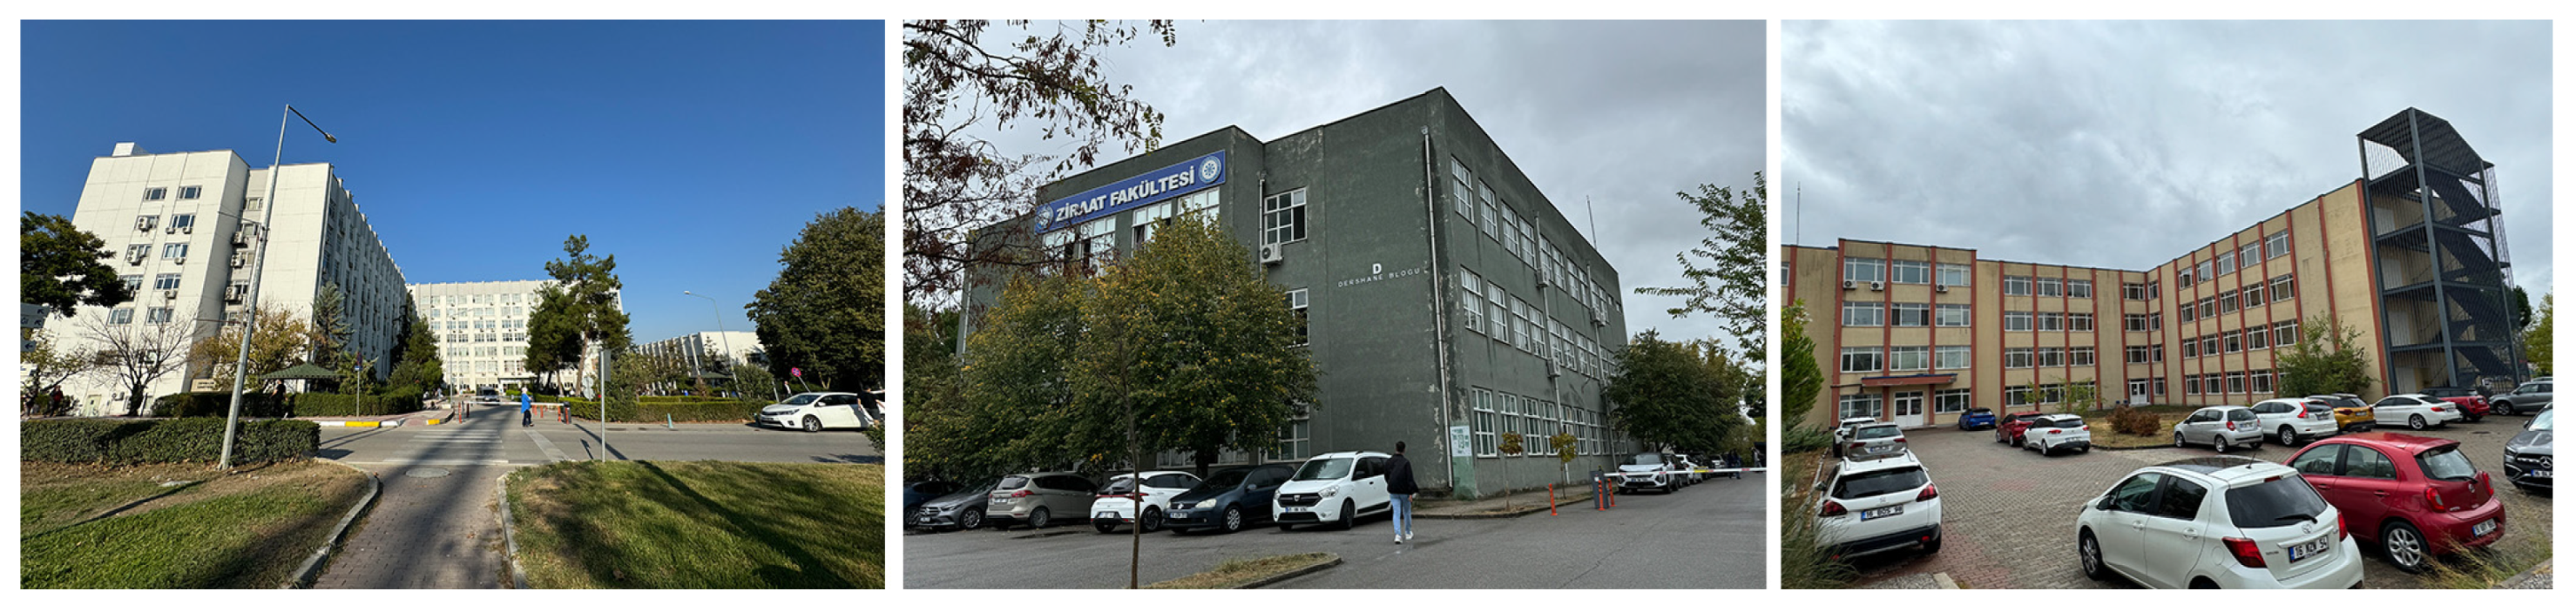
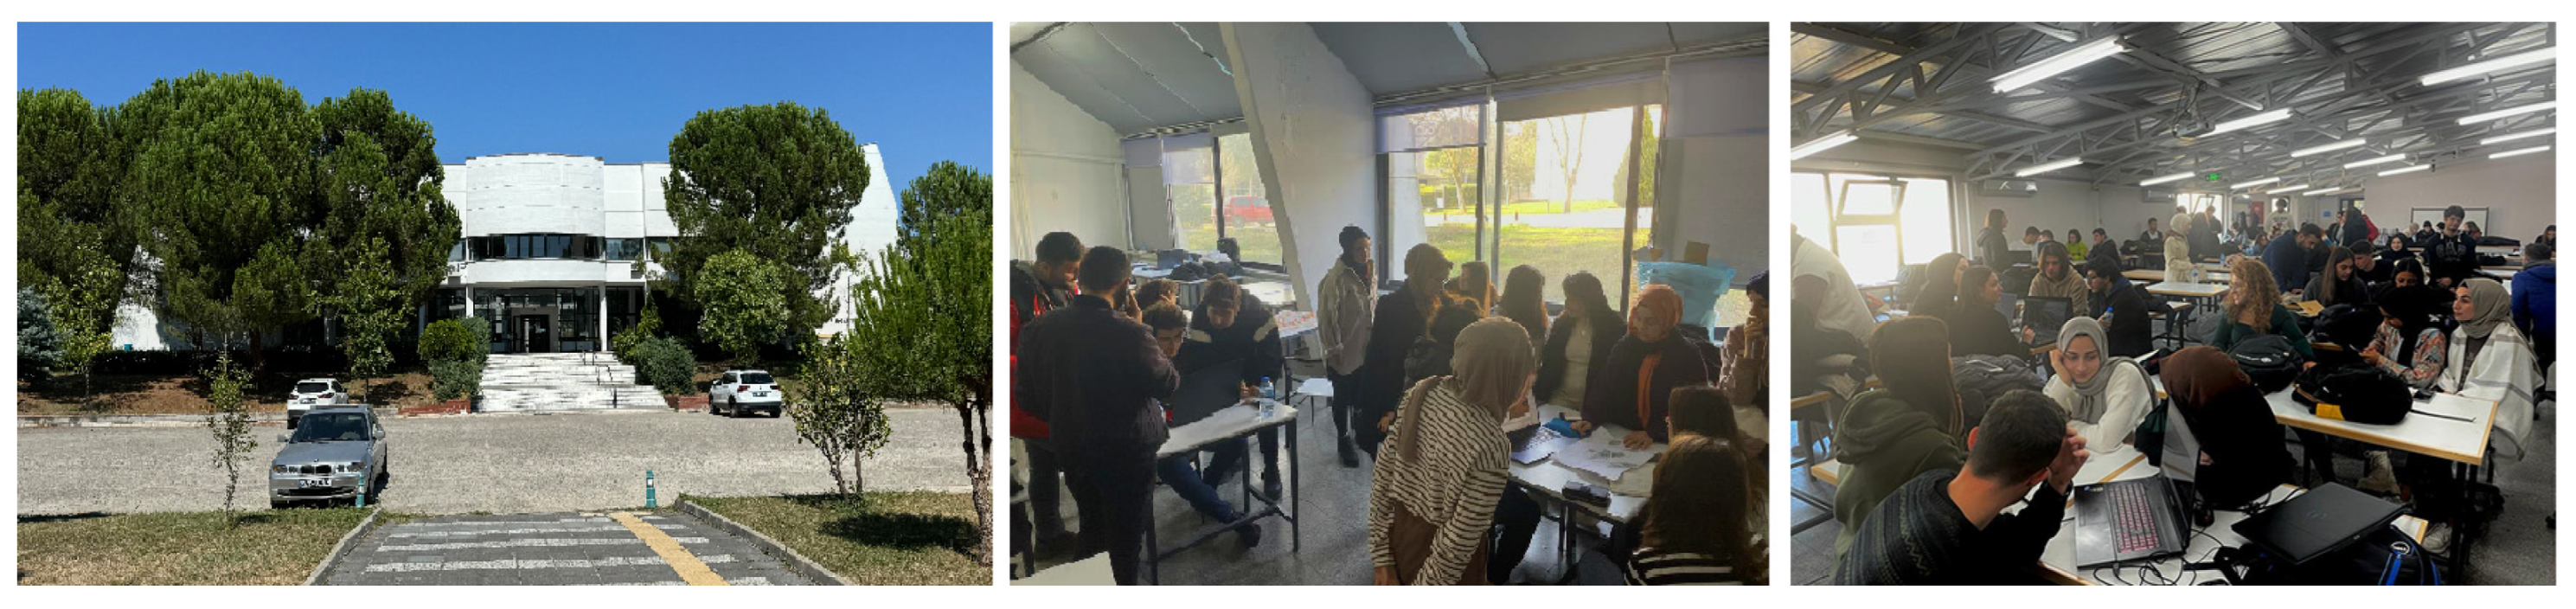
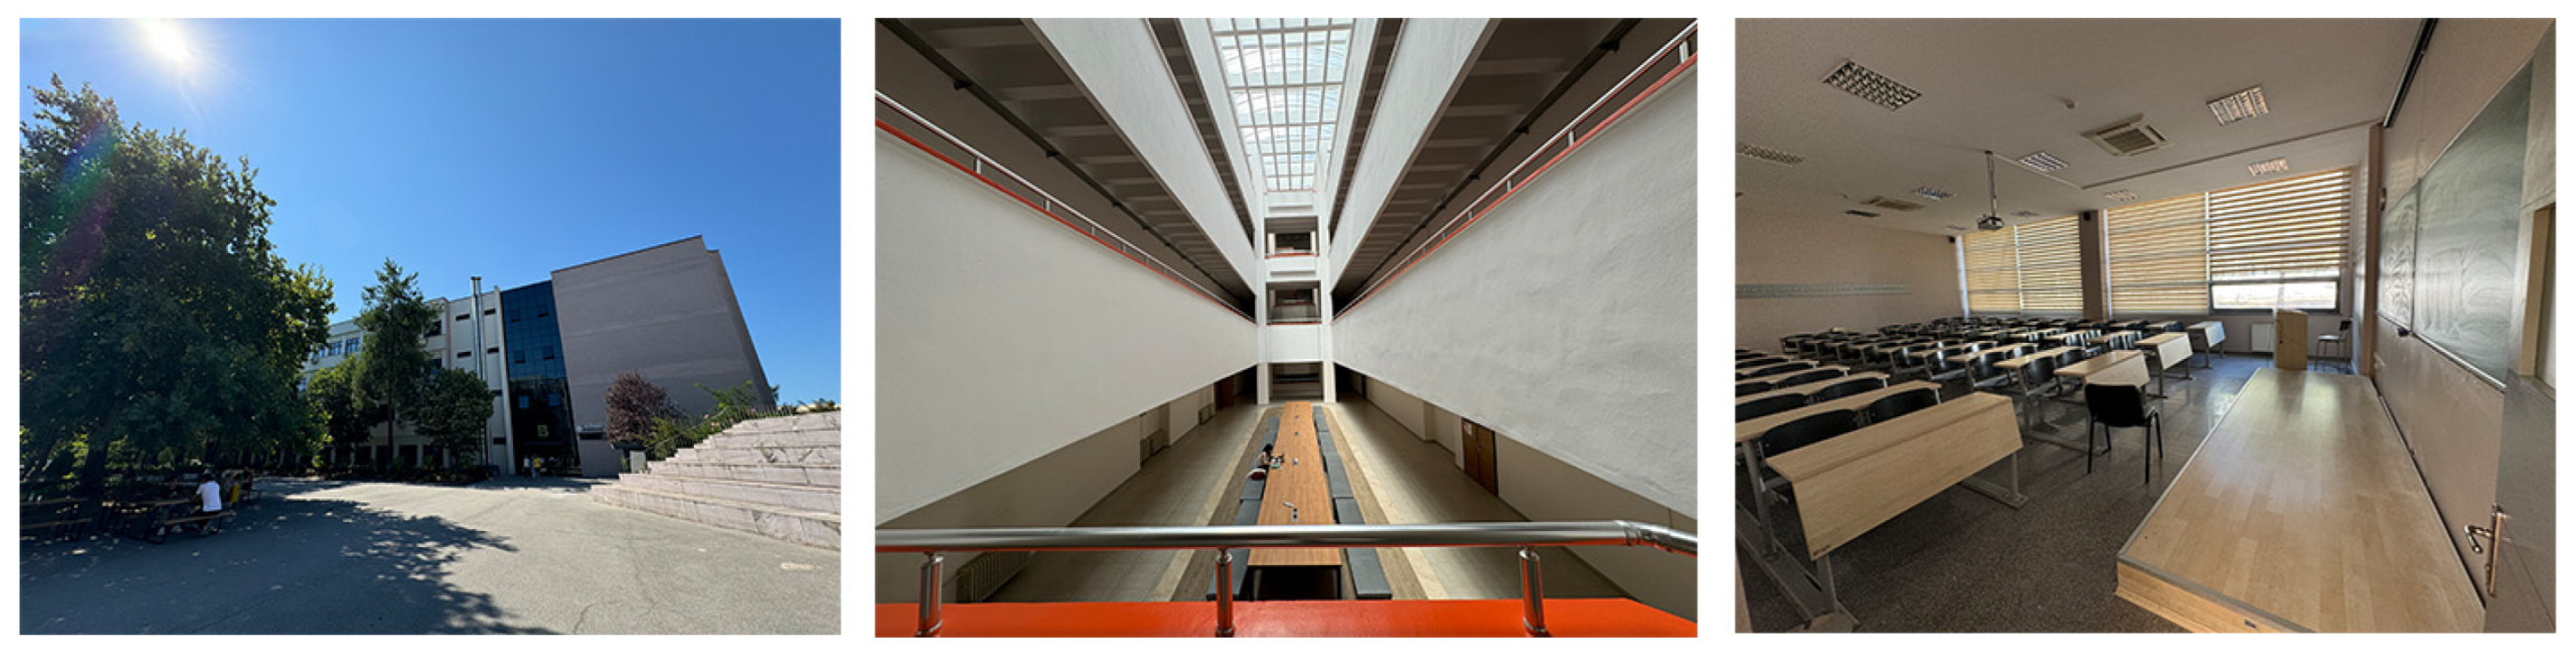
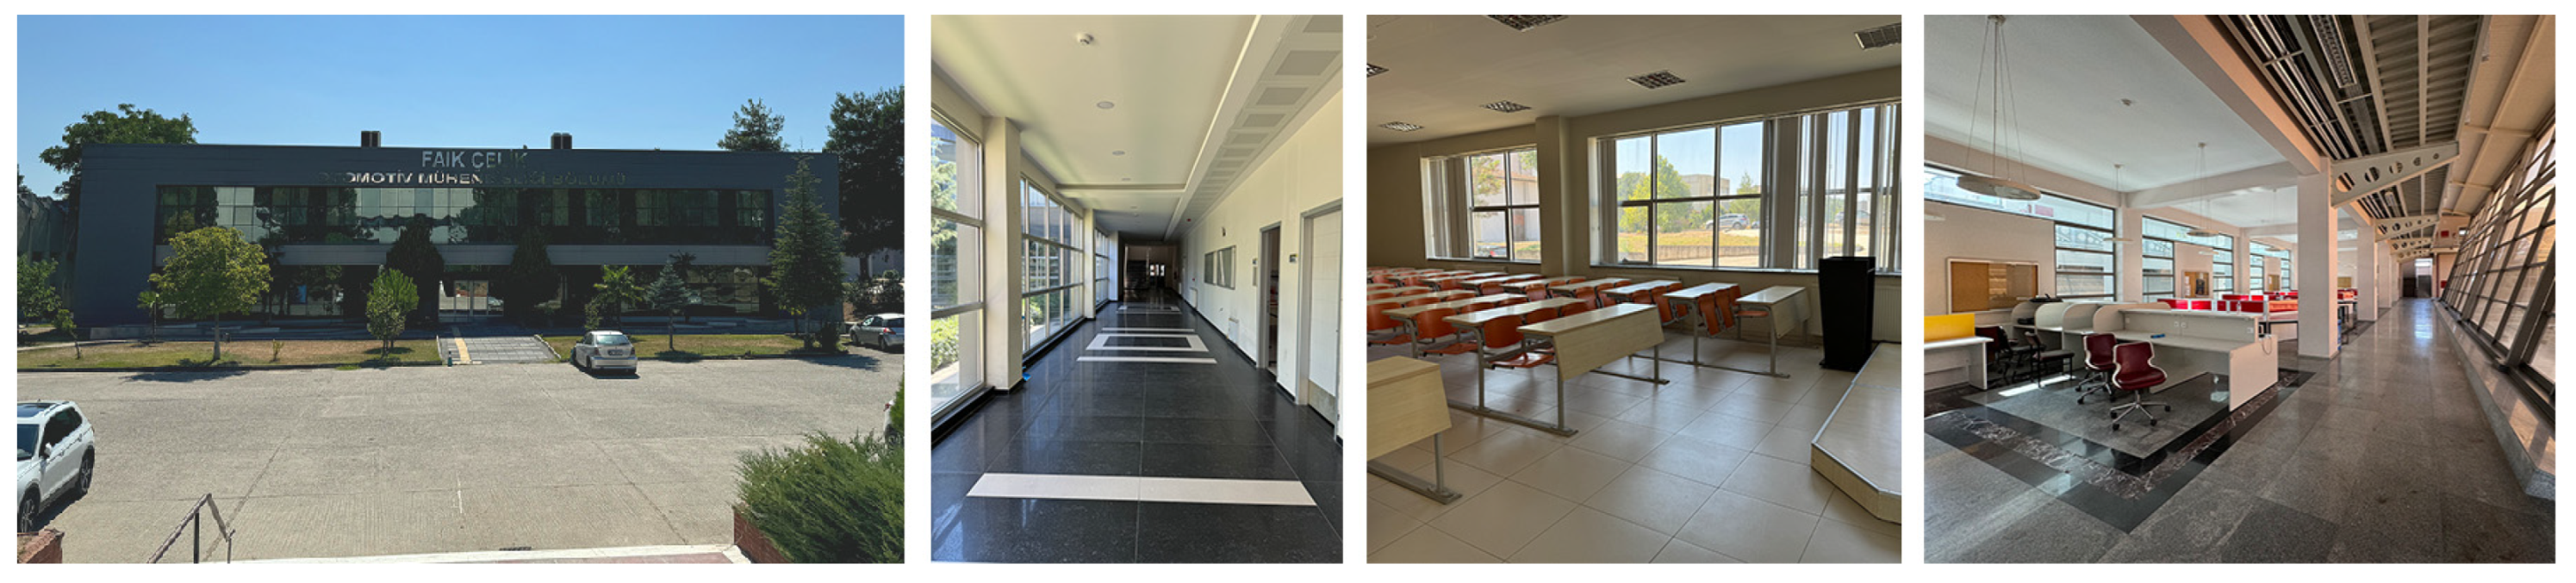
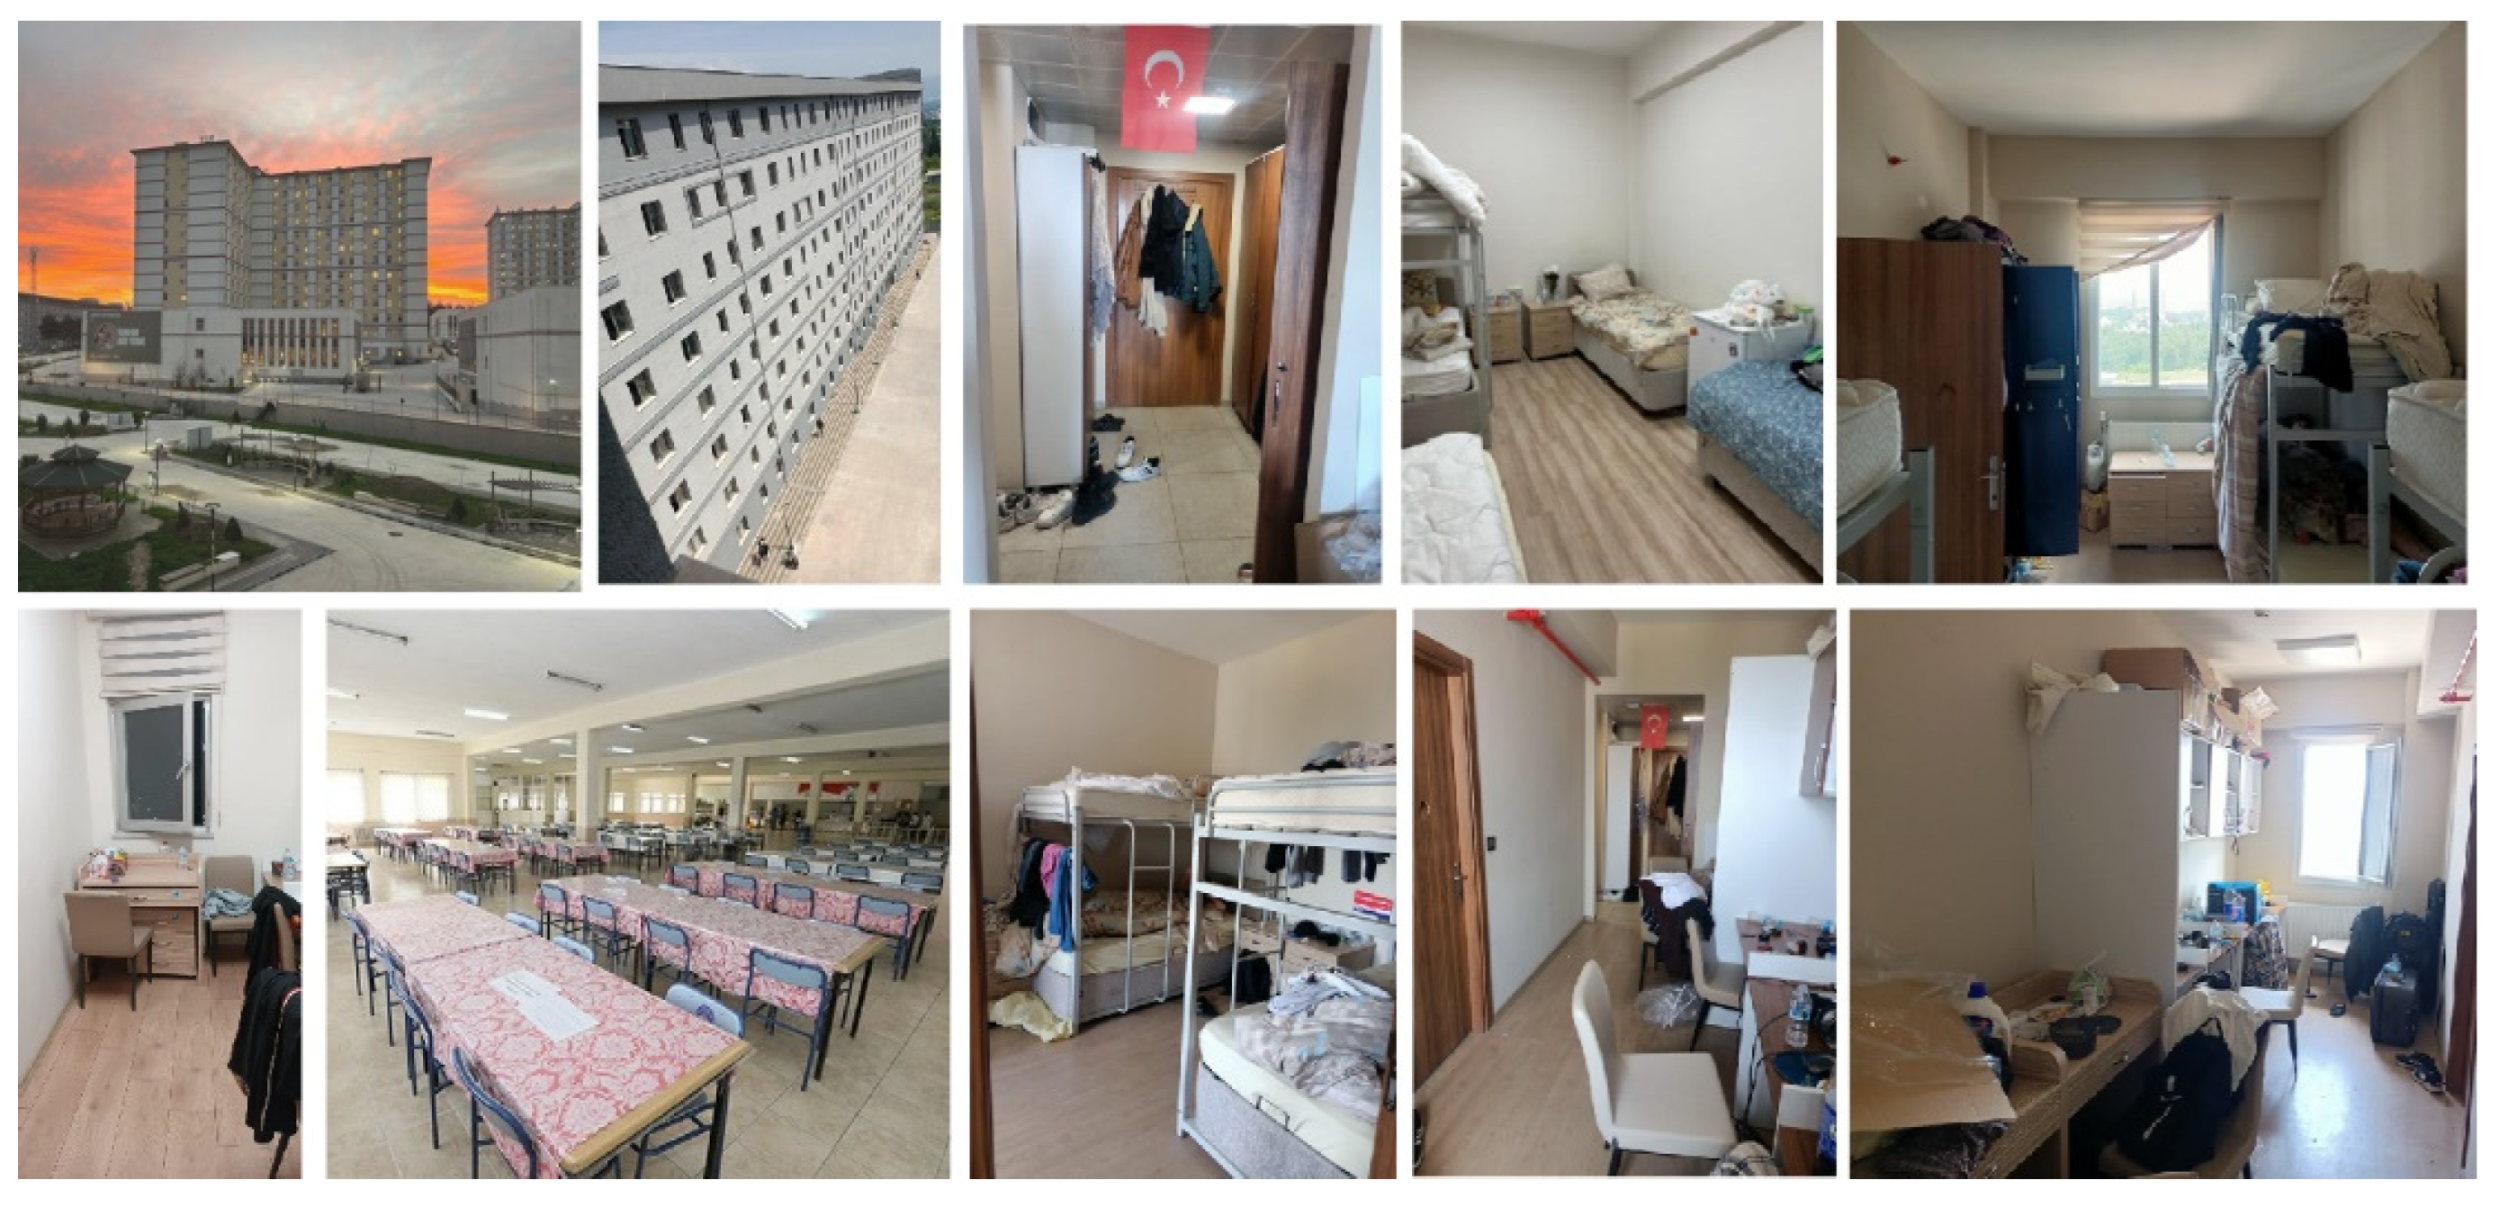
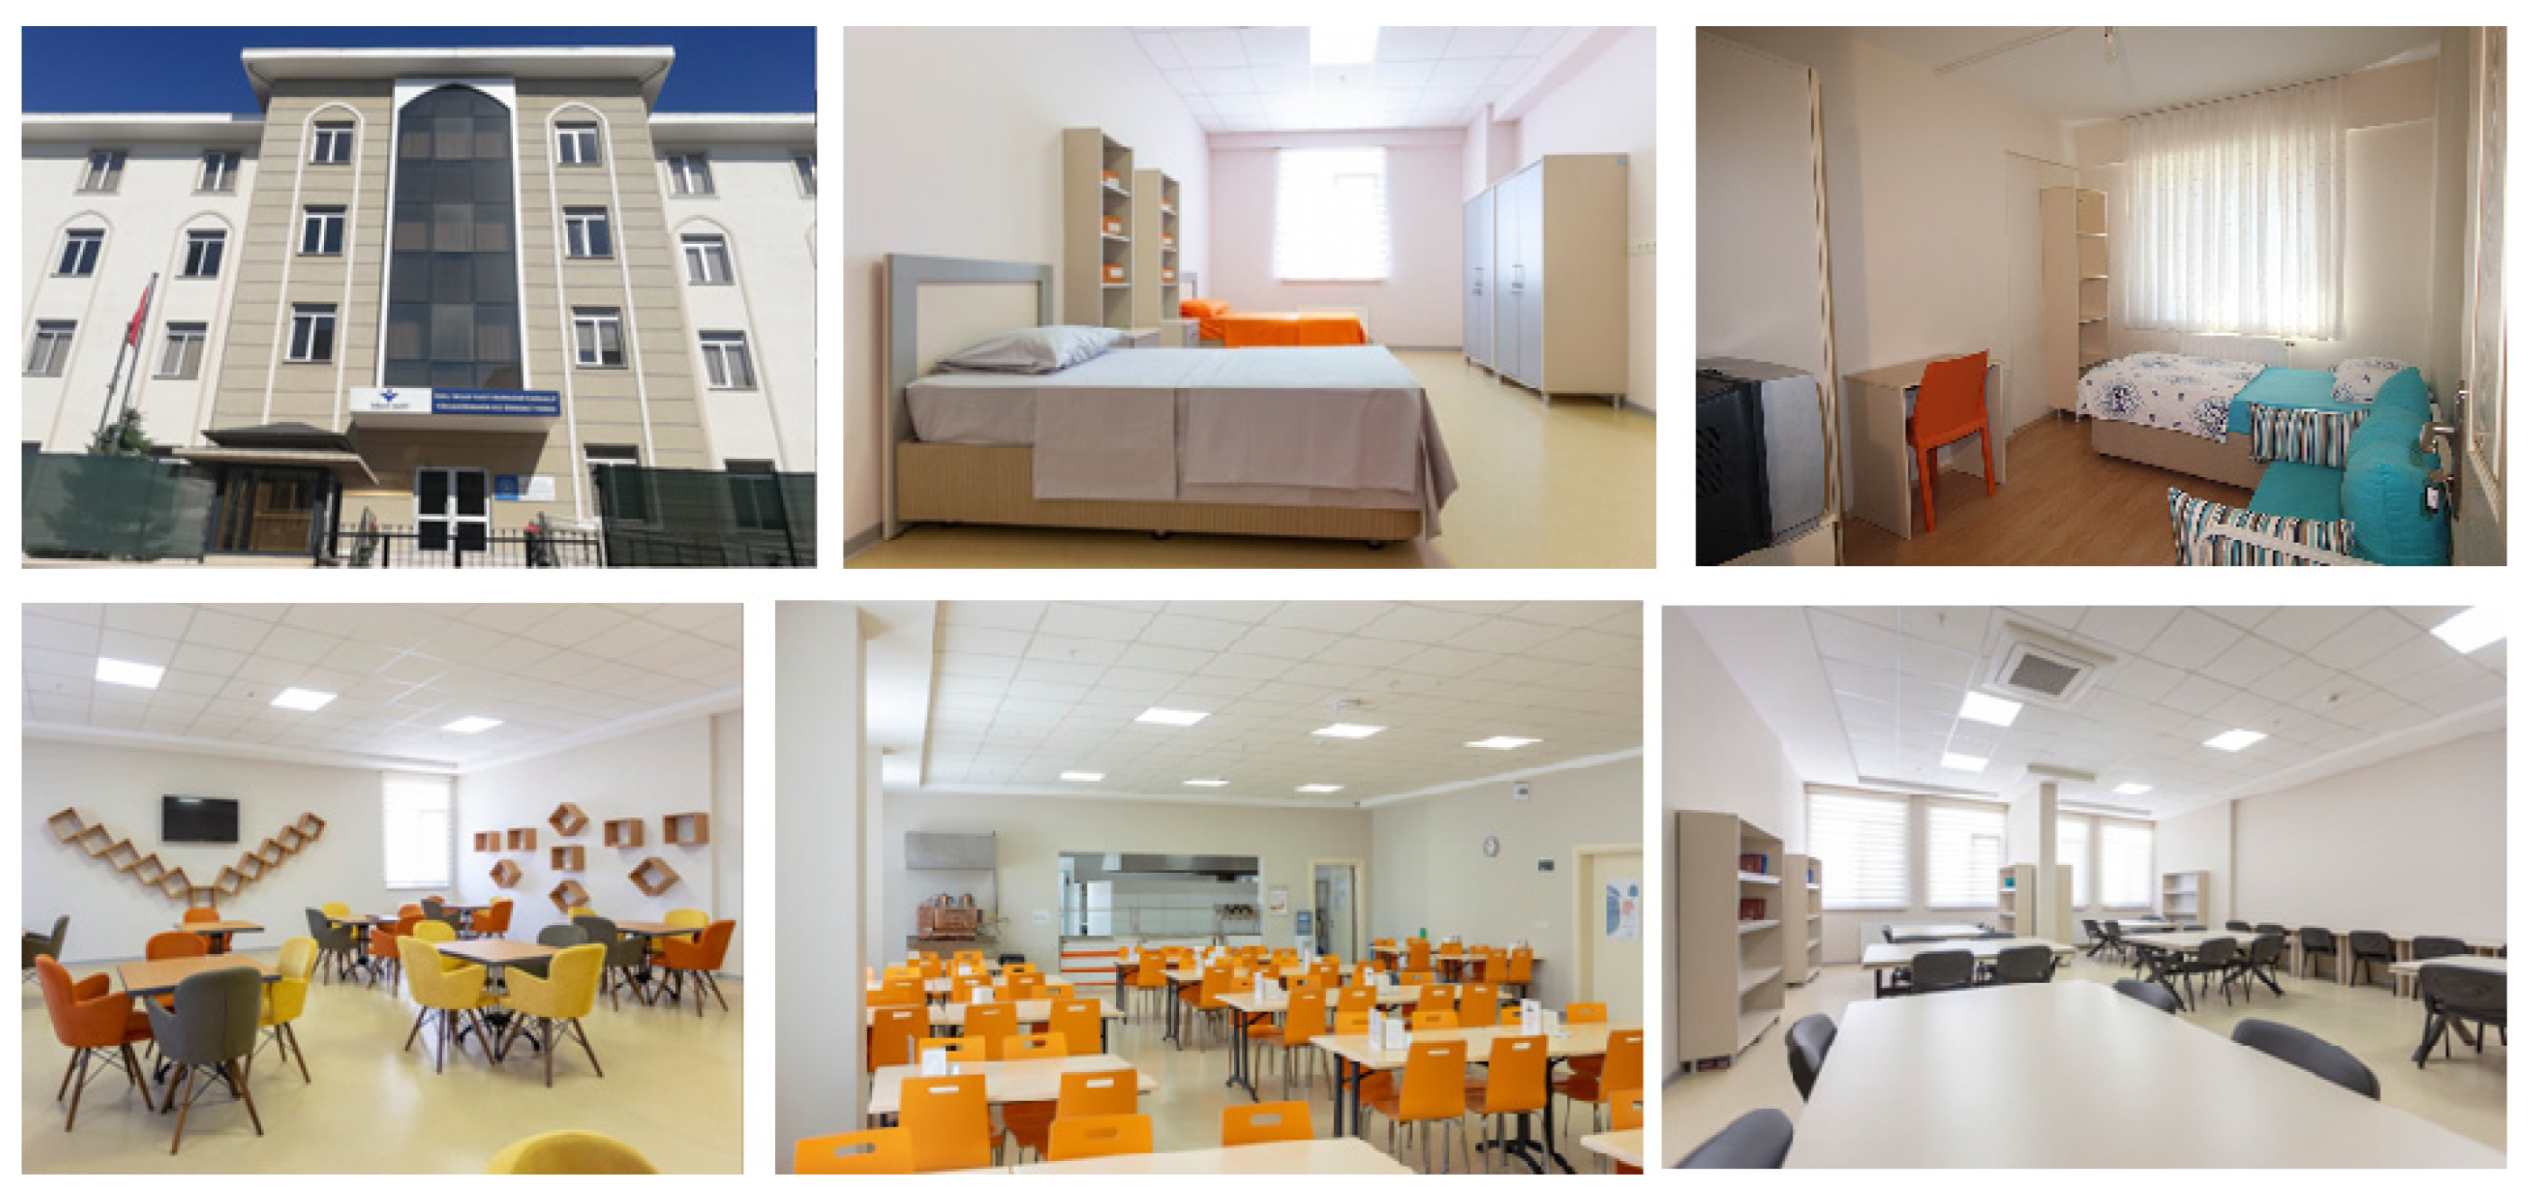

| Purpose | Analysis |
|---|---|
| Scale reliability | Item-total correlation analysis, Cronbach’s Alpha |
| Scale validity | EFA and CFA analyses |
| Comparison of scale scores according to demographic characteristics | For two groups: independent sample t test one-way analysis of variance for more than two groups |
| Relationship between scale sub-dimensions | Pearson correlation coefficient |
| Kaiser–Meyer–Olkin Measure of Sampling Adequacy | 0.92 | |
| Bartlett’s Test of Sphericity | Approx. Chi-Square | 19,130.64 |
| sd | 1596 | |
| p | 0.01 | |
| Dimension | Initial Eigenvalues | Total Variance | Total Variance after Rotation | ||||||
|---|---|---|---|---|---|---|---|---|---|
| Total | Variance % | Cumulative % | Total | Variance % | Cumulative % | Total | Variance % | Cumulative % | |
| 1 | 15.16 | 26.60 | 26.60 | 15.16 | 26.60 | 26.60 | 5.24 | 9.19 | 9.19 |
| 2 | 3.81 | 6.68 | 33.28 | 3.81 | 6.68 | 33.28 | 4.88 | 8.57 | 17.76 |
| 3 | 2.48 | 4.34 | 37.62 | 2.48 | 4.34 | 37.62 | 4.72 | 8.28 | 26.04 |
| 4 | 2.17 | 3.81 | 41.43 | 2.17 | 3.81 | 41.43 | 4.53 | 7.95 | 33.98 |
| 5 | 1.94 | 3.39 | 44.82 | 1.94 | 3.39 | 44.82 | 2.93 | 5.13 | 39.12 |
| 6 | 1.83 | 3.21 | 48.03 | 1.83 | 3.21 | 48.03 | 2.81 | 4.93 | 44.04 |
| 7 | 1.57 | 2.75 | 50.79 | 1.57 | 2.75 | 50.79 | 2.70 | 4.73 | 48.78 |
| 8 | 1.36 | 2.38 | 53.17 | 1.36 | 2.38 | 53.17 | 2.50 | 4.39 | 53.17 |
| Cronbach’s Alpha | |
|---|---|
| Satisfaction with campus life | 0.89 |
| Satisfaction with education spaces | 0.87 |
| Academic development | 0.87 |
| Satisfaction with socio-physical facilities | 0.85 |
| Satisfaction with administrative management | 0.86 |
| Social perception | 0.77 |
| Satisfaction with dormitory/housing | 0.80 |
| Accessibility and satisfaction with transportation | 0.71 |
| General QoL | 0.95 |
| Variable | Group | n | % |
|---|---|---|---|
| Gender | Female | 294 | 42.98 |
| Male | 390 | 57.02 | |
| Age | Between 18–24 ages | 646 | 94.44 |
| Between 24–28 ages | 38 | 5.56 | |
| Marital status | Married | 31 | 4.53 |
| Single | 653 | 95.47 | |
| Nationality | TR | 629 | 91.82 |
| Syria | 56 | 8.18 | |
| Accommodation in Bursa | At home with my family | 189 | 27.59 |
| Apart flat | 106 | 15.47 | |
| At home with my friends | 106 | 15.47 | |
| State dormitory | 187 | 27.30 | |
| Private dormitory | 97 | 14.16 | |
| Neighborhood disrict in Bursa | Görükle | 358 | 52.26 |
| Nilüfer | 195 | 28.47 | |
| Osmangazi | 75 | 10.95 | |
| Yıldırım | 36 | 5.26 | |
| Other | 21 | 3.07 | |
| Mode of transportation | Private vehicle | 85 | 12.41 |
| Public transportation | 487 | 71.09 | |
| On foot | 113 | 16.50 | |
| Faculty of study | Faculty of Education | 39 | 5.70 |
| Fac. of Economics and Administrative Sciences | 81 | 11.84 | |
| Faculty of Architecture | 250 | 36.55 | |
| Faculty of Medicine | 73 | 10.67 | |
| Fcaulty of Fine Arts | 12 | 1.75 | |
| Faculty of Engineering | 128 | 18.71 | |
| Faculty of Science & Literature | 53 | 7.75 | |
| Faculty of Sports Sciences | 22 | 3.22 | |
| Faculty of Agriculture | 26 | 3.80 | |
| Reasons for choosing Bursa Uludag University | My family and/or close friends live here | 82 | 18.68 |
| I think there are more job opportunities in Bursa after graduation | 95 | 21.64 | |
| I find it easier to study university in Bursa in terms of life opportunities | 68 | 15.49 | |
| I find it more attractive to study at university in Bursa than in my hometown | 62 | 14.12 | |
| I find the education quality of the university very good | 110 | 25.06 | |
| My university exam score was good enough for here | 22 | 5.01 | |
| Reasons for choosing faculty | To be close to my friends | 22 | 5.39 |
| Because it’s my dream job | 208 | 50.98 | |
| Because there are more job opportunities after graduation | 88 | 21.57 | |
| My university exam score was good enough for here | 90 | 22.06 |
| Satisfaction with Education Spaces | Academic Development | Socio-Physical Facility Satisfaction | Social Perception | Campus Life Satisfaction | Accessibility and Public Transportation | Dormitory/Housing Satisfaction | Administrative Managemenet Perception | General QOL | |
|---|---|---|---|---|---|---|---|---|---|
| Satisfaction with education spaces | 1 | 0.503 ** | 0.597 ** | 0.461 ** | 0.466 ** | 0.449 ** | 0.163 ** | 0.385 ** | 0.781 ** |
| Academic development | 0.503 ** | 1 | 0.416 ** | 0.491 ** | 0.650 ** | 0.405 ** | 0.230 ** | 0.549 ** | 0.781 ** |
| Socio-physical facility satisfaction | 0.597 ** | 0.416 ** | 1 | 0.478 ** | 0.450 ** | 0.477 ** | 0.161 ** | 0.431 ** | 0.754 ** |
| Social perception | 0.461 ** | 0.491 ** | 0.478 ** | 1 | 0.532 ** | 0.388 ** | 0.284 ** | 0.415 ** | 0.709 ** |
| Campus life satisfaction | 0.466 ** | 0.650 ** | 0.450 ** | 0.532 ** | 1 | 0.393 ** | 0.306 ** | 0.604 ** | 0.802 ** |
| Accessibility and public transportation satisfaction | 0.449 ** | 0.405 ** | 0.477 ** | 0.388 ** | 0.393 ** | 1 | 0.203 ** | 0.312 ** | 0.609 ** |
| Dormitory/housing satisfaction | 0.163 ** | 0.230 ** | 0.161 ** | 0.284 ** | 0.306 ** | 0.203 ** | 1 | 0.273 ** | 0.382 ** |
| Administrative managemenet perception | 0.385 ** | 0.549 ** | 0.431 ** | 0.415 ** | 0.604 ** | 0.312 ** | 0.273 ** | 1 | 0.684 ** |
| General QoL | 0.781 ** | 0.781 ** | 0.754 ** | 0.709 ** | 0.802 ** | 0.609 ** | 0.382 ** | 0.684 ** | 1 |
Disclaimer/Publisher’s Note: The statements, opinions and data contained in all publications are solely those of the individual author(s) and contributor(s) and not of MDPI and/or the editor(s). MDPI and/or the editor(s) disclaim responsibility for any injury to people or property resulting from any ideas, methods, instructions or products referred to in the content. |
© 2024 by the author. Licensee MDPI, Basel, Switzerland. This article is an open access article distributed under the terms and conditions of the Creative Commons Attribution (CC BY) license (https://creativecommons.org/licenses/by/4.0/).
Share and Cite
Gür, M. Assessment of Student Quality of Life in Relation to University Campus. Sustainability 2024, 16, 8906. https://doi.org/10.3390/su16208906
Gür M. Assessment of Student Quality of Life in Relation to University Campus. Sustainability. 2024; 16(20):8906. https://doi.org/10.3390/su16208906
Chicago/Turabian StyleGür, Miray. 2024. "Assessment of Student Quality of Life in Relation to University Campus" Sustainability 16, no. 20: 8906. https://doi.org/10.3390/su16208906
APA StyleGür, M. (2024). Assessment of Student Quality of Life in Relation to University Campus. Sustainability, 16(20), 8906. https://doi.org/10.3390/su16208906