Abstract
The degradation of available water quality is a consequence of pollution, environmental degradation, and/or climate change resulting from human activities. Designing strategies to foster the adoption of sustainable behaviors requires an awareness within populations regarding water quality, water availability, and the proper consumption of water. The goal of the present work was to assess the population awareness of sustainable water usage practices. The data collection involved administering a questionnaire to a sample of 1723 participants, encompassing individuals of both genders and aged between 15 and 84 years. The questionnaire includes five specific themes (i.e., water quality, water availability, water resources, water saving, and water reuse). The outcomes indicate that despite a higher awareness of sustainable water usage practices, participants reveal low levels of awareness regarding water reuse. Furthermore, measures of participants’ overall awareness and the potential for improving it are presented. These metrics are crucial in enabling the grouping of participants according to similar characteristics, thereby streamlining the design of targeted interventions.
1. Introduction
Water, an indispensable resource for sustaining life, driving economic growth, and safeguarding environmental sustainability, stands out as one of the most critical natural resources due to its pivotal role in fostering prosperity and abundance. In fact, water is indispensable for human health and survival, being necessary for drinking, cooking, sanitation, and hygiene [1]. Access to clean water is crucial for preventing diseases and maintaining overall health. Moreover, water is indispensable in agriculture and food security practices, including irrigation, livestock, and aquaculture. It guarantees sufficient crop yields and mitigates food shortages. Numerous industries depend on water for their production processes, cooling, and cleaning, emphasizing its crucial role in sectors like manufacturing, energy production, and mining. Additionally, water bodies such as rivers, lakes, and oceans sustain diverse ecosystems, offering vital services like climate regulation and habitats for various species, thereby promoting environmental sustainability and biodiversity [1,2]. However, in the 21st century, water scarcity and contamination emerge as predominant environmental obstacles on a global scale. According to the 2023 UNESCO’s report [2], approximately 2 billion individuals, corresponding to 26% of the global population, do not have access to safe drinking water. In fact, the escalating demands on water resources worldwide, driven by economic growth and population expansion, and worsened by climate variability and climate change, are responsible for water scarcity.
With the demand for water on the rise and supplies limited, it becomes essential to prioritize sustainable water usage. This involves adopting water-saving technologies and practices in agriculture, industry, and households. To address these challenges, in 2015, the United Nations instituted 17 Sustainable Development Goals, commonly referred to as the Global Goals, through the 2030 Agenda for Sustainable Development. These goals are closely linked, with achievements in one goal impacting outcomes in the others. The 2030 Agenda emerged from collaborative endeavors involving governments and citizens worldwide, aiming to establish a fresh global framework to eradicate poverty, foster universal prosperity and well-being, safeguard the environment, and combat climate change [3]. Specifically, Goal 6 is targeted towards guaranteeing both the access to and sustainable handling of water and sanitation. As outlined by the World Meteorological Organization, freshwater, in adequate volume and quality, is essential across all facets of life and to sustainable progress. Undoubtedly, access to clean drinking water and sanitation is fundamental to human dignity and is acknowledged by practically every nation. Water resources are intricately linked with every aspect of sustainable development, including ensuring food security, promoting health, and reducing poverty. Moreover, they play a crucial role in supporting economic development across agriculture, industry, and energy production, while also preserving the health of ecosystems [4].
Agriculture utilizes around 70% of the water withdrawn from rivers, lakes, and aquifers [5]. Intensifying agricultural practices leads to higher water consumption levels. Additionally, commercial sectors, industrial activities (especially in the food sector), and public water supplies also require substantial water use. Additionally, the pollution of both surface and groundwater resources must be taken into account [6], as this issue is frequently attributed to agricultural and agro-industrial practices [7]. Indeed, 25% of European groundwater is of low quality, primarily due to agricultural practices [8]. Therefore, it is essential to recognize the importance of efficient water resource management, ensuring its quality and preventing both degradation and waste, to safeguard the future availability of water resources [9]. Thus, safeguarding and sustainably using water is a key aspect of the United Nations Sustainable Development Goals, aiming to guarantee that everyone has access to water that meets high quality standards, i.e., water that is clean, uncontaminated, and responsibly managed [3].
Motivation and Main Contribution
To implement effective water conservation policies that promote water-saving behaviors, it is essential to understand users’ awareness levels and consumption patterns. In this context, providing new insights into the population’s awareness of water issues and its attitude towards water resource conservation, as well as its awareness of practices related to water saving, water reuse, and the preservation of water quality, is crucial. Thus, the goal of the present study was to assess the Portuguese population’s awareness of sustainable water usage practices.
The main contribution of this paper is the comprehensive assessment of the Portuguese population awareness regarding various aspects of water sustainability through a large-scale questionnaire. This assessment identifies specific areas, particularly water reuse, where awareness is low despite a generally higher awareness of sustainable water usage practices. Additionally, the paper introduces metrics for determining overall awareness and improvement potential, which is crucial for grouping participants based on similar characteristics and for designing targeted interventions to enhance sustainable behaviors.
2. Related Work
Issues related to water and its sustainable usage have been examined in numerous studies worldwide, using varied samples including university students, middle school students, and the general population. In the 2015–2016 school year, Aydoğdu and Çakır [10] undertook a study in Afyonkarahisar, Turkey, involving 1050 students from the 6th, 7th, and 8th grades. Their research focused on understanding attitudes and awareness regarding water usage among middle school students. Quantitative data collection involved administering a questionnaire where participants expressed their agreement with presented statements using a 5-point Likert scale (I absolutely agree, I agree, I am neutral, I don’t agree, I definitely don’t agree). According to the results obtained, the most frequent response was I agree. Therefore, the authors concluded that middle-school students demonstrate a collective awareness of water usage, emphasizing that this result aligns with what would be expected in this demographic group. The analysis of the results, considering the socio-demographic characteristics of the sample, revealed that female students exhibited significantly higher levels of awareness regarding water usage compared to male students. Additionally, students with parents who were university graduates also demonstrated significantly higher levels. Conversely, a student’s grade level or their place of residence did not show a significant influence on their attitudes towards water usage. According to the authors, the results obtained from these interviews indicate that middle school students have a high level of water usage awareness. The interview findings also suggest that students possess sufficient knowledge about the importance of water awareness. Moreover, participants have demonstrated awareness regarding the importance of preserving water for future generations, an understanding of its significance for a livable world, and a recognition of both the individual and the societal responsibilities involved in furthering this awareness. Conversely, the interviews reveal a lack of knowledge among students regarding World Water Day, indicating a deficiency in the emphasis placed on such events within schools [10].
Another study conducted among upper-school students in Pasir Mas, Kelantan, Malaysia, involving 242 6th form students, aimed to access the levels of knowledge, attitude, and practice of students concerning water resources sustainability [11]. The research outcomes revealed that students exhibited elevated levels of knowledge and practices concerning the sustainability of water resources. In contrast, their attitudes in relation to water resource sustainability were deemed moderate. Furthermore, there were no significant variations found in the knowledge, attitudes, and practices regarding water resource sustainability among male and female students involved in the study. Regarding the correlation between the knowledge and practice variables, the authors identified a moderate correlation. Conversely, in the relationship between attitude and practice, the correlation was described as strong. Finally, the authors state that their study revealed a promising level of awareness among 6th form students regarding water resource sustainability. Consequently, they propose integrating education on water resource sustainability into the students’ curriculum and introducing extracurricular activities to guarantee that students recognize the importance of water resource sustainability in their daily lives.
A study conducted during the second semester of the 2023 academic year, involving 305 undergraduate students from Kasetsart University, revealed a generally high level of consciousness concerning sustainable water usage within the participants [12]. Specifically, increased consciousness was noted in the realms of water conservation, hygiene practices, and culinary activities, while tree-care awareness was rated at a moderate level. Furthermore, the analysis based on demographic factors exhibited varying levels of sustainable water usage consciousness. The commonly utilized media platforms showed no discernible interdependence with the degree of sustainable water usage consciousness. Finally, the fact that the participants knows and understands issues related to sustainable water usage showed a weak interdependence with sustainable water usage consciousness.
Augustine and Hanafiah [13] evaluated the level of understanding among students concerning the importance of water resources and their initiatives in conserving water across 10 residential colleges at Universiti Kebangsaan, Malaysia (UKM). In this study, a questionnaire survey was used, with the questionnaire consisting of three sections (i.e., demographic profiles, awareness level, and application). In the last two sections, participants expressed their opinions using a 5-level Likert scale (1—Strongly Disagree, 2—Disagree, 3—Unsure/Neutral, 4—Agree, and 5—Strongly Agree). The results from a sample size of 500 participants revealed a high level of awareness among UKM students regarding water resource conservation. Nevertheless, there was a significant gap in the implementation of water conservation practices among them.
Radzi et al. [14] conducted a study focusing on water conservation awareness among students residing in Universiti Sains Malaysia hostels. The authors used a survey comprising multiple-choice questions administered to 214 students. Through analyzing the questionnaire responses, the researchers evaluated the students’ awareness of water conservation. The results indicated a limited level of awareness regarding water conservation among the students. The study suggests the need for the university to implement more impactful initiatives (e.g., the university water day) to raise students’ awareness about the water scarcity issues both nationally and globally.
During the 2011–2012 academic year, a study was conducted with 35 pre-service science teachers from the Environmental Science course at the Eskisehir Osmangazi University, Turkey [15]. The study aimed to assess the impact of water education on participants’ awareness and found that a majority of participants stated concerns about future water-related challenges. These concerns encompassed issues such as the scarcity of usable water, insufficient education on relevant topics, unconscious water consumption patterns, and the pressures of population growth. Furthermore, the pre-service science teachers identified potential future problems including an uptick in contagious diseases, the struggle to access clean water sources, and looming water shortages. Within the participants, a considerable number expressed concerns that if unconscious water consumption persists without a promptly intervention, it could worsen water-related problems for future generations.
A study conducted among MSc students in University of Birmingham, United Kingdom, involving 299 individuals, aimed to investigate the subject of water consumption, particularly focusing on the water usage habits of students [16]. To gain insights into students’ awareness and understanding of their domestic water consumption now and in the future, a questionnaire was administered over five academic years (from 2017 to 2021). The study’s findings reveal that master’s students tended to underestimate their water usage relative to the average observed across the UK. Furthermore, the results indicate a prevailing inclination among students to prioritize the adoption of water-saving technologies (40%) over behavioral modifications (27%). Considering these findings, the authors emphasize the importance of adopting a social practice theory perspective to effectively address water conservation challenges and promote significant changes in water usage patterns.
A study conducted with 1831 inhabitants of Albuquerque, New Mexico, a dry region in the USA, examined the impact of residents’ awareness of water scarcity and their belief in climate change on their willingness to use recycled water, both directly and indirectly [17]. According to the study’s findings, inhabitants’ willingness to embrace direct recycled potable water is positively affected by their grasp of water scarcity, with the caveat that this influence is contingent upon their belief in climate change’s impact on the water cycle. Moreover, the propensity to accept indirect recycled potable water is shaped by the awareness of water scarcity, with a belief in climate change reinforcing this tendency. The authors point out these results underscore the importance of addressing climate change skepticism and raising awareness about water scarcity in the region to enhance the effectiveness and sustainability of long-term efforts in water conservation and climate change mitigation.
Another study conducted in Muscat, Sultanate of Oman [18] aimed to explore public concerns and perceptions about the reuse of treated wastewater and to clarify how these perceptions could shape its current/future use. For this purpose, a survey questionnaire was carried out among 115 randomly selected residents. The study findings suggested that, overall, the public was familiar with water and wastewater terminology. Positive attitudes towards utilizing treated wastewater for various purposes such as irrigation, urban practices, groundwater replenishment, and industrial activities were noted. Conversely, options linked to human health, such as the discharge into aquatic environments and the reutilization for human consumption, were less favored. The authors stress that sharing knowledge and experiences is crucial for understanding and accepting wastewater reuse. They propose utilizing media channels to inform and enhance public awareness and engagement. Moreover, they also emphasize the need for more educational programs to raise awareness among younger people.
A study by Hussain et al. [19] examined community awareness and public confidence in government-issued information on drinking water quality in Guangzhou (China) and Karachi (Pakistan). The study was based on questionnaire-based survey conducted over a six-month period in 2022. The findings indicate that in Guangzhou, awareness levels and positive attitudes among respondents were 46.2% and 30.0%, respectively. In Karachi, these levels were notably lower at 23.1% and 7.4%. Similarly, trust in media reports on water pollution accidents was higher in Guangzhou (76.0%) compared to Karachi (70.8%), while trust in government-provided information was also significantly higher in Guangzhou (79.3%) compared to Karachi (39.7%). The authors emphasize the need for increased awareness and more positive attitudes in both cities. Consequently, they recommend implementing enhanced public awareness campaigns in schools and community centers. They also suggest that non-governmental organizations could play a crucial role by organizing seminars and activities to enhance environmental knowledge and motivation among the general public. The study further calls for greater public participation in the development and execution of environmental policies to improve water quality standards.
Benameur et al. [20] investigated public perceptions and awareness regarding drinking water quality, safety, and pollution events among residents of the province of Biskra, Algeria. Their study utilized a convenience sample of the general population, consisting of 300 residents of the province of Biskra, covering all age categories. The study revealed a concerning lack of awareness regarding water quality standards, as reflected in the priority given to taste (48.7%), odor (35%), appearance (34.7%), and color (32%) in water consumption profiles. Moreover, 55.7% of participants expressed dissatisfaction with the communication about preventive health measures regarding water quality. The authors highlight the influence of education level on perceptions of water quality and confidence in the safety of drinking water. The study’s findings emphasize the importance of policy makers and public health authorities considering these results to implement effective actions for preventing water contamination and protecting public health.
A study conducted in Kajang, Malaysia [21] aimed to explore public awareness level regarding drinking water quality, pharmaceutical disposal, and the occurrence of pharmaceutical residues in drinking water and its potential health risks. To collect information, 89 randomly chosen residents were surveyed between May and September 2018. The findings indicate that the majority of participants demonstrated low knowledge (82.0%), a largely negative attitude (98.9%), and a moderate level of good practices (57.3%) concerning drinking water and pharmaceutical handling.
Tong et al. [22] investigated the impact of awareness, perceptions, and individual behavior control on water conservation efforts, along with the role of gender, in these practices. A comprehensive survey involving 622 residents (318 women and 304 men) in rural northern China was carried out from April to August 2014 through personal interviews. The survey collected data on participants’ demographics and their attitudes towards water conservation, utilizing a Likert scale with five points. The study revealed that while respondents were highly aware of water conservation methods, their participation was low, especially among men. Women were more proactive in adopting conservation measures. The primary motivator for women was reducing water bills, whereas men were driven by the need to address water supply shortages. The noteworthy differences between genders underscore the importance of promoting transparency and communication across genders and between users and authorities in creating public policies and community initiatives. Such efforts are essential for mitigating gender disparities and foster wider acceptance of water conservation practices.
The importance of public awareness in attaining Sustainable Development Goal 6 cannot be understated [23]. Thus, the authors undertook a study to explore its significance alongside other relevant factors in developing countries. The results unveiled several factors affecting households’ adoption of clean water, such as willingness to pay, social influence, governmental support, public awareness, and knowledge about water contamination. The authors suggest that the willingness to invest in clean water enhances the intention to utilize it. Thus, individuals who are inclined to invest in clean water are more likely to use it. However, upon becoming aware of the associated costs, especially due to their limited financial means, they hesitate to pay, expecting, instead, that the government provides clean water free of charge. Additionally, the authors highlight that in developing nations, financial constraints may take precedence over awareness and healthcare issues. The intention to use clean water is positively influenced by both social influence and governmental facilities, both of which are further enhanced by public awareness. Similarly, the results showed that awareness of the risks associated with contaminated water positively influences individuals to use clean water. Finally, the authors noted that demographic factors such as gender, age, and education did not influence a household’s intention to use clean water.
Given the research question and the fact that most questionnaires found in the literature focus primarily on the attitudes and behaviors of specific population groups regarding their water consumption habits, a questionnaire was designed, validated, and disseminated across Portugal to individuals representing a broad spectrum of demographics, encompassing both genders, diverse age groups, varied educational levels, and different regions of the country.
3. Methodology
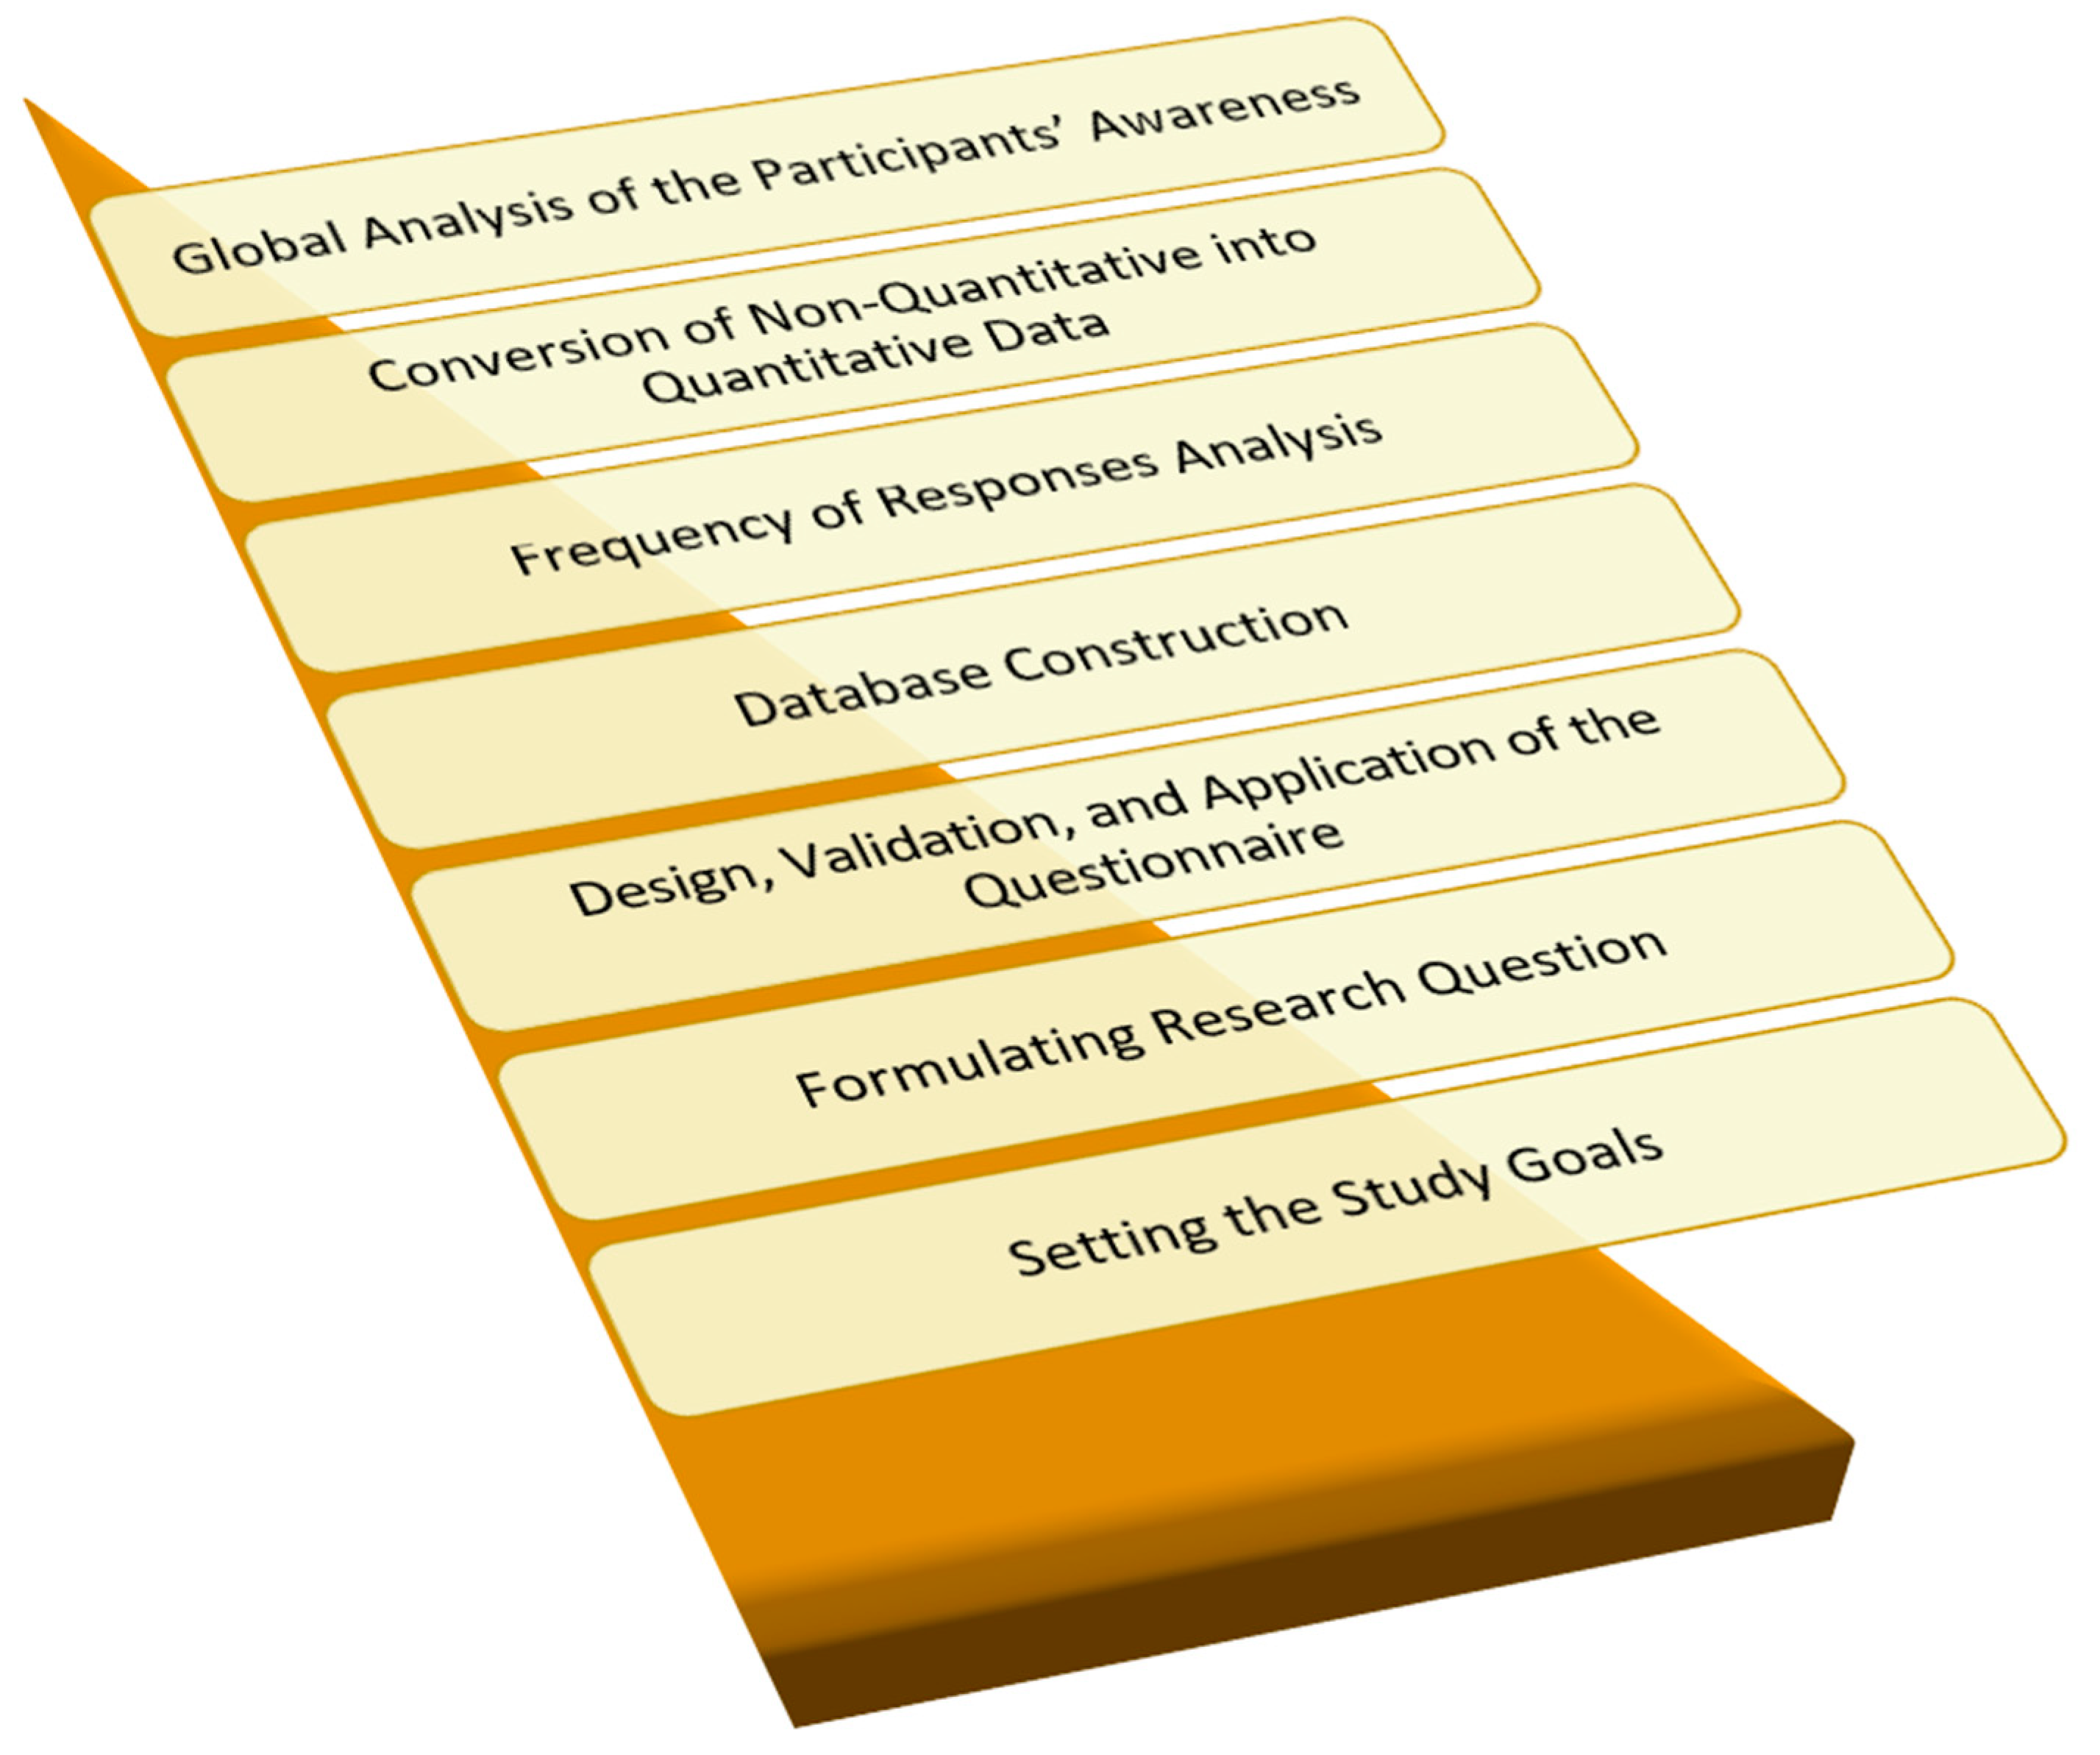
This section summarizes the study’s structure (Figure 1), including the design, how data was collected, the instruments used, the characteristics of the sample, and the analytical methods applied. Moreover, ethical considerations taken into account during the research process are addressed.
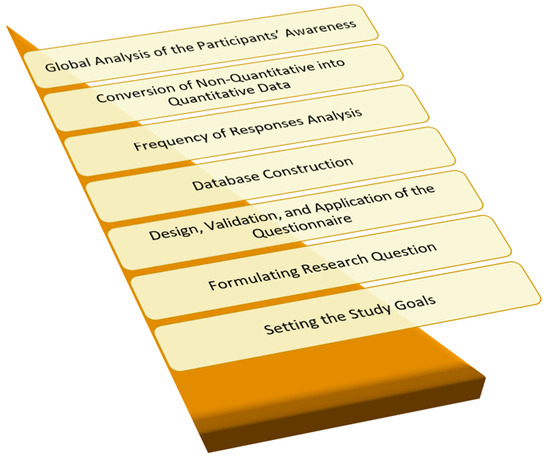
Figure 1.
A synopsis of the main steps of the ongoing study.
3.1. Study Design
This study seeks to assess the level of public awareness regarding this topic to design future interventions aimed at promoting sustainable water usage. Therefore, the focus is on addressing the following research question:
- What is the Portuguese population’s awareness of sustainable water usage practices?
In the questionnaire’s conception, five topics were considered (i.e., water resources, water quality, water availability, water saving, and water reuse), to allow the implementation of the methodology presented by Fernandes et al. [24] to convert qualitative data into quantitative data. The following subsections provide details on these points.
3.2. Data Collection
The adoption of a questionnaire survey method arose from a detailed examination of the available techniques, with the decision further supported by this method’s ease of use and adaptability. Additionally, the questionnaire survey method is characterized by a clearly outlined structure, simplifying the transformation of participants’ qualitative responses into quantitative data [25,26,27,28].
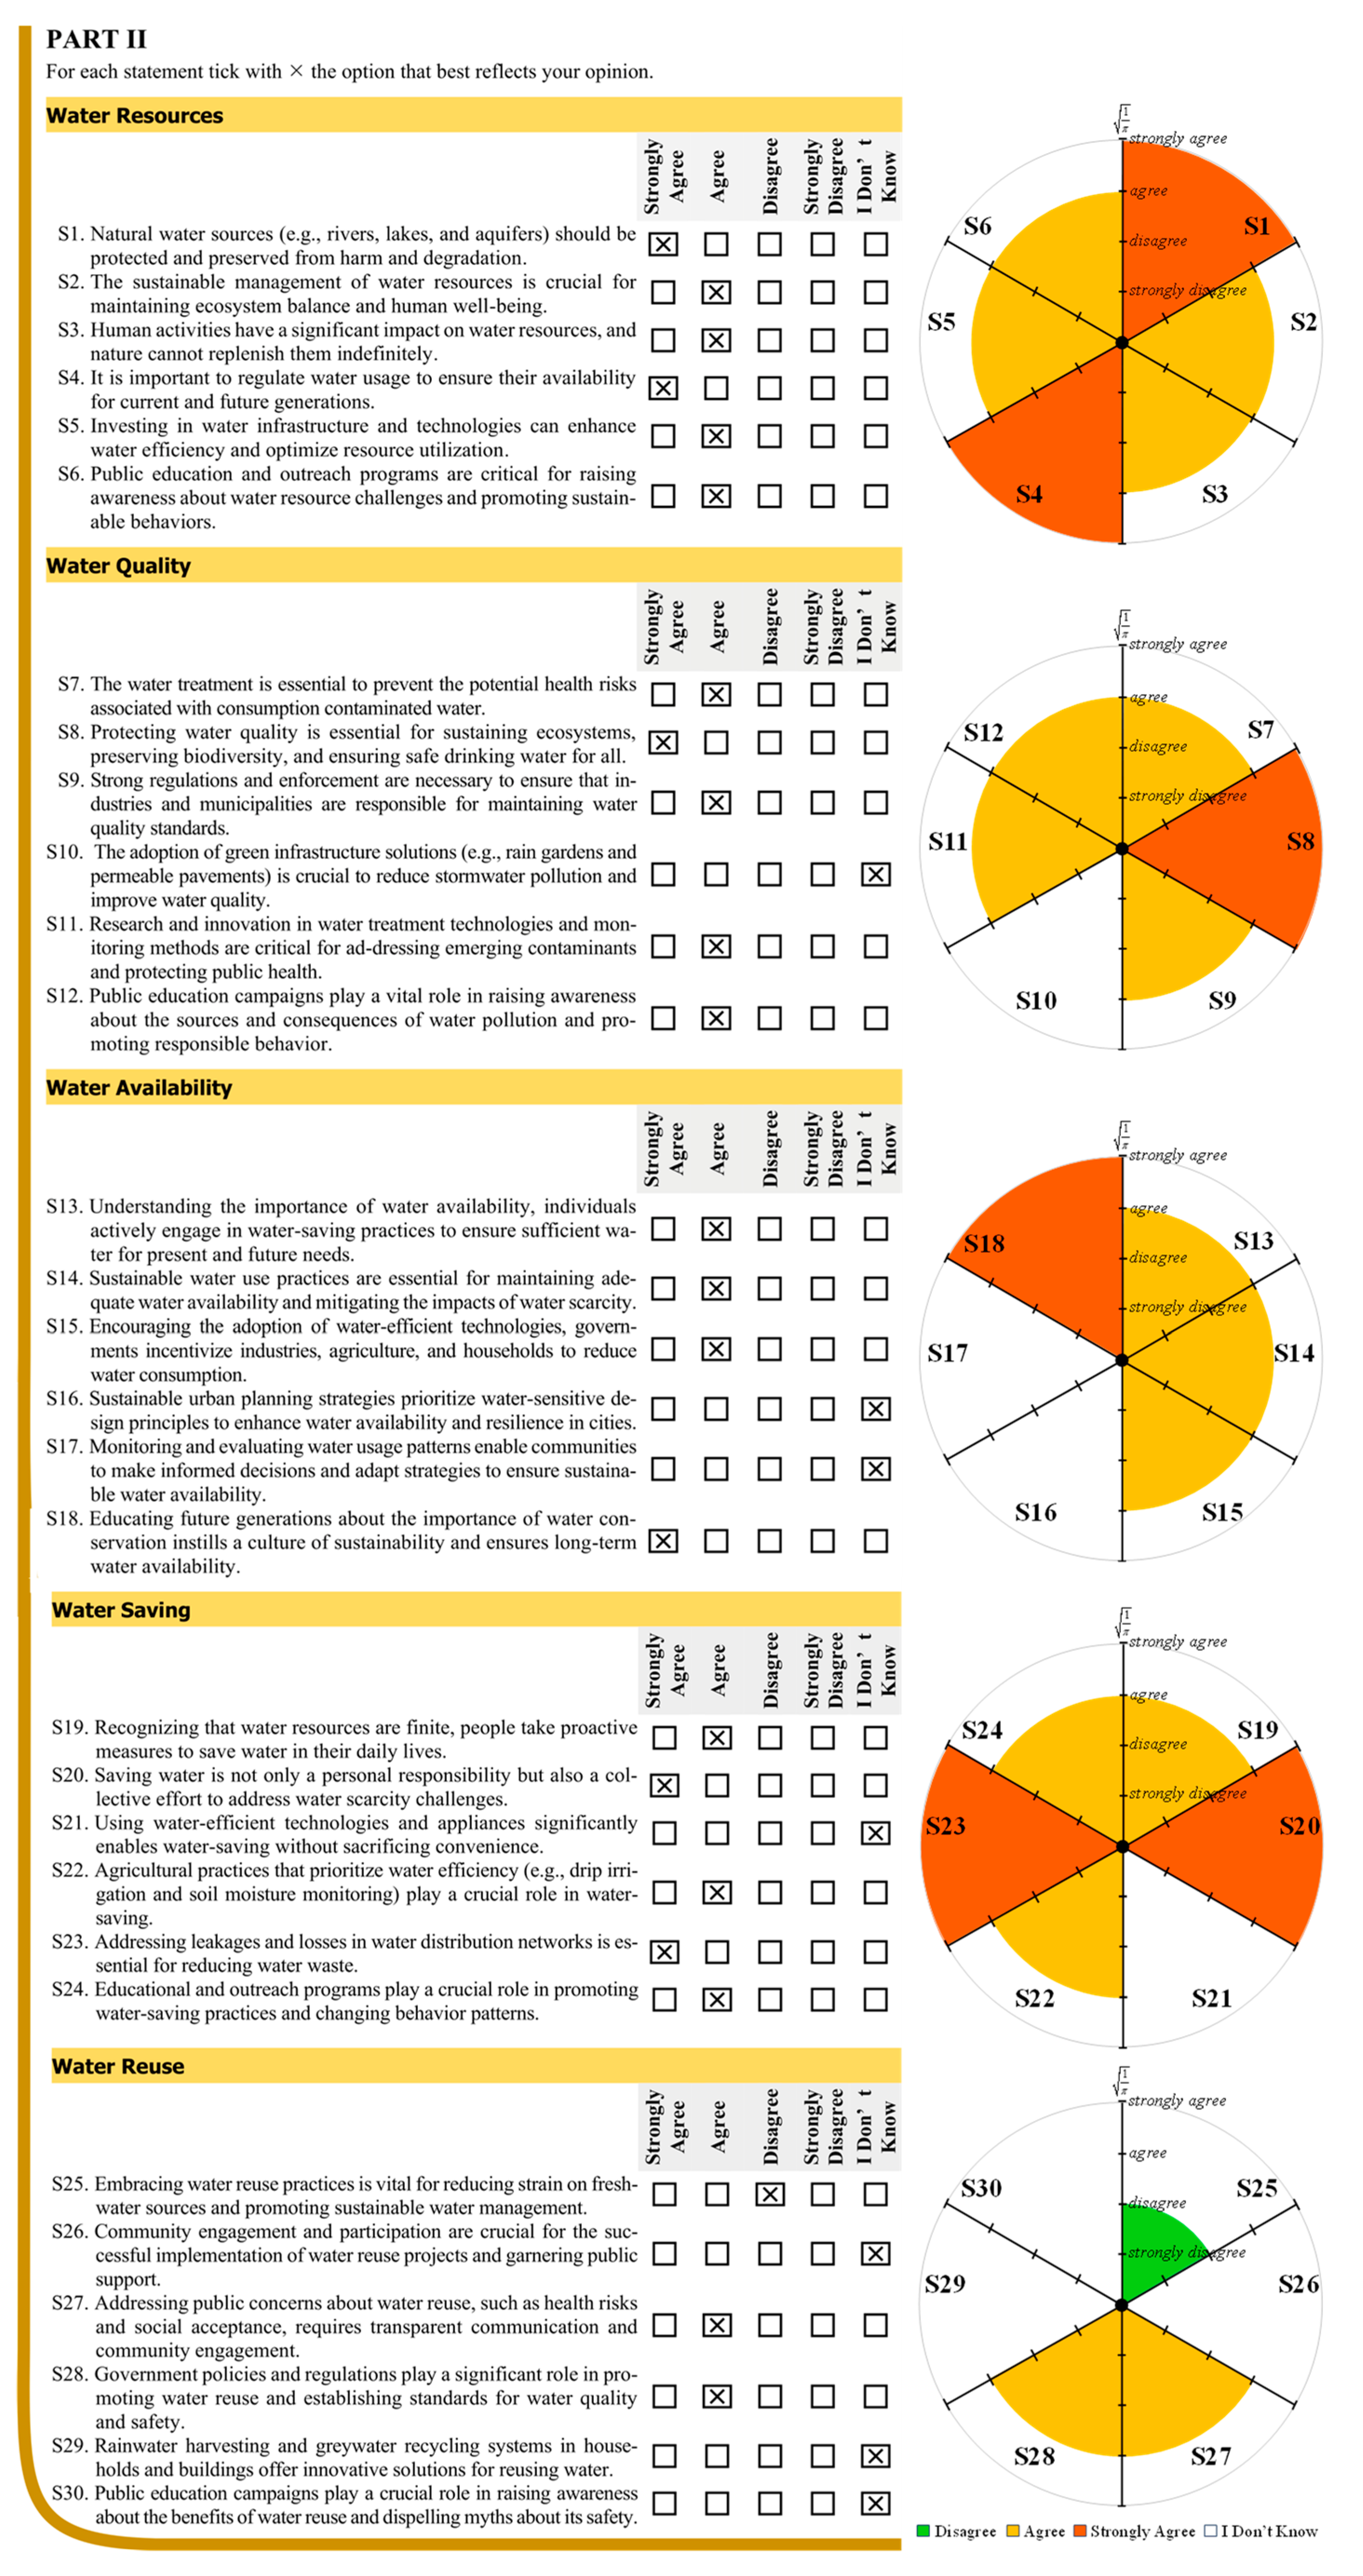
Structured in two parts, the questionnaire created for this study begins by gathering sociodemographic data, covering aspects such as age, gender, educational qualification, residential area, and employment status. The second section of the questionnaire includes a set of statements (Table 1) related to the topics of the study (i.e., water resources, water quality, water availability, water saving, and water reuse), prompting participants to share their opinions. Diverging from the descriptive format used in the initial responses, the second section employs a five-point Likert scale (i.e., strongly agree, agree, disagree, strongly disagree, and I don’t know) for participants to indicate their responses.

Table 1.
List of the statements included in Part II of the questionnaire by topics.
Following the recommendations outlined by Bell [29], a panel of experts critically evaluated the questionnaire, indicating adjustments that were subsequently integrated into a new version. The expert panel consisted of five members who were selected based on their professional qualifications and expertise in the fields of chemistry, chemical engineering, environmental sustainability, sustainable water use, and education for sustainability. Collectively, the panel members had extensive experience in research on pollution and water treatment, water management in urban and rural areas, public policies and sustainable development, educational programs and green curriculum development, and clean technologies and sustainable processes in industry.
The validity and clarity of the new version of the questionnaire were then evaluated, using a separate subset of participants not included in the main sample. The revised questionnaire was distributed to every participant in a printed format and provided individually. The entirety of the 2100 questionnaires distributed were returned, achieving a return rate of 100%.
3.3. Participants
Among the 2100 questionnaires distributed, 377 (18.0%) were removed from this study due to incomplete responses in the second part. Thus, a total of 1723 participants, aged between 15 and 84 years, were included in the study, with an average age of 40.3 ± 19.9 years. The categorization of participants by age group, gender, educational qualification, residential area, and employment status is displayed in Table 2.
Table 2.
Number of participants by age group, gender, academic qualification, residential area, and employment status.
3.4. Qualitative Data Processing
The second section of the questionnaire collected qualitative data, which was assessed using a Likert scale with five response categories. Following the method outlined by Fernandes et al. [24], the qualitative data underwent transformation into numerical data. In accordance with this method, the j responses linked to a specific topic are represented within a unitary circular shape (). The circular shape is divided into j parts, and each response option is marked along the axis, as described in Section 3.3.
3.5. Ethical Aspects
The study was conducted following the current legal regulations. All individuals involved were informed about the research objectives and willingly consented to take part by filling out the questionnaire.
4. Results and Discussion
In this section, results from this study are displayed, with a subsequent analysis based on the contributions of 1723 participants.
4.1. Frequency of Responses Analysis
Figure 2 illustrates the distribution of response percentages for statements S1 to S6 (Table 1) concerning water resources. The prevailing response to statements S2, S3, S5, and S6 was agree. Specifically, the percentage corresponding to statement S2 reached 68.9%, while the percentage for statement S3 was 46.2%. Similarly, for statement S5, 62.6% of participants chose the agree option, whereas for statement S6, 65.9% of participants selected this option. Conversely, for statement S1, the majority of participants (77.8%) selected the option strongly agree, whereas 20.1% ticked the option agree. Likewise, for statement S4, the majority of participants also opted for the strongly agree option (74.4%), while 25.5% chose the agree option. Moreover, it is noteworthy that participants selected the strongly disagree option only for statements S2 and S5, with percentages not exceeding 1.0%. Similarly, the disagree option was marked by fewer than 1% of participants for statements S1 and S4. For statements S3, S5, and S6, this percentage ranged from 5% to 10%. It was only for statement S2 that more than 10% of participants selected this option. It is also worth underlining that the I don’t know option was chosen for every statement. The highest percentage of I don’t know responses was registered for statement S2 (8.2%), followed by statement S5 (8.1%), and statement S6 (5.1%). In contrast, for statements S1, S3, and S4, this percentage stayed below 2.5%. Therefore, the prevalence of positive responses (strongly agree/agree) across all statements on this topic suggests high levels of awareness among participants regarding the water resources issues.
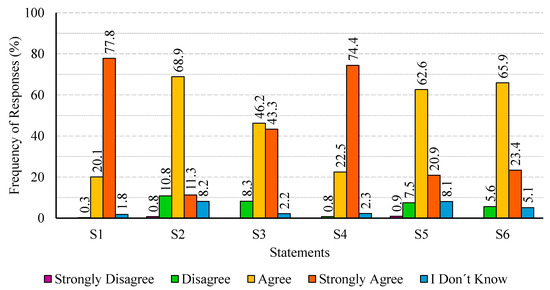
Figure 2.
Distribution of response percentages for statements S1 to S6 regarding water resources.
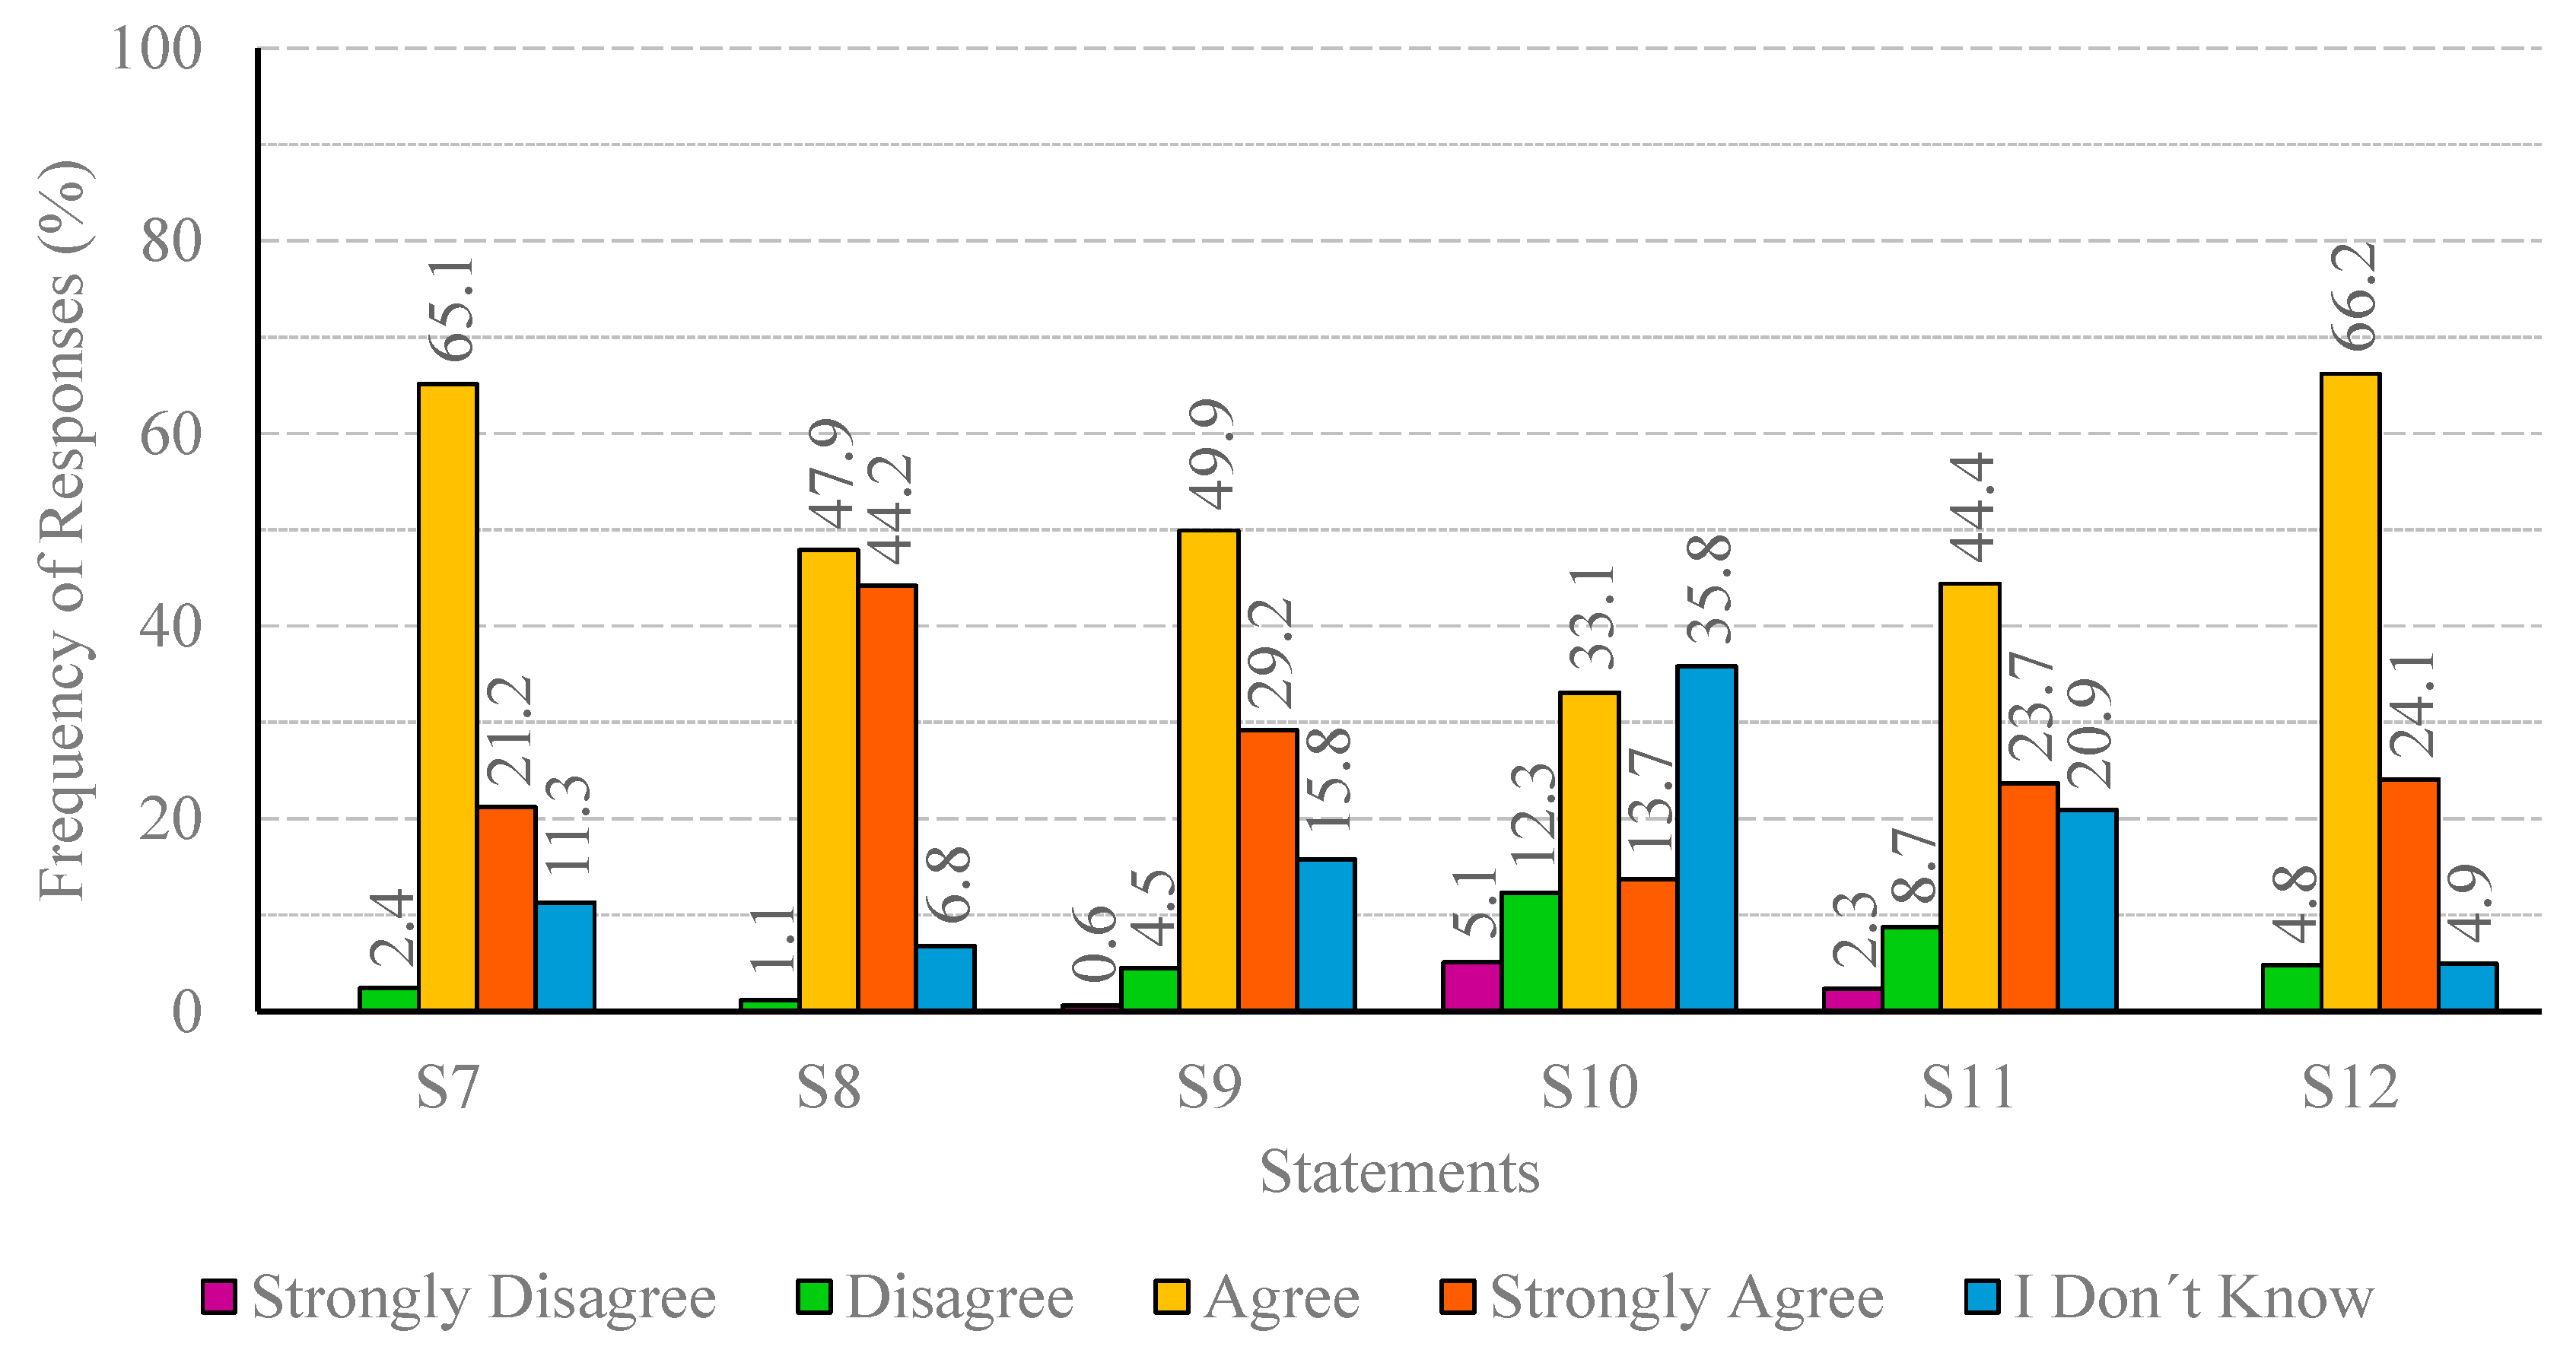
Figure 3 illustrates the distribution of response percentages for statements S7 to S12 (Table 1) concerning water quality. The analysis of Figure 3 reveals that, within this set of questions, the percentage of participants opting for the agree option ranged from 33.1% to 65.1%, emerging as the most prevalent response. However, statement S10 showed a distinct trend, with the I don’t know option emerging as the preferred choice, selected by 35.8% of participants. In this topic, the strongly agree option was never the most chosen. However, in statements S8 and S9 it was selected by 44.2% and 29.2% of participants, respectively. For the remaining statements, the percentage of participants selecting this option ranged from 13.7% to 24.1%. The participants selected the strongly disagree option only for statements S9, S10 and S11, with percentages ranging from 0.6% to 5.1%. The disagree option was marked by fewer than 5% of participants for statements S7, S8, S9, and S12. For statements S10 and S11, this percentage was 12.3% and 8.7%, respectively. It is important to point out that the I don’t know option was chosen for every statement. The greatest percentage of I don’t know responses was registered for statement S10 (35.8%), followed by statement S11 (20.9%), statement S9 (15.8%), and statement S7 (11.3%). In contrast, for statements S8 and S12, this percentage was 6.8% and 4.9%, respectively. Therefore, the prevalence of positive responses (strongly agree/agree) across the majority of statements on this topic suggests high levels of awareness among participants regarding the water quality issues. However, participants are not as aware of green infrastructures solutions and water treatment technologies.
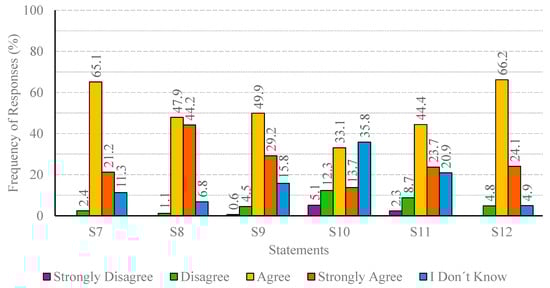
Figure 3.
Distribution of response percentages for statements S7 to S12 regarding water quality.
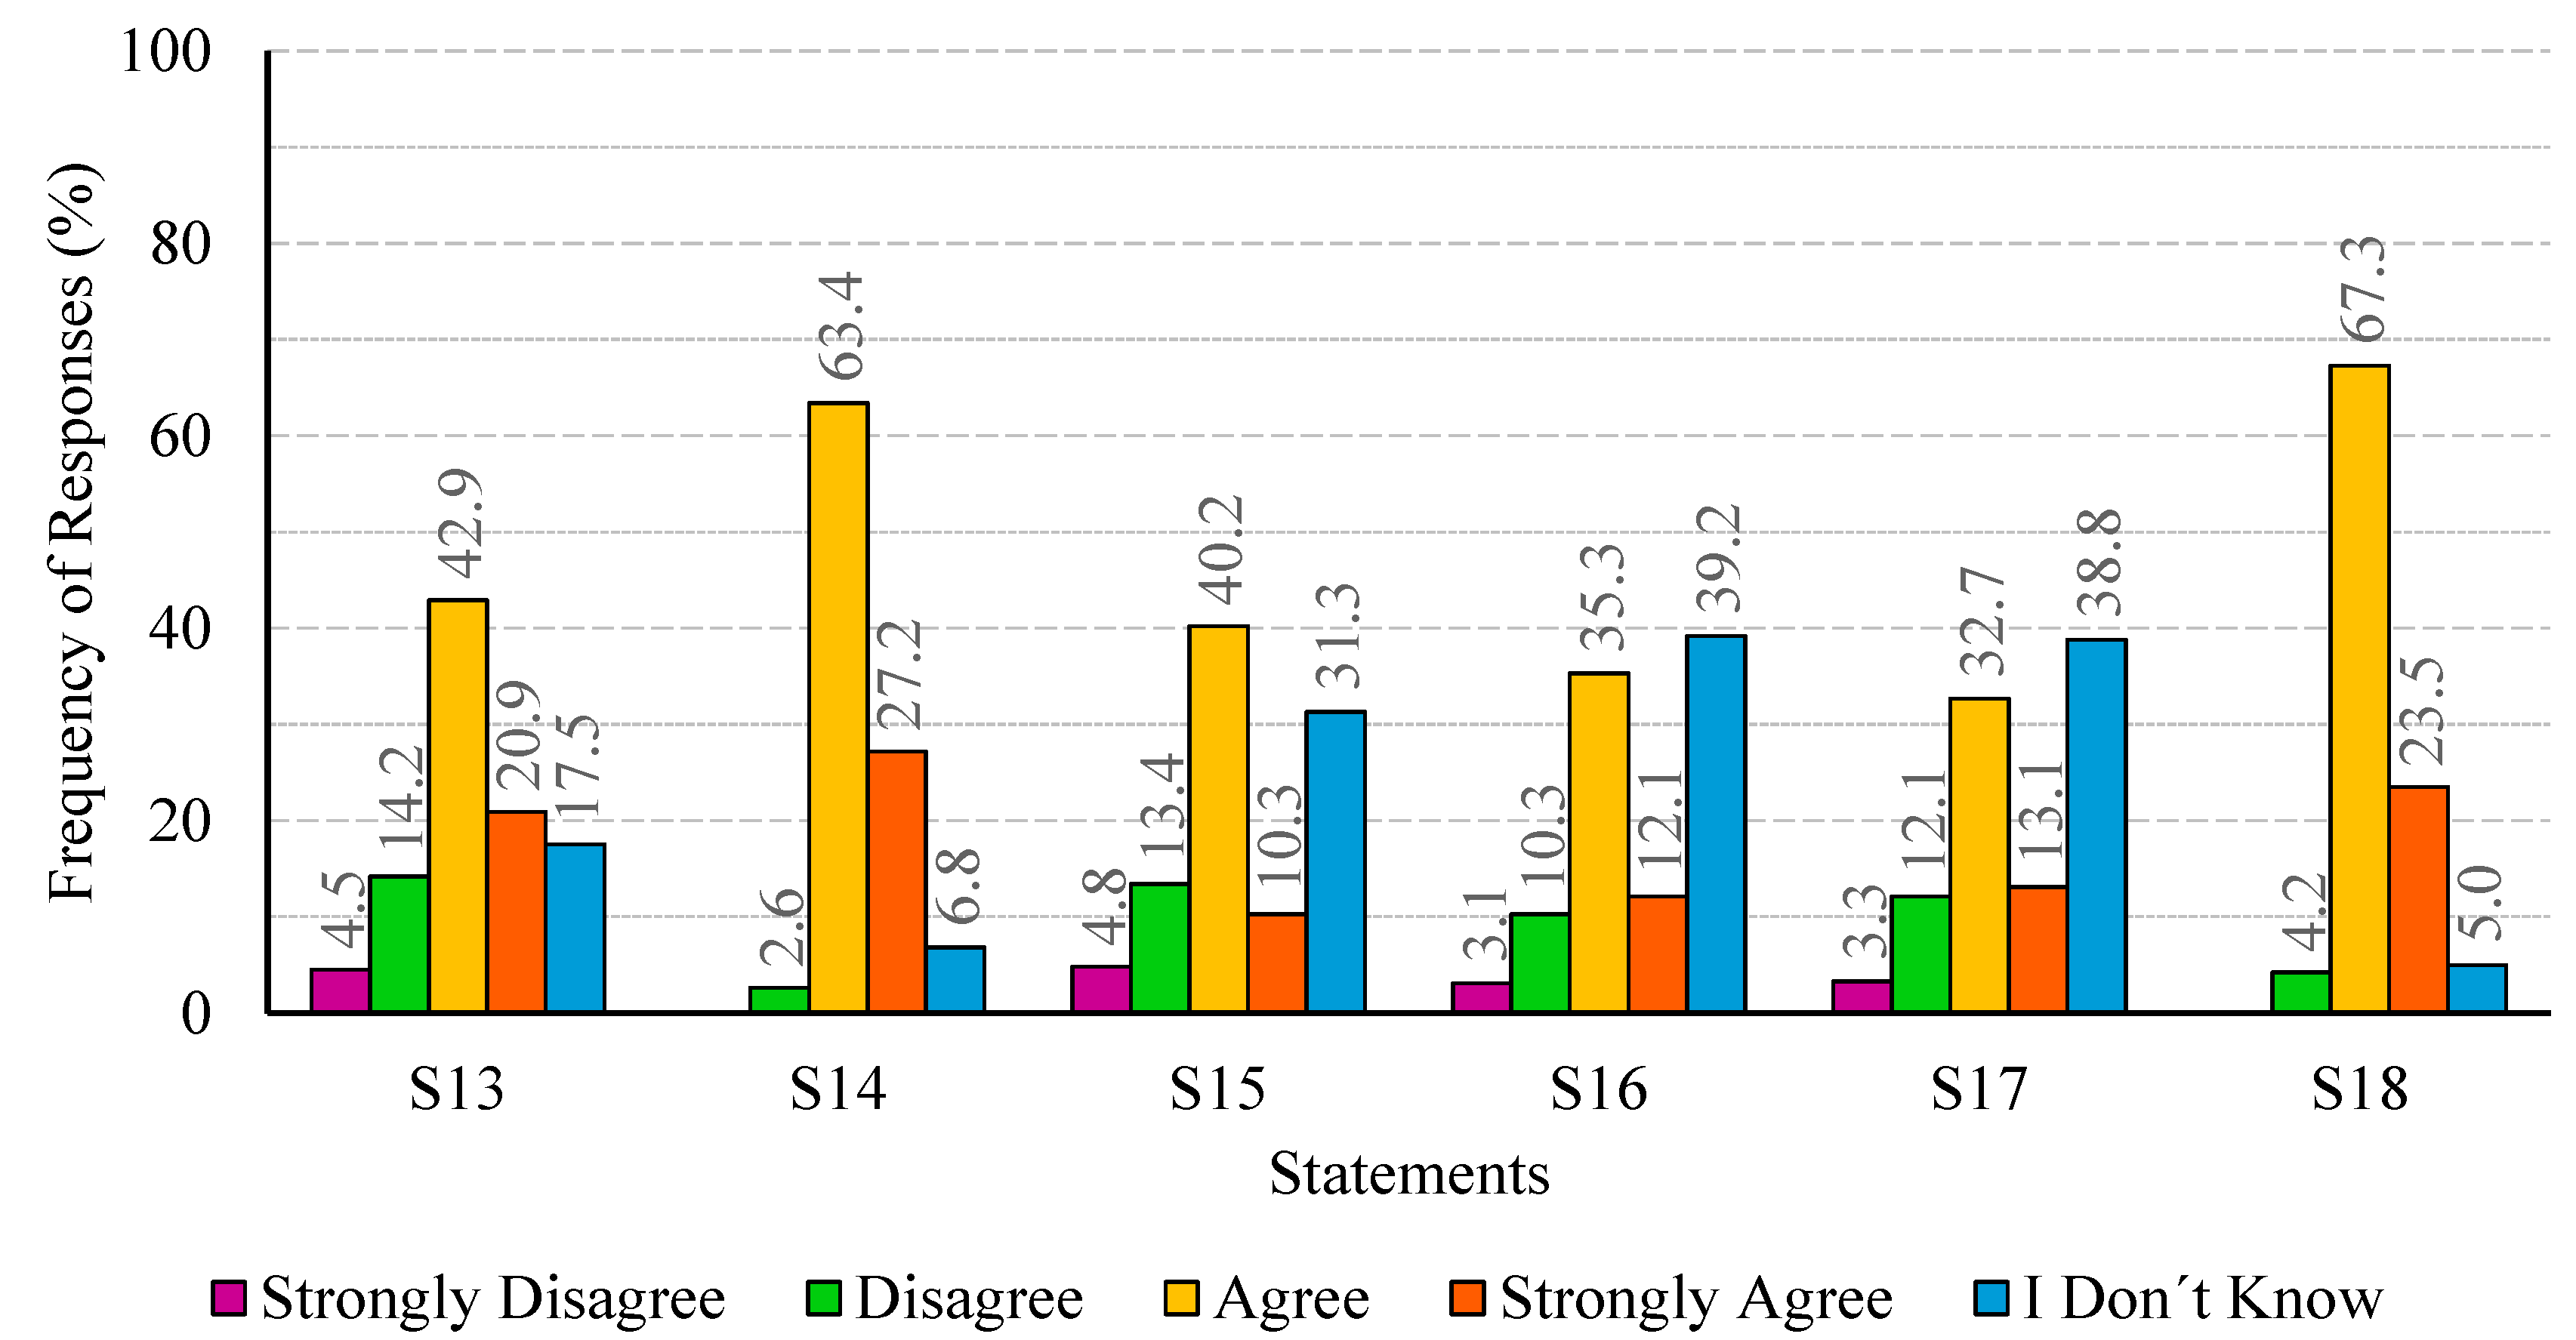
Figure 4 illustrates the distribution of response percentages for statements S13 to S18 (Table 1) concerning water availability. Across these statements, the agree option was the most prevalent, varying from 33.7% to 67.3%. However, statements S16 and S17 exhibited a distinct trend, with the I don’t know option being the preferred choice, selected by 39.2% and 38.8% of participants, respectively. In this topic, the strongly agree option never emerge as the most chosen. However, in statements S13, S14, and S18, the strongly agree option was selected by 20.9%, 27.2% and 23.5% of participants, respectively. For the remaining statements, the percentage of participants selecting this option ranged from 10.3% to 13.1%. The participants selected the strongly disagree option only for statements S13, S15, S16, and S17, with percentages ranging from 3.1% to 4.8%. The disagree option was marked by fewer than 5% of participants for statements S14 and S18, whereas for the remaining statements this percentage ranged from 10.3% and 14.2%. It is noteworthy that the I don’t know option was chosen for every statement. The highest percentage of I don’t know responses was registered for statement S16 (39.2%), followed by statement S17 (38.8%), statement S15 (31.3%), and statement S13 (17.5%). In contrast, for statements S14 and S18, this percentage was 6.8% and 5.0%, respectively. Therefore, the slight prevalence of positive responses (strongly agree/agree) across the majority of statements on this topic suggests that the participants are aware of water availability issues. However, they are not as aware of issues related with water-efficient technologies, sustainable urban planning, and monitoring water usage patterns.
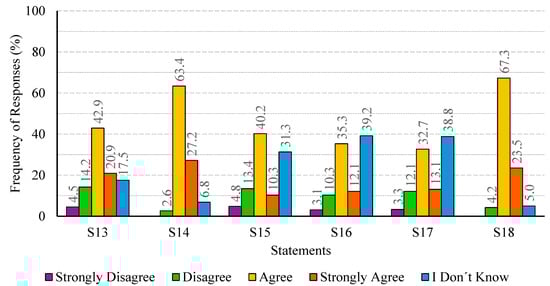
Figure 4.
Distribution of response percentages for statements S13 to S18 regarding water availability.
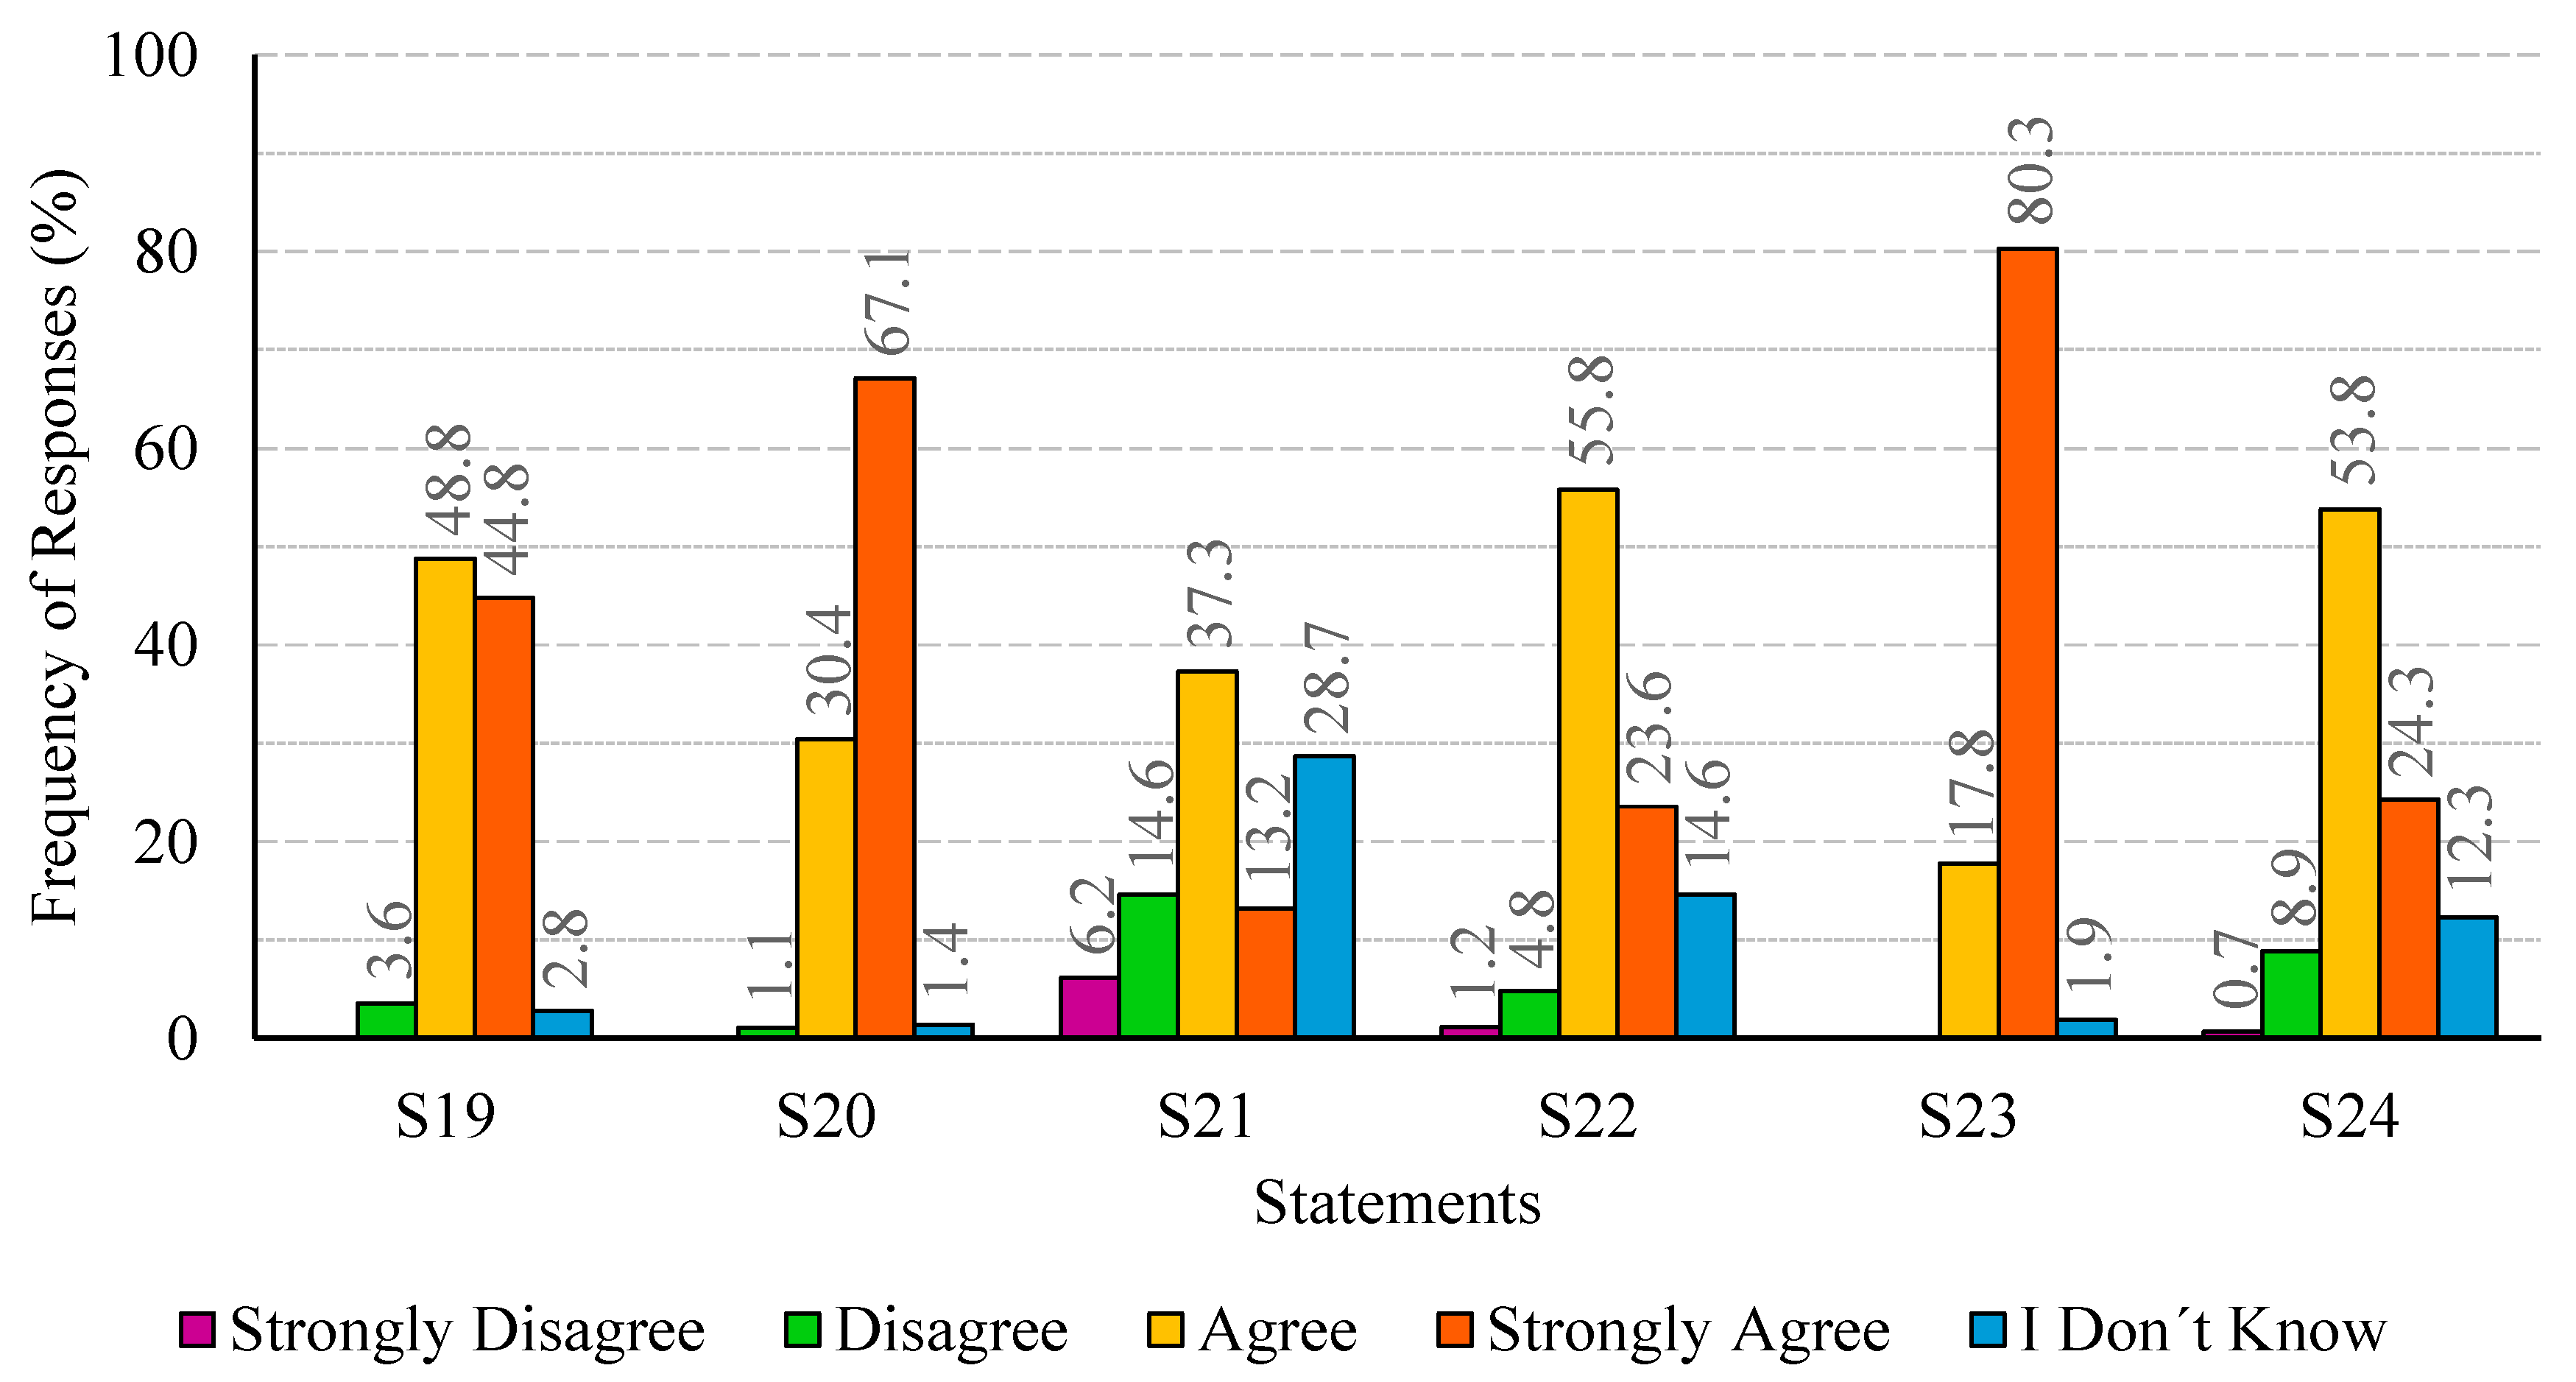
Figure 5 illustrates the distribution of response percentages for statements S19 to S24 (Table 1) concerning water saving practices. Among these statements, the agree option emerged as the most prevalent response for statements S19, S21, S22, and S24. Specifically, the percentage corresponding to statement S19 reached 48.8%, while the percentage for statement S21 was 37.3%. Similarly, for statement S22, 55.8% of participants chose the agree option, whereas for statement S24, 53.8% of participants selected this option. Conversely, for statement S20, the majority of participants (67.1%) selected the strongly agree option, whereas 30.4% chose agree. Likewise, in statement S23, the majority of participants also opted for the strongly agree option (80.3%), while 17.8% chose agree. Moreover, it is noteworthy that participants selected the strongly disagree option only for statements S21, S22, and S24. For statement S21, this percentage reached 6.2%, while for the remaining statements, it did not exceed 1.2%. Similarly, the disagree option was selected only for statements S19, S20, S21, S22, and S24. For statements S19, S20, and S22 this percentage was less than 5%, while for statements S24 and S21 it reached 8.9% and 14.6%, respectively. It is also worth underlining that the I don’t know option was chosen for every statement. The highest percentage of I don’t know responses was registered for statement S21 (28.7%), followed by statement S22 (14.6%) and statement S24 (12.3%). In contrast, for statements S19, S20, and S23, this percentage stayed below 3.0%. Therefore, the prevalence of positive responses (strongly agree/agree) across the majority of statements on this topic suggests high levels of awareness among participants regarding the water saving issues. However, participants are not as aware of the use of water efficient technologies and appliances.

Figure 5.
Distribution of response percentages for statements S19 to S24 regarding water saving.
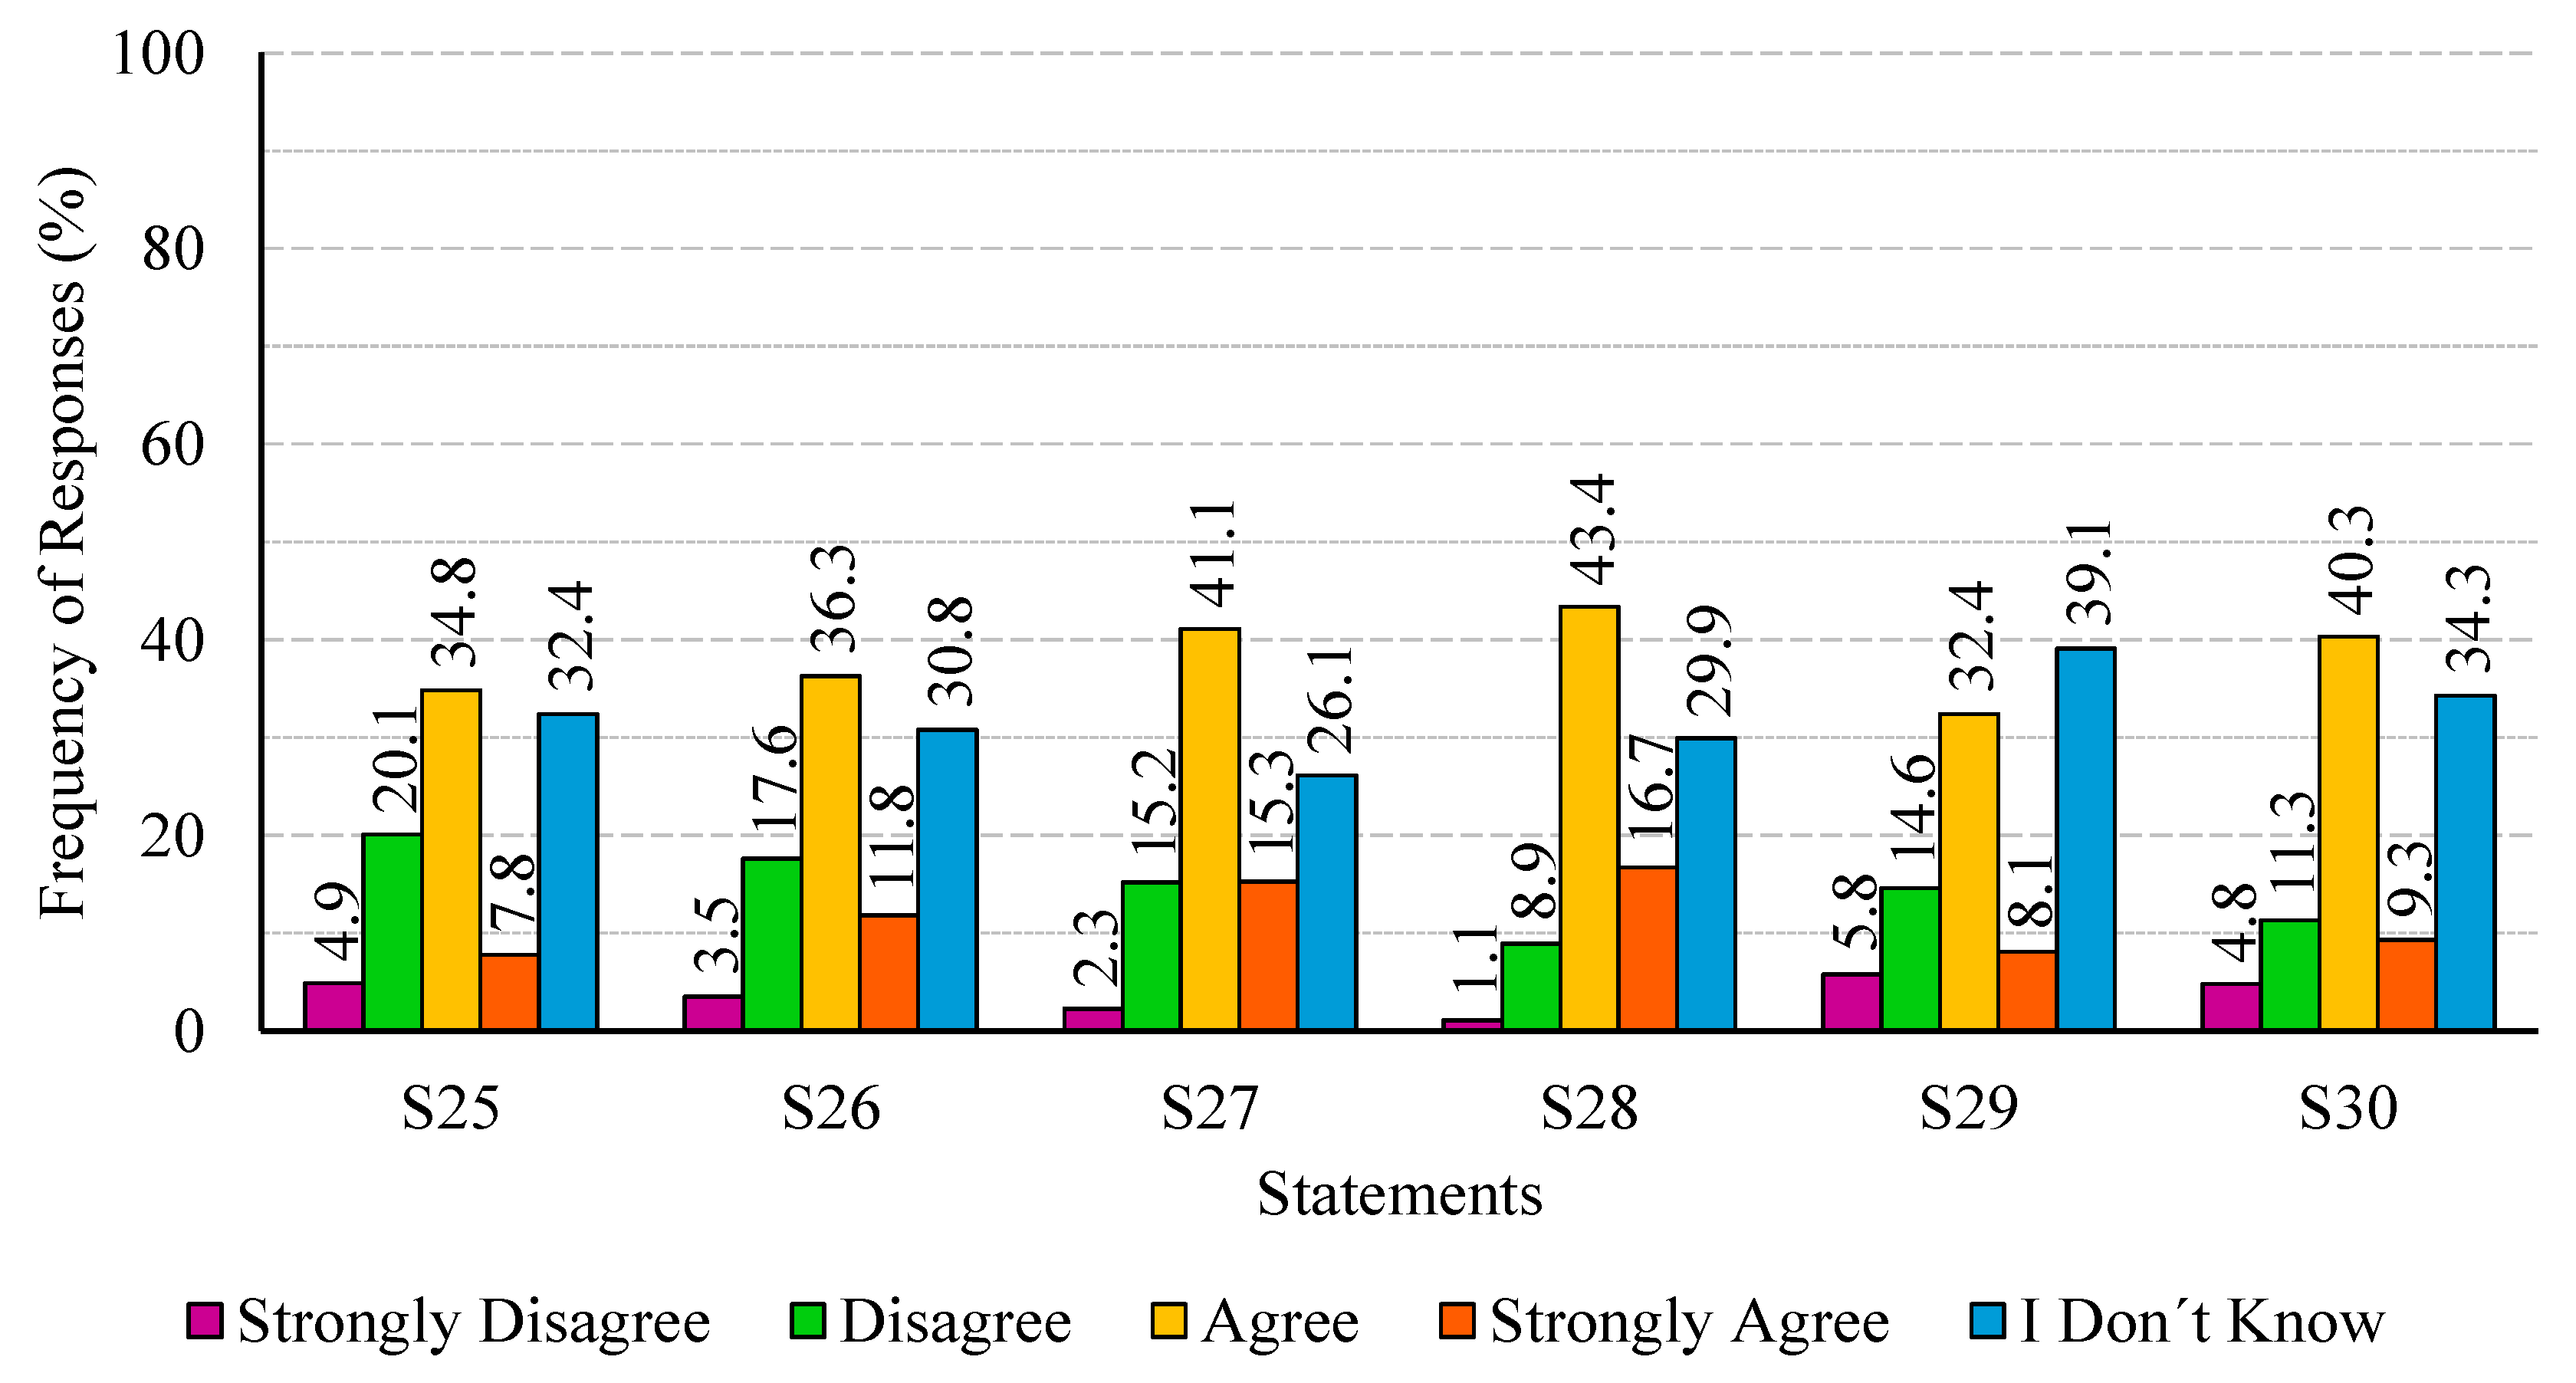
Figure 6 illustrates the distribution of response percentages for statements S25 to S30 (Table 1) concerning water reuse. Across these statements, the agree option was the most prevalent, ranging from 34.8% to 43.4%. However, statement S29 exhibited a distinct trend, with the I don’t know option being the preferred choice, selected by 39.1% of participants. In this topic, the strongly agree option never emerged as the most chosen, with responses percentages ranging from 7.8% and 16.7%. Moreover, it is noteworthy that the strongly disagree option was selected for every statement, although with low response percentages ranging from 1.1% to 5.8%. Similarly, the disagree option was selected for every statement, with response percentages varying from 8.9% to 20.1%. It is also worth noting that the I don’t know option was selected for every statement, with high response percentages, ranging from 26.1% to 39.1%. Therefore, the prevalence of negative responses (strongly disagree/disagree) and I don’t know across all statements on this topic suggests low levels of awareness among participants regarding water reuse issues.

Figure 6.
Distribution of response percentages for statements S25 to S30 regarding water reuse.
From a global perspective, the results presented earlier showed a predominance of positive responses (strongly agree/agree) across the majority of the statements included in the topics of water resources, water quality, water availability, and water saving. These results reveal high levels of awareness of sustainable water usage practices among the study participants. These outcomes align with those described in several studies [10,11,12,13,16,22] and differ from those described by Hussain et al. [19] and Benameur et al. [20] that report a concerning lack of awareness regarding water quality standards.
With respect to water reuse, the findings from this study are in line with those reported by Radzi et al. [14] and Baawain et al. [18] and differ from those reported by Nguyen et al. [17]. However, it must be recognized that the findings of [17] cannot be directly compared with the findings of the present study since, despite water shortages in some areas, Portugal cannot be considered a water-scarce country.
4.2. Influence of Socio-Demographic Factors
To assess how participants’ socio-demographic factors influence the public awareness of sustainable water usage practices, the responses from the second part of the questionnaire were examined autonomously based on gender (Table 3), age group (Table 4), and place of residence (Table 5).
Table 3.
Distribution of response percentages related to the statements included in second part of the questionnaire by topics and gender.
Table 4.
Distribution of response percentages related to the statements included in second part of the questionnaire by topics and age groups.
Table 5.
Distribution of response percentages related to the statements included in second part of the questionnaire by topics and residential area.
Concerning the impact of gender on public awareness of sustainable water usage practices, an examination of Table 3 indicates that the disparity in response frequencies between women and men to the second part of the questionnaire was below 1.5% in the vast majority of responses. However, across all statements, it is noted that the percentage of positive responses (strongly agree/agree) is slightly higher for women, while the opposite is observed for negative responses (strongly disagree/disagree) as well as for the response I don´t know. Only in some responses related to statements included in the water resources topic did this percentage exceed the mentioned value, although not exceeding 2.5%. The statements in which this occurred were statements S2, S3, S5, and S6. This slight tendency of heightened awareness regarding sustainable water usage practices among women aligns with the results of other studies [10,22].
Regarding the impact of age, an examination of Table 4 shows that, generally, the percentage of participants selecting the option I don’t know increases with age group, mainly among those aged 51 to 65 years old and those over 65 years old. In particular, in the statements S2, S3, S7, S9, and S14, the difference among the various age groups exceeds 30%. Conversely, in statements S10, S11, S15, S16, S17, S21, S22, and in all statements within the topic of water reuse, the percentage of participants across different age groups selecting the I don’t know option exhibits variations not exceeding 9%, except in statement S29, where this percentage rises to 17.7%. The results presented in Table 4 also show that the percentage of participants selecting the positive responses (strongly agree/agree) decreases with age group, mainly among those aged from 51 to 65 years old and those over 65 years old. Conversely, the percentage of participants selecting the negative responses (strongly disagree/disagree) increases with increasing age of the group. The mentioned trend was only not observed in statement S23, where the highest percentage of positive responses was obtained in the age group over 65 years old.
The global analysis of Table 4 reveals a slight trend of decreasing positive responses with increasing age, indicating lower awareness of sustainable water usage practices. These findings differ slightly from those reported by other studies, which found that age did not influence awareness of sustainable water usage practices [10,20,23].
In examining Table 5, regarding the impact of residential area on public awareness of sustainable water usage practices, it is observed that the disparity in response frequencies between coastal and interior regions to the second part of the questionnaire was generally below 5%, regardless of participants’ residence area. However, across all statements, a slightly higher percentage of positive responses is noted for coastal regions (including Lisbon and the Tagus Valley region), while the opposite is observed for negative responses (strongly disagree/disagree), as well as for the response I don’t know. In only a few cases did this percentage surpass the mentioned threshold, albeit never exceeding 8.5%. These findings align with those reported by other studies, which found that the residential area did not influence awareness of sustainable water usage practices [10,20].
4.3. Conversion of Non-Quantitative into Quantitative Data
Figure 7 shows the options ticked by the first study participant to the second part of the questionnaire, and displays the quantification process of non-numerical information, which was carried out according to the methodological approach recommended by Fernandes et al. [24]. To demonstrate the methodology employed, the selections made by participant one with regard to statements pertaining to the water quality topic (from S7 to S12) were used. This procedure entailed dividing a circle with a radius of into six sections, with each response option being mapped to a mark on the axis, as illustrated in Figure 7. Across statements 7, 9, 11, and 12, participant one opted for the agree response. The area correspondent to each response was calculated as 0.09, i.e., . In statement 8, participant one opted for strongly agree, resulting in an area of 0.17, calculated as . Finally, selecting the I don’t know option for statement 10 yielded an area of zero. The total quantitative value for statements related to the water quality topic was 0.53, obtained by summing the individual areas. Similar methodologies were employed for other topics, with corresponding results presented in Table 6.
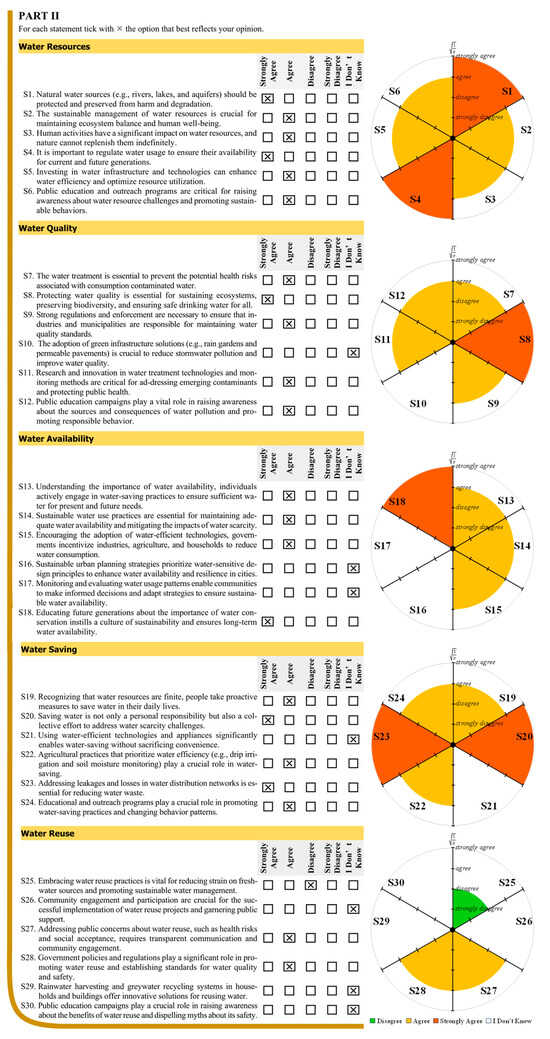
Figure 7.
Participant one’s opinions regarding statements S1 to S30 and an illustrative overview detailing the approach employed to quantify qualitative information.
Table 6.
Subset of the database used to assess the awareness of the Portuguese population on sustainable water usage.
4.4. Overall Analysis of the Participants’ Awareness
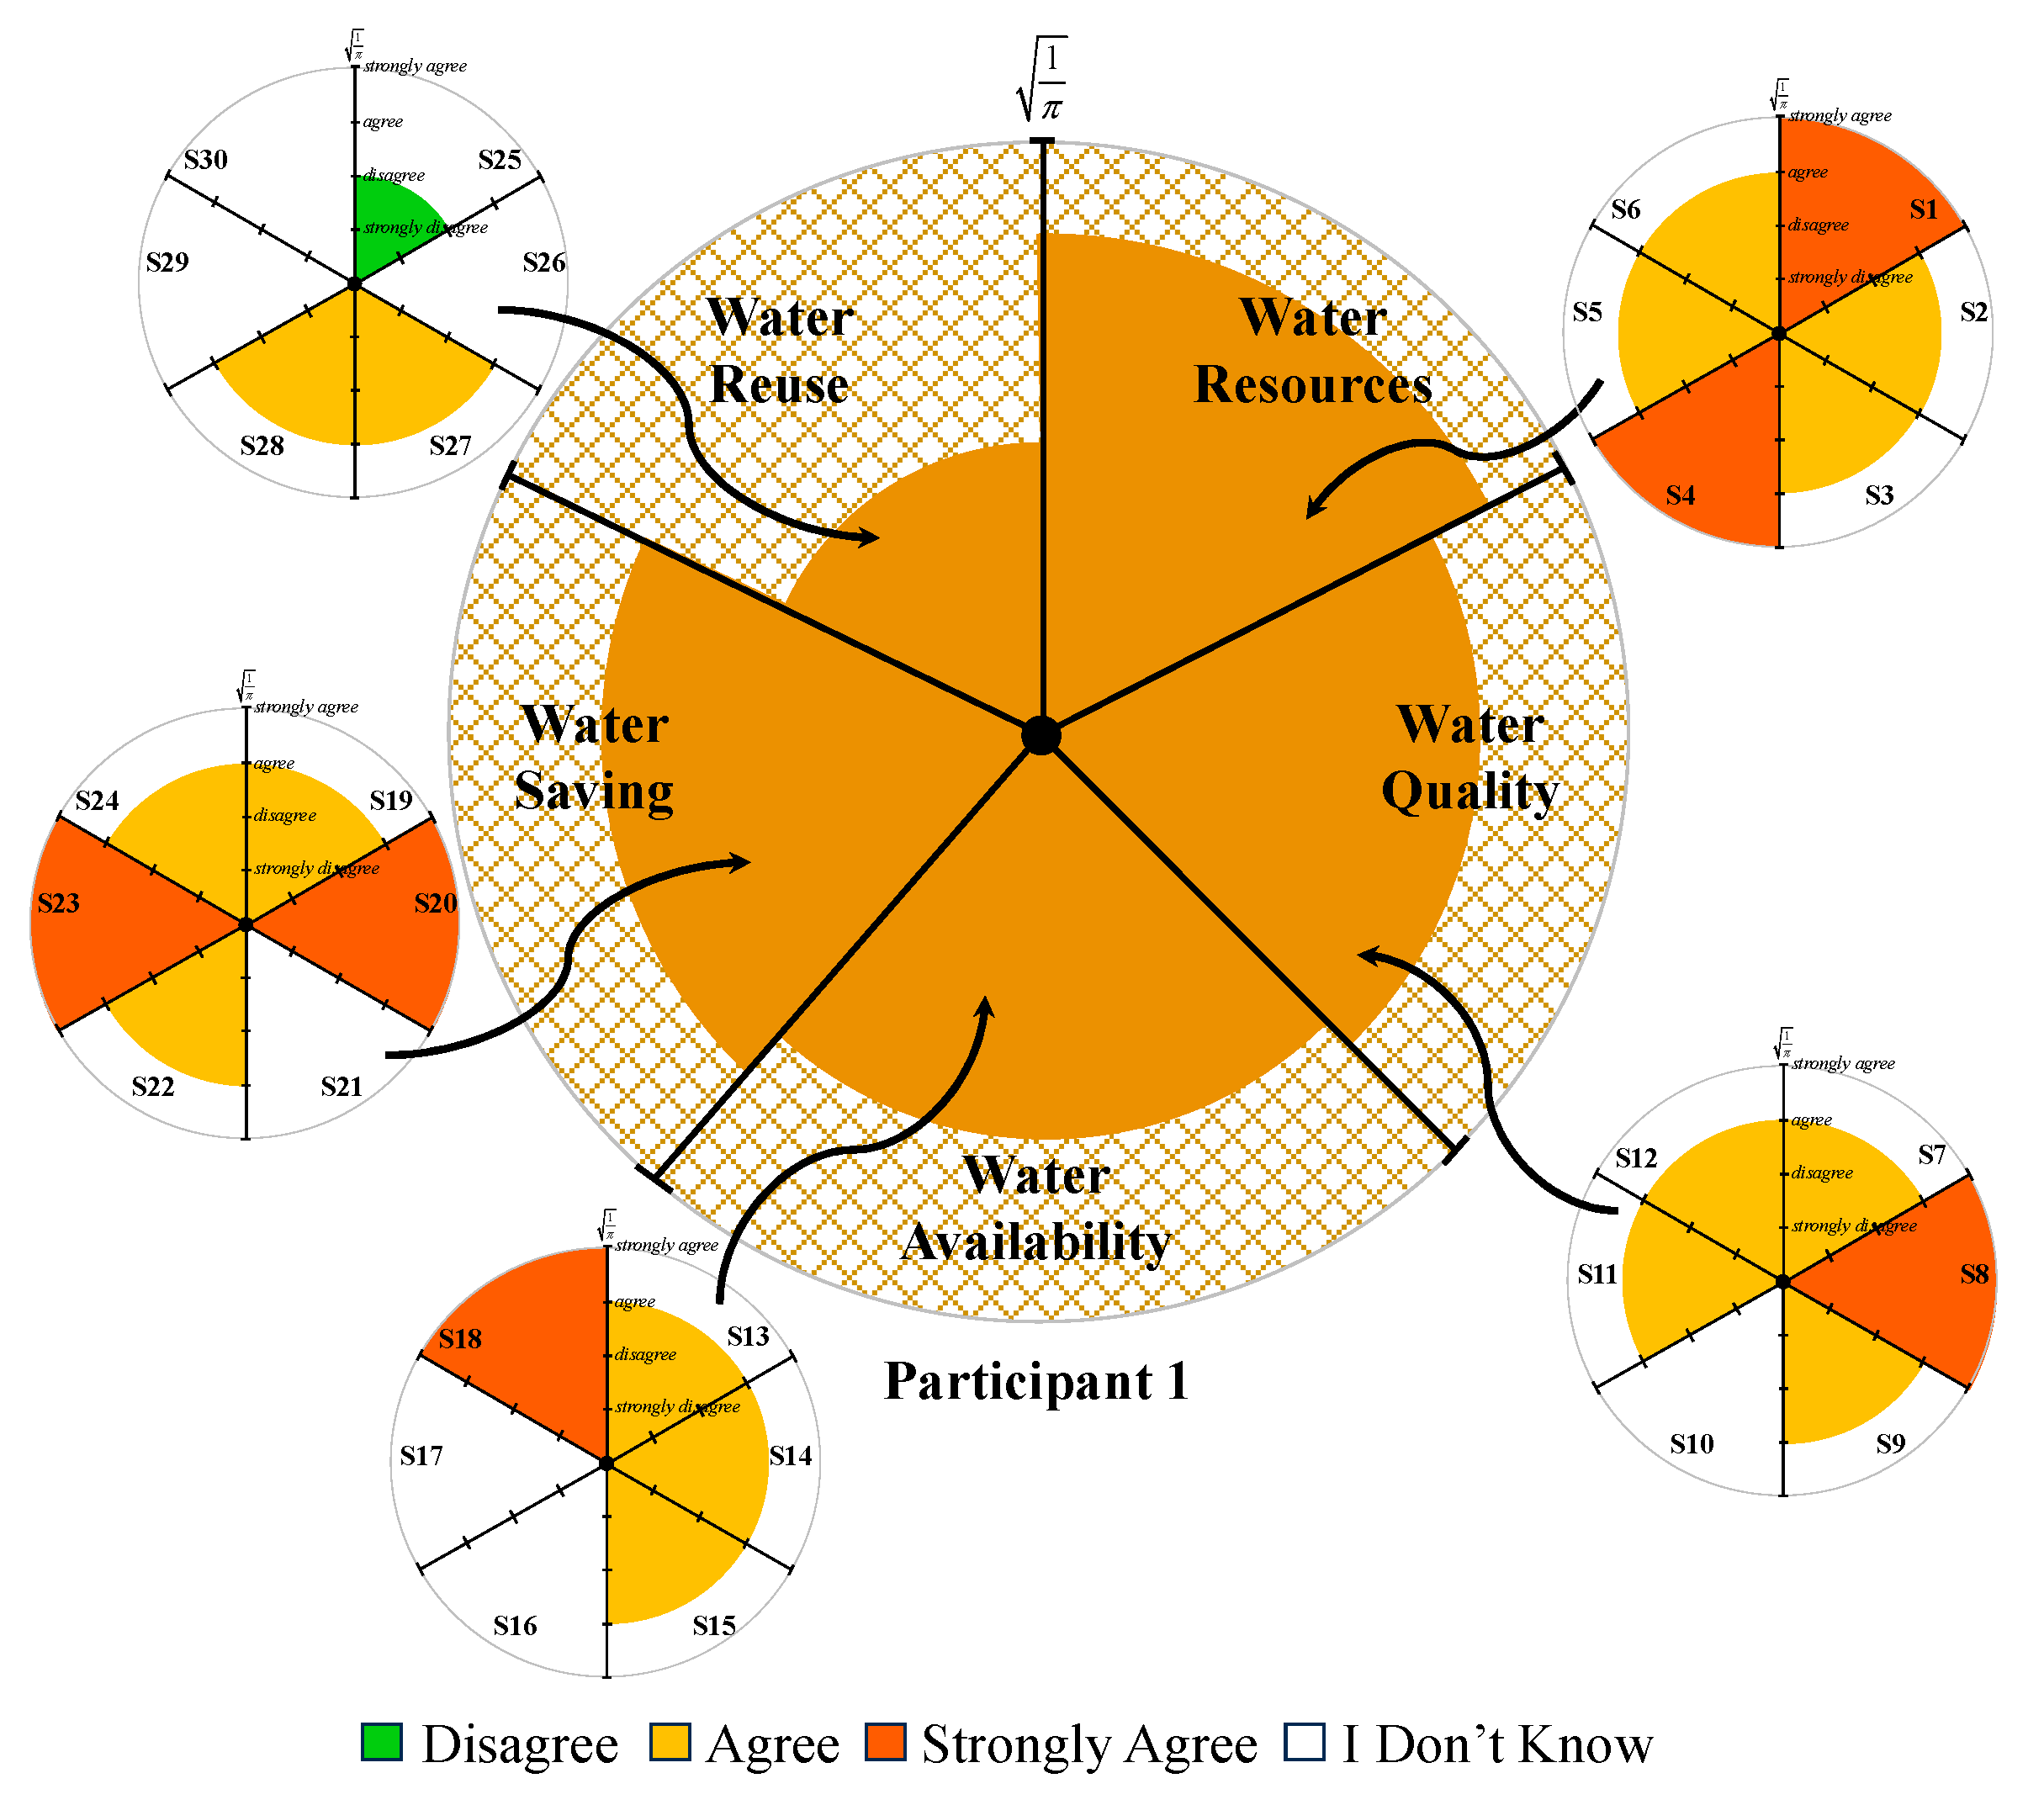
The approach proposed in [24] permitted the translation of qualitative inputs from each participant into quantitative data, as depicted in Figure 7 and Table 6. To conduct a comprehensive analysis of participants’ awareness of sustainable water usage, the data from Table 6 were represented in a circular chart segmented into five sections, each corresponding to one of the topics explored in the latter part of the questionnaire. Figure 8 portrays this procedure for participant one. Given that the values presented in Table 6 were originated from a unitary area circular chart, they were adjusted by dividing them by the number of sections in the new chart (five in this case).
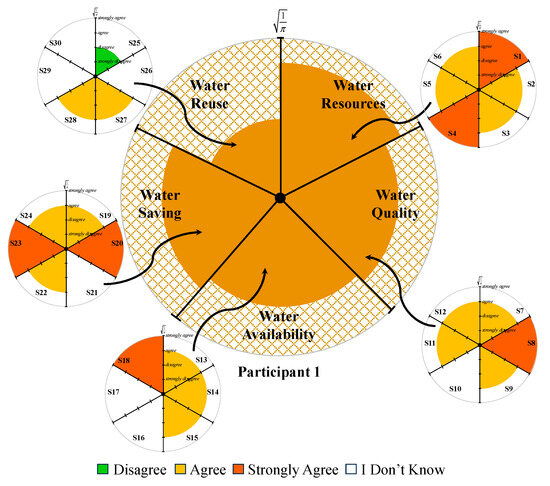
Figure 8.
A graphical summary detailing the approach used in global analysis of participant one’s awareness of sustainable water usage.
Computing participants’ awareness of sustainable water usage as a whole is now possible. For participant one, the overall awareness value is 0.51, calculated by summing the colored regions in Figure 8. Moreover, evaluating the improvement potential of each participant is also feasible. This potential corresponds to the dashed region and is computed as 1 minus the overall awareness. For example, the improvement potential for participant one is 0.49 (i.e., 1 − 0.51).
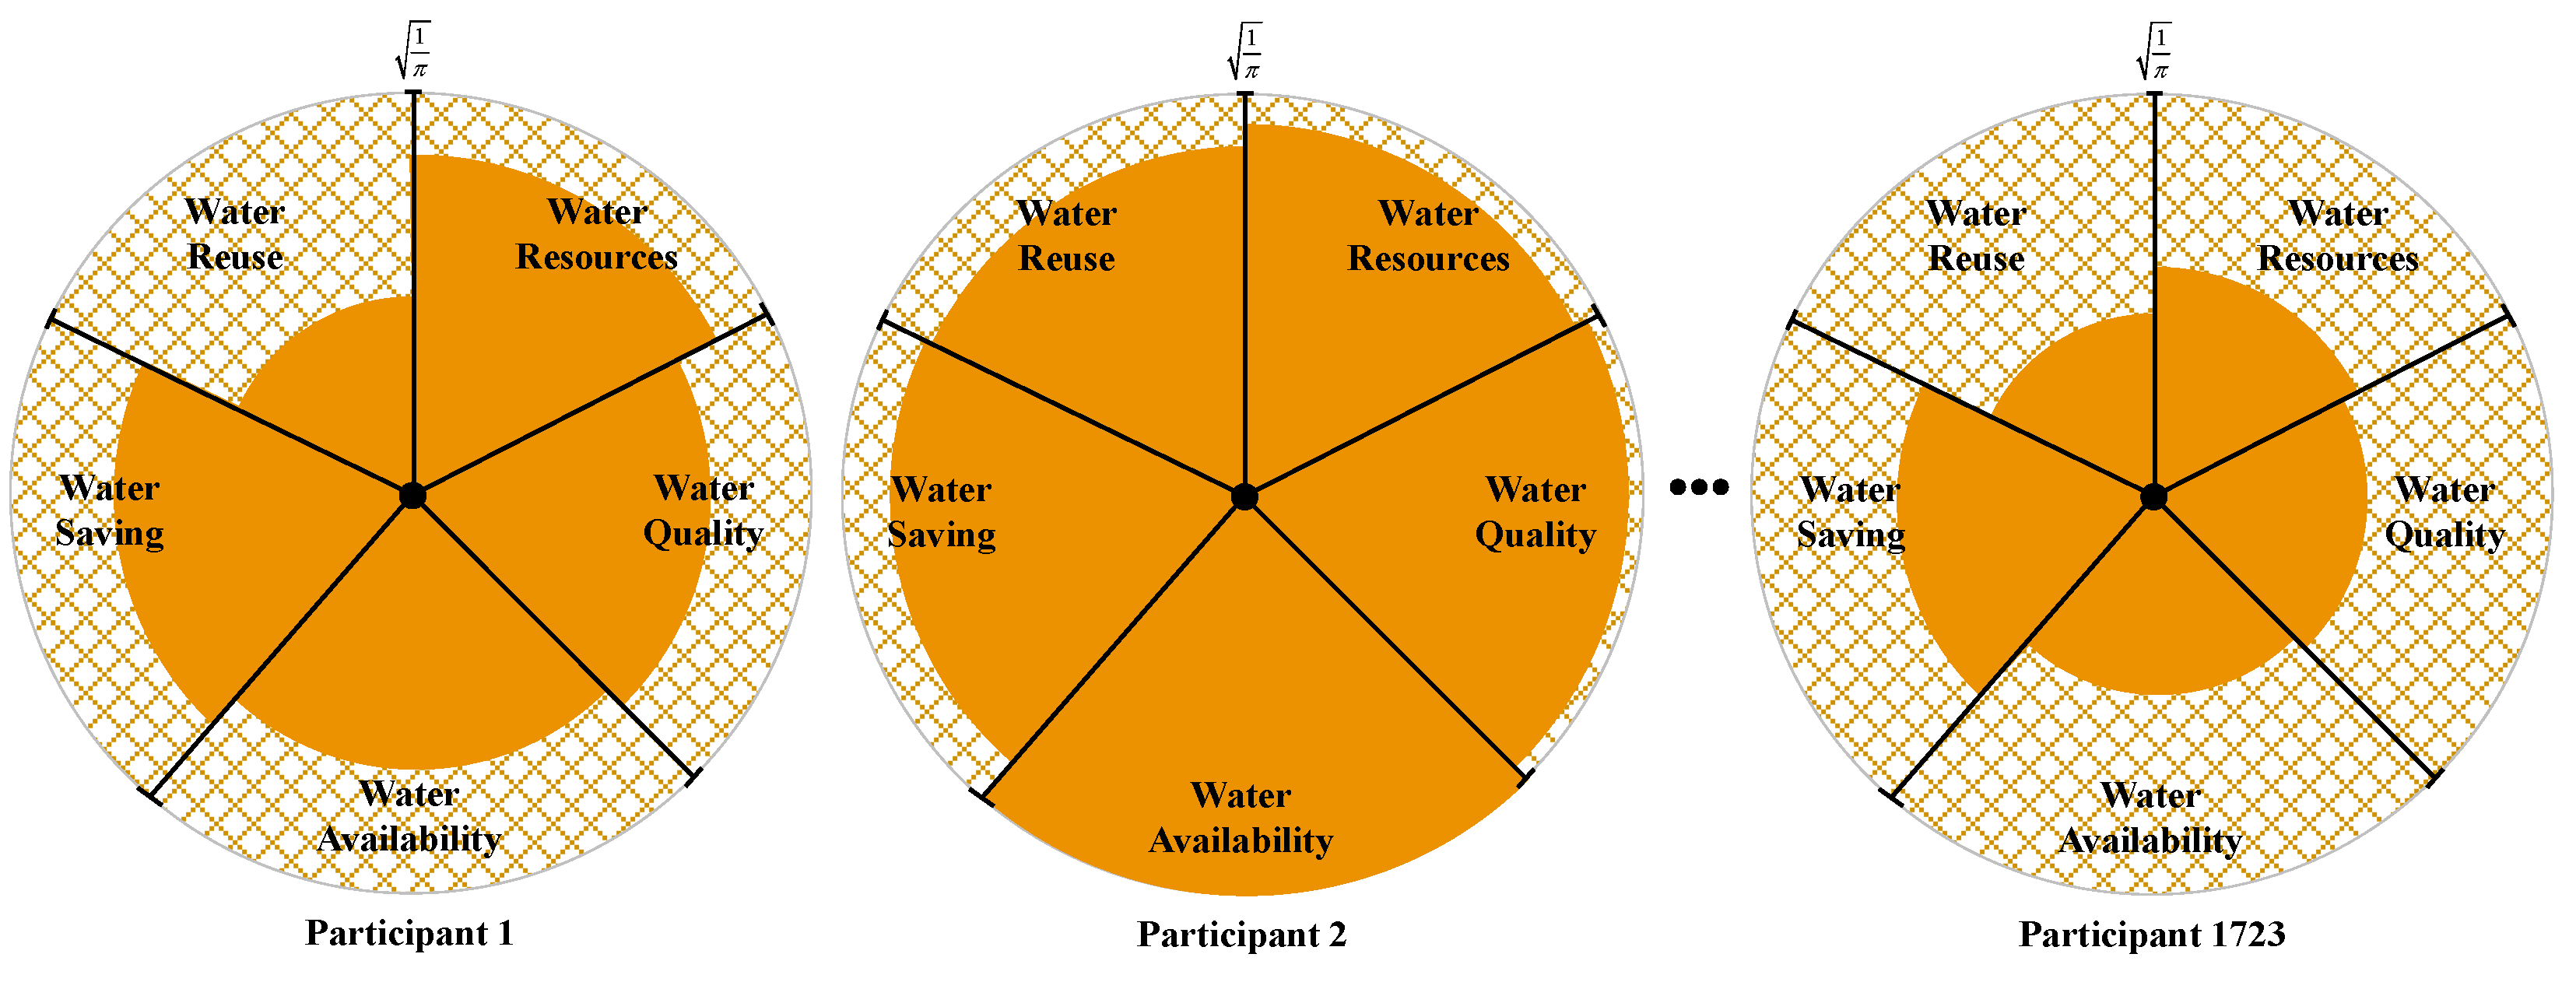
The examination of Figure 8 also aids in identifying areas where participants reveal less awareness regarding sustainable water usage. Participant one, for instance, shows particularly weak awareness in topics concerning water reuse and water availability. Identical procedures are carried out for the other participants, and Figure 9 illustrates the outcomes for the individuals listed in Table 6. The examination of Figure 9 shows that participant two reveals a strong awareness of sustainable water usage, while participant 1723 reveals particularly weak awareness of this issue. This analysis is crucial, underscoring the necessity for tailored intervention strategies. Thus, establishing a database (Table 7) is essential to characterize a particular population, enabling the creation of groups with similar characteristics. Using these characteristics, it becomes feasible to outline personalized intervention approaches for each group, aimed at improving the population’s awareness of sustainable water usage.
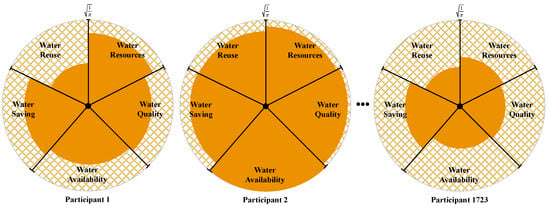
Figure 9.
Graphical representation of awareness regarding sustainable water usage for participants listed in Table 6.
Table 7.
A segment extracted from the database aimed at enhancing awareness of sustainable water usage.
5. Conclusions
This study assessed the Portuguese population’s awareness of sustainable water usage practices across diverse topics such as water resources, water quality, water availability, water saving, and water reuse. The findings from this study indicate a predominance of positive responses (strongly agree/agree) across the majority of the statements included in the topics of water resources, water quality, water availability, and water saving. These results reveal high levels of awareness of sustainable water usage practices among the study participants. However, the outcomes also reveal that a considerable percentage of participants are unfamiliar with some matters concerning the utilization of the green infrastructure solutions (e.g., rain gardens and permeable pavements), research and innovation in water treatment technologies and monitoring methods, adoption of water-efficient technologies, sustainable urban planning strategies, monitoring and evaluating of water usage patterns, and use of water-efficient technologies and appliances. Regarding the topic of water reuse, the study findings reveal a predominance of negative responses (strongly disagree/disagree) or expressions of uncertainty (I don’t know), indicating low levels of awareness about this subject. The analysis of the influence of socio-demographic characteristics shows that awareness of sustainable water usage practices is slightly higher for women and lower for older age groups. Regarding residential area, it is observed that this factor did not influence the awareness of sustainable water usage practices. Additionally, this study presents a novel approach to assess the overall awareness of the Portuguese population regarding sustainable water usage practices and evaluate its potential for improvement. These assessments are crucial for informing communication strategies, expanding educational initiatives, and dispelling misunderstandings or misinformation, all aimed at enhancing public awareness of sustainable water usage practices.
Author Contributions
Conceptualization, M.F., A.F. and H.V.; methodology, M.F., A.F. and H.V.; software, J.N. and H.V.; validation, M.F., A.F. and H.V.; formal analysis, M.F. and H.V.; investigation, M.F., A.F. and H.V.; writing—original draft preparation, M.F., A.F. and H.V.; writing—review and editing, H.V., J.N. and M.F.; visualization, H.V. and M.F. All authors have read and agreed to the published version of the manuscript.
Funding
This research was funded by PT national funds (FCT/MCTES, Fundação para a Ciência e Tecnologia and Ministério da Ciência, Tecnologia e Ensino Superior) through the projects UIDB/50006/2020 and UIDP/50006/2020.
Informed Consent Statement
Informed consent was obtained from all subjects involved in the study.
Data Availability Statement
The original contributions presented in the study are included in the article, further inquiries can be directed to the corresponding author.
Conflicts of Interest
The authors declare no conflicts of interest.
References
- Caretta, M.A.; Mukherji, A.; Arfanuzzaman, M.; Betts, R.A.; Gelfan, A.; Hirabayashi, Y.; Lissner, T.K.; Lopez-Gunn, E.; Liu, J.; Morgan, R.; et al. Water. In Climate Change 2022: Impacts, Adaptation and Vulnerability—Contribution of Working Group II to the Sixth Assessment Report of the Intergovernmental Panel on Climate Change; Pörtner, H.-O., Roberts, D.C., Tignor, M., Poloczanska, E.S., Mintenbeck, K., Alegría, A., Craig, M., Langsdorf, S., Löschke, S., Möller, V., et al., Eds.; Cambridge University Press: Cambridge, UK, 2022; pp. 551–712. [Google Scholar] [CrossRef]
- United Nations. The United Nations World Water Development Report 2023: Partnerships and Cooperation for Water; UNESCO: Paris, France, 2023; Available online: https://unesdoc.unesco.org/ark:/48223/pf0000384655 (accessed on 18 May 2024).
- United Nations General Assembly. Transforming Our World: The 2030 Agenda for Sustainable Development; A/RES/70/1. 21 October 2015. Available online: https://www.refworld.org/legal/resolution/unga/2015/en/111816 (accessed on 18 May 2024).
- World Meteorological Organization. State of Climatic Services—Water; World Meteorological Organization Edition: Geneva, Switzerland, 2021; Available online: https://library.wmo.int/viewer/57630/download?file=1278_en.pdf&type=pdf&navigator=1 (accessed on 18 May 2024).
- Lamastra, L.; Suciu, A.N.; Novelli, E.; Trevisan, M. A new approach to assessing the water footprint of wine: An Italian case study. Sci. Total Environ. 2013, 490, 748–756. [Google Scholar] [CrossRef] [PubMed]
- Paulo, A.A.; Rosa, R.D.; Pereira, L.S. Climate trends and behaviour of drought indices based on precipitation and evapotranspiration in Portugal. Nat. Hazards Earth Syst. Sci. 2012, 12, 1481–1491. [Google Scholar] [CrossRef]
- Costa, J.M.; Oliveira, M.; Egipto, R.J.; Cid, J.F.; Fragoso, R.A.; Lopes, C.M.; Duarte, E.N. Water and wastewater management for sustainable viticulture and oenology in south Portugal—A review. Ciência Téc. Vitiv. 2020, 35, 1–15. [Google Scholar] [CrossRef]
- Sihvonen, S.; Partanen, J. Implementing environmental considerations within product development practices: A survey on employees’ perspectives. J. Clean. Prod. 2016, 125, 189–203. [Google Scholar] [CrossRef]
- Lundin, M.; Morrison, G.M. A life cycle assessment based procedure for development of environmental sustainability indicators for urban water systems. Urban Water 2002, 4, 145–152. [Google Scholar] [CrossRef]
- Aydoğdu, B.; Çakır, A. An investigation of middle school students’ attitudes and awareness of water use. Int. J. Environ. Educ. 2016, 11, 9520–9536. [Google Scholar]
- Hashim, M.; Amran, A.; Mahat, H.; Norkhaidi, S.B.; Nayan, N.; Saleh, Y. Water Resources Sustainability Awareness among Upper School Students in Malaysia. Malays. J. Trop. Geogr. 2021, 47, 1–11. [Google Scholar]
- Gohwong, S.; Waennin, S.; Pinprasong, P.; Sanamthong, N.; Phengphol, A.; Phetnuam, F.; Jinsawad, K.; Ninlert, C.; Mayachiew, N.; Tummavichit, W.; et al. Sustainable Water Usage Awareness among Undergraduate Students. Procedia Multidiscip. Res. 2024, 2, 24. [Google Scholar]
- Augustine, E.E.; Hanafiah, M.M. Awareness level of water resource conservation of university students. Water Conserv. Manag. 2019, 3, 18–21. [Google Scholar] [CrossRef]
- Radzi, S.F.M.; Hassan, M.S.; Ibrahim, N.I.; Lek, L.; Ming, Y.C.Y.; Kamal, F.N.M.; Razali, N.M.; Annisa, K.; Zain, S.M.; Ali, S.M.; et al. Water Sustainability: Water Usage Audit and Conservation Awareness among Students in Universiti Sains Malaysia. Int. J. Acad. Res. Progress. Educ. Dev. 2019, 8, 457–471. [Google Scholar] [CrossRef] [PubMed]
- Cankaya, C.; Iscen, C.F. Development of pre-service science teachers’ awareness of sustainable water use. Educ. Res. Rev. 2015, 10, 471–484. [Google Scholar] [CrossRef]
- Hunt, D.V.L.; Shahab, Z. Sustainable Water Use Practices: Understanding and Awareness of Masters Level Students. Sustainability 2021, 13, 10499. [Google Scholar] [CrossRef]
- Nguyen, M.-H.; Doan, D.M.; Dong, H.K.; Nguyen, V.T.; Dao, H.H.; Trinh, D.D.; Nguyen, N.T.; Kieu, K.N.; Le, N.Q.T.; Hoang, H.T.T.; et al. Effects of water scarcity awareness and climate change belief on recycled water usage willingness: Evidence from New Mexico, United States. VMOST J. Soc. Sci. Humanit. 2024, 66, 62–75. [Google Scholar] [CrossRef] [PubMed]
- Baawain, M.S.; Al-Mamun, A.; Omidvarborna, H.; Al-Sabti, A.; Choudri, B.S. Public perceptions of reusing treated wastewater for urban and industrial applications: Challenges and opportunities. Environ. Dev. Sustain. 2020, 22, 1859–1871. [Google Scholar] [CrossRef]
- Hussain, I.; Hayat, W.; Gong, S.; Yang, X.; Lai, W.-F. A Comparative Analysis of Public Awareness Level about Drinking Water Quality in Guangzhou (China) and Karachi (Pakistan). Sustainability 2023, 15, 8408. [Google Scholar] [CrossRef]
- Benameur, T.; Benameur, N.; Saidi, N.; Tartag, S.; Sayad, H.; Agouni, A. Predicting factors of public awareness and perception about the quality, safety of drinking water, and pollution incidents. Environ. Monit. Assess. 2022, 194, 22. [Google Scholar] [CrossRef] [PubMed]
- Nasir, F.A.M.; Praveena, S.M.; Aris, A.Z. Public awareness level and occurrence of pharmaceutical residues in drinking water with potential health risk: A study from Kajang (Malaysia). Ecotoxicol. Environ. Saf. 2019, 185, 109681. [Google Scholar] [CrossRef] [PubMed]
- Tong, Y.; Fan, L.; Niu, H. Water conservation awareness and practices in households receiving improved water supply: A gender-based analysis. J. Clean. Prod. 2017, 141, 947–955. [Google Scholar] [CrossRef]
- Mustafa, S.; Jamil, K.; Zhang, L.; Girmay, M.B. Does Public Awareness Matter to Achieve the UN’s Sustainable Development Goal 6: Clean Water for Everyone? J. Environ. Public Health 2022, 2022, 8445890. [Google Scholar] [CrossRef] [PubMed]
- Fernandes, A.; Vicente, H.; Figueiredo, M.; Neves, M.; Neves, J. An evaluative model to assess the organizational efficiency in training corporations. In Future Data and Security Engineering; Lecture Notes in Computer Science; Dang, T., Wagner, R., Küng, J., Thoai, N., Takizawa, M., Neuhold, E., Eds.; Springer: Cham, Switzerland, 2016; Volume 10018, pp. 415–428. [Google Scholar] [CrossRef]
- Cohen, L.; Manion, L.; Morrison, K. Research Methods in Education, 8th ed.; Routledge: New York, NY, USA, 2017. [Google Scholar]
- DeKetele, J.-M.; Roegiers, X. Méthodologie du Recueil d’Informations: Fondements des Méthodes d’Observation, de Questionnaire, d’Interview et d’Études de Documents, 5th ed.; DeBoeck Universite: Paris, France, 2016. [Google Scholar]
- Patton, M.Q. Qualitative Research and Evaluation Methods: Integrating Theory and Practice, 4th ed.; SAGE Publications Inc: Thousand Oaks, CA, USA, 2015. [Google Scholar]
- McMillan, J.; Schumacher, S. Research in Education: Evidence-Based Inquiry, 7th ed.; Prentice Hall: New York, NY, USA, 2009. [Google Scholar]
- Bell, J. Doing Your Research Project: A Guide for First-Time Researchers in Education, Health and Social Science, 5th ed.; Open University Press: Maidenhead, UK, 2010. [Google Scholar]

Disclaimer/Publisher’s Note: The statements, opinions and data contained in all publications are solely those of the individual author(s) and contributor(s) and not of MDPI and/or the editor(s). MDPI and/or the editor(s) disclaim responsibility for any injury to people or property resulting from any ideas, methods, instructions or products referred to in the content. |
© 2024 by the authors. Licensee MDPI, Basel, Switzerland. This article is an open access article distributed under the terms and conditions of the Creative Commons Attribution (CC BY) license (https://creativecommons.org/licenses/by/4.0/).