
The Use of Normative Energy Calculation beyond the Optimum Retrofit Solutions in Primary Design: A Case Study of Existing Buildings on a Campus
 ,
,  , and
, and
Abstract
1. Introduction
1.1. Performance-Driven Architectural Design
1.2. Application Feasibility of the Normative Energy Calculation in Building Performance Prediction
2. Methodology
2.1. Building Prototype
2.2. Shading Analysis
2.3. Data Optimization
- The non-weighted method: It calculated the average of all four sets of comparisons throughout the whole year.
- The weighted method: It calculated the average value of the differences multiplied by the established weights. This formulation is convenient because it enables the user to consider impact weights for the building data. This is performed on a monthly basis for each set of building data. Whenever weight is specified as zero, it means that the respective set or the respective month is not considered in the calibration process. The range of variation of the weights is defined in the maximum and minimum weight cells.
If there is district heating (user decision), then Hdi = 1 ELSE Hdi = 0.
If there is a district cooling source, then Cdi = 1 ELSE Cdi = 0.
2.4. Scenarios and Criteria
3. Results
3.1. Shading Analysis
3.2. Data Optimization
3.3. Renovation Strategy Ranking and Primary Design Scheme
4. Discussion
4.1. Limitations and Effects on the EPC Calculation
4.2. Discussion on Performance-Driven Architectural Design and Its Theory and Ethics
5. Conclusions
Author Contributions
Funding
Informed Consent Statement
Data Availability Statement
Acknowledgments
Conflicts of Interest
References
- He, Q.; Ng, S.T.; Hossain, M.U.; Augenbroe, G.L. A Data-driven Approach for Sustainable Building Retrofit—A Case Study of Different Climate Zones in China. Sustainability 2020, 12, 4726. [Google Scholar] [CrossRef]
- Liu, Q.; Wang, Z. Green BIM-based study on the green performance of university buildings in northern China. Energy Sustain. Soc. 2022, 12, 12. [Google Scholar] [CrossRef]
- Valks, B.; Arkesteijn, M.H.; Koutamanis, A.; den Heijer, A.C. Towards a smart campus: Supporting campus decisions with Internet of Things applications. Build. Res. Inf. 2021, 49, 1–20. [Google Scholar] [CrossRef]
- Cao, X.-Y.; Shen, D.; Feng, D.-C.; Wang, C.-L.; Qu, Z.; Wu, G. Seismic retrofitting of existing frame buildings through externally attached sub-structures: State of the art review and future perspectives. J. Build. Eng. 2022, 57, 104904. [Google Scholar] [CrossRef]
- Huang, C.; Zhang, G.; Yao, J.; Wang, X.; Calautit, J.K.; Zhao, C.; An, N.; Peng, X. Accelerated environmental performance-driven urban design with generative adversarial network. Build. Environ. 2022, 224, 109575. [Google Scholar] [CrossRef]
- Shi, X. Design optimization of insulation usage and space conditioning load using energy simulation and genetic algorithm. Energy 2011, 36, 1659–1667. [Google Scholar] [CrossRef]
- Yuan, P.F.; Song, Y.; Lin, Y.; Beh, H.S.; Chao, Y.; Xiao, T.; Huang, S.; Zheng, J.; Wu, Z. An architectural building cluster morphology generation method to perceive, derive, and form based on cyborg-physical wind tunnel (CPWT). Build. Environ. 2021, 203, 108045. [Google Scholar] [CrossRef]
- Li, Z.; Chen, H.; Lin, B.; Zhu, Y. Fast bidirectional building performance optimization at the early design stage. Build. Simul. 2018, 11, 647–661. [Google Scholar] [CrossRef]
- Purup, P.B.; Petersen, S. Research framework for development of building performance simulation tools for early design stages. Autom. Constr. 2020, 109, 102966. [Google Scholar] [CrossRef]
- Lu, W.S.; Fung, A.; Peng, Y.; Liang, C.; Rowlinson, S. Cost-benefit analysis of Building Information Modeling implementation in building projects through demystification of time-effort distribution curves. Build. Environ. 2014, 82, 317–327. [Google Scholar] [CrossRef]
- Chang, S.; Saha, N.; Castro-Lacouture, D.; Yang, P.P.-J. Multivariate relationships between campus design parameters and energy performance using reinforcement learning and parametric modeling. Appl. Energy 2019, 249, 253–264. [Google Scholar] [CrossRef]
- Kastner, P.; Dogan, T. Eddy3D: A toolkit for decoupled outdoor thermal comfort simulations in urban areas. Build. Environ. 2022, 212, 108639. [Google Scholar] [CrossRef]
- Pak, M.; Smith, A.; Gill, G. Ladybug: A Parametric Environmental Plugin for Grasshopper to Help Designers Create an Environmentally-Conscious Design. In Proceedings of the 13th Conference of International Building Performance Simulation Association, Chambery, France, 25–28 August 2013. [Google Scholar]
- Augenbroe, G.; Park, C.-S. Quantification methods of technical building performance. Build. Res. Inf. Int. J. Res. Dev. Demonstr. 2005, 33, 159–172. [Google Scholar] [CrossRef]
- Lee, B.D.; Sun, Y.; Augenbroe, G.; Paredis, C.J.J. Towards Better Prediction Of Building Performance: A Workbench To Analyze Uncertainty In Building Simulation. In Proceedings of the 13th Conference of International Building Performance Simulation Association, Chambery, France, 25–28 August 2013. [Google Scholar]
- Byrne, J.; Fenton, M.; Hemberg, E.; McDermott, J.; O’Neill, M.; Shotton, E.; McNally, C. Combining Structural Analysis and Multi-Objective Criteria for Evolutionary Architectural Design; Springer: Berlin/Heidelberg, Germany, 2011; Volume 6625, pp. 204–213. [Google Scholar]
- de Souza, C.B. Contrasting paradigms of design thinking: The building thermal simulation tool user vs. the building designer. Autom. Constr. 2012, 22, 112–122. [Google Scholar] [CrossRef]
- de Wit, S.; Augenbroe, G. Analysis of uncertainty in building design evaluations and its implications. Energy Build. 2002, 34, 951–958. [Google Scholar] [CrossRef]
- Heo, Y. Bayesian Calibration of Building Energy Models for Energy Retrofit Decision-Making under Uncertainty; Georgia Institute of Technology: Atlanta, GA, USA, 2011. [Google Scholar]
- Clarke, J.A.; Johnstone, C.M.; Kondratenko, I.; Lever, M.; McElroy, L.B.; Prazeres, L.; Strachan, P.A.; McKenzie, F.; Peart, G. Using simulation to formulate domestic sector upgrading strategies for Scotland. Energy Build. 2004, 36, 759–770. [Google Scholar] [CrossRef]
- EN ISO 52016-1:2021; Energy performance of buildings—Energy needs for heating and cooling, internal temperatures and sensible and latent heat loads-Part 1: Calculation procedures. European Committee for Standardization (CEN): Brussels, Belgium, 2021.
- Gangolells, M.; Casals, M.; Forcada, N.; Macarulla, M.; Cuerva, E. Energy mapping of existing building stock in Spain. J. Clean. Prod. 2016, 112, 3895–3904. [Google Scholar] [CrossRef]
- Hopfe, C.J.; Augenbroe, G.; Hensen, J.L.M. Multi-criteria decision making under uncertainty in building performance assessment. Build. Environ. 2013, 69, 81–90. [Google Scholar] [CrossRef]
- Sirén, K.; Hasan, A. Comparison of two calculation methods used to estimate cooling energy demand and indoor summer temperatures. In Proceedings of the Clima 2007 WellBeing Indoors, Helsinki, Finland, 10–14 June 2007; pp. 10–14. [Google Scholar]
- Burhenne, S.; Jacob, D. Simulation models to optimize the energy consumption of buildings. In Proceedings of the Eighth International Conference for Enhanced Building Operations, Berlin, Germany, 20–22 October 2008. [Google Scholar]
- Hopfe, C.J. Uncertainty and Sensitivity Analysis in Building Performance Simulation for Decision Support and Design Optimization. Ph.D. Dissertation, Eindhoven University, Eindhoven, The Netherlands, 2009. [Google Scholar]
- Kokogiannakis, G.; Strachan, P. Modelling of double ventilated facades according to CEN Standard 13,790 method and detailed simulation. In Proceedings of the Building Low Energy Cooling and Advanced Ventilation Technologies in the 21st Century, 2nd Palenc Conference and 28th AIVC Conference, Heliotopos Conferences, Crete, Greece, 27–29 September 2007. [Google Scholar]
- Lee, S.H.; Zhao, F.; Augenbroe, G. The use of normative energy calculation beyond building performance rating. J. Build. Perform. Simul. 2013, 6, 282–292. [Google Scholar] [CrossRef]
- Kim, J.H.; Augenbroe, G.; Suh, H.-S. Comparative Study of The Leed And Iso-cen Building Energy Performance Rating Methods. In Proceedings of the 13th Conference of International Building Performance Simulation Association, Chambery, France, 25–28 August 2013. [Google Scholar]
- Gonzalez-Caceres, A.; Karlshøj, J.; Arvid Vik, T.; Hempel, E.; Rammer Nielsen, T. Evaluation of cost-effective measures for the renovation of existing dwellings in the framework of the energy certification system: A case study in Norway. Energy Build. 2022, 264, 112071. [Google Scholar] [CrossRef]
- Li, T.; Shao, G.; Zuo, W.; Huang, S. Genetic algorithm for building optimization: State-of-the-art survey. In Proceedings of the 9th International Conference on Machine Learning and Computing, Singapore, 24–26 February 2017; pp. 205–210. [Google Scholar]
- ASHRAE 90.1-2019; Energy Standard for Buildings Except Low-Rise Residential Buildings. American Society of Heating, Refrigerating and Air-Conditioning Engineers (ASHRAE): Atlanta, GA, USA, 2019.
- ASHRAE 90.1-2016; Energy Standard for Buildings Except Low-Rise Residential Buildings. American Society of Heating, Refrigerating and Air-Conditioning Engineers (ASHRAE): Atlanta, GA, USA, 2016.
- IES Lighting Handbook: The Standard Lighting Guide; Illuminating Engineering Society (IES): New York, NY, USA, 2011.
- R.S. Means. Facilities Maintenance & Repair Cost Data; R.S. Means: Norwell, MA, USA, 2021. [Google Scholar]
- R.S. Means. Facilities Maintenance & Repair Cost Data; R.S. Means Company: Kingston, MA, USA, 2009. [Google Scholar]
- R.S. Means. Facilities Maintenance & Repair Cost Data; R.S. Means Company: Kingston, MA, USA, 2010. [Google Scholar]


| Building Total Ventilated Volume [m3] | Building Height [m] | Envelope Heat Capacity [J/K] | Cooling System Full Load COP | Material | |||
|---|---|---|---|---|---|---|---|
| Roof U-Value [W/m2/K] | Opaque U-Value [W/m2/K] | Window U-Value [W/m2/K] | SHGC | ||||
| 9083.00 | 13.80 | Medium: 165,000*Af | 4.10 | 0.45 | 0.70 | 2.67 | 0.20 |
| Climate Zone | Representative City | Main Building Design Information | |||||||
|---|---|---|---|---|---|---|---|---|---|
| General Geometry | Envelope Heat Capacity (J/K) | Building Energy Management System | Temperature Setpoint [°C] | ||||||
| 3A, ASHRAE Standard | Atlanta | Volume [m3] | Wall [m2] | Window [m2] | Window Overhang Direction and Angle [degrees] | Heavy (260,000*Af) | No building automation function | For heating | For cooling |
| 14,000 | 1650 | 390 | SW (30) | 21 | 24 | ||||
| Inputs | Variable Limits | Reference | ||
|---|---|---|---|---|
| Parameter | Unit | Minimum | Maximum | |
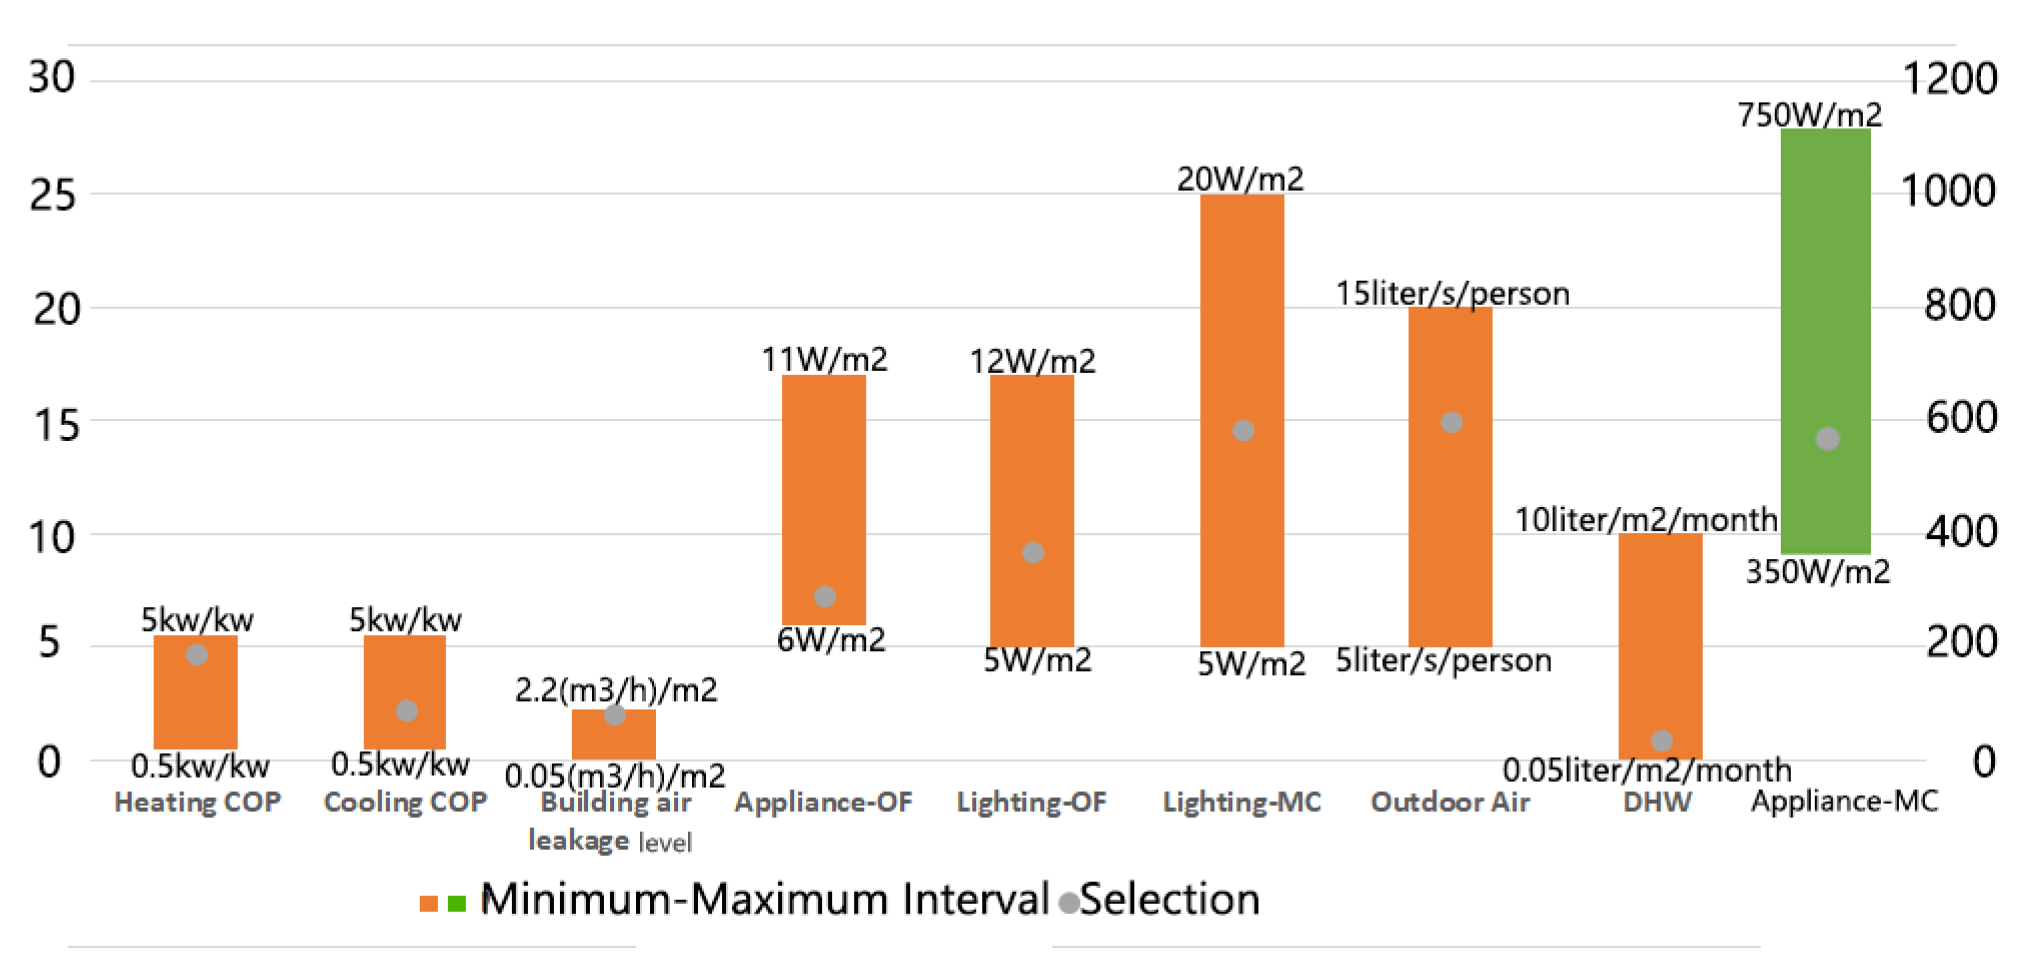
| Heating COP | kW/kW | 0.5 | 5 | Based on the typical VAV cooling system general values |
| Cooling COP | kW/kW | 0.5 | 5 | |
| Building air leakage level | (m3/h)/m2 | 0.05 | 2.2 | Building air leakage level and ASHRAE 90.1-2019: B2 Compliance [32] |
| Appliance-OF | W/m2 | 6 | 11 | For the light-weight partition interior, considering 200–250 W/m2 equal to 1 computer/m2, thus, we gave a range 1–100 for office rooms; 30–750 for serves rooms |
| Lighting-OF | W/m2 | 5 | 12 | A standard official open-plan consists of three-lamp luminaires spaced is set at 8 ft. × 10 ft. (2.4 m × 3 m) (Lighting and Standard 90.1-ASHRAE) Older technologies of T12 lamps and magnetic ballasts will result in an LPD range of 1.2 to1.4 W/ft2 (12.9 to15 W/m2), which exceeds the maximum of 1 W/ft2 (10.8 W/m2) allowed under the ASHRAE 90.1-2016 [33] |
| Appliance-MC | W/m2 | 350 | 750 | ASHRAE Handbook—HVAC Applications |
| Lighting-MC | W/m2 | 5 | 20 | ASHRAE Handbook—HVAC Applications |
| Outdoor Air | liter/s/person | 5 | 15 | ASHRAE Fundamental (SI) |
| DHW | liter/m2/month | 0.05 | 10 | ASHRAE Fundamental (SI) |
| Optimization | Technology Levels | Cost ($) | Reference |
|---|---|---|---|
| Lighting daylighting factor | Baseline (NULL) | 0.00 | IES Lighting Handbook: The Standard Lighting Guide [34] |
| Partial sensor | 600.00 | ||
| Fully automated sensor | 1400.00 | ||
| Lighting occupancy factor | Baseline (NULL) | 0.00 | https://www.homewyse.com/maintenance_costs/index.html; http://www.homedepot.com/, accessed on 5 April 2023 |
| Partial sensor | 600.00 | ||
| Fully automated sensor | 1400.00 | ||
| Lighting constant illumination control factor | Baseline (NULL) | 0.00 | |
| Partial sensor | 500.00 | ||
| Fully automated sensor | 1000.00 | ||
| Heating and Cooling Plants efficiencies (COPs) | Baseline HVAC | 0.00 | The R.S. Means. 2021. Facilities Maintenance & Repair Cost Data handbook [35] |
| HVAC variation 2 | 1200.00 | ||
| HVAC variation 3 | 2350.00 | ||
| HVAC variation 4 | 4120.00 | ||
| Heat recovery type | No heat recovery | 0.00 | The R.S. Means. 2009. Facilities Maintenance & Repair Cost Data. R.S. Means Company. [36] |
| Heat exchange plates or pipes (0.65) | 2750.00 | ||
| Two-elements-system (0.6) | 2300.00 | ||
| Loading cold with air-conditioning (0.4) | 1800.00 | ||
| Heat-pipes (0.6) | 2200.00 | ||
| Slowly rotating or intermittent heat exchangers (0.7) | 3460.00 | ||
| Exhaust air recirculation percentage | No exhaust air recirculation | 0.00 | |
| Exhaust air recirculation 20% | 620.00 | ||
| Exhaust air recirculation 40% | 1200.00 | ||
| Exhaust air recirculation 60% | 1830.00 | ||
| Building air leakage level | Minimum infiltration | 0.4 (Air flow m3/h per floor area at Q4Pa) | |
| Maximum infiltration | 1.5 (Air flow m3/h per floor area at Q4Pa) | ||
| DHW Generation System | Electric (0.75) | 0.00 | |
| VR-Boiler (0.61) | 475.00 | ||
| Gas Boiler, HR-Boiler (0.75) | 620.00 | ||
| Co-Generation (0.9) | 1300.00 | ||
| District Heating (0.9) | 450.00 | ||
| Heat Pump (1.4) | 1800.00 | ||
| Steam (0.61) | 530.00 | ||
| Type of BEM system installed | Class D | 0.00 | |
| Class C | 650.00 | ||
| Class B | 2780.00 | ||
| Class A | 4200.00 | ||
| PV module Surface Area | Minimum # PV modules | 0 (PV module surface area, m2) | The R.S. Means (2010). Building Construction Cost Data. R.S. Means Company. [37] |
| Maximum # PV modules | 35 (PV module surface area, m2) | ||
| Solar Collector Surface Area | Minimum # Solar Col. | 0 (Solar collector surface area, m2) | |
| Maximum # Solar Col. | 4 (Solar collector surface area, m2) | ||
| Appliance | Energy-Star Baseline | 0.00 | http://www.dcd.com/, accessed on 5 April 2023 |
| Energy-Star Top 10% | 1350.00 | ||
| Energy-Star Top 5% | 2120.00 | ||
| Lighting type | 100%CFL | 0.00 | https://www.energy.gov/eere/buildings/building-retrofit, accessed on 5 April 2023; The NREL database is also a good help: http://www.nrel.gov/ap/retrofits/group_listing.cfm/, accessed on 4 September 2022 |
| LED&CFL combo | 3100.00 | ||
| LED | 6700.00 | ||
| Roof1 | Roof Baseline 1 | 0.00 | http://www.dcd.com/, accessed on 5 April 2023 |
| Roof Improvement 2 | 600.00 | ||
| Roof Improvement 3 | 2700.00 | ||
| Opaque1 | Wall Baseline 1 | 0.00 | http://www.dcd.com/, accessed on 5 April 2023 |
| Wall Improvement 2 | 3460.00 | ||
| Wall Improvement 3 | 6840.00 | ||
| Window1 | Window Baseline 1 | 0.00 | http://www.dcd.com/, accessed on 5 April 2023 |
| Window Improvement 2 | 2140.00 | ||
| Window Improvement 3 | 8700.00 |
Disclaimer/Publisher’s Note: The statements, opinions and data contained in all publications are solely those of the individual author(s) and contributor(s) and not of MDPI and/or the editor(s). MDPI and/or the editor(s) disclaim responsibility for any injury to people or property resulting from any ideas, methods, instructions or products referred to in the content. |
© 2023 by the authors. Licensee MDPI, Basel, Switzerland. This article is an open access article distributed under the terms and conditions of the Creative Commons Attribution (CC BY) license (https://creativecommons.org/licenses/by/4.0/).
Share and Cite
Li, W.; Sun, Z.; Makvandi, M.; Chen, Q.; Fu, J.; Gong, L.; Yuan, P.F. The Use of Normative Energy Calculation beyond the Optimum Retrofit Solutions in Primary Design: A Case Study of Existing Buildings on a Campus. Sustainability 2023, 15, 7094. https://doi.org/10.3390/su15097094
Li W, Sun Z, Makvandi M, Chen Q, Fu J, Gong L, Yuan PF. The Use of Normative Energy Calculation beyond the Optimum Retrofit Solutions in Primary Design: A Case Study of Existing Buildings on a Campus. Sustainability. 2023; 15(9):7094. https://doi.org/10.3390/su15097094
Chicago/Turabian StyleLi, Wenjing, Zhuoyang Sun, Mehdi Makvandi, Qingchang Chen, Jiayan Fu, Lei Gong, and Philip F. Yuan. 2023. "The Use of Normative Energy Calculation beyond the Optimum Retrofit Solutions in Primary Design: A Case Study of Existing Buildings on a Campus" Sustainability 15, no. 9: 7094. https://doi.org/10.3390/su15097094
APA StyleLi, W., Sun, Z., Makvandi, M., Chen, Q., Fu, J., Gong, L., & Yuan, P. F. (2023). The Use of Normative Energy Calculation beyond the Optimum Retrofit Solutions in Primary Design: A Case Study of Existing Buildings on a Campus. Sustainability, 15(9), 7094. https://doi.org/10.3390/su15097094