Abstract
High-voltage switchgears can generate high-frequency and high-amplitude electromagnetic interference during their operation, which may lead to abnormal outputs of the measurement devices, thus giving rise to measurement errors or protective relay malfunctions and impacts on the stable running of the power grid. Considering the air breakdown delay, a dynamic reignition model consisting of the hyperbolic model, the static model and the improved Mayr model is proposed to analyze the transient process during the on/off operation of open-type disconnectors. Meanwhile, the influence of arc resistance, line length and breakdown delay on the model were analyzed, and an experimental circuit was built to verify the simulation results through a comparison. It was found that the proposed model could reflect the high-frequency voltage and current during the on/off operation more accurately and thus provide an effective method for the precise modeling of the switching operation of the disconnector.
1. Introduction
Electromagnetic interference and electromagnetic compatibility is one of the key problems in new energy power system and energy sustainability. With the development of power systems [1,2,3,4,5], a large number of power electronics are used, and the electromagnetic interference problem of power equipment becomes more and more serious [6,7,8,9]. The disconnecting switch (DS) is an important protective device for electrical equipment, as well as a common source of electromagnetic interference in substations [10]. When a DS switches the small capacitive current, the arc reignites and goes out repeatedly, forming very fast transient overvoltage (VFTO) and a transient current (VFTC) with high amplitude, high steepness and high frequency, which may not only cause errors in sensitive metering devices [11] but may also damage the electric equipment’s insulation. Because of the complexity of experimental measurements, numerical simulations are more widely used to study this phenomenon [12].
The simulation of transient behavior depends strongly on the arc model [13]. Common arc models include the static model, which is too simple to reflect the characteristics of arc resistance, and time-varying models, such as the single exponential model and the hyperbolic model, both of which cannot describe the whole process of arc development. Furthermore, black box models represented by the Mayr model and the Cassie model are also widely used, based on which, many scholars have proposed improved models such as the Habedank model [14] and the Schwarz model [15]. Moreover, Ref. [16] designed a segmented arc model, which describes the complete arcing process from the pre-breakdown stage to the steady burning stage and finally to the arc’s extinction stage. On this basis, considering the influence of the recovery voltage, a dynamic arc model was further proposed and verified by the measured data [17], and the results showed that the model is suitable for gas-insulated switchgears (GIS), but its applicability in air-insulated switchgears (AIS) remains to be discussed. Furthermore, to study the process of multiple restrikes, Ref. [18] proposed a multiple reignition model consisting of a reburning module, an extinction module and a switch control module to imitate the restriking phenomenon. However, this model equates the change in the arc’s resistance with the on/off operation of an ideal switch, which is sketchy and has a gap from actual conditions. Therefore, the equivalent re-arcing model of the disconnector in AIS needs further study.
To investigate the arc reignition phenomenon and the resulting characteristics of VFTO and VFTC during the on/off operation of the disconnector in AIS, this study adjusted the dynamic arc model by considering the continuity of the arc’s resistance and the air breakdown delay. In addition, the reburning criterion and the extinction criterion were used to judge the development stage of the arc. On this basis, different expressions were used to describe the arc’s resistance, thus forming a dynamic reignition model, which was verified by comparing the simulative and measured data. Additionally, the influence of some parameters, such as the arc’s resistance, line length and breakdown delay, on the characteristics of VFTO and VFTC were discussed.
2. The Arc Model
During the opening/closing operations of the disconnector, the arc reignites and extinguishes repeatedly, so it is necessary to establish a multiple reignition model.
2.1. Single Breakdown Model
The single breakdown model is the basis of the multiple reignition model. The authors of [16] proposed a model consisting of the pre-breakdown stage, the steady burning stage and the arc extinction stage, and the biexponential function was used to describe the arc’s resistance, which is of great reference value.
In this study, the modified hyperbolic model, the static model and the improved Mayr model were used in these three stages separately, forming the dynamic model. The specific expressions are as follows:
- Pre-breakdown stage
- Steady burning stage:
- Arc extinction stage [19]
The following parameters of the arc resistance model in each development stage of arcing were selected:
Pre-breakdown stage (Equation (1)): Z1 = 266 Ω, Z2 = 121 Ω, ZDS = 130 Ω, tδ = 140 ns;
Steady burning stage (Equation (2)): r0 = 2.3 Ω;
Arc extinction stage (Equation (3)): τ = 1.5 × 10⁻⁶, p = 4 × 10⁶, α = 0.17, β = 0.68.
2.2. Reburning Criterion
The gaseous dielectric theory holds that the arcing phenomenon occurs mainly because the voltage applied to the gap is greater than the breakdown voltage. Therefore, when the current crosses zero, if the strength of dielectric recovery is always higher than the recovery voltage, the arc tends to die out.
Apparently, the key for the reburning criterion is the calculation of the critical breakdown voltage uB, which was confirmed to be approximately linear with the contact gap by some relevant studies [20]. According to the simplified analysis method proposed by [21], the breakdown voltage can be expressed as follows.
- Switching on
- Switching off
2.3. Extinction Criterion
The energy balance theory holds that the gap is still a conductor after the current crosses zero, and the post-arc current arises under the influence of the recovery voltage. Only when the energy injected into the arc gap is less than the lost energy can the arc be extinguished.
When the arc gap of the disconnector is newly broken down, although the superposition of high-frequency and power-frequency currents may cause the current to cross zero many times under high-frequency oscillation, the energy input into the arc gap is still higher than the lost part, so the arc is not extinguished immediately until the oscillation decays [22]. To weaken the interference of the high-frequency current on the determination of arc extinction, the current of two sampling points with a sampling interval ∆t was taken for calculation. If their product, namely I(t)*I(t + ∆t), is less than zero and the absolute value of their difference is less than a small fixed value K, it means that the current crosses zero and changes slowly, and the arc is considered to be extinguished; otherwise, it moves to the next moment by adding an interval ∆t and the process above repeats. The details are shown in Figure 1.
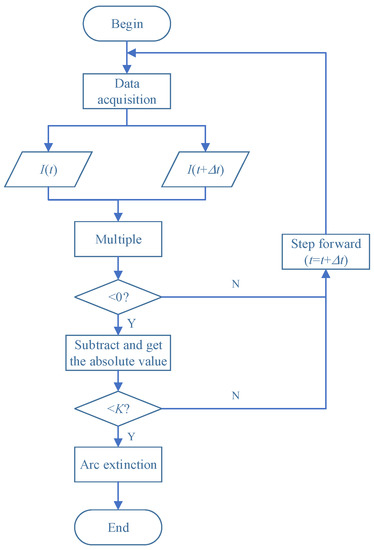
Figure 1.
Flowchart of the extinction criterion.
2.4. Dynamic Reignition Model
By combining the reburning criterion and the extinction criterion with the dynamic model mentioned above, a complete dynamic reignition model was constructed. The specific operational process is as follows:
- Sample the gap voltage ∆u and calculate the critical breakdown voltage uB.
- Compare ∆u and uB according to the reburning criterion. If ∆u > uB, the gap is broken down and the arc starts to burn; otherwise, return to Step 1.
- Remain in the steady burning stage and perform the logic operation according to the extinction criterion.
- If the current crosses zero slowly, enter the arc extinction stage; otherwise, return to Step 3.
- Judge whether the switching operation has completed. If it is, the entire judgment process ends; otherwise, return to Step 1.
3. Validation of the Arc Model
3.1. Laboratory Experiment
In this study, the signals of the transient voltage and current were measured through the small capacitive current switching test of the 110 kV AIS disconnector. The experimental circuit is shown in Figure 2, and the parameters of the key equipment were as follows:
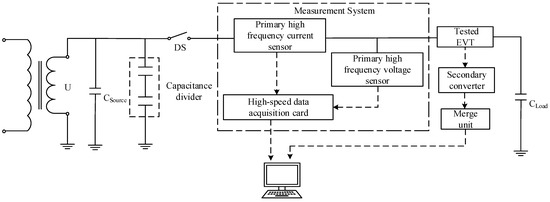
Figure 2.
Experimental circuit of a 110 kV AIS disconnector opening and closing a small capacitive current.
- Aerial conductor (distributed parameter model):Line 1: L1 = 4.5 m, Z1 = 266 Ω, v1 = 300 m/μs;Line 2: L2 = 3.0 m, Z2 = 121 Ω, v2 = 300 m/μs.
- Earth capacity (source side): 6300 pF.
- Capacitance divider: main capacitor 411 pF, transformation ratio 2000:1.
- Lumped capacity of voltage transformer: 1000 pF.
- Load capacitance: 5000 pF.
Firstly, connect the experiment equipment in turn according to the wiring diagram; then keep the disconnector open and adjust the output voltage to 110/√3 kV. Next, close the disconnector and record the experimental data during this period. After 3 min, open the switch. Repeat the opening and closing operations several times and finally obtain the measured data. Figure 3 and Figure 4 show a typical set of waveforms of transient voltage and transient current.
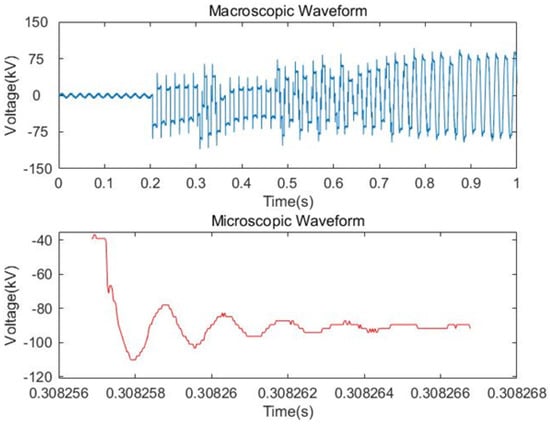
Figure 3.
Measured waveforms of VFTO.
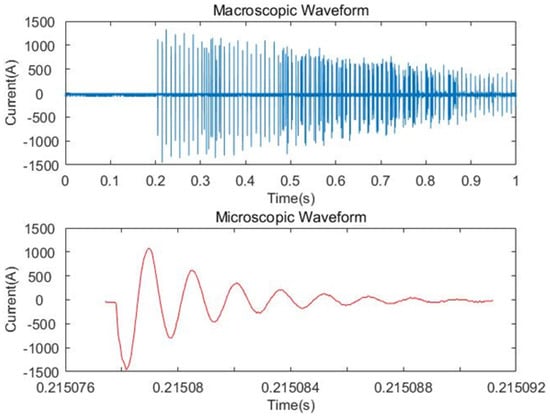
Figure 4.
Measured waveforms of VFTC.
In order to make the data more intuitive, some characteristic parameters of the measured waveforms, such as the peak value, the consuming time Tr of rising or falling to the peak value, and the duration time Td of the oscillations, are presented in Table 1.

Table 1.
Characteristic parameters of the measured waveforms.
It can be seen from Table 1 that the maximum amplitude of VFTO was 1.362 p.u., the rise time was distributed in the range of 0.73–0.86 μs, and the maximum steepness reached 1.368 p.u./μs. The maximum amplitude of VFTC was 1458.661 A, the rising time was mainly concentrated around 0.4 μs, and the maximum steepness could reach 3.672 kA/μs, which is in line with the characteristics of transient voltage and a transient current with a high amplitude and high steepness.
3.2. Comparison and Analysis of the Arc Models
In order to test the applicability of the proposed model of AIS, this section presents a corresponding main simulative circuit according to the experimental circuit in Section 3.1.We combined the two criteria mentioned above with the biexponential model and the dynamic model, thus building the biexponential reignition model and the dynamic reignition model, respectively. Both of them were used to simulate the transient process of the switching operation, and the results are shown in Figure 5.
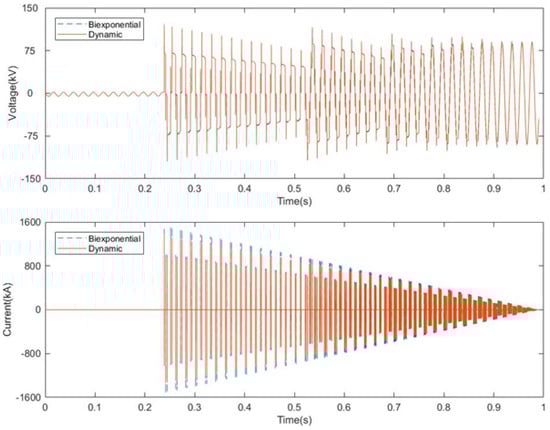
Figure 5.
Simulated macro-waveforms under the two models.
It can be seen from Figure 5 that the multiple restriking phenomenon occurred during the simulation process under both of the models, thus resulting in high-amplitude voltage and current, which were generally close to the measured waveforms, preliminarily proving the validity of the reburning criterion and the extinction criterion. Furthermore, the difference between the two models in the peak values of VFTO was inconspicuous, while the peak value of VFTC under the biexponential model was obviously higher than that of the dynamic model. In order to analyze and compare the effects of the two models, the characteristic parameters of the simulated waveforms under each model are presented in Table 2.
Table 2.
Characteristic parameters of the simulated waveforms.
It can be seen from Table 2 that the peak values of the simulated voltage under the two models were 1.345 p.u. and 1.347 p.u., which were both within the variation range measured in the experiment, and both the rise time and the duration time of VFTO were basically consistent with the measured data. However, the peak value of the simulated current under the biexponential reignition model exceeded 1500 A, which was not only much higher than the 1376 A under the dynamic model but was also beyond the range of the measured data. In addition, the rise time of VFTC under the biexponential model was shortened to less than 0.37 μs, which was the approximate simulated value of the dynamic model, as well as the minimum of the measured data. In general, the steepness of VFTC under the biexponential reignition model was higher than that of the dynamic reignition model. The reason for this might be that the biexponential reignition model ignored the influence of the air breakdown delay. Moreover, the duration time of the transient current under the biexponential reignition model reached more than 20 μs, which was 9.15 μs longer than the 11.82 μs found under the dynamic model and 6.27 μs longer than the measured maximum. This is probably because the improved Mayr model, which was used in the arc extinction stage of the dynamic model, considers the heat dissipation power and the time constant as power functions of the arc’s conductance, which is more consistent with the actual situation than taking them as two constants, thus producing a better effect.
In the frequency domain, the frequency of the VFTO on the load side of the disconnector was mainly distributed between 50 kHz and 1 MHz, which were usually generated by the reflection and refraction occurring when the travelling wave of VFTO passed through the lines with different wave impedances. According to our comparison, the spectrum under the dynamic reignition model with a higher amplitude of the dominant frequency component was more similar to the measured one.
4. Analysis of the Factors Influencing the Simulation
The simulated waveforms caused by the disconnector switching the small capacitive current were affected by many factors, such as the arc’s resistance, line length and breakdown delay, etc. The following sections discuss the influence of some parameters on the results of the simulation.
4.1. Influence of the Arc’s Resistance
As the arc’s resistance in the steady period was generally 0.5–5 Ω, we kept the other parameters unchanged, assigned the value of the arc resistance every 0.5 Ω in this range and simulated the models with different values. The results are shown in Figure 6.
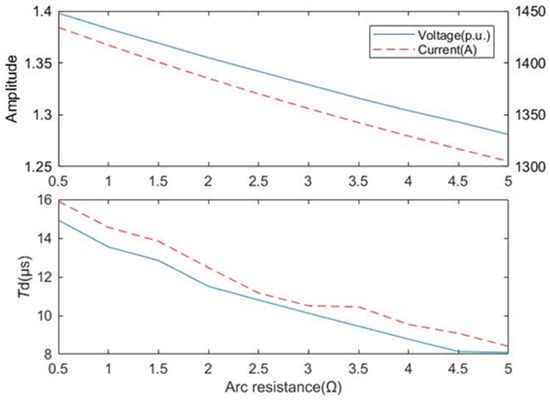
Figure 6.
The influence of the arc’s resistance on the characteristic parameters of the waveforms.
Apparently, the arc’s resistance acted as a hindrance in the propagation of VFTO and VFTC, not only did it limit their amplitude but it also accelerated the decay rate of high-frequency oscillations, which explains the phenomenon reflected in Figure 6, that is, with an increase in the arc’s resistance, the peak values of VFTO and VFTC gradually decreased by about 9% and the duration time Td shrank significantly. The rise time Tr, which is not presented in the diagram above, remained nearly unchanged.
4.2. Influence of Line Length
The line length is also an important factor, as a slight change in this might cause a great difference in the node’s voltage. Now, keeping other parameters unchanged, we increased the line length by 5% each time until the extended part reached 30% of the original length, and simulated the models with different values. The results are shown in Figure 7.
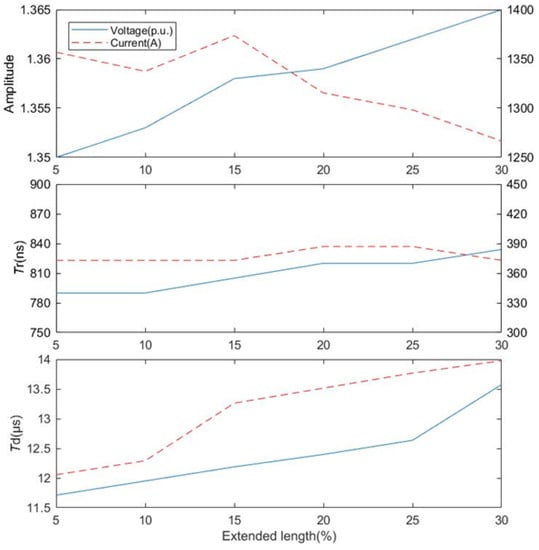
Figure 7.
The influence of line length on the characteristic parameters of the waveforms.
As the line length increased, the peak value of VFTO rose gradually, while the counterpart of VFTC tended to decrease; moreover, both Td and Tr tended to be prolonged in general, which can be explained as follows. The equivalent inductance increased with an extension of the line length, which hindered the sudden change in the current and impeded the attenuation of the signals, but because of the aggravated oscillation of the voltage, the amplitude of VFTO increased in contrast.
4.3. Influence of Breakdown Delay
The author of [23] provided an empirical formula, according to which the breakdown delay is estimated to be approximately 37.7–139.6 ns. Now, keeping other parameters unchanged, we assigned the value of breakdown delay every 15 ns in the range of 35–140 ns, and the simulation results under different values are shown in Figure 8.
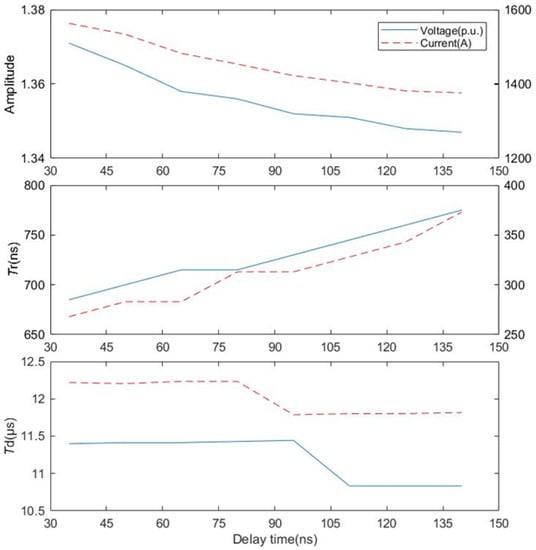
Figure 8.
The influence of breakdown delay on the characteristic parameters of the waveform.
Obviously, prolongation of the breakdown delay led to the decreased peak values of VFTO and VFTC, as well as the longer Tr, but the change in Td showed no particular regularity, which could be explained by the fact that the concerned parameter mainly affects the pre-breakdown stage and thus weakens the wavefront process, but has little effect on the later stages.
5. Conclusions
The comparison between the simulated and the measured data indicated that the dynamic reignition model of the AIS disconnector proposed in this study could better reflect the transient process in both the time domain and the frequency domain. By changing the parameters, the influence of several factors on the simulation were discussed, thus obtaining the following three conclusions:
- With the increase in the arc’s resistance, the peak values of the transient voltage and current decreased, and the duration time was shortened.
- With the extension of line length, the peak value of VFTO increased, while the peak value of VFTC, inhibited by the growth of equivalent inductance, tended to decrease, and the arc decayed more slowly and lasted longer.
- With prolongation of the breakdown delay, the pre-breakdown process became milder, and thus reduced the peak value and steepness of VFTO and VFTC.
Author Contributions
Conceptualization, Y.T. and Q.W.; methodology, Y.T.; software, Y.T.; validation, Q.W.; formal analysis, Q.W.; investigation, X.L.; resources, Y.W.; data curation, Y.T. and Q.W.; writing—original draft preparation, X.L.; writing—review and editing, Y.W.; visualization, X.L.; supervision, Y.W.; project administration, Y.T.; funding acquisition, Q.W. All authors have read and agreed to the published version of the manuscript.
Funding
This research was funded by the Science and Technology Project of the State Grid Corporation of China (Grant No. 5226SX21001B).
Institutional Review Board Statement
Not applicable.
Informed Consent Statement
Not applicable.
Data Availability Statement
No new data were created or analyzed in this study.
Acknowledgments
The authors would like to thank the anonymous reviewers for their valuable comments and suggestions to improve the quality of this study.
Conflicts of Interest
The authors declare no conflict of interest.
References
- Yang, N.; Qin, T.; Wu, L.; Huang, Y.; Huang, Y.; Xing, C.; Zhang, L.; Zhu, B. A multi-agent game based joint planning approach for electricity-gas integrated energy systems considering wind power uncertainty. Electr. Power Syst. Res. 2022, 204, 107673. [Google Scholar] [CrossRef]
- Zhang, Y.; Wei, L.; Fu, W.; Chen, X.; Hu, S. Secondary frequency control strategy considering DoS attacks for MTDC system. Electr. Power Syst. Res. 2023, 214, 108888. [Google Scholar] [CrossRef]
- Rezk, H.; Mohamed, M.A.; Diab, A.A.Z.; Kanagaraj, N. Load frequency control of multi-interconnected renewable energy plants using multi-verse optimizer. Comput. Syst. Sci. Eng. 2021, 37, 219–231. [Google Scholar] [CrossRef]
- Li, Z.; Jiang, W.; Abu-Siada, A.; Li, Z.; Xu, Y.; Liu, S. Research on a composite voltage and current measurement device for HVDC networks. IEEE Trans. Ind. Electron. 2021, 68, 8930–8941. [Google Scholar] [CrossRef]
- Dutta, A.K.; Faraj, M.A.; Albagory, Y.; Alzamil, M.M.; Sait, A.R.W. Intelligent smart grid stability predictive model for cyber-physical energy systems. Comput. Syst. Sci. Eng. 2023, 44, 1219–1231. [Google Scholar] [CrossRef]
- Yang, N.; Dong, Z.; Wu, L.; Zhang, L.; Shen, X.; Chen, D.; Zhu, B.; Liu, Y. A comprehensive review of security-constrained unit commitment. J. Mod. Power Syst. Clean Energy 2021, 10, 562–576. [Google Scholar] [CrossRef]
- Yang, N.; Yang, C.; Xing, C.; Ye, D.; Jia, J.; Chen, D.; Shen, X.; Huang, Y.; Zhang, L.; Zhu, B. Deep learning-based SCUC decision-making: An intelligent data-driven approach with self-learning capabilities. IET Gener. Transm. Distrib. 2022, 16, 629–640. [Google Scholar] [CrossRef]
- Zhang, Y.; Xie, X.; Fu, W.; Chen, X.; Hu, S.; Zhang, L.; Xia, Y. An Optimal Combining Attack Strategy Against Economic Dispatch of Integrated Energy System. IEEE Trans. Circuits Syst. II Express Briefs 2023, 70, 246–250. [Google Scholar] [CrossRef]
- Khan, W.A.; Bi, T.; Jia, K. A review of single phase adaptive auto-reclosing schemes for EHV transmission lines. Prot. Control Mod. Power Syst. 2019, 4, 1–10. [Google Scholar] [CrossRef]
- Chen, J.; Wu, G.; Jian, X.; Cai, L.; Chen, S.; Chen, R. Research on state monitoring system of intelligent disconnecting switch based on sensing technology. Front. Energy Res. 2022, 10, 895301. [Google Scholar] [CrossRef]
- Li, Z.; Yu, C.; Abu-Siada, A.; Li, H.; Li, Z.; Zhang, T.; Xu, Y. An online correction system for electronic voltage transformers. Int. J. Electr. Power Energy Syst. 2021, 126, 106611. [Google Scholar] [CrossRef]
- Chen, X.; He, Z.; Zhang, Y.; Si, J.; Wang, S.; Wan, B.; Liu, J. Research on conducted disturbance to secondary cable caused by disconnector switching operation. Front. Energy Res. 2022, 9, 819021. [Google Scholar] [CrossRef]
- Yang, G.; Zhu, Y.; Zen, F.; Zhou, S.; Chen, Y. Electromagnetic transient characteristics and overvoltage suppression strategy of renewable energy-oriented power system connected by gas-insulated transmission lines. Front. Energy Res. 2022, 10, 991355. [Google Scholar] [CrossRef]
- Habedank, U. Application of a new arc model for the evaluation of short-circuit breaking tests. IEEE Trans. Power Deliv. 2002, 8, 1921–1925. [Google Scholar] [CrossRef]
- Schwarz, J. Dynamisches verhalten eines gasbeblasenen turbulenzbestimmten schaltlichtbogens. ETZ-A 1971, 92, 389–391. [Google Scholar]
- Meng, T.; Lin, X.; Xu, J. Calculation of very fast transient over-voltage on the condition of segmental arcing model. Trans. China Electrotech. Soc. 2010, 25, 69–73. (In Chinese) [Google Scholar]
- Lin, X.; Wang, N.; Xu, J. Arcing model of a disconnector and its effect on VFTO. Plasma Sci. Technol. 2013, 15, 644–647. [Google Scholar] [CrossRef]
- Li, Z.; Shen, J.; Li, H.; Wu, L.; Zhang, T.; Xu, Y. Research on arc model of disconnector for conduction interference of electronic transformer. In Proceedings of the 2019 4th International Conference on Intelligent Green Building and Smart Grid (IGBSG), Yichang, China, 6–9 September 2019; pp. 443–447. [Google Scholar]
- Schavemaker, P.H.; Van, D. An improved Mayr-type arc model based on current-zero measurements [circuit breakers]. IEEE Trans. Power Deliv. 2000, 15, 580–584. [Google Scholar] [CrossRef]
- Feng, B.; Xu, J.; Hao, S. Research the effect of UHV GIS disconnector contact shape on the multi-restrike. In Proceedings of the 2016 China International Conference on Electricity Distribution (CICED), Xi’an, China, 10–13 August 2016; pp. 1–4. [Google Scholar]
- Shu, Y.; Han, B.; Lin, J.; Chen, W.; Ban, L.; Xiang, Z.; Chen, G. Influence of the switching speed of the disconnector on very fast transient overvoltage. IEEE Trans. Power Deliv. 2013, 28, 2080–2084. [Google Scholar]
- Xin, W.; Zhang, G.; Wang, J.; Liu, K.; Geng, Y. Simulation of very fast transient overvoltage caused by disconnector switch operation in SF6 Gas insulated switchgear using multi-restrike arcing model. In Proceedings of the 2013 2nd International Conference on Electric Power Equipment-Switching Technology (ICEPE-ST), Matsue, Japan, 20–23 October 2013; pp. 1–4. [Google Scholar]
- Martin, T.H. An empirical formula for gas switch breakdown delay. In Proceedings of the 7th Pulsed Power Conference, Monterey, CA, USA, 11–14 June 1989; pp. 73–79. [Google Scholar]
Disclaimer/Publisher’s Note: The statements, opinions and data contained in all publications are solely those of the individual author(s) and contributor(s) and not of MDPI and/or the editor(s). MDPI and/or the editor(s) disclaim responsibility for any injury to people or property resulting from any ideas, methods, instructions or products referred to in the content. |
© 2023 by the authors. Licensee MDPI, Basel, Switzerland. This article is an open access article distributed under the terms and conditions of the Creative Commons Attribution (CC BY) license (https://creativecommons.org/licenses/by/4.0/).