Article

A Survey of Electric-Scooter Riders’ Route Choice, Safety Perception, and Helmet Use

HumanFIRST Laboratory, Department of Mechanical Engineering, University of Minnesota, Minneapolis, MN 55455, USA
*
Author to whom correspondence should be addressed.
Sustainability 2023, 15(8), 6609; https://doi.org/10.3390/su15086609
Submission received: 2 March 2023 / Revised: 3 April 2023 / Accepted: 4 April 2023 / Published: 13 April 2023
(This article belongs to the Special Issue Traffic Safety, Road User Attitudes and Sustainable Transportation)

Abstract

:
This study investigated electric-scooter (e-scooter) rider behaviors and preferences to inform ways to increase safety for e-scooter riders. Data was collected from 329 e-scooter riders via two online and one in-person survey. Survey questions considered rider roadway infrastructure preferences, safety perceptions, and helmet-wearing behavior. Protected bike lanes were more commonly indicated as the safest infrastructure (62.4%) but were less likely to be the most preferred infrastructure (49.7%). Sidewalks were better matched between riders, indicating them as their preferred riding infrastructure (22.7%) and the perceived safest riding infrastructure (24.5%). Riders had low feelings of safety and preference for riding on major/neighborhood streets or on unprotected bike lanes. Riders reported significant concern about being hit by a moving vehicle, running into a pothole/rough roadway, and running into a moving vehicle. In line with the Theory of Planned Behavior, a significant relationship was found between the frequency of riding and helmet-wearing behavior, with more frequent riders being more likely to wear helmets. Findings suggest that existing roadway infrastructure may pose safety challenges and encourage rider-selected workarounds. Public policy may consider emphasizing protected bicycle lane development, rather than helmet mandates, to support e-scooter riding safety for all vulnerable road users.

1. Introduction

1.1. Background

As an emerging mode of transportation, electric-scooter (e-scooter) rider preferences, behaviors, and safety perceptions need to be better understood to inform ways to effectively increase safety for e-scooter riders. As it is a relatively new mode of micromobility, where e-scooter riders fit into the current transportation infrastructure is still being navigated by e-scooter riders and policymakers. Typically, no roadway infrastructure is dedicated solely to e-scooters, and therefore e-scooter riders share the existing spaces with various other transportation modes [1]. Common types of shared infrastructure e-scooter riders find themselves on include sidewalks, bike-related infrastructure, and vehicle lanes [2]. This invites e-scooter interactions with pedestrians, cyclists, and other vehicles, which can pose a risk to all parties involved.
To provide some guidance or regulation, some cities have created laws or guidelines regarding many different aspects of e-scooter riding. Variations in these laws or guidelines exist for where e-scooters can be ridden and parked, speed limits, the classification of the e-scooter, whether insurance and a driver’s license are required to ride, and the requirement to wear a helmet while riding [3]. Some cities have no guidelines, whereas others have banned e-scooters, with safety concerns being the most prevalent reason for a ban [3].
To understand the risks associated with riding an e-scooter, some studies have been conducted on the prevalence of crashes and injuries related to e-scooters [4,5,6,7,8,9,10,11,12,13,14,15,16,17,18,19]. A recent analysis using data acquired from the National Electronic Injury Surveillance System (NEISS), which estimates the number of injuries associated with consumer products that result in an emergency room visit, found that estimated emergency room visits for e-scooter-related injuries increased from 4881 in 2014 to 26,628 in 2019 [13]. Additionally, a common theme among studies focusing on e-scooter injuries is a lack of helmet use [6,18]. Many news outlets have covered e-scooter crashes and instances of serious injuries involving e-scooter riders [19]. These types of injury and/or crash-focused studies can provide information regarding how often crashes occur and how often serious injuries are sustained. These studies provide insight into why riders might hold certain safety perceptions but do not specifically investigate riders’ concerns.

1.2. Rider Behavior and Planning Considerations

A study by Glavić and colleagues examined aspects of the e-scooter rider’s willingness to switch to an e-scooter from another mode of travel and found willingness was negatively influenced by safety concerns [20]. This indicates that safety perception is influential in a person’s decision of whether to ride an e-scooter or not, even when they are already e-scooter riders. Additional investigation is warranted to address what aspects may create safety concerns at a more granular level. Regarding rider preferences, prior studies have focused on rider demographics and preferences in terms of who usually rides e-scooters, for what purpose, how often users ride, when users ride, what types of transportation modes e-scooter riding replaces, as well as consumer acceptance [21,22,23]. In addition, studies have looked at route patterns/spatial trends using location-based data [20,22]. The findings suggest that e-scooter riders are willing to travel long distances to ride on bike-related infrastructure, multi-use paths, tertiary roads, and one-way roads. Additionally, they found that e-scooter riders preferred shorter and simpler routes. This allows for some preference inferences based purely on riding behavior. Additional investigation into the rider’s perception of various routes or roadway infrastructure by hearing from riders themselves would provide more direct insight.
The Theory of Planned Behavior claims that intention or readiness predicts the likelihood of performing a behavior and that this intention is shaped by subjective norms, attitudes, and perceived behavioral control [24]. Both subjective norms and perceived behavioral control have been shown to have a stronger link to behavioral intention to wear helmets than attitudes toward behaviors [25]. If this model is predictive for e-scooter behavior, we can anticipate that groups with different social norms around scooter safety and helmet use would influence intention to use a helmet and therefore influence the behavior (e.g., frequency) of helmet use. Because the second survey iteration at the State Fair assessed a more casual cohort of e-scooter riders and the other two surveys captured dedicated groups of e-scooter riders with their own social norms, we predict differing patterns of helmet use. Furthermore, attitudes towards safety (e.g., concern with moving vehicles) should also predict helmet use, and because e-scooter use is frequently casual, without planned intention, intention to use an e-scooter (e.g., frequency of riding) should further predict intention to use a helmet and predict the frequency of helmet use.
Here we add to the existing information regarding e-scooters by assessing survey data from e-scooter riders to better understand their motivations and safety perceptions regarding e-scooter riding. This work aims to add the rider’s perspective to the conversation by collecting data directly from e-scooter riders. Additionally, the Theory of Planned Behavior is utilized to make inferences about e-scooter rider behavior. We hope to use this information to provide guidance on designs for road infrastructure, policies, and e-scooters themselves.

2. Materials and Methods

2.1. Survey

The survey was distributed from 26 February 2021 to 26 December 2021 in three iterations. All three iterations are considered convenience samples. All respondents were self-identifying e-scooter riders. A total of 329 individual responses from e-scooter riders were gathered across the three surveys. An e-scooter rider was defined as someone who had any previous experience riding an e-scooter. The three survey iterations were not identical to each other, with some iterations containing questions that did not appear in the others. When questions were common among surveys, the questions were identical. Survey iterations one and three contained questions regarding the topic of e-scooter riding. The second survey iteration contained questions regarding e-scooter riding as well as more general roadway behavior questions. Most of the questions regarding e-scooter riding were common across survey iterations, and these are the questions considered in the present analysis.
Across the three iterations, common topics covered included: Demographic information, e-scooter usage, rider preferences, rider concerns, helmet use, crashes, and injuries. Survey questions were developed by identifying gaps in the literature and structured using elements and attributes from the Model Minimum Uniform Crash Criterion 5th Edition [26]. At the start of the survey, the e-scooter rider experience was surveyed. If the respondent had no e-scooter riding experience, questions related to e-scooter riding from the perspective of a rider were not asked. If the respondent did have e-scooter riding experience, then demographic information, rider preferences, rider concerns, and helmet use data were collected. If the respondent had not been involved in an e-scooter crash or had been injured while riding an e-scooter, then the survey ended. If the respondent had been involved in a crash or had been injured, additional questions regarding specifics of the crash(es) and/or injuries. Information collected from questions regarding crashes and injuries is discussed in a separate study, which found males and frequent riders to be at increased risk of crashes of any type [27]. That analysis further found female riders at greater risk of injury when involved in a crash, which may be related to their greater reported propensity to ride on sidewalks and non-paved surfaces [27]. Some of the data collected for this study may be utilized as a part of a larger study and, therefore, may be seen duplicated in literature due to the common source of data. Where a Likert scale was utilized, a 5-point scale of “Strongly Disagree”, “Disagree”, “Neutral”, “Agree”, and “Strongly Agree” was used.

2.2. Methods and Distribution of Survey

Survey data was collected using Qualtrics for all three survey iterations. Data were analyzed using RStudio Version 1.4.1717. All surveys were written in English.
The first survey iteration was distributed electronically via e-scooter-related discussion boards, Facebook groups, and Subreddits, as well as being posted to the research laboratory’s related social media accounts. Responses were collected from 26 February 2021 to 2 September 2021. A total of 156 responses were collected from this survey iteration. All participants voluntarily completed the survey, and no compensation was provided.
The second survey iteration took place at the Minnesota State Fair in the University of Minnesota Driven to Discover Research Facility. Both e-scooter riders and non-e-scooter riders were surveyed at this location; however, only respondents who identified as e-scooter riders were used in the following analysis. Responses were collected from 28 August 2021 to 29 August 2021. A total of 99 e-scooter rider responses were collected from this survey iteration. All participants voluntarily completed the survey, and a branded drawstring backpack was offered as an incentive for participation, which was worth approximately $1.75 (U.S.).
The third survey iteration was electronically distributed in a similar manner as the first iteration. This third survey was deployed to garner a satisfactory level of total responses and crashes experienced by respondents. Responses were collected from 30 November 2021 to 26 December 2021. A total of 74 responses were collected from this survey iteration. All participants voluntarily completed the survey, and no compensation was provided.
Not all survey respondents answered all questions included in this analysis because of dropping out (i.e., not fully finishing the survey) or because respondents were not experiencing a crash or an injury. The total number of responses for each question is shown. Any proportions calculated are with respect to the number of relevant responses for that question.

2.3. Statistical Analysis

Descriptive statistics and chi-squared tests were completed in the statistical analysis of the data. Chi-squared tests were performed using R (Version 1.4.1717) and the “stats” package (version 4.1.1). The inferential analyses in the Inferential Analyses subsection were conducted with IBM SPSS for Windows (Version 27.0).

3. Results

3.1. Characteristics of the Survey Population

To learn more about each survey population, questions about gender, age, location, e-scooter experience level, and helmet behavior were asked of each survey respondent (N = 329). Below are the demographics for each survey iteration, labeled as Survey 1–3, as well as the combined data for all three iterations, see Table 1.

3.1.1. Gender, Age, and Location

In general, the scooter ridership that was surveyed skewed male, with over twice as many male participants as female participants across surveys. This aligns with previous research on e-scooter riders, which reported trends of greater male ridership than female ridership [15].
Overall, survey respondents tended to be a young adult population, with age ranges of 18–25 years old and 26–40 years old being the most prevalent. The second survey had a younger population surveyed than the other two surveys. The second survey took place at the MN State Fair research facility, where families often visit and collectively participate in research studies. The age range of 65+ had very low prevalence, presumably because individuals of that age do not have a large e-scooter ridership due to lifestyle and aging considerations.
Most survey respondents (70.8%) were US based, with a large proportion of respondents residing in Minnesota (38.3%). Almost all the respondents in the second survey were from Minnesota, as the survey took place at the MN State Fair. The first and third surveys had similar rates of US representation, with 59.6% and 56.8%, respectively. The first and third surveys also had similar rates of international representation, with 26.9% and 22.5%, respectively.

3.1.2. Rider Experience & Frequency of Riding

Survey participants were asked how many times they had previously ridden an e-scooter and how often they usually rode an e-scooter, see Table 2. All 329 respondents answered these questions.
The rider experience level from iteration to iteration had some variability. In the first iteration, which was distributed electronically, a large portion of the respondents were experienced riders (21+ times ridden). The next highest proportion were new riders (1–5 times ridden). In the second survey iteration, collected from participants at the MN State Fair, a large majority of the respondents were inexperienced riders (1–5 times ridden). Other levels of experience were comparatively low in prevalence. In the third survey iteration, which was distributed electronically, a large majority of the respondents were experienced riders (21+ times ridden). Other levels of experience were comparatively low.
When combining rider experience levels across all three survey iterations, there are similar levels on the two ends of the experience spectrum, i.e., new riders and experienced riders. The middle levels of e-scooter experience (ridden 6–10 and 10–20 times) have lower levels of respondents in comparison (see Table 2). The three different survey iterations and two different survey distribution methods allowed for a wide spread of different levels of rider experience to be surveyed, which captured a variety of ridership types. Data above in Table 1 and Table 2 are shown delineated for each survey iteration to understand the potential differences in the type of respondent and to be transparent in the different populations surveyed. Data hereafter are combined across all survey iterations to utilize the full diversity in the responses.

3.1.3. Helmet Behavior

Respondents were asked how often they ride with a helmet (see Table 3). These responses for how often riders wore a helmet were also delineated in Table 4 according to the frequency of riding.
A trend emerges when examining helmet behavior and frequency of riding. See Table 4. Rows containing “Never” and “Very Rarely” were collapsed and compared to rows “Always” and “Very frequently”, and a chi-squared test was run comparing these two new combined categories across all levels of frequency of riding. The difference in helmet use by riding frequency was found to be significant, with more frequent riders wearing helmets more often than infrequent riders (χ2(3) = 96.95, p < 0.001).

3.2. Rider Preferences and Concerns

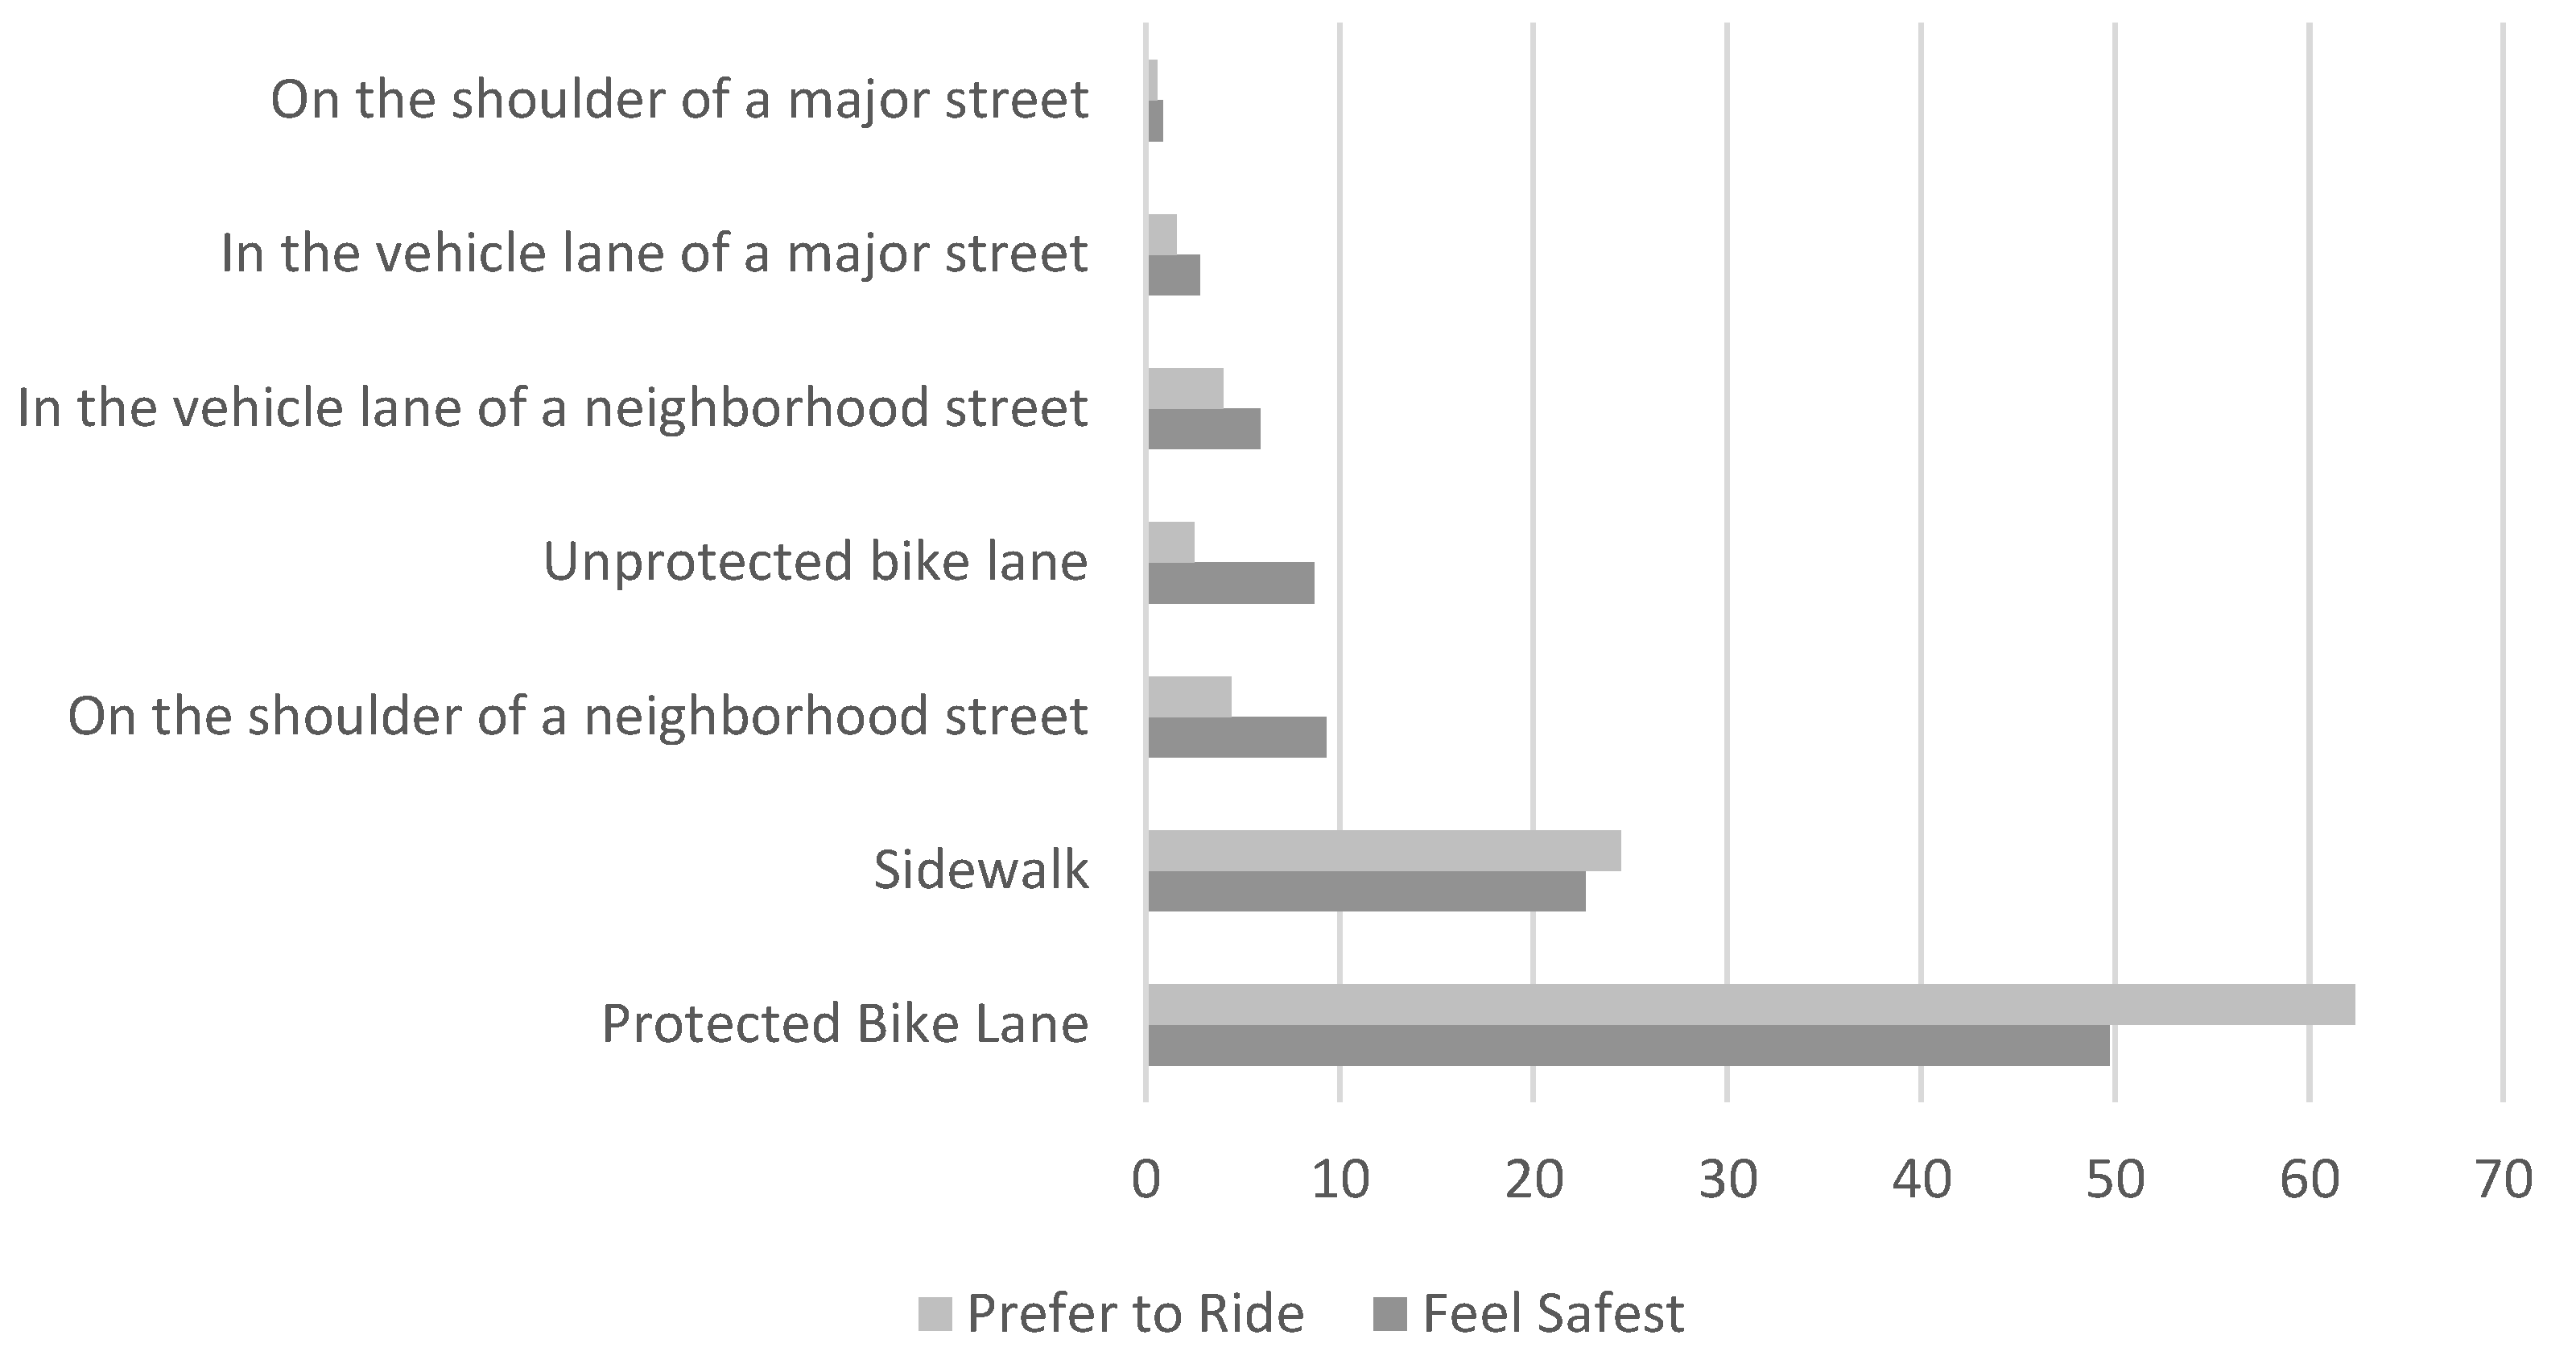
3.2.1. Rider Infrastructure Preferences

To understand how different roadway infrastructure affects riders’ comfort, riders were asked where they felt safest riding and where they preferred to ride, see Figure 1. Additional descriptions were provided to give the respondents a clear idea of the differences between types of roadway infrastructure. A major street was defined as having “lots of traffic and activity”. A neighborhood street was defined as having “less traffic and little activity”. A protected bike lane was defined as having “a physical barrier between you and vehicle traffic”.
A chi-square test was applied to discern if riders of different levels of experience preferred to ride or felt safest riding on different types of roadway infrastructures. Cells, where counts were less than five were excluded from the analysis. This resulted in an analysis of where riders prefer to ride, being compared for 1–5 times ridden and 21+ for the following types of roadway infrastructure: sidewalk, protected bike lane, unprotected bike lane, and on the shoulder of a neighborhood street. This result was not significant (p = 0.213, χ2 = 12, df = 9). For where riders felt safest to ride, the analysis included experience levels 1–5 times ridden and 21+ times ridden for the following types of roadway infrastructure: sidewalk, protected bike lane, and on the shoulder of a neighborhood street. This result was not significant (p = 0.199, χ2 = 6, df = 4).
Where riders reported they felt safest to ride, most respondents (62.4%) indicated that protected bike lanes provided the greatest feelings of safety. A large proportion (49.6%) also reported that the protected bike lane was the place they preferred to ride. The next most prevalent answer overall was the sidewalk, with 22.7% preferring to ride and 24.5% feeling safest riding on the sidewalk. All other options were less prevalent and included potential interaction with vehicles.

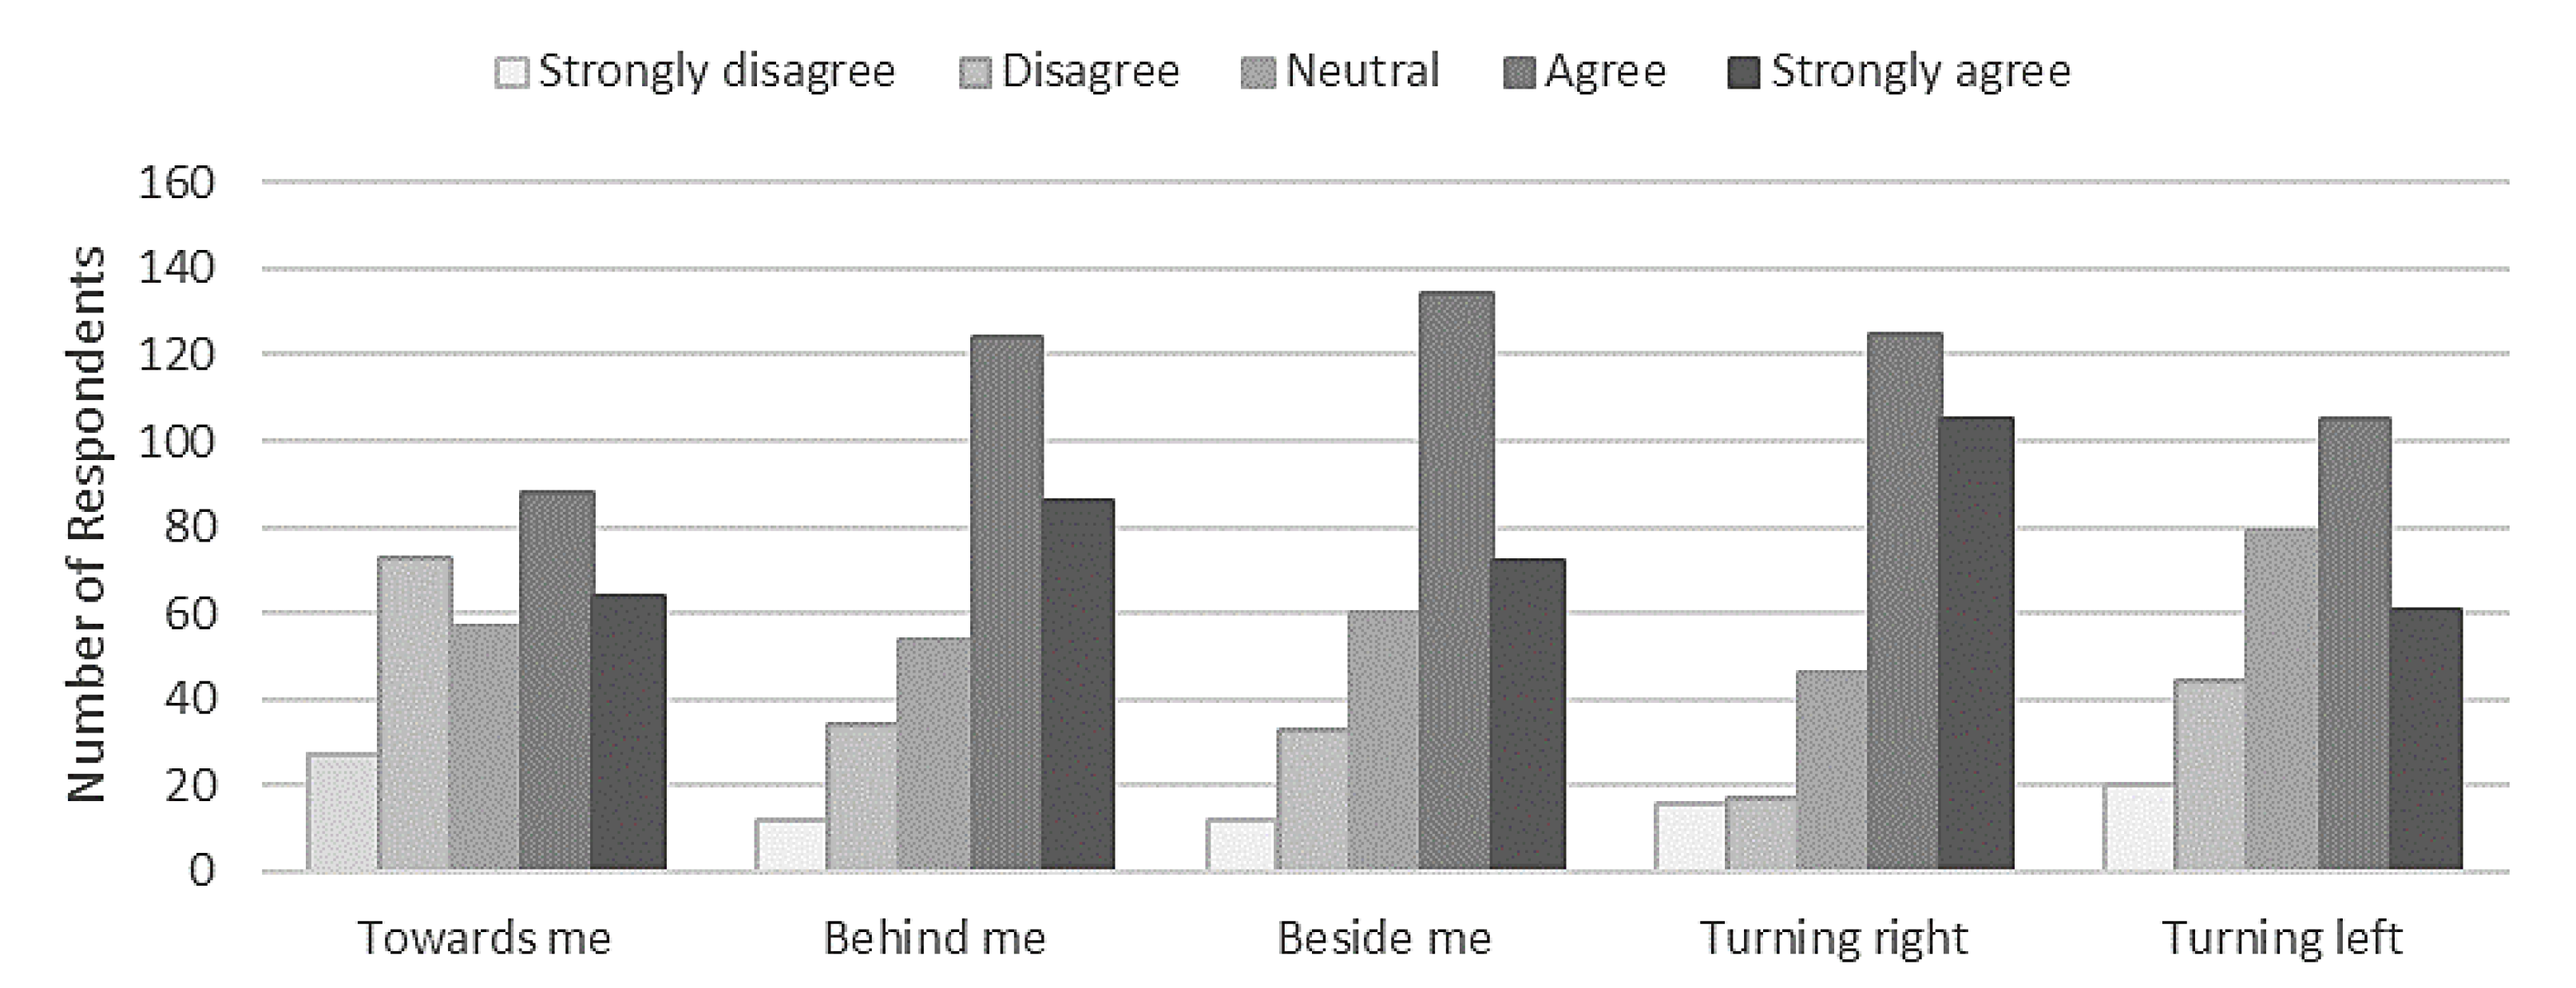
3.2.2. Rider’s Concern of Being Hit by a Vehicle

To understand how e-scooter riders view the threat of contact with a vehicle, survey respondents were asked on a 5-point Likert scale how much they agree/disagree with being concerned with the location of and being struck by a moving vehicle (e.g., “concerned with being hit by a moving vehicle driving behind me”), see Figure 2. For any respondents that reported living in countries that drive on the left side of the road, responses regarding left/right turning were re-coded to represent the corresponding situation in a scenario where cars drive on the right side of the road.
Overall, the number of respondents in the “agree” or “strongly agree” categories outweighed those in the “disagree” and “strongly disagree” categories for all scenarios. A Friedman Test observed a statistically significant difference in the degree of concern depending on the direction of the approaching vehicle, χ2(4) = 114.078, p < 0.001. Post-hoc analyses using Wilcoxon Signed Ranks Tests (Bonferroni-corrected, 0.05/10 = 0.005) observed significant differences between the directions of Towards and Behind (Z = −7.798, p < 0.001), Towards and Beside (Z = −6.349, p < 0.001), Towards and Turning right (Z = −8.107, p < 0.001), Behind and Turning left (Z = −4.306, p < 0.001), Beside and Turning right (Z = −3.567, p < 0.001), Beside and Turning left (Z = −3.705, p < 0.001), and Turning left and right (Z = −6.154, p < 0.001). There was no significant difference between Turning left and Towards, Behind and Besides, and Behind and Turning right (all p > 0.005). In general, the directions with the most concern were Turning right, Behind, and Besides, and the directions with the least concern were Towards and Turning left.

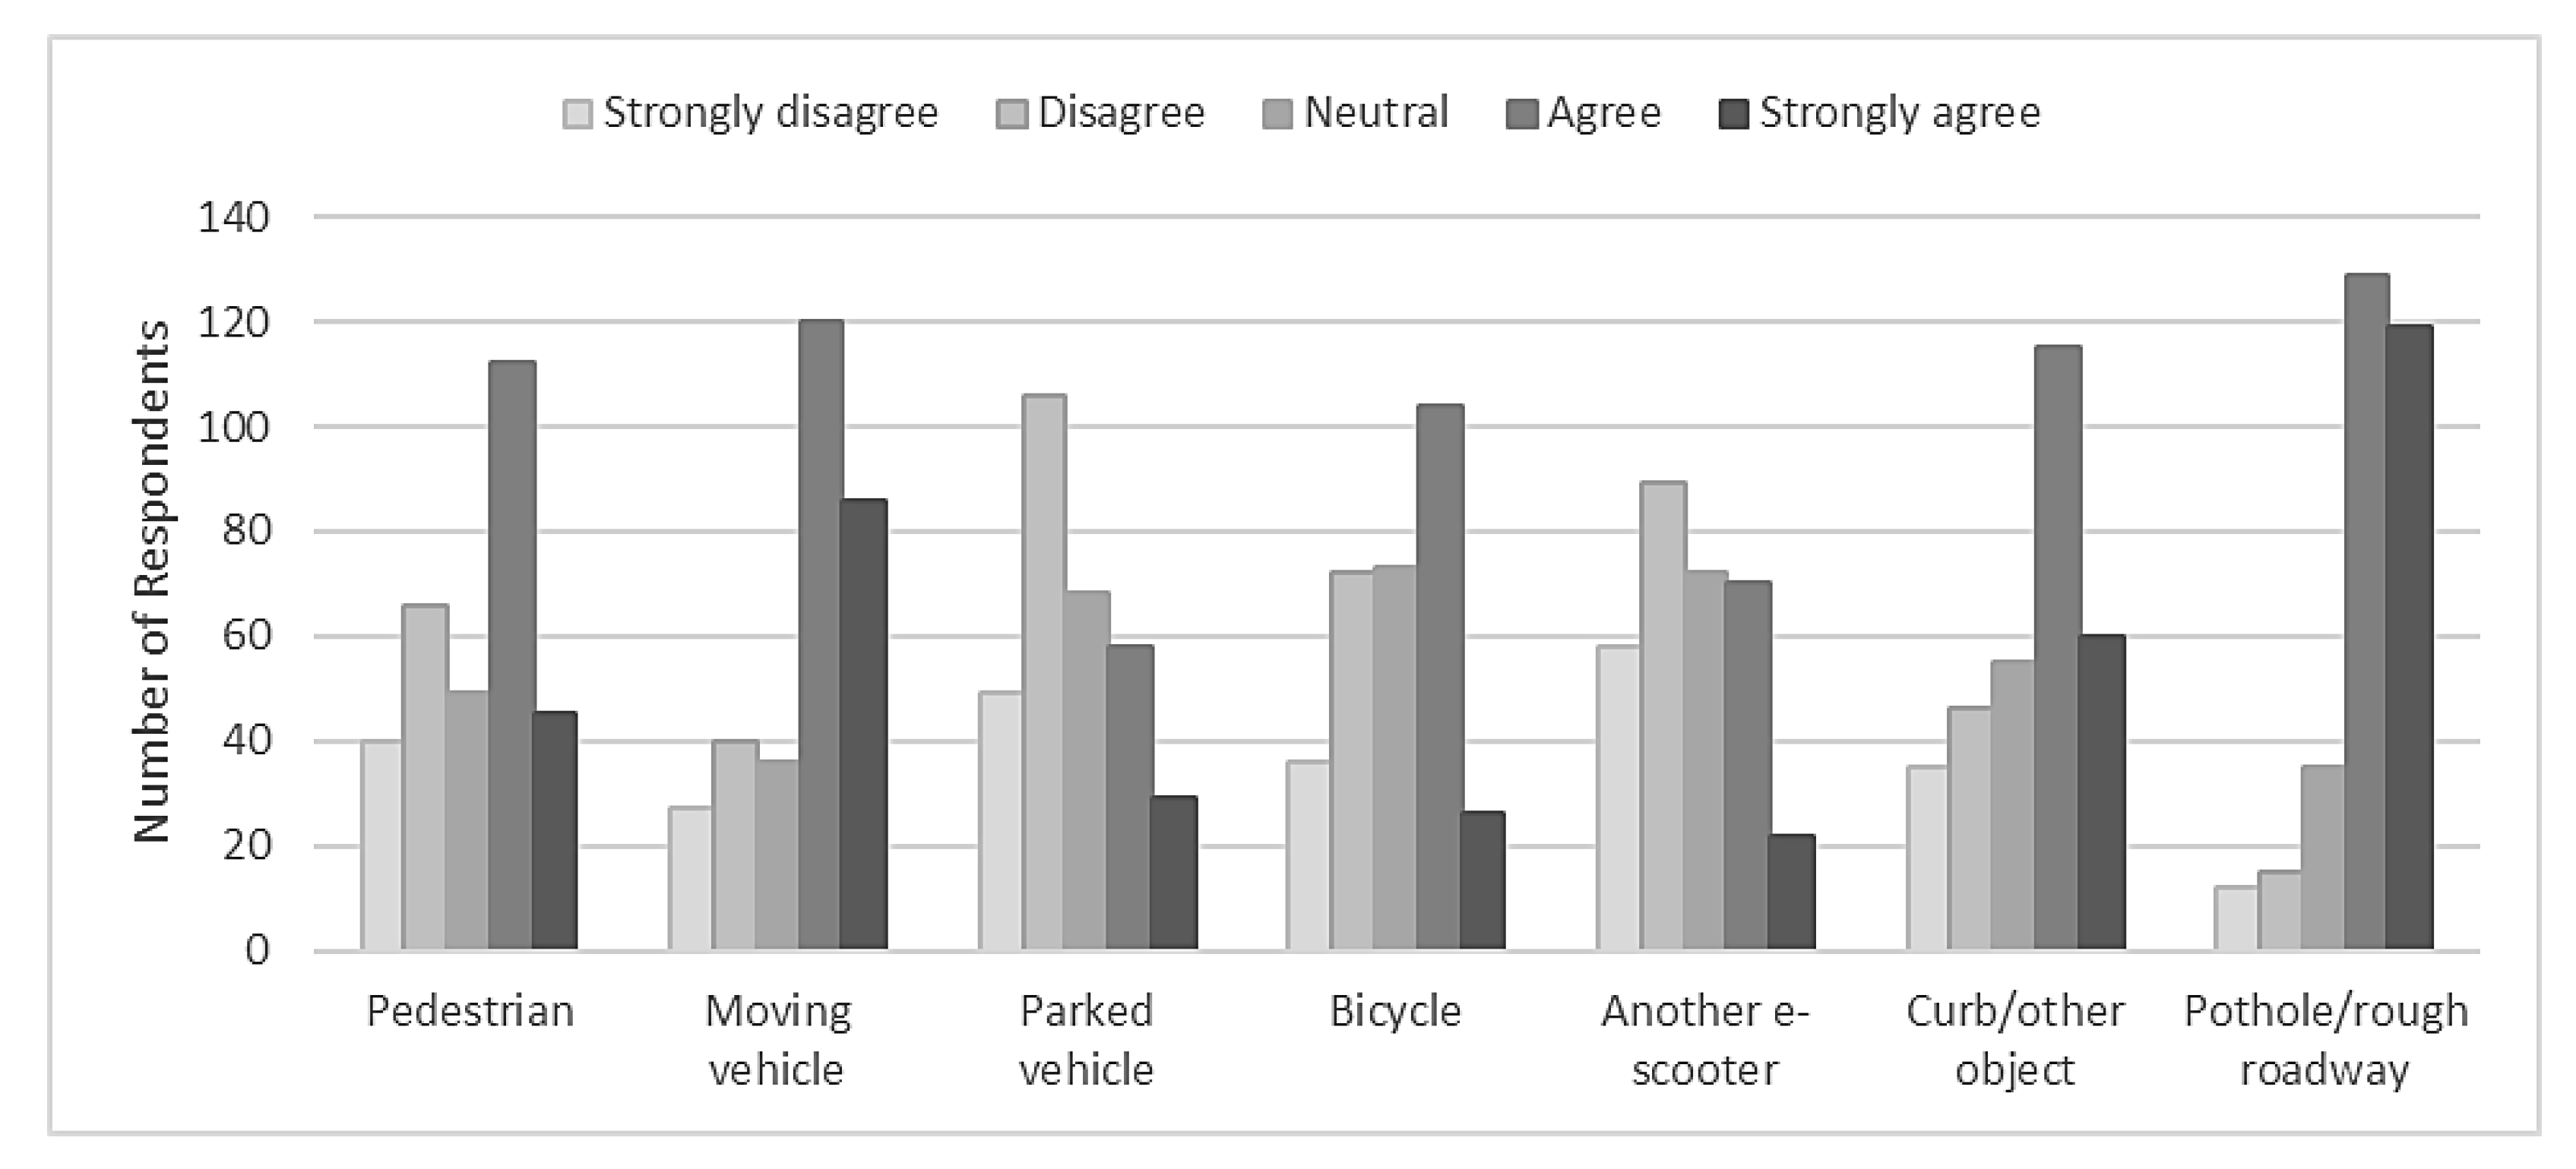
3.2.3. Rider Concern for Hitting Objects/Obstacles

Survey respondents were also asked on a 5-point Likert scale how much they agree/disagree with the statements regarding scenarios they might encounter while riding an e-scooter, such as running into a pedestrian or a bicycle.
Riders were most concerned about hitting a pothole/rough roadway, with 128 respondents agreeing and 119 respondents strongly agreeing, see Figure 3. A Friedman Test observed a difference in concern with respect to various objects, χ2(6) = 428.331, p < 0.001. Although there are too many categories to concisely report post-hoc analyses, multiple Wilcoxon Signed Ranks Tests observed that the concern with potholes and rough roadways was significantly greater than all other categories (all ps < 0.001). The next most frequent agreement response was a concern about hitting a moving vehicle, with 120 respondents agreeing and 86 respondents strongly agreeing. Riders also responded with some degree of concern for running into pedestrians, a moving vehicle, a bicycle, and a curb/other object. Riders tended not to be concerned with hitting a parked vehicle or another e-scooter.

3.3. Inferential Analyses

To test whether the Theory of Planned Behavior can help account for the frequency of helmet use, the ordinal measure of helmet frequency was the dependent variable. The survey group (1, 2, 3) was the first nominal independent variable to assess the effect of social norms. The median of the scores for concern about environmental features (potholes, curb) was calculated for an environmental safety attitude variable, and the median of the scores for objects in the road (cars, pedestrians, bicycles, etc.) were calculated for an object safety attitude variable. Finally, the frequency of e-scooter riding, as a measure of likely intention, was included as an ordinal independent variable.
A generalized linear model with a multinomial probability distribution and a cumulative logit link function was used, with the survey group, frequency of e-scooter riding, attitude toward environment safety, and attitude toward object safety entered as predictors. The goodness of fit of the model was AIC = 661.693, BIC = 699.282. The test of model effects indicated that the survey group was significant, Wald χ2 = 10.036, df = 2, p = 0.007. With the 3rd survey group (online e-scooter group) as the reference group, the first survey group (another online e-scooter group) did not significantly differ from the reference group, B = 0.003, SE = 0.2969, Wald χ2 = 0.000, df = 1, p = 0.993, Exp(B) = 1.003. The second survey group (casual users at the State Fair) did significantly differ from the reference group, B = −0.879, SE = 0.3736, Wald χ2 = 5.531, df = 1, p = 0.019, Exp(B) = 0.415. The participants in the 2nd survey group were less likely to use a helmet.
Attitude toward environment safety was not significantly associated with helmet use frequency, Wald χ2 = 1.740, df = 1, p = 0.187. Attitude toward object safety (vehicles, pedestrians, etc.) was significantly related to helmet use frequency, Wald χ2 = 4.156, df = 1, p = 0.041, B = 0.218, SE = 0.1070, Exp(B) = 1.244. The greater concern for object safety, the greater the helmet use frequency. Finally, the frequency of e-scooter use was still significantly associated with helmet use, as seen in Table 4, Wald χ2 = 49.361, df = 1, p < 0.001, B = 0.71, SE = 0.1010, Exp(B) = 2.034.

4. Discussion

4.1. General Discussion

The aim of this study was to gain insight into e-scooter rider behavior and preferences by recording survey responses directly from e-scooter riders. This was done by conducting three iterations of a survey of e-scooter riders to capture a variety of rider groups.
It was found that riders both preferred to ride on and felt safest on protected bike lanes, followed by sidewalks. It is worth noting that these two options dominated the other options, indicating that a large majority of all riders prefer to ride and/or feel safest on the same two types of roadway infrastructure, with protected bike lanes having a considerably larger proportion in both preference and safety perceptions. This is unsurprising as the other infrastructure options involved major/neighborhood streets or unprotected bike lanes. These other options all include the potential for dangerous interactions with vehicles as there is no barrier between riders and motor vehicles. This highlights riders’ intention to ride in places that create space between motor vehicles and themselves. As riders prefer to ride in protected bike lanes and sidewalks, this also suggests that e-scooter riders prioritize interactions with pedestrians and bicycles as less dangerous than interactions with motor vehicles. This choice may be seen as a logical trade-off by the e-scooter rider due to the significant size and momentum vehicles can possess as compared to bicycles or pedestrians. Interactions between cyclists and vehicles have been studied over time and have shown that the improvement of infrastructure for cyclists in terms of safety perceptions has an influence on the desire to ride [28]. Similar impacts on the desire to ride an e-scooter could be affected by the safety perceptions of the infrastructure with which to ride on. Having a safe infrastructure to ride on should be considered key in promoting these types of micromobility.
Notably, there was a common agreement among riders regarding a concern about hitting pedestrians while riding. However, the concern regarding motor vehicles was greater and had consistent agreement across all motor vehicle conflict scenarios (vehicle coming towards the rider, vehicle behind rider, vehicle beside rider, vehicle turning right, and vehicle turning left). This again highlights the overall perception of risk regarding vehicles. Rider concern with vehicle interactions is understandable, as the US Consumer Product Safety Commission reported a total of 27 deaths of e-scooter riders from 2017–2019, with 20 of those 27 deaths involving motor vehicles [29]. Implementing more protected bike lanes would not only help to reduce risks of e-scooter-motor vehicle collisions but may also change rider behavior to ride less frequently on sidewalks and provide them with more opportunities to ride where they reportedly feel safest. Protected bike lanes may reduce many opportunities for collision with motor vehicles, but intersections still present high risks and concerns for e-scooter riders, particularly regarding right-turning vehicles. In areas experiencing high volumes of both e-scooter and bicycle riders, installing protected intersections may be an effective countermeasure to reduce collision risks. This intersection design leverages corner refuge islands to improve sightlines for drivers and extend protected bike lanes further into the intersection [30].
Understanding that riders perceive safety risks associated with nearly all types of interactions with vehicles can help guide future roadway recommendations to address interactions with vehicles. Implementing more protected bike lanes would not only help to reduce risks of e-scooter-motor vehicle collisions but may also change rider behavior to ride less frequently on sidewalks and provide them with more opportunities to ride where they reportedly feel safest. In some places, there are laws or guidelines stating that e-scooters should or cannot legally ride on sidewalks [31]. This is likely due to the general perception supported by research findings that e-scooter riders may pose a risk to pedestrians when they ride on sidewalks [11]. In a scenario where there is no option to ride in a protected bike lane, riders may have to weigh the risk of breaking the law and potentially endangering pedestrians with the risk of riding close to vehicles. It is not unfathomable how one might choose to ride on the sidewalk in this situation. Understanding the rider perspective sheds light on why they may be choosing to ride on the sidewalk, and providing better alternatives to sidewalk riding may eliminate the scenario where an e-scooter rider must choose between non-ideal options. This situation highlights the need for the design of “complete streets” that accommodate all types of users of the larger transportation system, not just optimizing for one type or another [32]. Protected bike lanes may reduce many opportunities for collision with motor vehicles, but intersections still present high risks and concerns for e-scooter riders, particularly regarding right-turning vehicles. In areas experiencing high volumes of both e-scooter and bicycle riders, installing protected intersections may be an effective countermeasure to reduce collision risks. This intersection design leverages corner refuge islands to improve sightlines for drivers and extend protected bike lanes further into the intersection [30].
As far as running into objects or obstacles, riders were most concerned with potholes/rough roadway, followed by moving vehicles. There was also a notable level of concern for running into pedestrians, curbs/other objects, and bicycles as well. Riders being concerned with running into moving vehicles echoes the concern mentioned earlier for interactions with moving vehicles. Riders being concerned with rough roadways highlights that existing infrastructure may not be suitable or optimal for safe e-scooter riding, given the current design of e-scooters. A study conducted previously using naturalistic riding data collection methods characterized the riding risk of different types of infrastructure [33]. They found that compared to bicycle riding, more severe vibration events occurred, regardless of pavement type. Experiencing severe vibration events could cause loss of control or crashes. Design changes to e-scooters could reduce the severity of vibration events experienced and reduce the rider’s concern about navigating rough roadways. The study analysis leveraging the theory of boundary of acceptable performance suggests that riders’ sensitivities to these environmental risks may increase safety-preference disagreements in their infrastructure use decisions. This may be, in part, explained by the rider’s preferences for comfort during riding (i.e., lower vibrations or potholes) over safer routes with lower comfort levels or lower travel efficiency.
In terms of helmet-wearing behavior, we found a significant trend of infrequent riders wearing helmets much less often than more frequent riders (Table 4). This trend is unsurprising as many infrequent riders may spontaneously decide to ride e-scooters and, therefore, are likely to not have a helmet with them when they choose to ride. On the other hand, frequent riders may have their rides pre-planned and have access to a helmet when they ride. Frequent riders may even own their own e-scooter and thus have helmets available for planned use. Additionally, more frequent riders may understand the potential risks associated with e-scooter riding, particularly regarding dangerous interactions with motor vehicles, and therefore may be more likely to wear a helmet during rides.
The Theory of Planned Behavior may help to explain how closing the helmet gap between frequent and infrequent riders may be difficult. Even if infrequent riders possess safety attitudes that are generally accepting of helmet wearing in other contexts (e.g., bicycle riding), rideshare e-scooters are presented without helmets and thus may present a social norm that suggests that helmet wearing is not expected nor commonly practiced by their peers. Further, for spontaneous riders, perceived behavioral control may be impinged by limited access to helmets on short notice. This is in line with Quine and colleagues’ [25] findings that subjective norms and perceived behavioral control are predictive of behavioral intention to wear helmets, while attitudes are less predictive of behaviors. Helmet vending machines have been introduced as a solution to this problem among bicycle riders, with the first one appearing in the United States in 2013 [34]; however, vending machines have not become widely available across that country. Further, while this concept may have better opportunities to serve bicycle rideshare users with more commonly concentrated hubs for pick up and return, the e-scooter ridesharing concept is far too transient and dispersed to consistently provide helmet service at predetermined locations. Preventing falls and crashes may be a more attainable solution than protecting against injuries when crashes happen.

4.2. Key Policymaker Considerations

The findings and conclusions of this study may be used to inform policymakers as they consider how to incorporate e-scooters into our larger transportation system. These key points are summarized and listed below.
Being physically separated from motor vehicles is important to e-scooter riders.
Implementing more protected bike lanes would not only help to reduce risks of e-scooter-motor vehicle collisions but may also change rider behavior to less frequently ride on sidewalks where pedestrian and e-scooter interactions can cause injury.
Perceptions of safety can influence the desire to ride, which is important to consider when promoting micromobility.
Infrequent riders wear helmets much less than frequent riders, which could likely be due to the lack of helmet availability for rideshare e-scooters. Because of this, preventing falls and crashes may be a more attainable solution than protecting against injuries when crashes happen.

4.3. Limitations

The three iterations of the survey itself, along with the two methods for data collection, may add additional confounding factors to the data collected and limit the generalizability of the data. Namely, the first and third iterations largely relied on e-scooter-centric message boards and social media accounts, which likely oversampled high-frequency riders and e-scooter owners and under-sampled infrequent e-scooter riders, such as tourists. Additionally, while all respondents voluntarily participated in the survey, respondents in the first and third iterations were not compensated for their participation in the survey, while respondents in the second iteration were incentivized to participate with a backpack (value of $1.75 U.S. dollars).
Another limitation was that respondents were not asked if they privately own an e-scooter or if they primarily ride on shared e-scooters, and therefore any differences due to e-scooter ownership as opposed to ridesharing were not able to be considered.
All three iterations included a proportion of Minnesota-based respondents, and while responses were collected from other states within the U.S. and other countries around the world, these responses may not properly sample e-scooter riding patterns of these areas, particularly in more temperate regions, e.g., sunbelt states, which are less impacted with seasonal riding patterns as is Minnesota. Additionally, each survey iteration took place at a different time within the year and therefore occurred in different seasons. Participants were asked to recall their riding habits when the weather permits, but responses may have been limited due to inaccurate or biased recall. Weather conditions can impact e-scooter usage [35], and these effects were not considered among the different iterations of the survey.
A proportion (22.5%) of the responses were from international e-scooter riders, and there could be differences for these respondents in terms of various aspects such as, but not limited to, traffic laws, roadway infrastructure, or cultural attitudes. Potential differences in these areas were not evaluated in this study.

4.4. Future Research

Further research into how roadway infrastructure and policies could support safe e-scooter riding would be beneficial for the safety of e-scooters as well as other participants in the transportation ecosystem. Additionally, research on e-scooter riders who own an e-scooter as opposed to riders who choose to use rideshare scooters could provide useful insights that could help policymakers understand and support different types of riders. Future research into how weather impacts e-scooter riders and their perceptions of safety and riding preferences could add to existing research that examines micromobility and weather considerations. Finally, it would be useful to know whether the rider’s concerns here match that of actual accidents and injuries. Preliminary work has observed greater crash risk for riding on non-paved roads, consistent with the concern with rough roads and potholes reported here, as well as a heightened risk of riding on sidewalks and the protective factor of riding in a protected bike lane [27], reflecting both an inconsistency (sidewalks) and consistency (protected bike lane) with rider attitudes reported here. However, the preliminary analysis was not able to determine if riders increased concerns with right-turning vehicles matched actual risks, as compared to crash and injury risks with left-turning vehicles and should be further explored.

5. Conclusions

Previous research concerning e-scooter safety perceptions has been limited. The findings from this study highlight e-scooter riders’ preference to ride on and feel safest riding on protected bike lanes followed by sidewalks. Additionally, riders have high levels of concerns in general about being hit or hitting moving vehicles. Riders also have high levels of concern about running into rough roadways/potholes. This suggests that existing roadway infrastructure may pose challenges for riders in riding safely on the e-scooter, requiring rider-selected workarounds such as riding on the sidewalk. Public policy may consider emphasizing the development of protected bicycle lanes, which would allow e-scooter riders to ride where they prefer to ride (and feel safest), which may reduce the amount of e-scooter riding that occurs on sidewalks that endangers pedestrians. This study also found that more frequent riders tend to wear helmets, while infrequent riders are less likely to wear helmets. Many infrequent riders may be choosing to ride spontaneously via an e-scooter rental service and, therefore, may not have a helmet with them. Requiring a helmet be worn for spontaneous riding situations may not be realistic, as shown by the infrequent riders who do not wear helmets. Decreasing the risks associated with riding e-scooters may be a more effective way to decrease injuries, instead of relying on protective equipment to prevent injuries during a fall or crash.

Author Contributions

Conceptualization, K.S., N.L.M. and C.M.C.; methodology, K.S., M.R. and N.L.M.; investigation, K.S. and M.R.; formal analysis, K.S. and C.M.C.; writing—original draft preparation, K.S.; writing—review and editing, C.M.C. and N.L.M.; supervision, C.M.C. and N.L.M.; project administration, N.L.M.; funding acquisition, C.M.C. and N.L.M. All authors have read and agreed to the published version of the manuscript.

Funding

The study was funded by the National Science Foundation, CPS-Cyber-Physical Systems, Award Number: CMMI-2038403.

Institutional Review Board Statement

The study was conducted in accordance with the Declaration of Helsinki and approved by the Institutional Review Board of the University of Minnesota—Twin Cities (protocol codes STUDY00012264 (19 February 2021) and STUDY00013282 (26 June 2021)) for studies involving humans.

Informed Consent Statement

Informed consent was obtained from all subjects involved in the study.

Data Availability Statement

Data may be obtained upon reasonable request and are not publicly available.

Acknowledgments

The authors thank Rajesh Rajamani and Peter A. Easterlund for their contributions and guidance in this work.

Conflicts of Interest

The contents and interpretations of this effort are solely the responsibility of the authors. There is no conflict of interest with the funding agency, the University of Minnesota, or other associated entities.

References

  1. National Association of City Transportation Officials. Guidelines for Regulating Shared Micromobility Section 1 Guidelines for Regulating Shared Micromobility; National Association of City Transportation Officials: New York, NY, USA, 2019. [Google Scholar]
  2. Zhang, W.; Buehler, R.; Broaddus, A.; Sweeney, T. What type of infrastructures do e-scooter riders prefer? A route choice model. Transp. Res. D Transp. Environ. 2021, 94, 102761. [Google Scholar] [CrossRef]
  3. Christoforou, Z.; Bortoli, A.; De Gioldasis, C.; Seidowsky, R. Who is using e-scooters and how? Evidence from Paris. Transp. Res. Part D 2021, 92, 102708. [Google Scholar] [CrossRef]
  4. Austin Public Health. Dockless Electric Scooter-Related Injuries Study. 2019. Available online: https://www.austintexas.gov/sites/default/files/files/Health/Epidemiology/APH_Dockless_Electric_Scooter_Study_5-2-19.pdf (accessed on 17 August 2022).
  5. Bekhit, M.N.Z.; Le Fevre, J.; Bergin, C.J. Regional healthcare costs and burden of injury associated with electric scooters. Injury 2019, 51, 271–277. [Google Scholar] [CrossRef] [PubMed]
  6. Blomberg, S.N.F.; Rosenkrantz, O.C.M.; Lippert, F.; Christensen, H.C. Injury from electric scooters in Copenhagen: A retrospective cohort study. BMJ Open 2019, 9, e033988. [Google Scholar] [CrossRef] [PubMed]
  7. Bloom, M.B.; Noorzad, A.; Lin, C.; Little, M.; Lee, E.Y.; Margulies, D.R.; Torbati, S.S. Standing electric scooter injuries: Impact on a community. Am. J. Surg. 2021, 221, 227–232. [Google Scholar] [CrossRef]
  8. Brownson, A.; Fagan, P.; Dickson, S.; Civil, I. Electric scooter injuries at Auckland City Hospital. N. Z. Med. J. 2019, 132, 62–72. Available online: https://pubmed.ncbi.nlm.nih.gov/31697664/ (accessed on 1 March 2023). [PubMed]
  9. Calgary Committee on Transportation and Transit. Shared E-Bike and E-Scooter Final Pilot Report. 1–28. Available online: https://www.calgary.ca/transportation/tp/cycling/cycling-strategy/shared-electric-scooter-pilot.html (accessed on 28 January 2023).
  10. Cicchino, J.B.; Kulie, P.E.; McCarthy, M.L. Injuries related to electric scooter and bicycle use in a Washington, DC, emergency department. Traffic Inj. Prev. 2021, 22, 401–406. [Google Scholar] [CrossRef] [PubMed]
  11. Cicchino, J.B.; Kulie, P.E.; McCarthy, M.L. Severity of e-scooter rider injuries associated with trip characteristics. J. Safety Res. 2021, 76, 256–261. [Google Scholar] [CrossRef]
  12. Dhillon, N.K.; Juillard, C.; Barmparas, G.; Lin, T.-L.; Kim, D.Y.; Turay, D.; Seibold, A.R.; Kaminski, S.; Duncan, T.K.; Diaz, G.; et al. Electric Scooter Injury in Southern California Trauma Centers. J. Am. Coll. Surg. 2020, 231, 133–138. [Google Scholar] [CrossRef]
  13. Farley, K.X.; Aizpuru, M.; Wilson, J.M.; Daly, C.A.; Xerogeanes, J.; Gottschalk, M.B.; Wagner, E.R. Estimated Incidence of Electric Scooter Injuries in the US From 2014 to 2019. JAMA Netw. Open 2020, 3, e2014500. [Google Scholar] [CrossRef]
  14. Liew, Y.; Wee, C.; Pek, J. New peril on our roads: A retrospective study of electric scooter-related injuries. Singap. Med. J. 2019, 61, 92–95. [Google Scholar] [CrossRef] [PubMed]
  15. Portland Bureau of Transportation. 2018 E-Scooter Findings Report. Available online: https://www.portland.gov/transportation/escooterpdx/documents (accessed on 12 December 2022).
  16. Shah, N.R.; Aryal, S.; Wen, Y.; Cherry, C.R. Comparison of motor vehicle-involved e-scooter and bicycle crashes using standardized crash typology. J. Safety Res. 2021, 77, 217–228. [Google Scholar] [CrossRef] [PubMed]
  17. Störmann, P.; Klug, A.; Nau, C.; Verboket, R.D.; Leiblein, M.; Müller, D.; Schweigkofler, U.; Hoffmann, R.; Marzi, I.; Lustenberger, T. Characteristics and Injury Patterns in Electric-Scooter Related Accidents—A Prospective Two-Center Report from Germany. J. Clin. Med. 2020, 9, 1569. [Google Scholar] [CrossRef] [PubMed]
  18. Trivedi, T.K.; Liu, C.; Antonio, A.L.M.; Wheaton, N.; Kreger, V.; Yap, A.; Schriger, D.; Elmore, J.G. Injuries Associated with Standing Electric Scooter Use. JAMA Netw. Open 2019, 2, e187381. [Google Scholar] [CrossRef]
  19. Yang, H.; Ma, Q.; Wang, Z.; Cai, Q.; Xie, K.; Yang, D. Safety of micro-mobility: Analysis of E-Scooter crashes by mining news reports. Accid. Anal. Prev. 2020, 143, 105608. [Google Scholar] [CrossRef]
  20. Glavić, D.; Trpković, A.; Milenković, M.; Jevremović, S. The E-Scooter Potential to Change Urban Mobility—Belgrade Case Study. Sustainability 2021, 13, 5948. [Google Scholar] [CrossRef]
  21. Buehler, R.; Broaddus, A.; Sweeney, T.; Zhang, W.; White, E.; Mollenhauer, M. Changes in Travel Behavior, Attitudes, and Preferences among E-Scooter Riders and Nonriders: First Look at Results from Pre and Post E-Scooter System Launch Surveys at Virginia Tech. Transp. Res. Rec. 2021, 2675, 036119812110022. [Google Scholar] [CrossRef]
  22. Dibaj, S.; Hosseinzadeh, A.; Mladenović, M.N.; Kluger, R. Where Have Shared E-Scooters Taken Us So Far? A Review of Mobility Patterns, Usage Frequency, and Personas. Sustainability 2021, 13, 11792. [Google Scholar] [CrossRef]
  23. Laa, B.; Leth, U. Survey of E-scooter users in Vienna: Who they are and how they ride. J. Transp. Geogr. 2020, 89, 102874. [Google Scholar] [CrossRef]
  24. Ajzen, I. The theory of planned behavior. Organ. Behav Hum. Decis. Process. 1991, 50, 179–211. [Google Scholar] [CrossRef]
  25. Quine, L.; Rutter, D.R.; Arnold, L. Predicting and understanding safety helmet use among schoolboy cyclists: A comparison of the theory of planned behaviour and the health belief model. Psychol. Health 1998, 13, 251–269. [Google Scholar] [CrossRef]
  26. National Highway Traffic Safety Administration. MMUCC Guideline: Model Minimum Uniform Crash Criteria Fifth Edition (2017); Report No. DOT HS 812 433; National Highway Traffic Safety Administration: Washington, DC, USA, 2017.
  27. Tian, D.; Ryan, A.D.; Craig, C.M.; Sievert, K.; Morris, N.L. Characteristics and risk factors for electric scooter-related crashes and injury crashes among scooter riders: A two-phase survey study. Int. J. Environ. Res. Public Health 2022, 19, 10129. [Google Scholar] [CrossRef] [PubMed]
  28. Scarano, A.; Aria, M.; Mauriello, F.; Riccardi, M.R.; Montella, A. Systematic Literature Review of 10 Years of Cyclist Safety Research. Accid. Anal. Prev. 2023, 184, 106996. [Google Scholar] [CrossRef]
  29. Tark, J. Micromobility Products-Related Deaths, Injuries, and Hazard Patterns: 2017–2019; US Consumer Product Safety Commission: Bethesda, MD, USA, 2020.
  30. Falbo, N. Protected Intersections for Bicyclists. Available online: http://www.protectedintersection.com/wp-content/uploads/2014/02/Falbo_ProtectedIntersection_Transcript1.pdf (accessed on 13 January 2023).
  31. Peace, R. eScooter Laws and Regulations in the USA|Electric Bike Report|Electric Bike, Ebikes, Electric Bicycles, E Bike, Reviews. Available online: https://electricbikereport.com/electric-scooter-laws-and-regulations/ (accessed on 21 February 2023).
  32. Lenker, J.A.; Maisel, J.L.; Ranahan, M.E. Assessing the implementation of complete streets projects. J. Archit. Plan. Res. 2016, 33, 199–212. [Google Scholar]
  33. Ma, Q.; Yang, H.; Mayhue, A.; Sun, Y.; Huang, Z.; Ma, Y. E-Scooter safety: The riding risk analysis based on mobile sensing data. Accid. Anal. Prev. 2021, 151, 105954. [Google Scholar] [CrossRef] [PubMed]
  34. Schlesinger, P. Boston Opens Country’s First Helmet Vending Machine for Bikers. Travel + Leisure. 19 November. Available online: https://www.travelandleisure.com/trip-ideas/boston-opens-countrys-first-helmet-vending-machine-for-bikers (accessed on 21 July 2022).
  35. Noland, R.B. Scootin’ in the Rain: Does Weather Affect Micromobility? Transp. Res. Part A Policy Pract. 2021, 149, 114–123. [Google Scholar] [CrossRef]
Figure 1. Percentage of respondents indicating where e-scooters prefer to ride and feel safest (N = 322).
Sustainability 15 06609 g001
Figure 2. How many e-scooter riders agreed/disagreed with the concern of moving vehicles hitting them in various vehicle driving situations (N = 309).
Sustainability 15 06609 g002
Figure 3. How many e-scooter riders agreed/disagreed with the concern of running into various objects/obstacles (N = 309).
Sustainability 15 06609 g003
Table 1. Gender, Age, and Location Demographics (frequency and percentage).
Survey 1Survey 2Survey 3Total
Gender
Female52 (33.3%)52 (52.5%)11 (14.7%)115 (35.0%)
Male99 (63.5%)45 (45.5%)62 (82.7%)206 (62.5%)
Other1 (<1%)2 (2.0%)2 (2.7%)8 (2.4%)
Age
18–2549 (31.4%)62 (64.3%)12 (16.4%)124 (37.9%)
26–4072 (46.3%)35 (19.4%)35 (47.9%)126 (38.5%)
41–6433 (21.1%)24 (14.3%)24 (32.9%)71 (21.7%)
65+2 (1.3%)2 (2.0%)2 (2.7%)6 (1.8%)
Location
US93 (59.6%)98 (99.0%)42 (56.8%)233 (70.8%)
MN21 (19.9%)92 (92.9%)3 (4.1%)126 (38.3%)
International42 (26.9%)0 (0%)32 (43.2%)74 (22.5%)
No response21 (13.5%)1 (1.0%)0 (0%)22 (6.7%)
Table 2. Rider Experience and Frequency of Riding (frequency and percentage).
Previous E-Scooter ExperienceSurvey 1Survey 2Survey 3Total
1–551 (32.9%) 70 (70.7%) 4 (5.4%) 126 (38.3%)
6–1017 (11.0%) 14 (14.1%)6 (8.1%) 37 (11.3%)
11–2011 (7.1%) 7 (7.1%)5 (6.8%) 23 (7.1%)
21+76 (49.0%) 8 (8.1%)59 (79.7%) 143 (43.6%)
Frequency of Riding
Infrequently (<monthly)58 (37.1%) 75 (75.8%) 3 (4.1%)136 (41.3%)
Monthly10 (6.4%)12 (12.1%)4 (5.4%)26 (7.9%)
Weekly20 (12.8%) 8 (8.1%) 19 (25.7%)47 (14.3%)
Daily or almost daily68 (43.6%) 4 (4.0%) 48 (64.9%)120 (36.5%)
Table 3. Helmet Wearing Behavior Frequency Across Surveys.
Helmet Wearing BehaviorCount and Percentage
Never124 (39.3%)
Very Rarely21 (6.6%)
Rarely13 (4.1%)
Occasionally22 (7.0%)
Very Frequently33 (10.4%)
Always103 (32.6%)
TotalN = 316
Table 4. Helmet Wearing Behavior and Frequency of Riding.
Frequency of Riding
Helmet Wearing BehaviorInfrequently (<Monthly)MonthlyWeeklyDaily or Almost Daily
Never77171416
Very Rarely15141
Rarely8203
Occasionally9157
Very Frequently83418
Always1511968
Disclaimer/Publisher’s Note: The statements, opinions and data contained in all publications are solely those of the individual author(s) and contributor(s) and not of MDPI and/or the editor(s). MDPI and/or the editor(s) disclaim responsibility for any injury to people or property resulting from any ideas, methods, instructions or products referred to in the content.

