1. Introduction and Previous Work
1.1. Parking Management and Pricing
Parking management and pricing polices aim at reducing demand on parking places, reducing negative impacts of transport, improving the urban environment, and encouraging travel demand management in urban areas [
1]. These aims are key in any successful transportation planning process. Parking pricing measures have proved successful in influencing travel behavior and reducing car dependency [
2,
3]. The cost of parking and the travel time spent to find a parking spot are two very important attributes for all drivers. These two factors can influence people’s decisions in choosing not only the travel destination and time of travel but also the travel mode.
The policy implications of parking management have been investigated very widely in the literature [
4,
5]. Research investigations include optimal routing and the shortest paths of vehicles to the parking locations [
6], parking pricing and time restrictions measures, parking policies [
7,
8], shared parking facilities [
9,
10], and the planning and design of on-parking facilities [
11]. Pricing measures have been recognized as a very effective a way to alleviate traffic congestion and environmental impacts [
2]. Parking pricing measures therefore represent an important component in travel demand management programs (TDM), which are the main emphasis of any local authority transport plans.
The willingness to pay to park is often investigated for assessment by decision makers and cities to implement the appropriate parking charges that are both resourcefully effective and publicly acceptable [
12,
13]. The average time spent to find a parking spot is a good indication of the level of congestion and demand on parking facilities. For example, in the UK, 6 min and 45 s was reported as the average search time for a parking place, with high variation resulting in searches up to 20 min at some locations [
14]. Not many studies have been carried out in the Kingdom of Saudi Arabia (KSA) regarding demand on parking facilities, search time for a parking space, or willingness to pay for parking charges. In fact, most parking facilities in the Kingdom are currently free, apart from very privileged parking facilities that are highly expensive and exclusive.
1.2. Riyadh City
The focus of this investigation is the city of Riyadh, the capital of the Kingdom of Saudi Arabia (KSA). The population of the city grew from 40,000 inhabitants in 1935 and 83,000 in 1949 to over 7.5 million inhabitants in 2019, making it the most populated city in the Kingdom. Of the population, about 64.19% are Saudis, while the expatriates account for 35.81%. Of the total population, 43.3% are females, and the population density is 2379 inhabitants per square kilometer. The 40-mile span of Riyadh includes 13 municipalities that accommodate 209 districts [
15].
The current public transport system in Riyadh City involves buses run by the Saudi Public Transport authorities [
16,
17]. These started operation in 1979, aiming to run high-level bus services locally and across neighboring countries such as the Arab Gulf countries, Jordan, Turkey, and Syria. There have been many fluctuations in the level of service and patronage of public transportation in the country since then, but what is most clear is that the demand for the public transportation system is very limited. About 85% of 8 million daily trips are carried out by private cars, whereas just 2% of trips are undertaken by buses [
16,
17]. Between 1996 and 2018, private vehicle ownership increased by over 200%. Until recently, the vast majority of the Riyadh population had never used public transportation; instead, they completely rely on private cars for all of their travel. With the new vision 2030, the city’s authorities are moving fast from the conventional predict-and-provide to predict-and-manage. Therefore, building new roads and providing for car usage is no longer the first preference for the authorities. The Riyadh metro which is planned to be the backbone of the city’s public transport system is under construction with plans to open in 2023. The metro system has six lines of a total length of 178 km and 85 metro stations integrated with 1200 km bus networks. Riyadh Metro will improve the existing infrastructure for public transportation, enhance accessibility to and from transit stations, develop transit-oriented development sites, and implement parking charges. In addition, the city of Riyadh is investing a huge amount of resources in order to encourage more use of public transportation systems and reduce car dependency.
1.3. Logistic Regression Analysis
Logistic regression analysis is a very widely used technique when it comes to assessing relationships between a dependent variable and one or more independent variables [
18]. In regression analysis, the dependent variable is often discrete, with one or more possible options, and is considered binary or with multiple classes. This type of analysis uses linear regression techniques and results in a logit function that best fits the collected data which describe the relationship between the dependent variable and a number of independent variables. In regression analysis, when the dependent variable Y is a continuous variable, then:
where f (x) is linear in the parameters function and ε is the error term that follows a distribution such as Gamma or Weibull [
18,
19]. While binary logistic regression allows for two classes of the dependent variable, multinomial logistic regression allows for more than two classes of dependent variables. The calibration of a binary or multinomial logistic regression model (with dependent variable classes) involves the calibration of the independent coefficients that predict the probability of the outcome of interest. The linear term in the parameters function of probabilities is given by the following expression [
20]:
The coefficients in the logistic regression give information as to how much the logit changes depending on the independent variable values. This is applicable for two events but when there are more than two events, this binary logistic regression can be extended. The term on the left-hand side is referred to as a logit function. It is the log of the odds that an event occurs.
The logit model (binary or multiple) is often estimated using maximum likelihood estimation methods. These methods estimate the values of the parameters of an assumed probability distribution, given some observed data [
19]. Regression techniques are also used to evaluate participants’ willingness to pay (WTP) towards transportation services including, for example, towards varying levels of parking charges and the likely use of parking locations [
21].
Where the dependent variable is ordinal, the logistic regression analysis is referred to as an ordinal logistic regression (OLR). When there is a systematic order in the dependent variable classes or categories, the ordinal logistic regression can be used to predict the dependent variable as a function of the independent variables. OLR models can be utilized to analyze willingness to pay for services and amenities. In order to calibrate an ordinal logistic regression model, the number of levels of the dependent variable has to be determined; then, a set of regression coefficients that predict the probability of the outcome of interest are calibrated [
22,
23].
The mathematical formula for the odds of proportional outcomes of the OLR can then be written:
Linear regression, logistic regression, and ORL models and analysis have been very widely used in many applications in the transportation field. In this study, the analysis is carried out using ordinal logistic regression analysis techniques.
One of the main assumptions of the ordinal logistic regression is that all slopes of the coefficients of the dependent variable across all categories are equal. This is usually tested using the parallel line test or the Brant test. The test basically assesses whether the observed deviations from the ordinal logistic regression model are larger than what would be due to chance only. In our case, a comparison of the ordinal model estimates with one set of coefficient estimates for all categories of each of the independent variables (i.e., null hypothesis of the ordered model) is compared with a model that has a separate set of coefficients for each category (referred to here as the “general model”). If the general model gives a significantly better fit to the data than the proportional odds model, then the assumption of the ordered model will be rejected. Otherwise, the assumptions of the ordered model will be accepted.
The structure of this paper is as follows.
Section 2 is devoted to methodology. The results and analysis of the results are presented in
Section 3.
Section 4 provides a willingness-to-pay (WTP) analysis. The final conclusions and implications are reported in
Section 5, while the limitations of this research are discussed in
Section 6.
2. Methodology
2.1. Experiment Design
In this research, participants’ willingness to pay to save search time for a parking space at shopping mall car parks in Riyadh city was investigated. A questionnaire has been designed and implemented to collect data on drivers’ preferred shopping mall, time spent searching for a parking place, frequencies of going out for shopping/recreation where they need to park their vehicles, and their socio-economic data which include age, gender, education, employment, individual income, and car ownership per household. The questionnaire also included a stated preference (SP) design to assess the shoppers’ willingness to pay a parking charge to save search time for a parking space at their preferred shopping centers.
A total of 394 participants, who are Saudi nationals, took part in a survey at three shopping malls in Riyadh. The reason for selecting Saudi nationals is that parking charges are not common in Saudi Arabia, and therefore unlike the non-Saudi nationals, the Saudi population are not familiar with the concept of parking charges. The study is also concerned with car drivers; therefore, only participants who are over 18 and currently able to drive were selected for this survey.
In the SP part of the survey, participants were presented with a number of hypothetical scenarios regarding their parking experience at their favorite shopping mall with the following statement: “Imagine you are arriving at your favorite shopping mall and looking for a parking space. The parking place is congested as usual, and you are expected to spend between 5 and 20 min search time for a parking space. Alternatively, you might have the option of paying one amount of 7–25 SR at the entry of the car park for the whole duration of your stay in order to reduce the time searching for a parking space. Please consider the following hypothetical scenarios carefully, and in each scenario select the option that you think you would select should you be faced with these situations in reality.” Each participant was then presented with eight hypothetical scenarios in which they were asked to trade off between parking charges and saving in search time for a free parking space at the shopping mall.
Each hypothetical scenario offered a choice of two options (Option 1 and Option 2). Each option presents one level of each of the two variables (saving in search time for a free parking space and a willingness-to-pay value for parking-charge value). Each of the two variables has five levels:
Saving in search time for a free parking space (5, 7, 10, 15, and 20 min);
Willingness to pay for parking charges to save searching time for a parking place (7, 10, 15, 20, and 25 SR).
An example of an SP choice is presented in
Table 1 below.
It should be noted here that, initially, there was a process of validation, piloting, and testing of the survey, survey techniques, and the hypothetical scenarios presented before finalizing the questionnaire and carrying out the main survey in order to guarantee that respondents comprehended the questions clearly without any doubts. The questionnaire also included a question at the end asking how clear and easy the questionnaire was. It was reassuring, therefore, that about 79% of participants responded to that question indicating that the questionnaire was clear, and they had no problem in understanding it and responding to its questions, in particular the SP part.
2.2. Logistic Regression (OLR) Model for WTP
In this section, we investigate the willingness to pay using ordinary logistic regression (OLR) techniques. The aim is to estimate the likelihood of participants’ willingness to pay for parking charges to save parking search time in Riyadh.
The outcome (or dependent) variable in this case, “willingness to pay to save search time” has 5 levels: Level 1 = 7, Level 2 = 10, Level 3 = 15, Level 4 = 20, and Level 5 = 25 SR for various levels of saving in search time for a parking space, and this outcome is estimated using OLR. The independent variables are represented by the six socio-economic parameters.
Assume D to be the total number of levels of the dependent variable (in this case D = 5) and N to be the number of independent variables (N = 6). The mathematical formula of the odds of proportional outcomes model can then be written as:
where d is the level of an ordered category of the dependent variable = 1, 2, 3, 4, 5, and n corresponds to independent variables = 1, … 6 as seen in
Table 2 below.
In this case, d = 1 refers to 7 SR, d = 2 refers to 10 SR, d = 3 refers to 15 SR, d = 4 refers to 20 SR, and d = 5 refers to 25 SR. In addition, when n = 1 refers to age, n = 2 refers to gender, n = 3 refers to employment, n = 4 refers to education, n = 5 refers to car ownership, and n = 6 refers to income.
An ordinal logistic regression or an ordered logit model was developed based on the responses received from the survey. The six independent variables and their categories which were utilized to predict the outcome variable are presented in
Table 3.
3. The Results and Analysis of Results
In this section, we present an analysis of the outcome of this survey of 394 shoppers. The number of those surveyed categorized by each socio-economic group and the overall percentages within each category are presented in
Table 3. The participants were asked to report on their search time for parking places and frequency of trips to shopping malls, as well as their socio-economic characteristics including age, gender, employment, education, car ownership, and income, and their willingness to pay to save search time for parking.
From
Table 3, it appears that 57.1% of participants were female and 42.9% were male. The majority of respondents belonged to the 31–45 age group with a percentage of 47.2%. The age group of 65 years and older represented the smallest group in the sample (4.3%). Most participants seemed to fall in the medium monthly income (10–25 K). Over 57% were full time employees, while just under 30% were part-timers. About half of the participants reported that they fall in the household category of having two cars. In terms of employability, just over 57% of the sampled population were full-time workers, while about 30% were part-time workers and only 14% were unemployed. Of the total participants, 17% reported a PG qualification, while about 43% were university graduates, with the rest of the sample reporting other qualifications. The level of car ownership was also analyzed; the majority of participants were in the two-car ownership category. About 20% reported being in the one-car ownership category, and about another 20% reported having three or more cars in their households. In terms of income groups, there were three categories presented to the participants. Finally, the results of the survey show that 47.7% of the sample were in the medium-income group; that is a monthly income of (10–25 K SR/month), which is equivalent to 2.67–6.67 K USD. About 29% of the sample reported being in the high-income group and about 24% were in the low-income group.
The initial statistics show that on average, shoppers spend about 9 min searching for a parking place for their shopping and recreational trips with a 6 min SD. The results also show that, on average, shoppers reported that they go shopping, eating out, etc., about three times per week, and the average willingness to pay to save time searching for parking space is about 10 Saudi Riyal (about 2.7 USD) with a SD of 7 SR per visit.
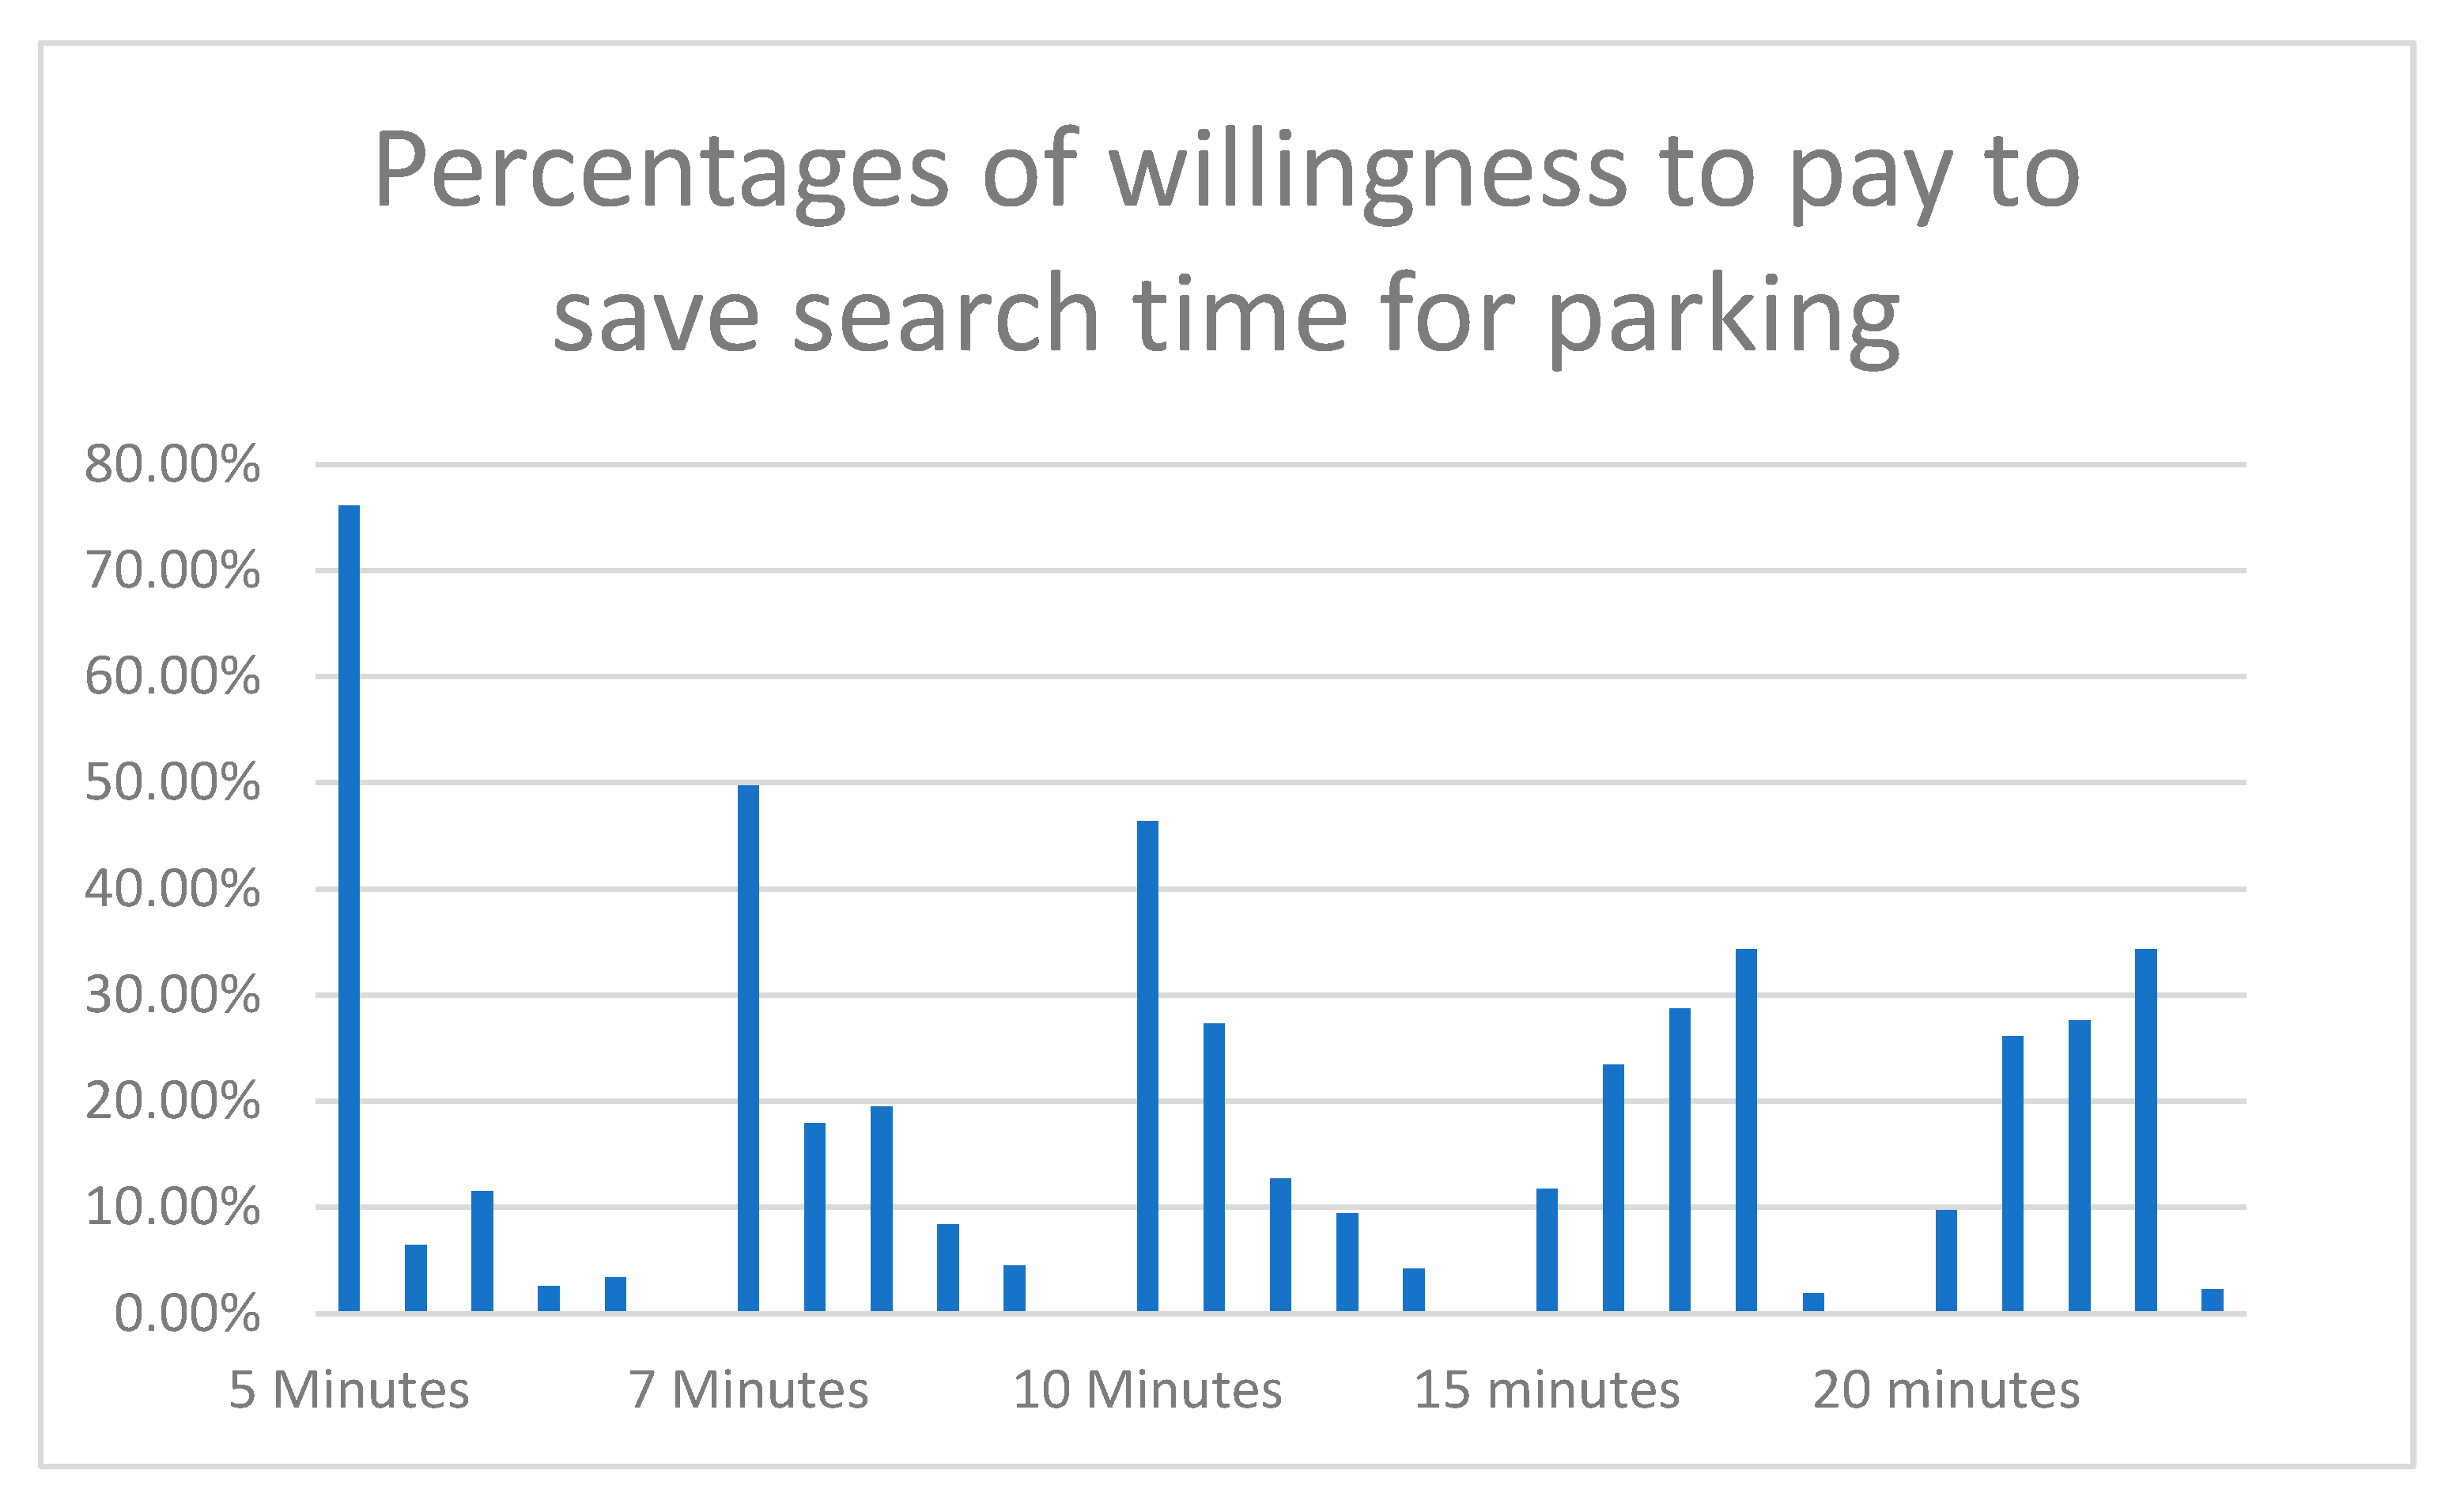
Figure 1 shows percentages of willingness to pay for the different time saving values (5, 7, 10, 15, and 20 min). The figure illustrates that, overall, there is a higher willingness to pay for the lower values of proposed parking charges at the lower values of time savings (5, 7, and 10 min). With the increase in the proposed time saving (15 and 20 min), there is a trend towards more willingness to pay higher levels of parking charges; perhaps the higher parking charging levels would then appear to be more realistic.
4. Willingness to Pay (WTP) Analysis
The results are focused on the willingness to pay for parking facilities that were previously free of charge, in order to reduce search time.
Table 4 below shows the coefficient estimates of the OLR model, the odds ratios, and the t-statistical significance values. From the table, for a one-unit increase in the younger age group, we expect a 1.791 increase in the log odds of being at the higher level of accepting parking charges, given that all of the other variables in the model are held constant. For a one-unit increase in the middle age group, we expect a 1.452 increase in the log odds of being at the higher level of accepting parking charges, given that all of the other variables in the model are held constant. Moreover, for a one-unit increase in the younger age group, the odds of the acceptability of level-one parking charges versus the other levels combined is 5.995 greater. This might be an indication that the younger the participants, the more willing they are to accept higher levels of parking charges, when all other variables are held constant. This could be for several reasons; firstly, the younger drivers might be less patient to sit in the car and spend time waiting for a parking space, and they would rather pay to save searching time. This is particularly true for Saudi women who have just started to drive in the Kingdom and would be enjoying the whole experience of driving including paying for parking charges. Secondly, it might be that the younger generation are more familiar with and willing to accept parking charges to save time as a result of them being more exposed to travelling overseas and getting used to pay parking charges in other countries than the older age group. The older age group (46–65 years) is taken as a reference group, while the group (>65 years) was not considered in the analysis because of the very small number of participants in that group.
Further, for a one-unit increase in the male group, we expect a 0.365 increase in the log odds of being at the lower level of accepting parking charges, given that all of the other variables in the model are held constant. In addition, for a one-unit increase in the male group, the odds of the acceptability of level-one parking charges versus the other levels combined is 0.694 less, given that all the other variables in the model are held constant. For a one-unit increase in the full-time employment group, we expect a 1.453 increase in the log odds of being at the higher level of accepting parking charges, given that all of the other variables in the model are held constant. For a one-unit increase in the part-time employment group, we expect a 2.891 increase in the log odds of being at the higher level of accepting parking charges, given that all of the other variables in the model are held constant.
For a one-unit increase in the full-time employment group, we expect a 1.453 increase in the log odds of being at the higher level of accepting parking charges, given that all of the other variables in the model are held constant.
For the education level variable,
Table 4 shows that for a one-unit increase in the university graduates group, we expect a 3.78 increase in the log odds of willingness to accept the first level of parking charges (β = 3.781), given that all of the other variables in the model are held constant. Similarly, for a one-unit increase in the middle car ownership group, we expect a 1.874 increase in the log odds of willingness to accept the first level of parking charges (again, β = 1.874), given that all of the other variables in the model are held constant. In addition, for a one-unit increase in the middle group of car ownership, the odds of willingness to accept level-one parking charges versus all the other levels combined is 6.514 more, given that all the other variables in the model are held constant. This might result from the fact that the highest car ownership group enjoys the luxury of being able to ride with their private drivers who will drop them at the entrance of the shopping mall and drives to park their car and wait.
Income displays a similar pattern to the car-ownership variable. For a one-unit increase in the highest income group, we expect a 1.461 reduction in the log odds of being at the first level of accepting parking charges (again, β is a negative value = −1461), given that all of the other variables in the model are held constant. In addition, for a one-unit increase in highest car ownership group, the odds of willingness to accept level-one parking charges versus all the other levels combined is 0.232, given that all the other variables in the model are held constant.
The cut points shown at the bottom of the coefficient estimates indicate where the latent variable is cut to make the six levels that we observe in the data.
The model fitting statistics also provide evidence on the goodness of fit of the model and its ability to predict the outcome variable. The loglikelihood values of the model with zero coefficients are compared with those of the final model with all independent variables, which demonstrates the improvement in the goodness of fit of the model (
Table 4). The
p-values are also presented, which show the level of significance of each model. The test of parallel lines provides evidence that the ordinal model estimates with one set of coefficient estimates for all categories of the dependent variable (i.e., null hypothesis of the ordered model) are superior to a model with a separate set of coefficients for each category (referred to here as the “general model”).
5. Final Conclusions and Implications
This paper provides experimental indication and analyses of willingness to pay for parking charges and saving in search time for a parking place at shopping malls in the city of Riyadh, KSA. A survey was conducted including a stated preference (SP) experiment and responses from 394 drivers were collected at three major shopping malls in the city. Five levels of proposed parking charges and five levels of saving in search time for a parking place have been applied. Data on socio-economic characteristics were also collected including age, gender, level of employment, level of education, car ownership, and income. An ordered logistic regression (OLR) model has been utilized to model the willingness to pay to save search time for parking. Overall, as expected, the results show that the lower values of proposed parking charges were accepted by the majority of participants. The model results show that Saudi females and younger people were more willing to pay to save search time for parking than Saudi males and older people. This might be a reflection of the fact that Saudi females have just started driving and therefore, they don’t mind paying for parking charges as part of driving costs. In addition, the majority of the younger generation experiences driving abroad and paying for parking charges, which might increase their acceptance of parking charges in their cities. The Saudi males and older people on the other hand have experienced free parking facilities in the country throughout their lives, and therefore might be less willing to pay for what would be newly introduced parking charges.
Our results also show that as income increases, a lower willingness to pay was reported from the categories of higher levels of education, higher levels of employment, car ownership, and income. It is expected that those participants may have the privilege of employing a private driver. Typically, therefore, their travel experiences do not include looking for a parking space; rather, their private drivers drop them at the entrance of the shopping mall and then go to search for a parking space and wait. Therefore, they are not accustomed to spending time searching for a parking space, it is not as a daily inconvenience to them as it is for the lower income groups, and hence the higher income participants were less willing to pay to save searching time. It should be noted, however, that during this survey, those participants were driving their own cars.
The paper contributes to the literature by offering a first investigation of willingness to pay for parking charges in a Saudi city and how it is impacted by the participants’ socio-economic characteristics. The results will be useful for policy planners and city authorities when forming transport policies associated with parking management in the city. The results show that despite the higher income in Saudi Arabia compared with many other world countries, pricing measures are proving yet again to have a major influence on travel behavior choices and attitudes. The findings from this research are expected to inform decision makers and local authorities in the country with knowledge and recommendations that can support the implementation of successful sustainable programs to help achieve vision 2030, sustainability, and travel demand management.
6. Limitations
Parking facilities are currently all provided free of charge in the Kingdom of Saudi Arabia. This research is designed to investigate willingness to pay (WTP) for parking charges in Riyadh using an SP survey. This is an original and pioneering research area. There are however various limitations of the research as discussed in this section. While SP surveys provide the advantage of being able to assess potential attitudes and preferences, they come with their own methodological challenges. The stated WTP might not be measured accurately, which is one of the limitations of this research. The ordered logit models have been used to analyze the willingness to pay to save search time. Other types of models could have been employed including logistic regression and linear and continuous models. The results presented in this research are limited to three parking sites in the city of Riyadh and a sample of 394 participants. Further research at other types of parking sites and a greater number of them would add value to the findings from this research. The reported search time spent finding a parking place could have been added into the model as an independent variable, which would be a very relevant variable. This would be an appropriate future research investigation that would add a significant impact to the model. Riyadh is a very special city in the KSA. It is known as the cultural capital of Saudi Arabia, and it has many development projects. Riyadh’s population are also different in terms of social character, income, and recreational styles. For example, our results show that full-time employees were less willing to pay to save searching time than part-time employees. While this has been discussed and an explanation has been offered, further investigations with additional questions in the questionnaire could well reveal further understanding for this unexpected behavior. Finally, an investigation of WTP in other cities with different characters would be very motivating.
Author Contributions
Methodology, W.S.; Validation, S.E.; Formal analysis, W.S.; Investigation, W.S.; Resources, S.E.; Data curation, H.A.; Writing—review & editing, S.E. and H.A.; Visualization, H.A. All authors have read and agreed to the published version of the manuscript.
Funding
The authors extend their appreciation to the Deputyship for Research & Innovation, Ministry of Education in Saudi Arabia, for funding this research work through the project number RI-44-0127.
Institutional Review Board Statement
IRB Log Number: 23-0024.
Informed Consent Statement
Not applicable.
Data Availability Statement
Data available on request due to restrictions eg privacy or ethical at PNU.
Acknowledgments
The authors extend their appreciation to the Deputyship for Research & Innovation, Ministry of Education in Saudi Arabia, for funding this research work through the project number RI-44-0127.
Conflicts of Interest
The authors declare no conflict of interest.
References
- Christiansen, P.; Engebretsen, Ø.; Fearnley, N.; Hanssen, J.U. Parking facilities and the built environment: Impacts on travel behaviour. Transp. Res. Part A Policy Pract. 2017, 95, 198–206. [Google Scholar] [CrossRef]
- Arnott, R.; Rowse, J. Curbside parking time limits. Transp. Res. Part A Policy Pract. 2013, 55, 89–110. [Google Scholar] [CrossRef]
- Albalate, D.; Gragera, A. The determinants of garage prices and their interaction with curbside regulation. Transp. Res. Part A Policy Pract. 2017, 101, 86–97. [Google Scholar] [CrossRef]
- Nourinejad, M.; Roorda, M.J. Parking enforcement policies for commercial vehicles. Transp. Res. Part A Policy Pract. 2017, 102, 33–50. [Google Scholar] [CrossRef]
- Gu, Z.; Najmi, A.; Saberi, M.; Liu, W.; Rashidi, T.H. Macroscopic parking dynamics modeling and optimal real-time pricing considering cruising-for-parking. Transp. Res. Part C Emerg. Technol. 2020, 118, 102714. [Google Scholar] [CrossRef]
- He, F.; Yin, Y.; Chen, Z.; Zhou, J. Pricing of parking games with atomic players. Transp. Res. Part B Methodol. 2015, 73, 1–12. [Google Scholar] [CrossRef]
- Calthrop, E.; Proost, S. Regulating on-street parking. Reg. Sci. Urban Econ. 2006, 36, 29–48. [Google Scholar] [CrossRef]
- Kirschner, F.; Lanzendorf, M. Support for innovative on-street parking policies: Empirical evidence from an urban neighborhood. J. Transp. Geogr. 2020, 85, 102726. [Google Scholar] [CrossRef]
- Liang, J.-K.; Eccarius, T.; Lu, C.-C. Investigating factors that affect the intention to use shared parking: A case study of Taipei City. Transp. Res. Part A Policy Pract. 2019, 130, 799–812. [Google Scholar] [CrossRef]
- Rosenblum, J.; Hudson, A.W.; Ben-Joseph, E. Parking futures: An international review of trends and speculation. Land Use Policy 2020, 91, 104054. [Google Scholar] [CrossRef]
- Hoehne, C.G.; Chester, M.V.; Fraser, A.M.; King, D.A. Valley of the sun-drenched parking space: The growth, extent, and implications of parking infrastructure in Phoenix. Cities 2019, 89, 186–198. [Google Scholar] [CrossRef]
- Petiot, R. Parking enforcement and travel demand management. Transp. Policy 2004, 11, 399–411. [Google Scholar] [CrossRef]
- Arnott, R.; De Palma, A.; Lindsey, R. A temporal and spatial equilibrium analysis of commuter parking. J. Public Econ. 1991, 45, 301–335. [Google Scholar] [CrossRef]
- Benny, L.; Soori, P.K. Prototype of parking finder application for intelligent parking system. International Journal on Advanced Science, Engineering and Information Technology 2017, 7, 1185–1190. [Google Scholar] [CrossRef]
- Alqahtany, A.M. The Development of a Consensus-Based Framework for a Sustainable Urban Planning of the City of Riyadh. Master’s Thesis, Cadiff University, Cardiff, UK, 2014. [Google Scholar]
- Alotaibi, O.; Potoglou, D. Perspectives of travel strategies in light of the new metro and bus networks in Riyadh City, Saudi Arabia. Transp. Plan. Technol. 2017, 40, 4–27. [Google Scholar] [CrossRef]
- Alqahtani, M.; Al-Badi, A.; Mayhew, P. The Enablers and Disablers of E-commerce: Consumers’ Perspectives. EJISDC 2012, 54, 1–24. [Google Scholar] [CrossRef]
- Mangham, L.J.; Hanson, K.; McPake, B. How to do (or not to do)… Designing a discrete choice experiment for application in a low-income country. Health Policy Plan. 2009, 24, 151–158. [Google Scholar] [CrossRef] [PubMed]
- Ledolter, J. Multinomial logistic regression. Data Min. Bus. Anal. R 2013, 132–149. [Google Scholar] [CrossRef]
- De Dios Ortúzar, J.; Willumsen, L.G. Modelling Transport; John Wiley & Sons: New York, NY, USA, 2011. [Google Scholar]
- Jeihani, M.; Ardeshiri, A.; Du, J.; Rakha, H.A. Drivers’ Willingness to Pay Progressive Rate for Street Parking; Mid-Atlantic Universities Transportation Center M.B. 2015. Available online: https://rosap.ntl.bts.gov/view/dot/36485 (accessed on 30 January 2023).
- Dell’olio, L.; Ibeas, A.; Moura, J.L. Paying for parking: Improving stated-preference surveys. In Proceedings of the Institution of Civil Engineers-Transport; Thomas Telford Ltd.: London, UK, 2009; pp. 39–45. [Google Scholar]
- Greene, W.H.; Hensher, D.A. A latent class model for discrete choice analysis: Contrasts with mixed logit. Transp. Res. Part B Methodol. 2003, 37, 681–698. [Google Scholar] [CrossRef]
| Disclaimer/Publisher’s Note: The statements, opinions and data contained in all publications are solely those of the individual author(s) and contributor(s) and not of MDPI and/or the editor(s). MDPI and/or the editor(s) disclaim responsibility for any injury to people or property resulting from any ideas, methods, instructions or products referred to in the content. |
© 2023 by the authors. Licensee MDPI, Basel, Switzerland. This article is an open access article distributed under the terms and conditions of the Creative Commons Attribution (CC BY) license (https://creativecommons.org/licenses/by/4.0/).


