Abstract
Aiming to address the problems of traditional BP neural networks, which include their slow convergence speed and low accuracy, a vehicle ownership prediction model based on a BP neural network with particle swarm optimization is proposed. The weights and thresholds of the BP neural network are optimized by PSO to make the prediction results more accurate. Based on the current literature regarding BP neural networks’ ability to predict car ownership, a 9-10-1 BP neural network structure model is established. A traditional BP neural network and a PSO-optimized BP neural network are used to predict car ownership at the same time. In order to compare their prediction accuracy, a genetic algorithm (GA) and whale optimization algorithm (WOA) are additionally selected to optimize the BP neural network as a control group to predict car ownership. The data on China’s car ownership from 2005 to 2021 were collected as experimental data. The data from 2005 to 2016 were used as training data, and the remaining data were used as validation data for model prediction. The results show that the PSO-optimized neural network only undergoes three iterations of training, and the convergence accuracy reaches 1.41 × 10⁻⁸. The relative error between the predicted value of car ownership and the corresponding real value is between 0.023 and 0.083, and the decisive coefficient R2 is 0.96002, indicating that the neural network has better prediction ability and higher prediction accuracy for car ownership. The particle swarm optimization algorithm is used to optimize the weights and thresholds of the BP neural network, which solves the problems of the traditional BP neural network, including the ease with which it falls into the local minimum value and its slow convergence speed, and improves its prediction accuracy of car ownership. Compared with the results optimized by the genetic algorithm and whale optimization algorithm, the error of the BP neural network optimized by PSO is the smallest, and the prediction accuracy is the highest. Through the comparative analysis of training results, it can be seen that the PSO-BP prediction model has the best stability and accuracy.
1. Introduction
With the development of the economy and the improvement of people’s requirements for quality of life, the automobile industry has developed rapidly, and society has given more and more attention to the demand for transportation. Car ownership has increased year by year, and the growth rate in recent years is still growing rapidly. However, the rapid increase in car ownership will have a certain impact on environmental quality, energy utilization, and road infrastructure. The prediction of car ownership has important guiding significance for environmental improvement, the reasonable planning and construction of road networks, the allocation of social resources, and the development of the automobile industry. It has important scientific significance and engineering application value.
At present, domestic and foreign scholars mainly use the grey neural network model, the logistics curve combination forecasting model, the grey Markov model, the Gompertz model and so on in the study of vehicle ownership prediction. Wu Wenqing [1] improved the background value of the classical GM (1,1) grey system by using the Simpson formula and established that the Simpson formula improved the grey neural network model’s ability to predict car ownership. Zhang Lanyi [2] selected eight main influencing factors, carried out a principal component analysis to construct a prediction equation, and used a logistic regression model to verify and predict their results. Zhang Guofang [3] analyzed the historical vehicle data through the Bass diffusion model and the grey Lotka–Volterra model. Furthermore, they analyzed the intrinsic growth ability of electric vehicles and established a model based on parameter fitting to predict the ownership of electric vehicles. Du Danfeng [4] used PCA analysis to screen for the main factors necessary to construct a comprehensive impact index of vehicle ownership and applied the Compertz curve model to predict vehicle ownership in China in the next 20 years. Based on the research of the Gompertz function, Lian Lian [5] proposed a new symbolic regression equation (NE-SR), which was applied to predict passenger car ownership in China up to the year 2060. The prediction results can be used to further predict the energy demand and carbon emissions of passenger cars and provide a basis for decision-makers regarding transportation and environmental policies.
There are many factors influencing car ownership, which are complex, difficult to quantify, and nonlinear. Neural networks have certain advantages, including their self-learning and self-adaptation capabilities, strong nonlinear mapping ability and generalization ability [6]. Therefore, neural networks have been applied to the prediction of car ownership. Good and accurate prediction results can be obtained. Zhang Xuewu [7] proposed a BP neural network prediction model based on principal component analysis. Using principal component analysis to analyze the influencing factors and eliminate the redundancy between factors, car ownership in Nanjing from 1978 to 2005 was analyzed, and car ownership in Nanjing from 2005 to 2009 was predicted. Wu Cairui [8] established an RBF neural network model for predicting urban car ownership by analyzing the factors affecting urban car ownership and using factor analysis to extract less linearly unrelated main factors, which improved the prediction accuracy. Wang Dong [9] combined grey correlation and a BP neural network to achieve the high-precision prediction of car ownership. James Dixon [10] established a deep neural network (NN) model with hyper-parameter adjustment to predict the spatial classification of car ownership and car ownership changes over time in the UK, improving the prediction accuracy. The above research shows that the use of various neural networks can achieve the more accurate prediction of car ownership, thus demonstrating that the neural network is very suitable for application to forecasting car ownership. However, in practical applications, BP neural networks have some problems, such as their slow convergence speed and the ease with which they fall into the local minimum, which have a certain impact on the prediction accuracy of vehicle ownership.
The particle swarm optimization algorithm is an effective global optimization algorithm. The algorithm demonstrates fast convergence, easy implementation and global convergence. It is very suitable for solving nonlinear model parameter optimization problems [11]. Therefore, considering the limitations of the BP neural network and the advantages of particle swarm optimization, this paper uses the good global optimization ability of particle swarm optimization (PSO) to optimize the weights and thresholds of the BP neural network and establishes a prediction model based on the PSO-BP neural network in order to improve the accuracy of the prediction of vehicle ownership.
2. PSO-BP Neural Network Model
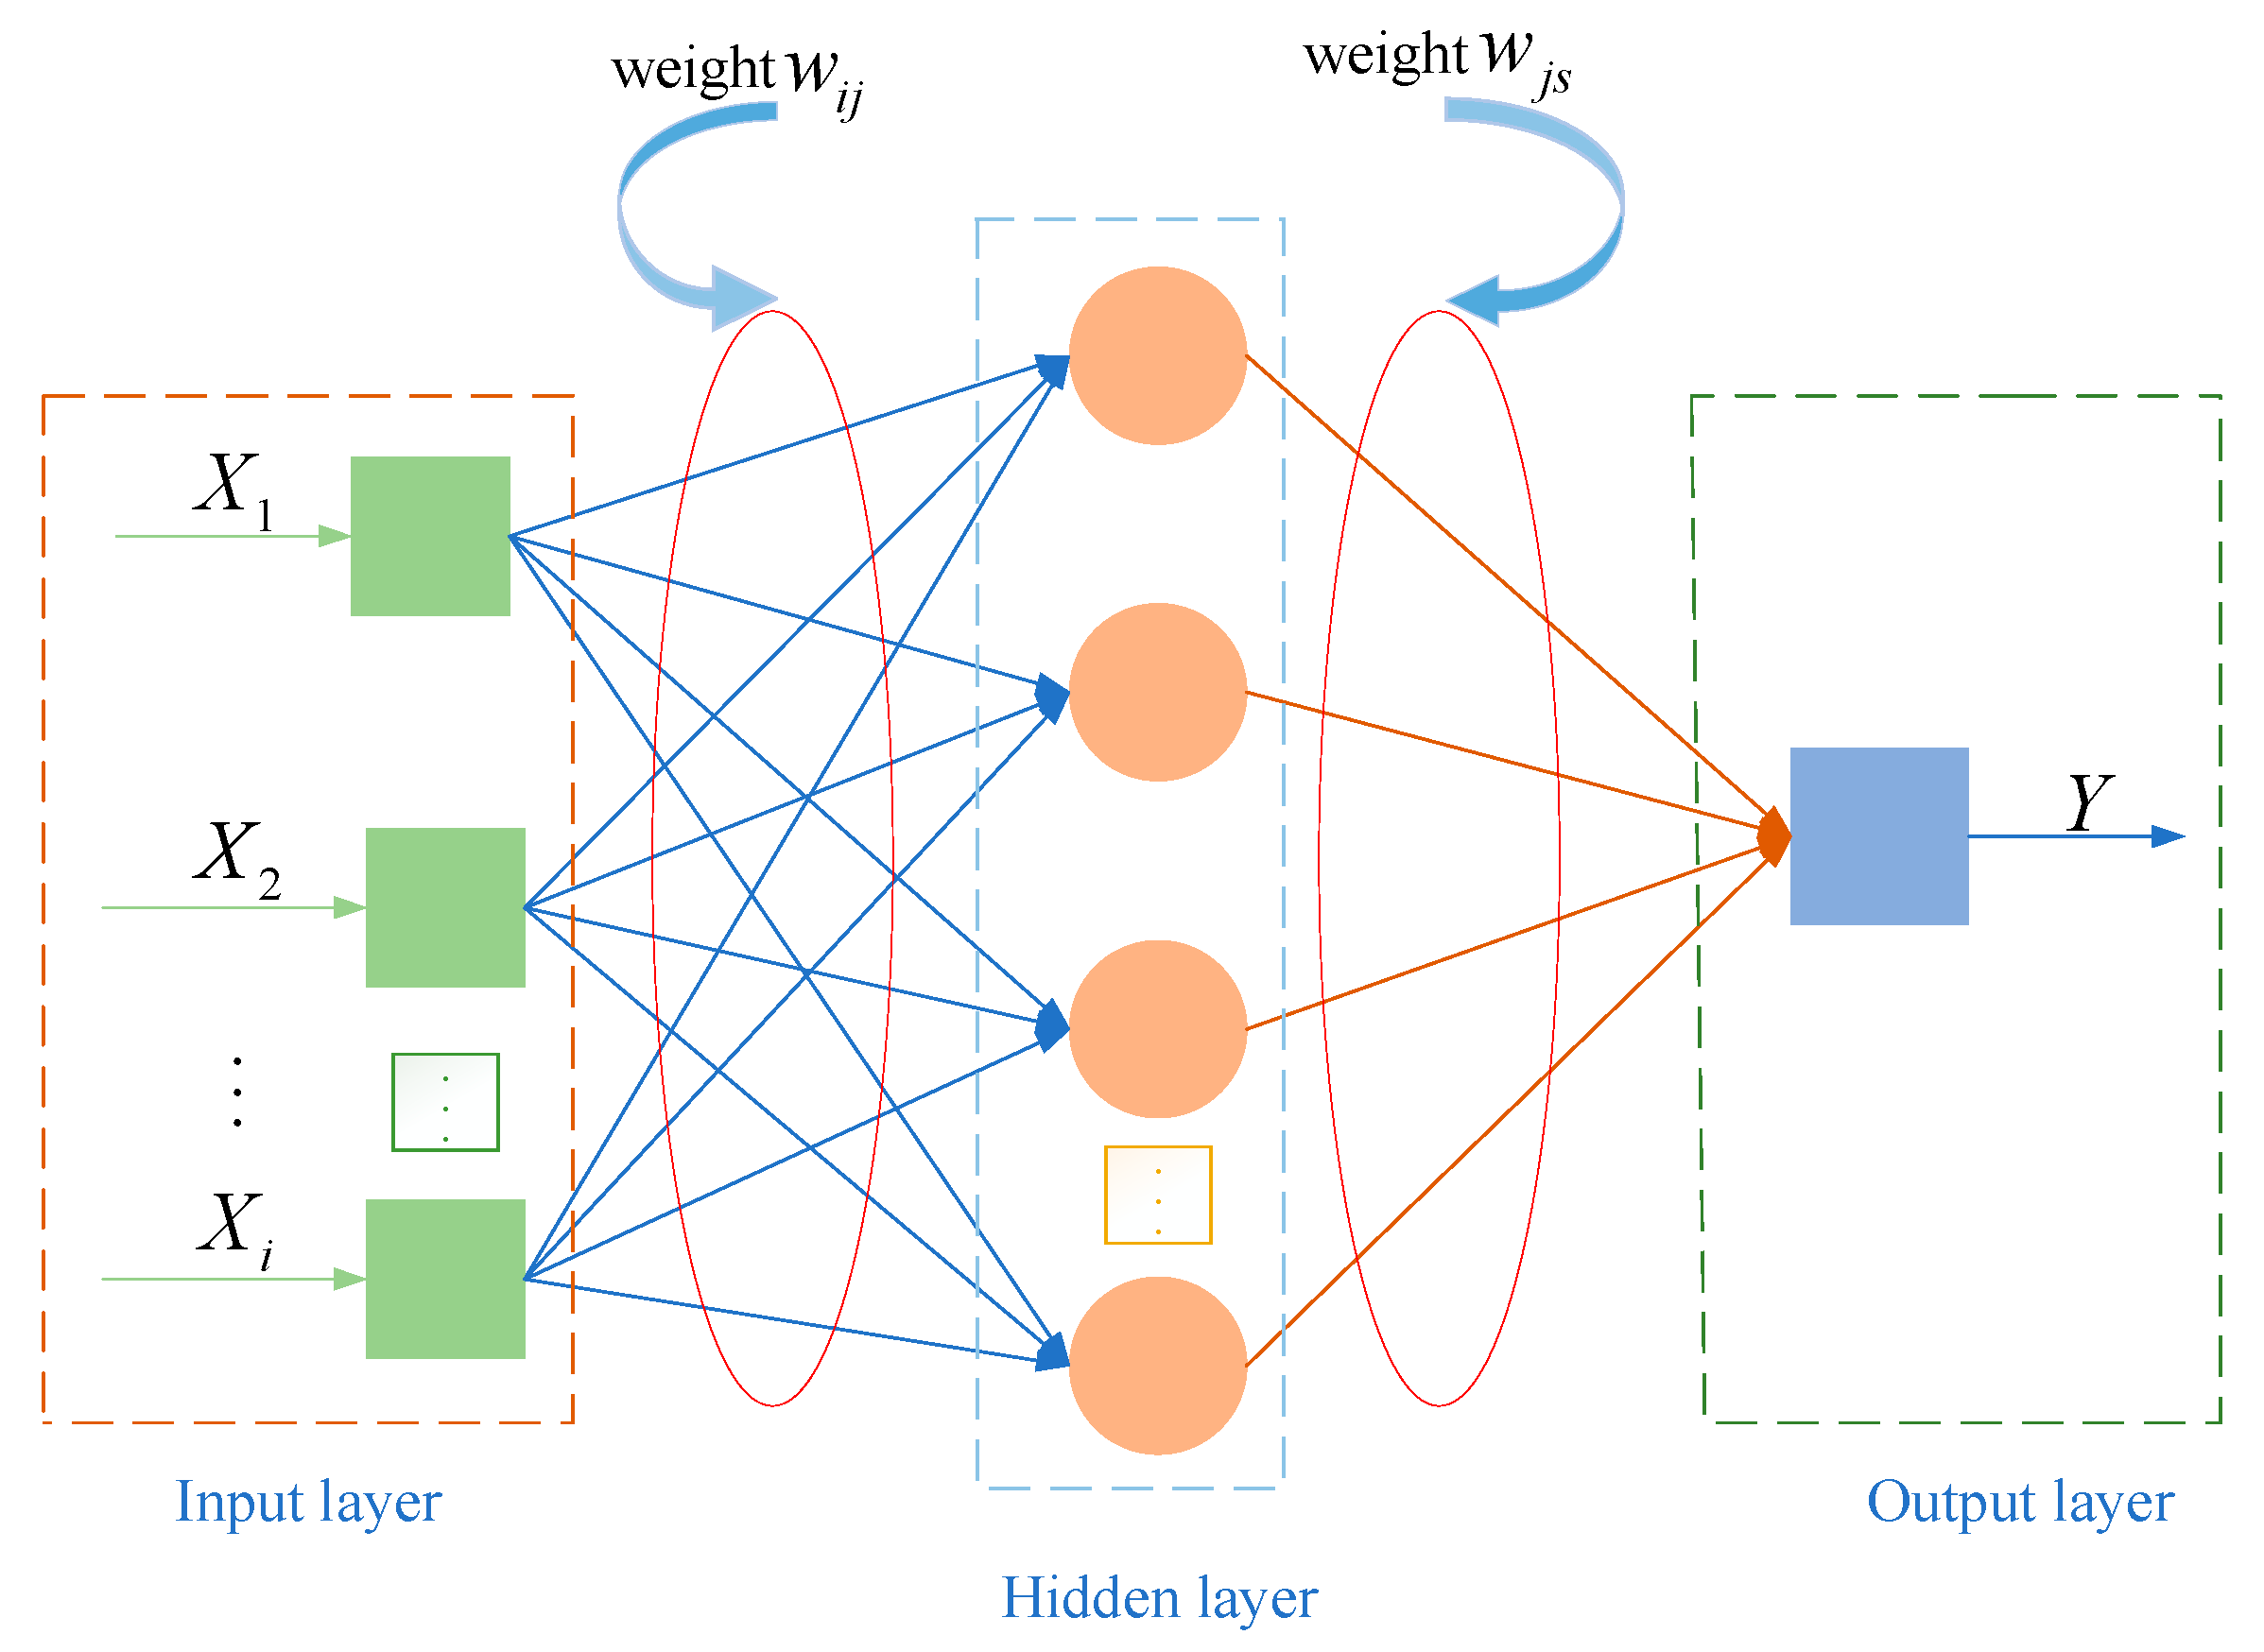
2.1. BP Neural Network
The BP neural network algorithm is a typical multi-layer feedforward neural network, which is trained by an error backpropagation algorithm [12]. The BP algorithm mainly adopts the idea of gradient descent and adopts the stochastic gradient descent technology to minimize the error between the actual output and the expected output of the network. The BP neural network consists of two parts, which are the forward propagation of input data and the backpropagation of error [13]. The BP neural network adjusts the weights and thresholds between the input layer and the hidden layer and between the hidden layer and the output layer repeatedly until the output value of the neural network is consistent with the target value; otherwise, the training stops when the number of iterations is reached. This neural network has a strong generalization ability, and its working principle is shown in Figure 1.
Figure 1.
BP neural network schematic structure.
The number of hidden layer nodes in the BP neural network is very important, as it directly affects the modeling effect of the BP neural network [14]. The number of nodes in the hidden layer is usually determined by empirical formulas, such as Formula (1):
In this formula, c is the number of neurons in the input layer; P is the number of hidden layer neurons; d is the number of output layer neurons; λ is the empirical number (1 ≤ λ ≤ 10).
2.2. Particle Swarm Optimization
The particle swarm optimization algorithm is inspired by the process of birds foraging. In the process of finding food, they will share information so as to achieve the purpose of efficient predation. The particle swarm optimization algorithm first initializes the population size, velocity and position of the particles in the feasible solution space. Each particle is a potential optimal solution, and the fitness is determined according to the fitness function. There are two extreme values in the search process of the particle: one is the global extreme value, and the other is the individual extreme value. When these two extremums are found in the iteration, the particle updates its position and velocity accordingly until the maximum number of iterations is reached or the global optimal solution is found, and the algorithm ends [15].
In this formula, i = 1,2,..., N; j = 1,2,...; D is the dimension of the particles; k is the number of iterations; ω is the inertia weight; c1 and c2 are the learning factors of the particle population itself and the cognitive domain; and r1 and r2 are the random factors, usually taken as a constant from 0 to 1.
2.3. BP Neural Network Model for Particle Swarm Optimization
The essence of the BP neural network optimized by particle swarm optimization is to map the weights and thresholds of the BP neural network into PSO particles and optimize the weights and thresholds by using the iterative update of particle velocity and position so as to improve the convergence speed and prediction accuracy of the neural network. The prediction process of the PSO-BP neural network is as follows:
- (1)
- Initialize the parameters of the BP neural network and particle swarm. Combined with the sample data, the number of neurons c, P, and d in the input layer, hidden layer and output layer of the BP neural network is established. Set the particle swarm population size N, learning factors c1 and c2, the maximum number of iterations K, and the inertia weight ω.
- (2)
- Calculate the fitness of the particle swarm. The quality of the population is determined by the fitness function, which selects the mean square error between the actual value and the predicted value of the neural network.
- (3)
- Update individual and global optimal values. According to the fitness function, the fitness values of the current moment and the previous moment of the particle are compared. If the current fitness value is smaller, the effect is better, and the individual optimal value is updated; otherwise, it is not updated. Similarly, the fitness value of the particle group at the current moment and the previous moment is compared. If the fitness value at the current moment is smaller, the fitness is better, and the global optimal value is updated; otherwise, it is not updated [16].
- (4)
- Update the velocity and position of the particles. The particle velocity and position are updated according to Formulas (2) and (3).
- (5)
- Determine whether PSO meets the end condition. When the particle swarm optimization algorithm reaches the maximum number of iterations set or meets the error requirements, the algorithm ends, and the optimal solution is obtained. If it is not satisfied, return to (2).
- (6)
- The optimal solution is assigned to the weights and thresholds of the BP neural network [17]. Adjust the weights and thresholds of the neural network, train and predict the BP neural network, and obtain the simulation results.
The flow chart of the PSO-BP neural network prediction model is shown in Figure 2.
Figure 2.
BP neural network optimization process by PSO.
3. Establishment and Analysis of Vehicle Ownership Prediction Model Based on PSO-Optimized BP Neural Network
3.1. Main Influencing Factors and Sample Data of Car Ownership
There are many factors affecting car ownership from many aspects. Based on the previous analysis and research, this paper sorts out some main influencing factors for research. The main influencing factors include gross national income, per capita GDP, total population, total import and export, total retail sales of social consumer goods, per capita disposable income of urban residents, highway passenger volume, highway freight volume and highway mileage.
According to the selected main influencing factors of car ownership, the sample data of China’s car ownership from 2005 to 2021 were collected from the National Bureau of Statistics, as shown in Table 1.
Table 1.
Sample data of car ownership.
3.2. Parameter Determination of BP Neural Network
Nine influencing factors in Table 1, including the gross national income, per capita GDP, total population, total import and export, total retail sales of social consumer goods, per capita disposable income of urban residents, road passenger volume, road freight volume and road mileage, were selected as the input layer of the neural network, and the car ownership was the output layer. According to the empirical formula of the hidden layer neural network in Formula (1), the number of hidden layer neurons was determined. Formula (1) can determine the number of hidden layer neurons P between 4 and 13. Through continuous training, the training results were obtained and analyzed. The mean square error (MSE) was used to determine the final number of hidden layer nodes [18]. Under different hidden layer nodes, the corresponding mean square error (MSE) changes are shown in Table 2.
Table 2.
Mean square error (MSE) under different hidden layer nodes.
From the mean square error (MSE) corresponding to different hidden layer nodes in Table 2, it can be clearly seen that when the number of hidden layer nodes is 10, the mean square error is the smallest, with a value of 0.00094295. When the number of hidden layer neurons is 10, the MSE is the smallest, and the training effect is the best, so the number of hidden layer nodes was set to 10. Therefore, the structure of the BP neural network is a 9-10-1 neural network.
The excitation functions of the input and output layers of the BP neural network are Tansig and Purelin, respectively, and the training function is Trainlm [19]. The parameter settings of the BP neural network are shown in Table 3.
Table 3.
Parameter settings of BP neural network.
3.3. Parameter Determination of PSO-BP Neural Network
According to the topological structure of the BP neural network, the dimension of the particle swarm is “D = 9 × 10 + 10 × 1 + 10 + 1 = 111”. When the population size N is small, the particle swarm algorithm converges faster; when N is large, the algorithm has a better search effect but converges slowly; usually, N is between 10 and 50. The particle swarm size N was set to 10. The parameters of the PSO algorithm are shown in Table 4.
Table 4.
PSO parameter settings.
The fitness function value is one of the indicators to judge whether the model prediction results achieve the expected accuracy [20]. This fitness function selects the mean square error between the true value and the predicted value of the sample, as shown in Formula (4):
In this formula, n is the number of samples, and and are the predicted and true values of sample i, respectively.
3.4. Effect Evaluation of Prediction Model
In order to test the accuracy of the prediction model, four error analysis methods, mean square error (MSE), mean relative error (MAPE), root-mean-square relative error (RMSE) and decisive coefficient (R2), were used to evaluate the accuracy of the prediction model [21]. The four evaluation analysis methods are shown in Equations (5)–(8).
In these formulas, is the arithmetic mean of the true value of sample i.
4. Results and Analysis of Prediction Model
4.1. Effect Evaluation of Prediction Model
The statistical data of car ownership and related factors in China from 2005 to 2021 were selected, and the sample data from 2005 to 2016 in Table 1 were used as the training set of the neural network to train the PSO-BP neural network. The remaining data were used as a validation set to verify the network’s prediction ability after training.
Because the sample data is not a unified dimension, the parameters are very different from each other and cannot be well processed. Therefore, the data needs to be normalized so that the sample data is replaced with a unified dimension, which is conducive to subsequent analysis and processing. The sample data are converted according to Equation (9) and converted in [0, 1] [22].
In this formula, XMax and XMin are the maximum and minimum values of the sample, respectively.
4.2. Design Process of Prediction Model
The software platform used in the experiment was Matlab2020b. The computer hardware was a Windows 11 system with a CPU frequency of 3.20 GHz, 16 GB memory, and a 500 GB hard disk. Combining the particle swarm optimization algorithm with the BP neural network, a vehicle ownership prediction model based on the PSO-BP neural network is constructed. The flow chart of the vehicle ownership prediction model based on the PSO-optimized BP neural network is shown in Figure 3.
Figure 3.
Flow chart of vehicle ownership prediction model optimized by PSO-BP neural network.
4.3. Analysis of Prediction Model Results
In order to quantitatively evaluate the reliability of the vehicle ownership prediction model based on the PSO-BP neural network, the trained PSO-BP neural network was used to test and predict five samples. The error between the prediction results and the prediction model is shown in Table 5. At the same time, the predicted results were compared with the actual values and compared with the traditional BP neural network. The predicted values and errors of BP neural network are also shown in Table 5.
Table 5.
Predicted values and real values of the two prediction models and the errors between them.
Model training was carried out on the normalized sample data, and the test set data were tested to obtain the prediction results under the two prediction models of the single BP neural network and the PSO-optimized BP neural network. The two prediction models were compared and analyzed, and the prediction results are shown in Figure 4. The error between the true and predicted values of the two prediction models is also shown in Figure 4.
Figure 4.
Comparison of BP neural network predicted value and true value before and after PSO optimization.
From the comparison between the predicted value and the real value of the BP neural network before and after PSO optimization in Figure 4, it can be seen that the predicted value of the PSO-BP neural network is closer to the real value, and the optimized BP neural network has a better prediction effect. From the comparison between the predicted value and the real value of BP neural network before and after optimization in Figure 5 and the specific data of error in Table 5, it can be seen that the error fluctuation of PSO optimization is relatively small; the fluctuation range is 0.023~0.083, indicating that its prediction effect is better. Through comparative analysis, the predicted value of the neural network optimized by PSO is closer to the real value, the error is smaller, the prediction effect is better, and the prediction accuracy is higher. It can be seen from Figure 4 and Figure 5 that the fitting degree between the predicted value and the real value of the PSO-BP neural network is higher than that of the single BP neural network, and the overall error is relatively small.
Figure 5.
Comparison of error between predicted value and true value of BP neural network before and after PSO optimization.
The fitness curve of the PSO-BP neural network prediction model is shown in Figure 6. It can be seen from Figure 6 that as the number of iterations increases, the fitness value decreases from 0.303103 to 0.00244575, and the convergence speed is faster. The prediction result of the PSO-BP neural network is close to the expected value, and the optimization effect is significant, indicating that the prediction model based on the PSO-BP neural network is feasible. According to Figure 6, when the number of iterations reaches 83 times, the fitness value will hardly change again; that is, the fitness value reaches the optimal value of 0.00244575.
Figure 6.
Evolutionary convergence curve of PSO.
Table 6 shows the error results of the two prediction models. The errors of MSE, MAPE, RMSE and R2 in Table 6 are obtained by calculating the predicted values and real values in Table 5. From Table 6, it can be seen that the MSE, MAPE and RMSE of PSO-BP are smaller than those of the BP neural network, and they are also smaller, at 0.0037557,0.020111 and 0.061283, respectively, indicating that the PSO-BP prediction model has higher prediction accuracy. The error MSE, MAPE, RMSE and R2 of PSO-BP are 0.0037557,0.020111,0.061283 and 0.96002, respectively, which are 3.08463%, 3.82%, 12.4727% and 4.425% higher than those of the BP neural network prediction model. Therefore, the prediction quality of the BP neural network prediction model optimized by PSO is higher.
Table 6.
Error comparison between the two prediction models.
Comparing and analyzing the training results, it can be seen that the BP neural network optimized by particle swarm optimization has better stability and accuracy. Comparing the relative error of the BP prediction model and the PSO-BP prediction model, it can be concluded that the relative error of the PSO-BP prediction model is generally small. Comparing the four prediction errors, MSE, RMSE, MAPE and R2, of the two prediction models, it can be concluded that the PSO-BP prediction model is more accurate.
From the correlation graph of the PSO-optimized BP neural network in Figure 7, it can be seen that the regression coefficients of the training, validation and test groups are 0.99973, 1 and 1, respectively, and the regression coefficient of the overall training sample reaches 0.9987, indicating that the correlation between the predicted and true values obtained by the PSO-optimized BP neural network model is very strong, and the model at this point has a high prediction accuracy of car ownership [23].
Figure 7.
Correlation curve of BP neural network optimized by PSO. Note: training, validation, test, and all represent the regression analysis results of the training group, validation group, test group and all data, respectively. R is the regression coefficient; Fit is a linear fitting result; Y is the linear fitting result in the ideal state.
In summary, the BP neural network optimized by PSO can predict car ownership well and has higher prediction accuracy than the traditional BP neural network [24].
5. Discussions
In order to improve the prediction accuracy and accuracy of car ownership, other intelligent optimization algorithms were selected to optimize the BP neural network to predict car ownership. After analysis and research, the genetic algorithm (GA) and whale optimization algorithm (WOA) were selected to optimize the BP neural network, and more optimization algorithms were explored to optimize the weights and thresholds of the BP neural network to improve the prediction accuracy of vehicle ownership.
In order to ensure an effective comparison, the intelligent optimization algorithm sets the same parameters in the number of populations and the number of iterations, and the fitness function is the same as the particle swarm optimization algorithm, which uses the mean square error between the real value and the predicted value of the sample. The prediction results and prediction errors of BP neural network optimized by the genetic algorithm and whale optimization algorithm are shown in Table 7.
Table 7.
Prediction results and errors of BP neural network optimized by genetic algorithm and whale optimization algorithm.
Various optimization algorithms to optimize the BP neural network before and after the predicted value and the real value comparison are shown in Figure 8, and various optimization algorithms to optimize the BP neural network before and after the prediction error comparison is shown in Figure 9.
Figure 8.
Comparison of predicted and actual values before and after BP neural network optimized by various optimization algorithms.
Figure 9.
Error comparison between predicted value and actual value before and after BP neural network optimized by various optimization algorithms.
It can be seen from Figure 8 that the fitting degree of the PSO-BP model prediction curve is higher than that of other models. The predicted value of the BP neural network optimized by the particle swarm optimization algorithm is the closest to the real value, indicating that the BP neural network optimized by the particle swarm optimization has the highest prediction accuracy. Therefore, in the case of the same number of individuals and evolutionary generations, the PSO-BP model has higher prediction accuracy for car ownership. From Table 7 and Figure 9, it can be seen that the fluctuations in the relative error of the BP neural network optimized by the optimization algorithm are relatively small. The fluctuation of the relative error of the BP neural network optimized by each algorithm is relatively small, and the fluctuation range is between 0 and 0.15, indicating that the prediction effect is good. The fluctuation of the BP neural network optimized by PSO is the smallest; the relative error is less than 8.25%, that is, the prediction accuracy is greater than 91.75%, and the prediction accuracy is significantly higher than other prediction models.
Table 8 shows the model prediction error. It can be seen from Table 8 that the errors of the BP neural network prediction model optimized by each algorithm are lower than those of the traditional BP neural network prediction model, and the goodness of fit is closer to 1, indicating that the prediction accuracy is significantly improved after the optimization algorithm is introduced.
Table 8.
Prediction model errors.
It can be seen from Table 8 that the PSO-BP model has the highest prediction accuracy. The MSE, MAPE, RMSE and R2 are 0.0037557,0.020111,0.061283 and 0.96002, respectively, which are 3.08463%, 3.82%, 12.4727% and 4.425% higher than the BP model. Compared with the GA-BP model, these values increased by 0.13211%, 0.01751%, 0.9969% and 0.235%; compared with the WOA-BP model, the prediction accuracy of the PSO-BP model is higher by 0.61555%, 1.4018%, 3.8272% and 2.153%. Through the comparative analysis of training results, the PSO-BP prediction model has the best stability and accuracy.
6. Conclusions
In this paper, a particle swarm algorithm-optimized BP neural network method is used to establish a car ownership prediction model. The experimental data of China from 2005 to 2021 were collected. The data from 2005 to 2016 were selected as the training data of the prediction model, and the remaining data were used as the test data. At the same time, other optimization algorithms were added to optimize the BP neural network as a control group, and the following conclusions were drawn:
- (1)
- The particle swarm optimization algorithm is used to optimize the weights and thresholds of the BP neural network. According to the main influencing factors and sample data of vehicle ownership, a prediction model based on the PSO-BP neural network is established, which solves the problem that the traditional BP neural network easily falls into local minimum and has a slow convergence speed.
- (2)
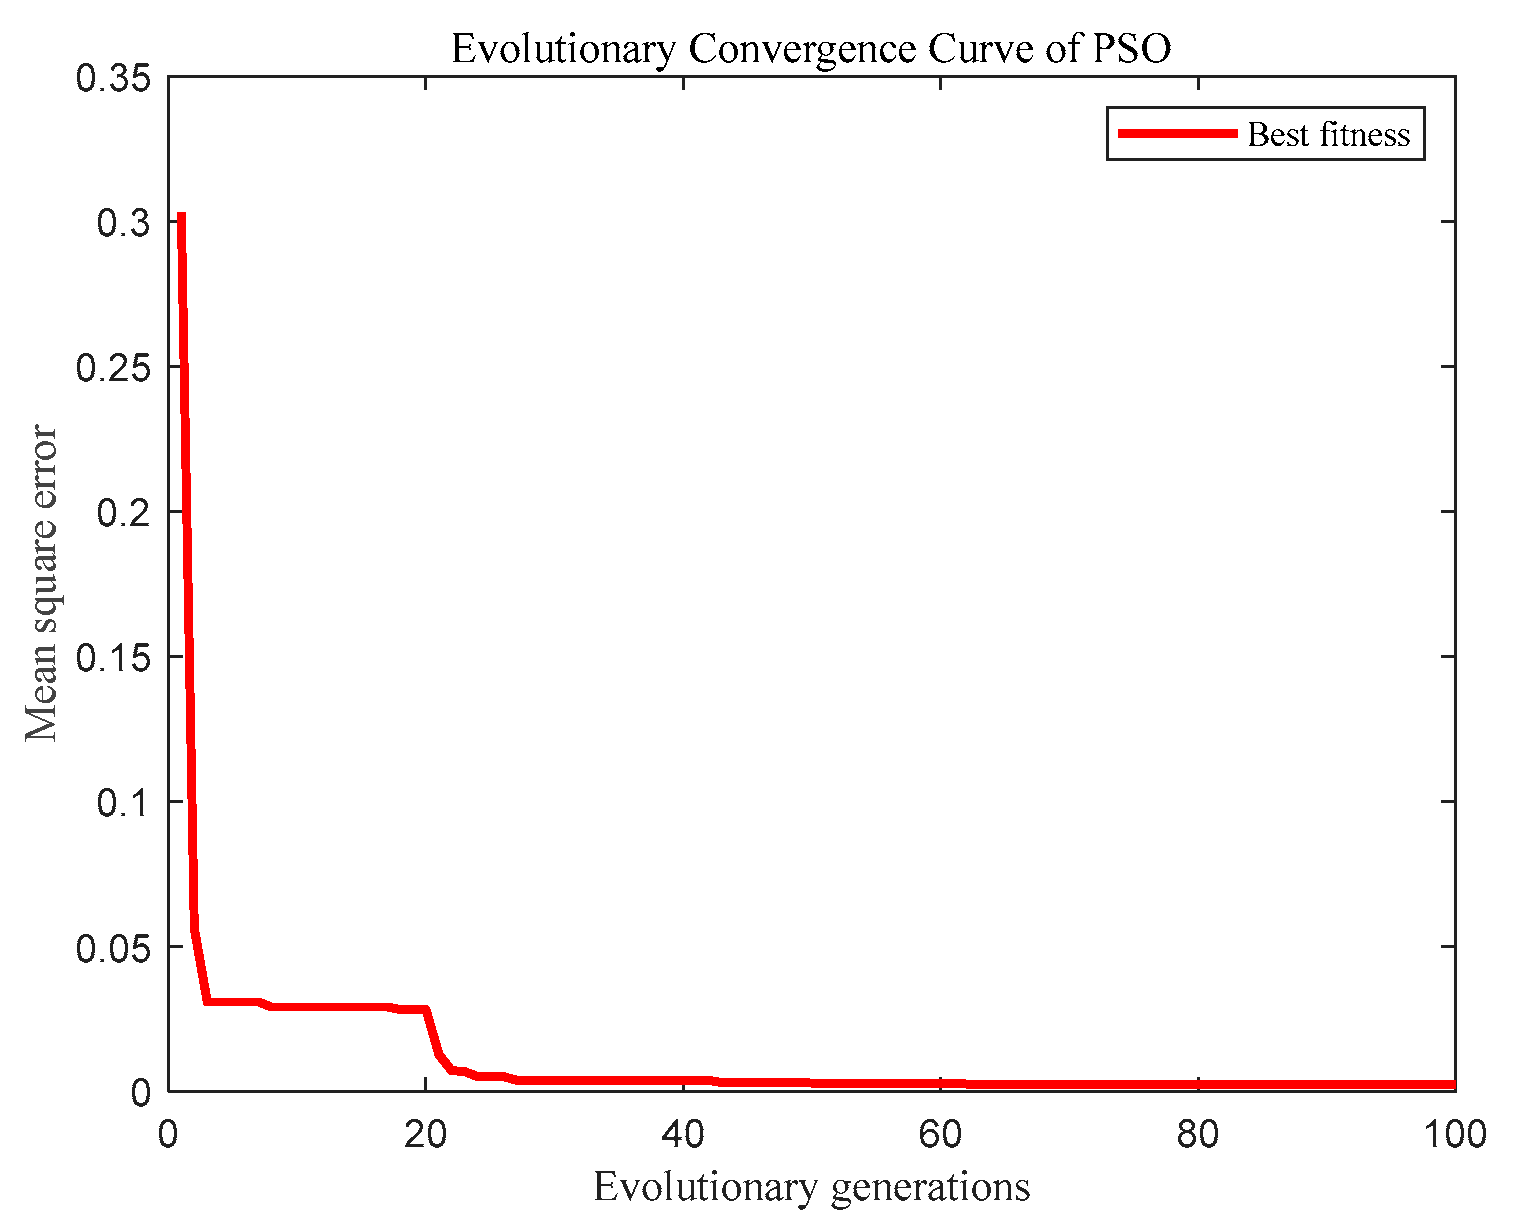
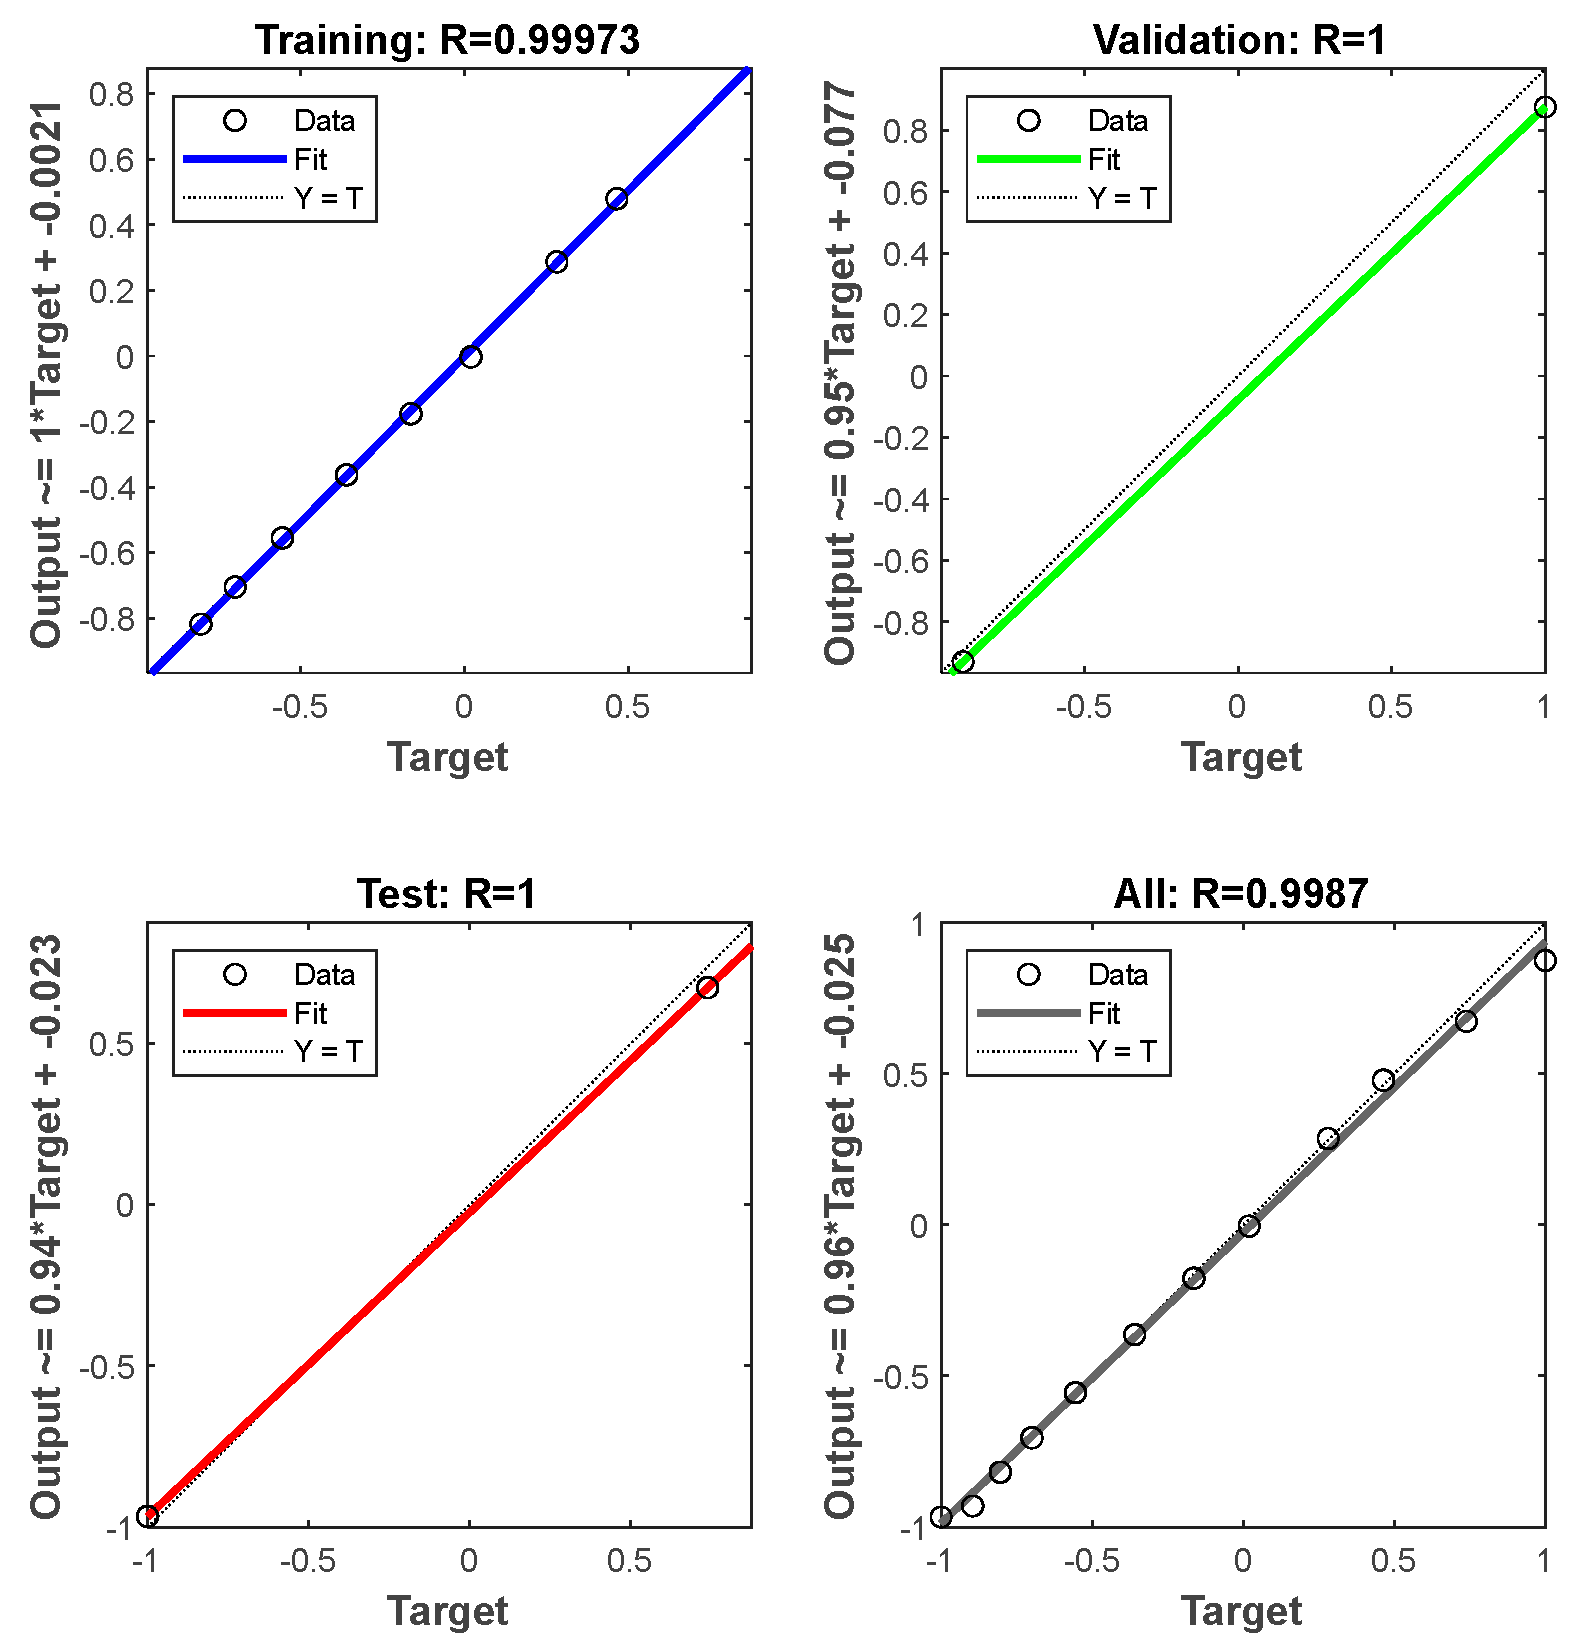
- The PSO-BP neural network model has better performance than the traditional BP neural network. The prediction accuracy of the PSO-BP model is better than that of a single BP neural network model. The PSO-BP model shows extremely high accuracy in the training process, and the convergence speed is also very fast. The preset accuracy is achieved only when the training times are 3 times and the training time is 0.043 s. The MSE, MAPE and RMSE of the predicted value and the expected value of the PSO-BP model are the smallest, with values of 0.0037557,0.020111 and 0.061283, respectively, and the coefficient of determination R2 is 0.96002; thus, its overall prediction effect is the best.
- (3)
- The error MSE, MAPE, RMSE and R2 of PSO-BP were 0.0037557,0.020111,0.061283 and 0.96002, respectively, which were 3.08463%, 3.82%, 12.4727% and 4.425% higher than those of the BP neural network prediction model. Compared with the GA-BP model, these values increased by 0.13211%, 0.01751%, 0.9969% and 0.235%; compared with the WOA-BP model, these values increased by 0.61555%, 1.4018%, 3.8272% and 2.153%, so the PSO-BP model had the highest prediction quality.
- (4)
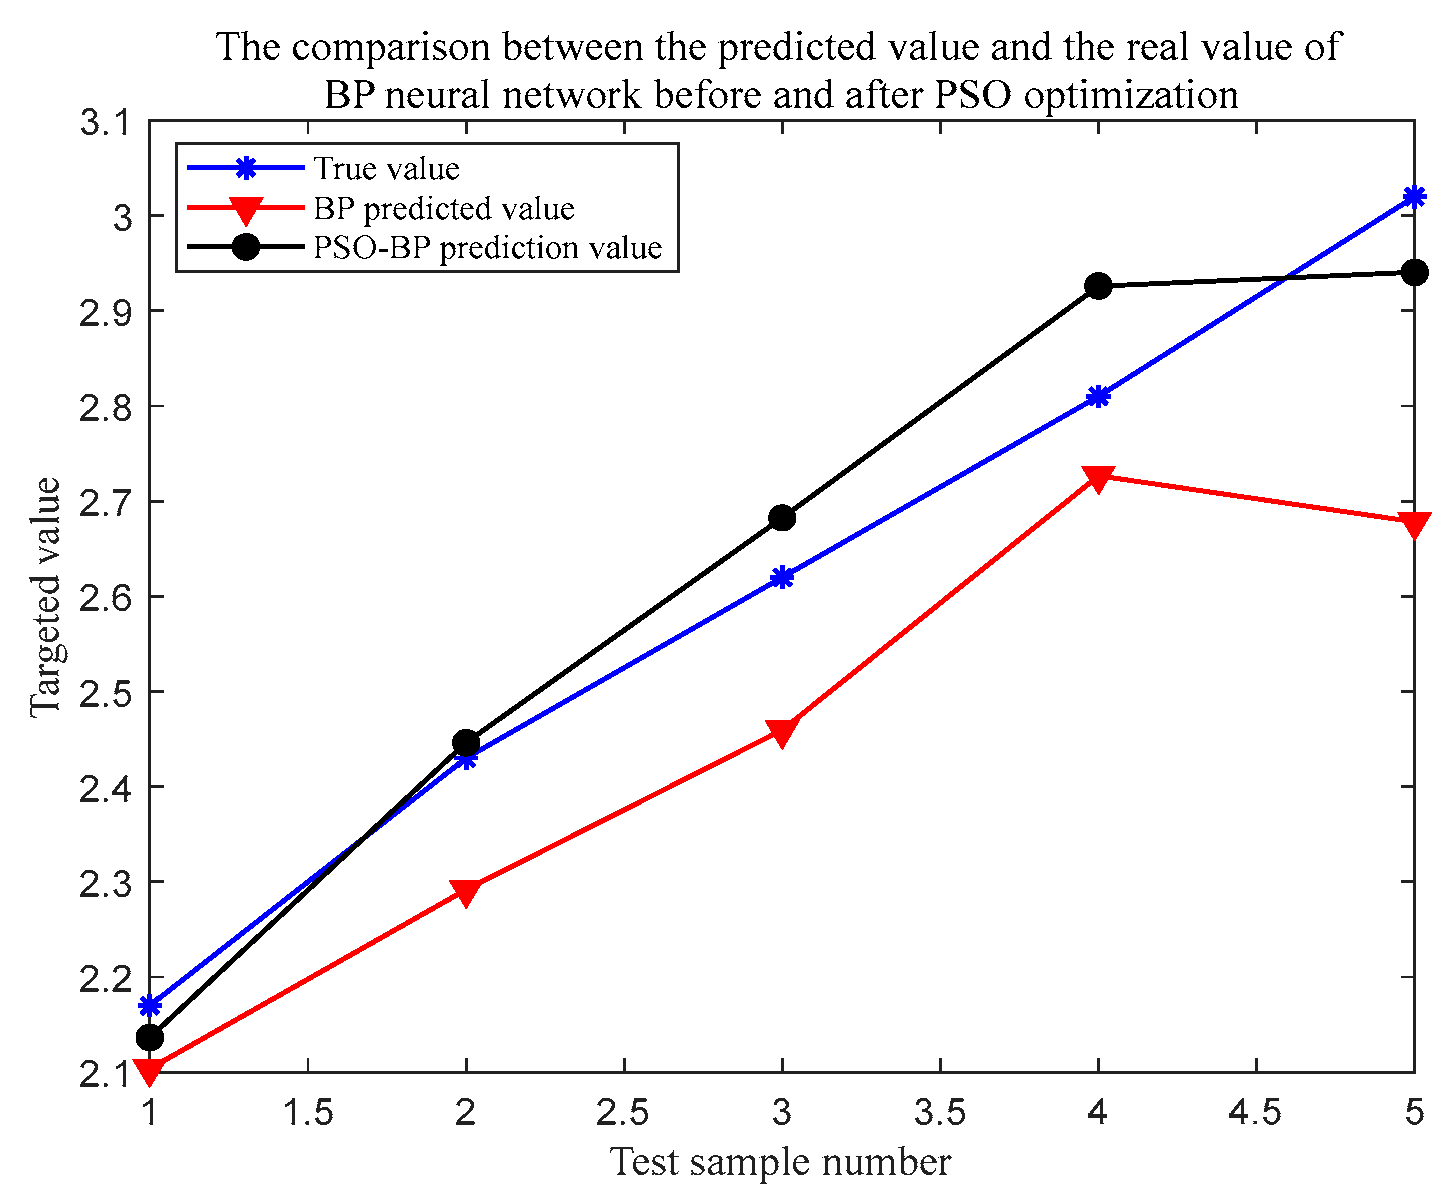
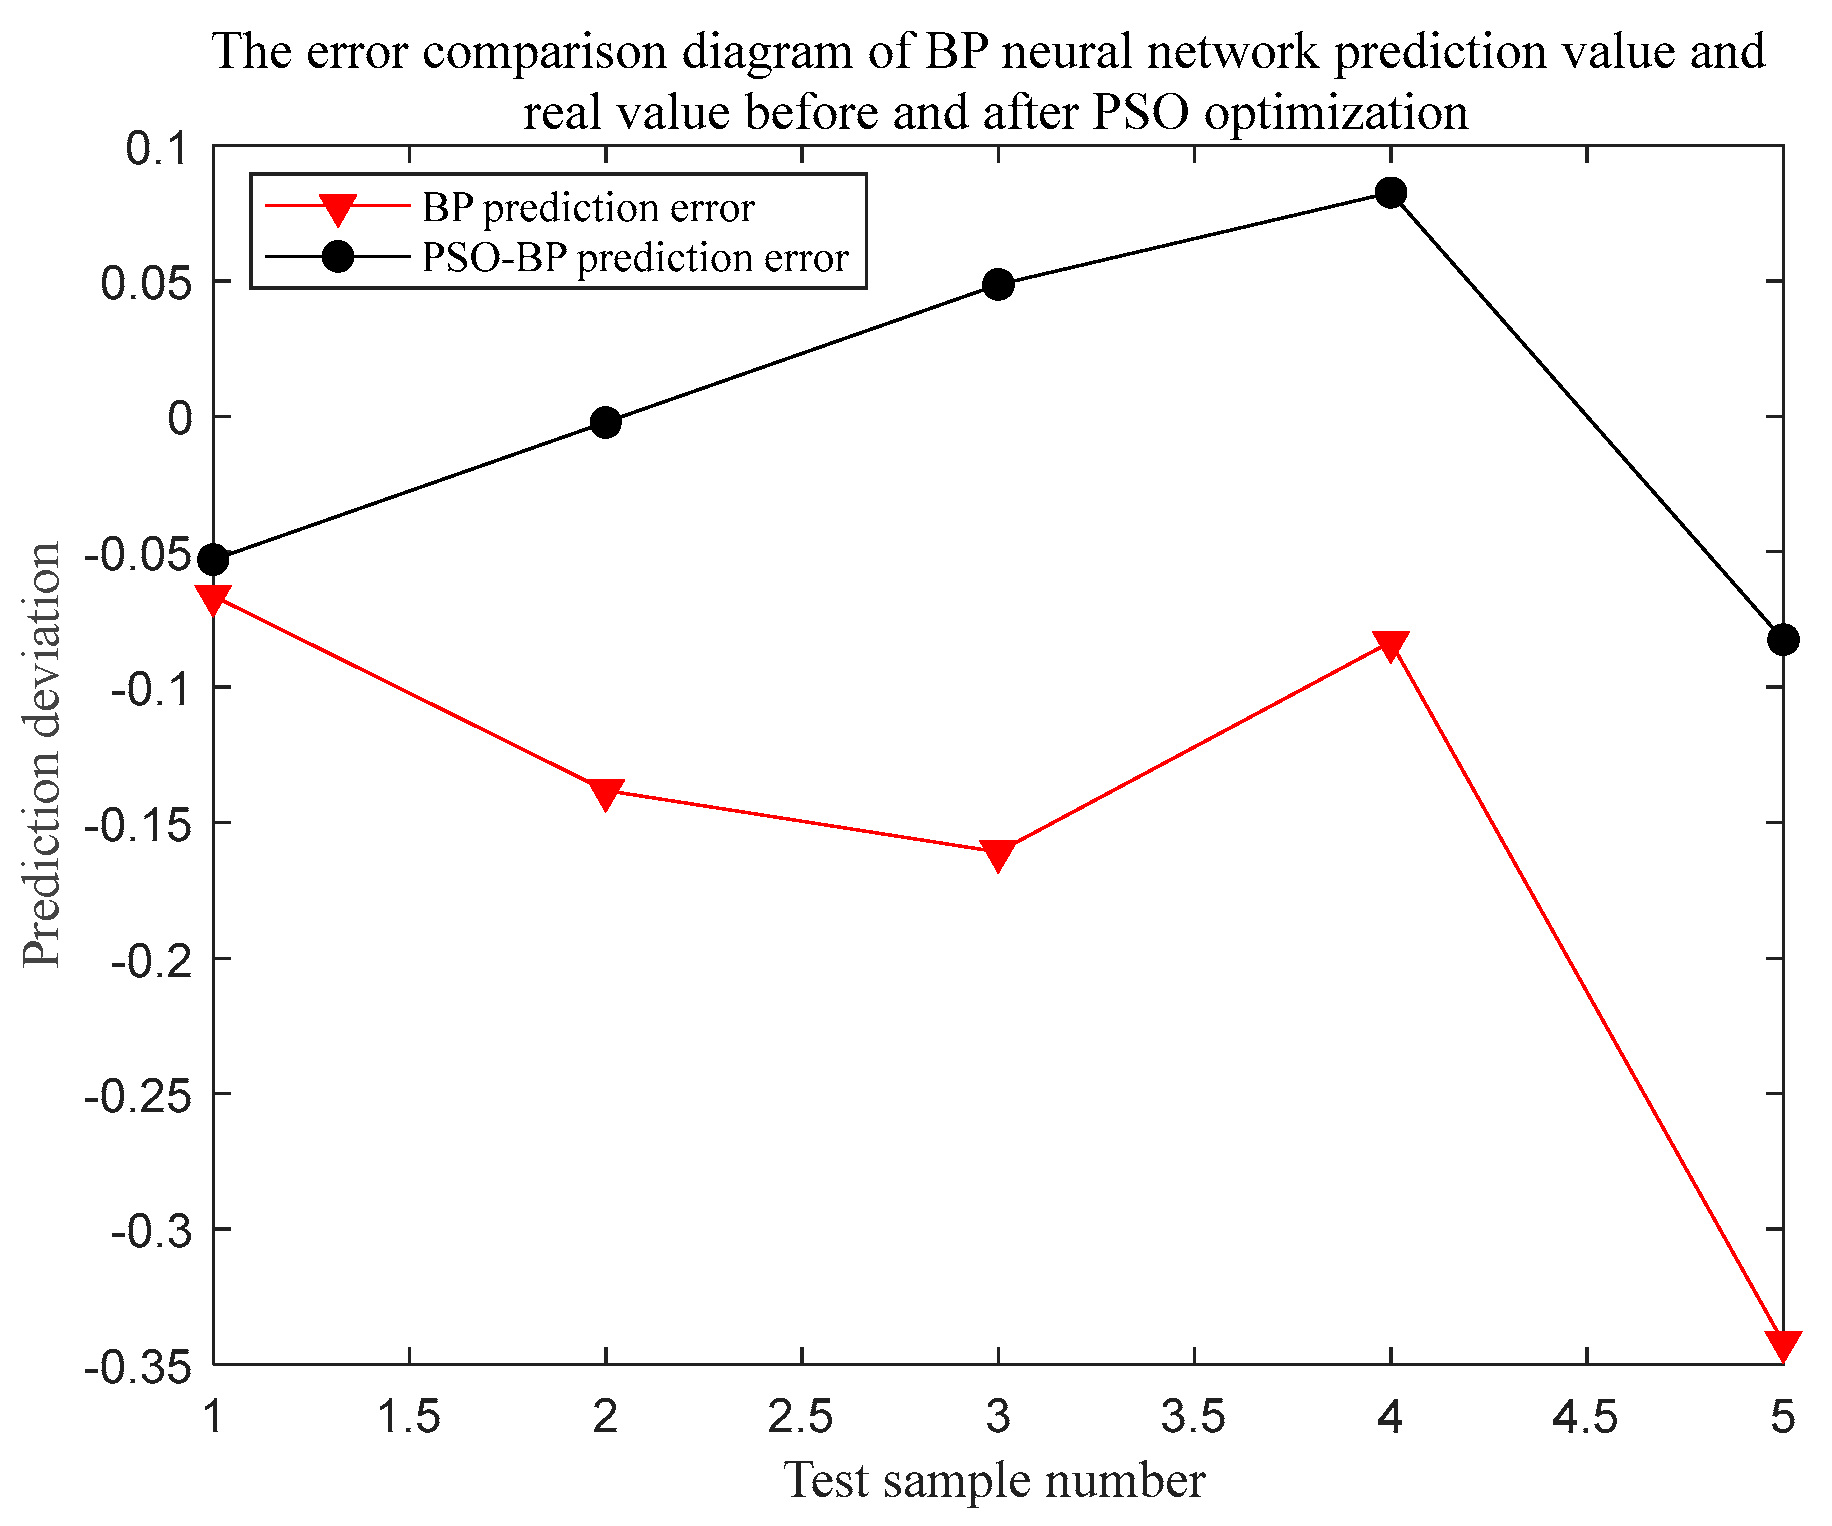
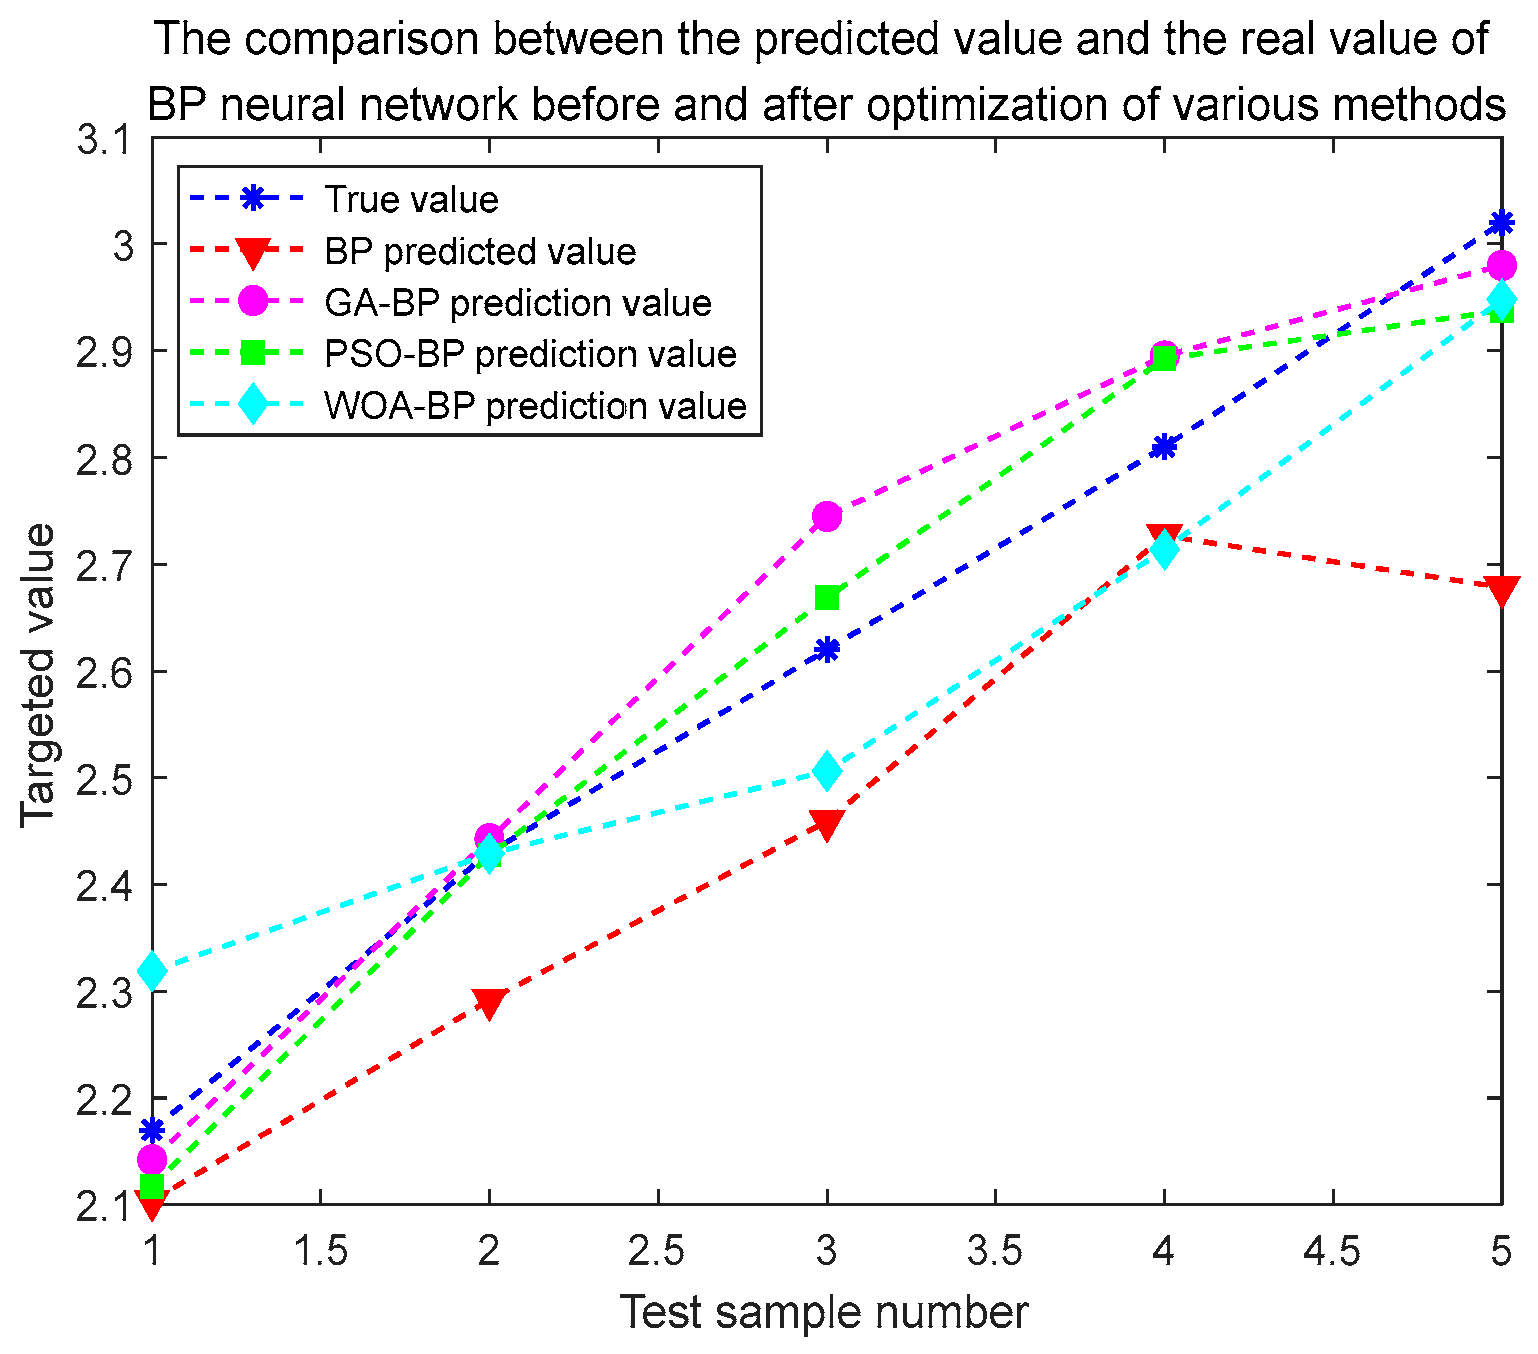
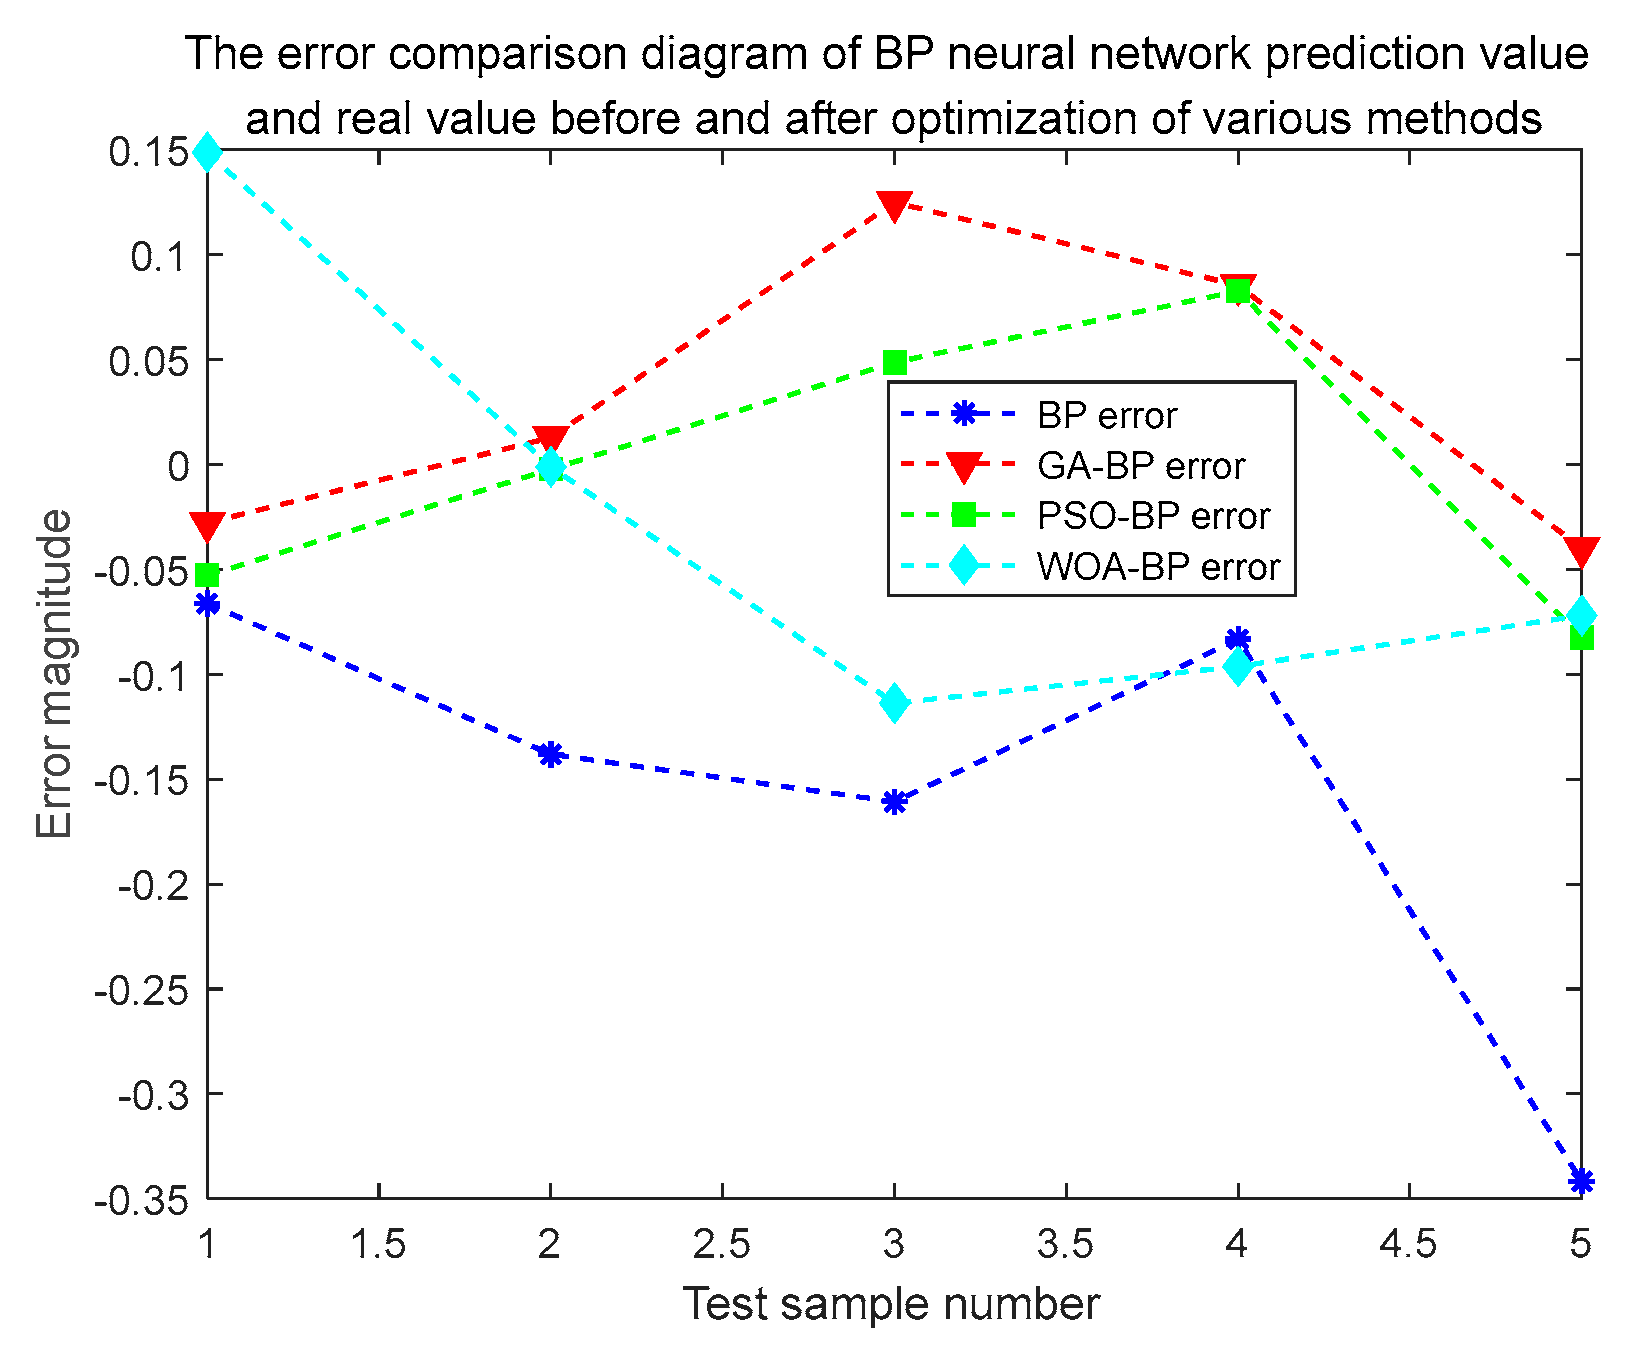
- By comparing the prediction results and errors of the neural network before and after PSO optimization, the predicted value of the PSO-BP neural network can be seen to be close to the real value, and its fitting degree is higher. At the same time, the error of the PSO-BP model is small, and its fluctuations are small. The prediction model based on the PSO-BP neural network has high accuracy and good stability and can effectively predict car ownership.
Author Contributions
Conceptualization, H.Z. and Y.L.; methodology, Y.L.; software, Y.L.; validation, H.Z. and Y.L.; resources, Y.L.; data curation, Y.L.; writing—original draft preparation, Y.L. and L.Y.; writing—review and editing, H.Z. and Y.L. All authors have read and agreed to the published version of the manuscript.
Funding
This work is supported by the University of Synergy Innovation Program of Anhui Province No. GXXT-2019-029, funding objects of the fund is Hualei Zhang.
Institutional Review Board Statement
Not applicable.
Informed Consent Statement
Not applicable.
Data Availability Statement
Not applicable.
Conflicts of Interest
The authors declare that the research was conducted in the absence of any commercial or financial relationships that could be construed as a potential conflict of interest.
References
- Wu, W.Q.; Xia, J. Prediction of China’s Car Ownership by Grey Neural Network with Simpson Formula. J. Chongqing Jiaotong Univ. Nat. Sci. 2019, 38, 101–108. [Google Scholar] [CrossRef]
- Zhang, L.Y.; Hu, X.S.; Chen, Q.Y.; Qiu, R.Z. Prediction of Car Ownership Based on Principal Component Analysis and Logistic Regression. J. Chongqing Jiaotong Univ. Nat. Sci. 2017, 36, 104–109. [Google Scholar] [CrossRef]
- Zhang, G.F.; Chen, X.; Li, S.X. Research on Forecast of Electric Vehicle’s Ownership Based on the Comparison of Bass Model and Lotka-Volterra Model. J. Wuhan Univ. Technol. Inf. Manag. Eng. 2017, 39, 91–98. [Google Scholar]
- Du, D.F.; Jia, J.H. Joint prediction of car ownership based on improved Compertz-PCA. Technol. Econ. Areas Commun. 2021, 23, 47–53. [Google Scholar]
- Lian, L.; Tian, W.; Xu, H.F.; Zheng, M.L. Modeling and Forecasting Passenger Car Ownership Based on Symbolic Regression. Sustainability 2018, 10, 2275. [Google Scholar] [CrossRef]
- Lou, G.Z.; Tan, Y. Prediction of the height of water flowing fractured zone based on PSO-BP neural network. Coal Geol. Explor. 2021, 49, 198–204. [Google Scholar]
- Zhang, X.W.; Chang, J.Y. Research on Urban Car Ownership Prediction Based on PCA-BP Neural Network. Comput. Simul. 2012, 29, 376–379. [Google Scholar]
- Wu, C.R.; Wang, S.S. Research of RBF Neural Network Factor Analysis to Forecasting the Automobile Population. In Proceedings of the 9th China Intelligent Transportation Annual Conference, Guangzhou, Guangdong, China, 11 November 2014; pp. 233–239. [Google Scholar]
- Wang, D. Prediction of Car Ownership Based on Grey Relational Analysis and BP Neural Network. Comput. Tech. Autom. 2015, 34, 29–33. [Google Scholar] [CrossRef]
- James, D.; Sofia, K.; Christian, B.; Malcolm, M.; Keith, B. Spatially Disaggregated Car Ownership Prediction Using Deep Neural Networks. Future Transp. 2021, 1, 113–133. [Google Scholar]
- Long, W.; Liang, X.M.; Xiao, J.H.; Yan, G. Dynamic hierarchical hybrid particle swarm optimization algorithm. Control. Decis. 2009, 24, 1513–1516+1521. [Google Scholar]
- Cheng, X.Y.; Hu, X.P.; Li, Z.Z.; Geng, C.H.; Liu, J.X.; Liu, M.; Zhu, B.K.; Li, Q.; Chen, Q.G. Using Genetic Algorithm and Particle Swarm Optimization BP Neural Network Algorithm to Improve Marine Oil Spill Prediction. Water Air Soil Pollut. 2022, 233, 354. [Google Scholar] [CrossRef]
- Wang, F.Q.; Li, X.L.; Yu, X.B. Study on Optimization of Denitrification System for Coal-fired Units Based on GA-BP Predictive Control. Control. Eng. China 2021, 28, 1490–1495. [Google Scholar] [CrossRef]
- Wang, H.C.; Li, S.; Lin, L.; Zhai, C.; Xing, W.M. Deformation Prediction of Adjacent Tunnel Induced by Foundation Pit Excavation Based on BP Network Model. Chin. J. Undergr. Space Eng. 2021, 17, 832–839+847. [Google Scholar]
- Ma, H.H. Research on Beamforming of IRS-Assisted Secure Communication System Based on PSO Algorithm; Nanjing University of Posts and Telecommunications: Nanjing, China, 2022. [Google Scholar]
- Hui, Y.; Wang, Y.G.; Peng, H.; Hou, S.Q. Subway passenger flow prediction based on optimized PSO-BP algorithm with coupled spatia-temporal characteristics. J. Traffic Transp. Eng. 2021, 21, 210–222. [Google Scholar] [CrossRef]
- Chen, Z.M.; Zou, J.S.; Wang, W.; Shi, M.Q. Multi-objective optimization of casting-forging dynamic forming based on improved particle swarm neural network and finite element analysis. J. Jilin Univ. Eng. Technol. 2022, 52, 1524–1533. [Google Scholar] [CrossRef]
- Xiao, R.G.; Wang, D.; Wang, Q.X. Prediction of corrosion rate of submarine oil and gas pipelines based on ASO-BP neural network. Chem. Ind. Eng. 2022, 39, 109–116. [Google Scholar] [CrossRef]
- Yang, H.G.; Gu, J.H.; Jiang, L.; Pang, Y.J.; Li, L. Measuring error rea-time modeling prediction of CNC machine tool son-machine measuring system based on DSP. J. Hefei Univ. Technol. Nat. Sci. 2020, 43, 157–161. [Google Scholar]
- Ning, Y.X.; Cui, X.M. PSO-ELM prediction model for surface deformation of mine slope. Coal Geol. Explor. 2020, 48, 201–206+216. [Google Scholar]
- Wang, Q.H.; Jia, S.Y.; Hu, J.H.; Shuang, Y.H.; Zhao, T.L. Prediction of pipe shape in cross-rolled piercing by PSO-BP neural network based on GRA. Forg. Stamp. Technol. 2022, 47, 88–94. [Google Scholar] [CrossRef]
- Yang, S.R.; Bai, H.Q.; Bao, J.; Ren, L.; Li, C.F. Prediction of cladding layer morphology based on BP neural network optimized by regression analysis and genetic algorithm. Laser Optoelectron. Prog. 2022, 59, 149–157. [Google Scholar]
- Cao, G.X.; Wang, X.; Lei, G.C. Simulation of alpine wetlands CO2 flux and its influencing factors based on BP neural network optimized by genetic algorithm in Oinghai—Tibet Plateau. J. Shandong Univ. Nat. Sci. 2021, 56, 33–41+50. [Google Scholar]
- Zhou, Z.; Zhang, J.J.; Ding, H.H.; Li, F. Prediction model of sewage treatment in tunnel green construction based on PSO-BP neural network. J. Railw. Sci. Eng. 2022, 19, 1450–1458. [Google Scholar] [CrossRef]
Disclaimer/Publisher’s Note: The statements, opinions and data contained in all publications are solely those of the individual author(s) and contributor(s) and not of MDPI and/or the editor(s). MDPI and/or the editor(s) disclaim responsibility for any injury to people or property resulting from any ideas, methods, instructions or products referred to in the content. |
© 2023 by the authors. Licensee MDPI, Basel, Switzerland. This article is an open access article distributed under the terms and conditions of the Creative Commons Attribution (CC BY) license (https://creativecommons.org/licenses/by/4.0/).