1. Introduction
El Hierro is an island in the Canary Islands archipelago. It aims to become entirely free from carbon dioxide emissions [
1]. This aim is common to many islands in the world [
2], even to whole countries, such as Indonesia [
3] or Germany [
4]. To this end, a hybrid wind–hydropower plant was built in El Hierro and commissioned in 2014–2015 [
5]. However, to date, the wind–hydropower plant of El Hierro island has not achieved a continuous 100% supply of load demand [
2]. Notwithstanding, it has been able to supply demand for several hundred hours at the cost of load shedding [
6,
7]. Another negative effect is an increase in the annual [
8] and levelized [
9] costs of energy in El Hierro’s power system. Consequently, the optimum generation scheduling in this power system remains an open problem [
10].
The aim of increasing renewable energy demand coverage is increasingly being applied all over the world, especially in small communities [
11]. In order to increase the share of renewable energy demand coverage in El Hierro island, the addition of a new photovoltaic power system and a new battery storage system was proposed [
12]. Their size and impact on the operation of the wind–hydropower plant is analyzed in this paper. To this end, a software tool has been developed. This tool can simulate the performance of the actual system and incorporates new energy sources.
The aim of this research is to explore not only the impact that the incorporation of new photovoltaic generators and battery storage would have on the island’s energy but also what possibilities exist for the island of El Hierro to reach the desired 100% of renewable coverage. To carry out this investigation, a tool programmed in Python [
13] was developed. This tool can simulate the current performance of El Hierro’s electrical power system. In addition, it can also simulate the performance of the system, modifying the existing units or adding new energy sources, such as photovoltaic generation. Prior to building the simulation tool, a study of the wind-pumped hydraulic power plant and its historical operating data was completed.
Initially, the data of power generation and demand of El Hierro island provided by Red Electrica (Redeia) [
14] for the last 7 years were analyzed. For this purpose, a specific code was programmed in JavaScript language which automates the process of obtaining the data from the Red Electrica website. Subsequently, a study of the data was performed by writing several programs in Python that allow the organization and analysis of the island’s energy use.
On the other hand, the data provided by the Gorona del Viento power plant in terms of operation and annual results were also assessed [
15]. As previously conducted, its analysis, together with the data obtained from Red Electrica, was carried out by means of a specific code programmed in Python. Due to these data and their comparison, it has been possible to deduce the operational strategy used by the wind-pumped hydraulic power plant. This knowledge increases the tool’s versatility through the incorporation of the operational strategies observed during the data analysis.
In addition to the demand and operational historical data, data on renewable resources present on the island in terms of wind speeds and solar irradiance have also been obtained [
16]. The wind data obtained at a meteorological station near the pumped hydraulic power plant have been processed to fit them to the conditions existing in the wind farm. This data processing was performed by comparing the data provided by the Gorona del Viento power plant with those measured at the weather station. In order to compare them, a Python program was written. It applies the necessary conditions to every ten-minute period available each year. To obtain the solar resource data, the European PVGIS database was used. And the PVSyst v7.2.7 software (Satigny, Switzerland) was used to evaluate the performance that a photovoltaic installation would have on the island [
17].
Besides the treatment of load demand and renewable resource data, the units that participate in the island’s electricity generation were also modelled by the designed tool. The behavior and performance of these units has been studied in detail and is represented in the simulator for its complete operating range. Therefore, the tool created works with ten-minute input data of wind speeds, solar irradiance and electricity demand. Through the modelling of the different units, it carries out the energy dispatch. Thanks to the interface of this tool, it is possible to modify the rated power of the different units on the island as well as of new ones that can be incorporated, allowing a complete energy study.
The rest of this paper is organized as follows:
Section 2 describes the characteristics of El Hierro island’s power system.
Section 3 presents the models of the different units and energy storage systems present in this power system. In addition, it also presents the meteorological data used to model the renewable energy sources existent or considered in this power system. Then,
Section 4 presents and discusses the results of the simulations. Finally,
Section 5 draws the main conclusions of the research carried out.
2. Case Study
El Hierro island is one of the smallest islands in the Canary Islands archipelago, with an area of approximately 268 km
2. Notwithstanding, it has an abrupt morphology, with its highest point at 1501 m above sea level [
18]. Its average maximum and minimum temperatures are 23.3 °C and 18.7 °C, respectively. It has 2382 sun hours yearly [
19]. Due to the geographical location of the Canary Islands archipelago, trade winds blowing over this island are nearly constant during summer months.
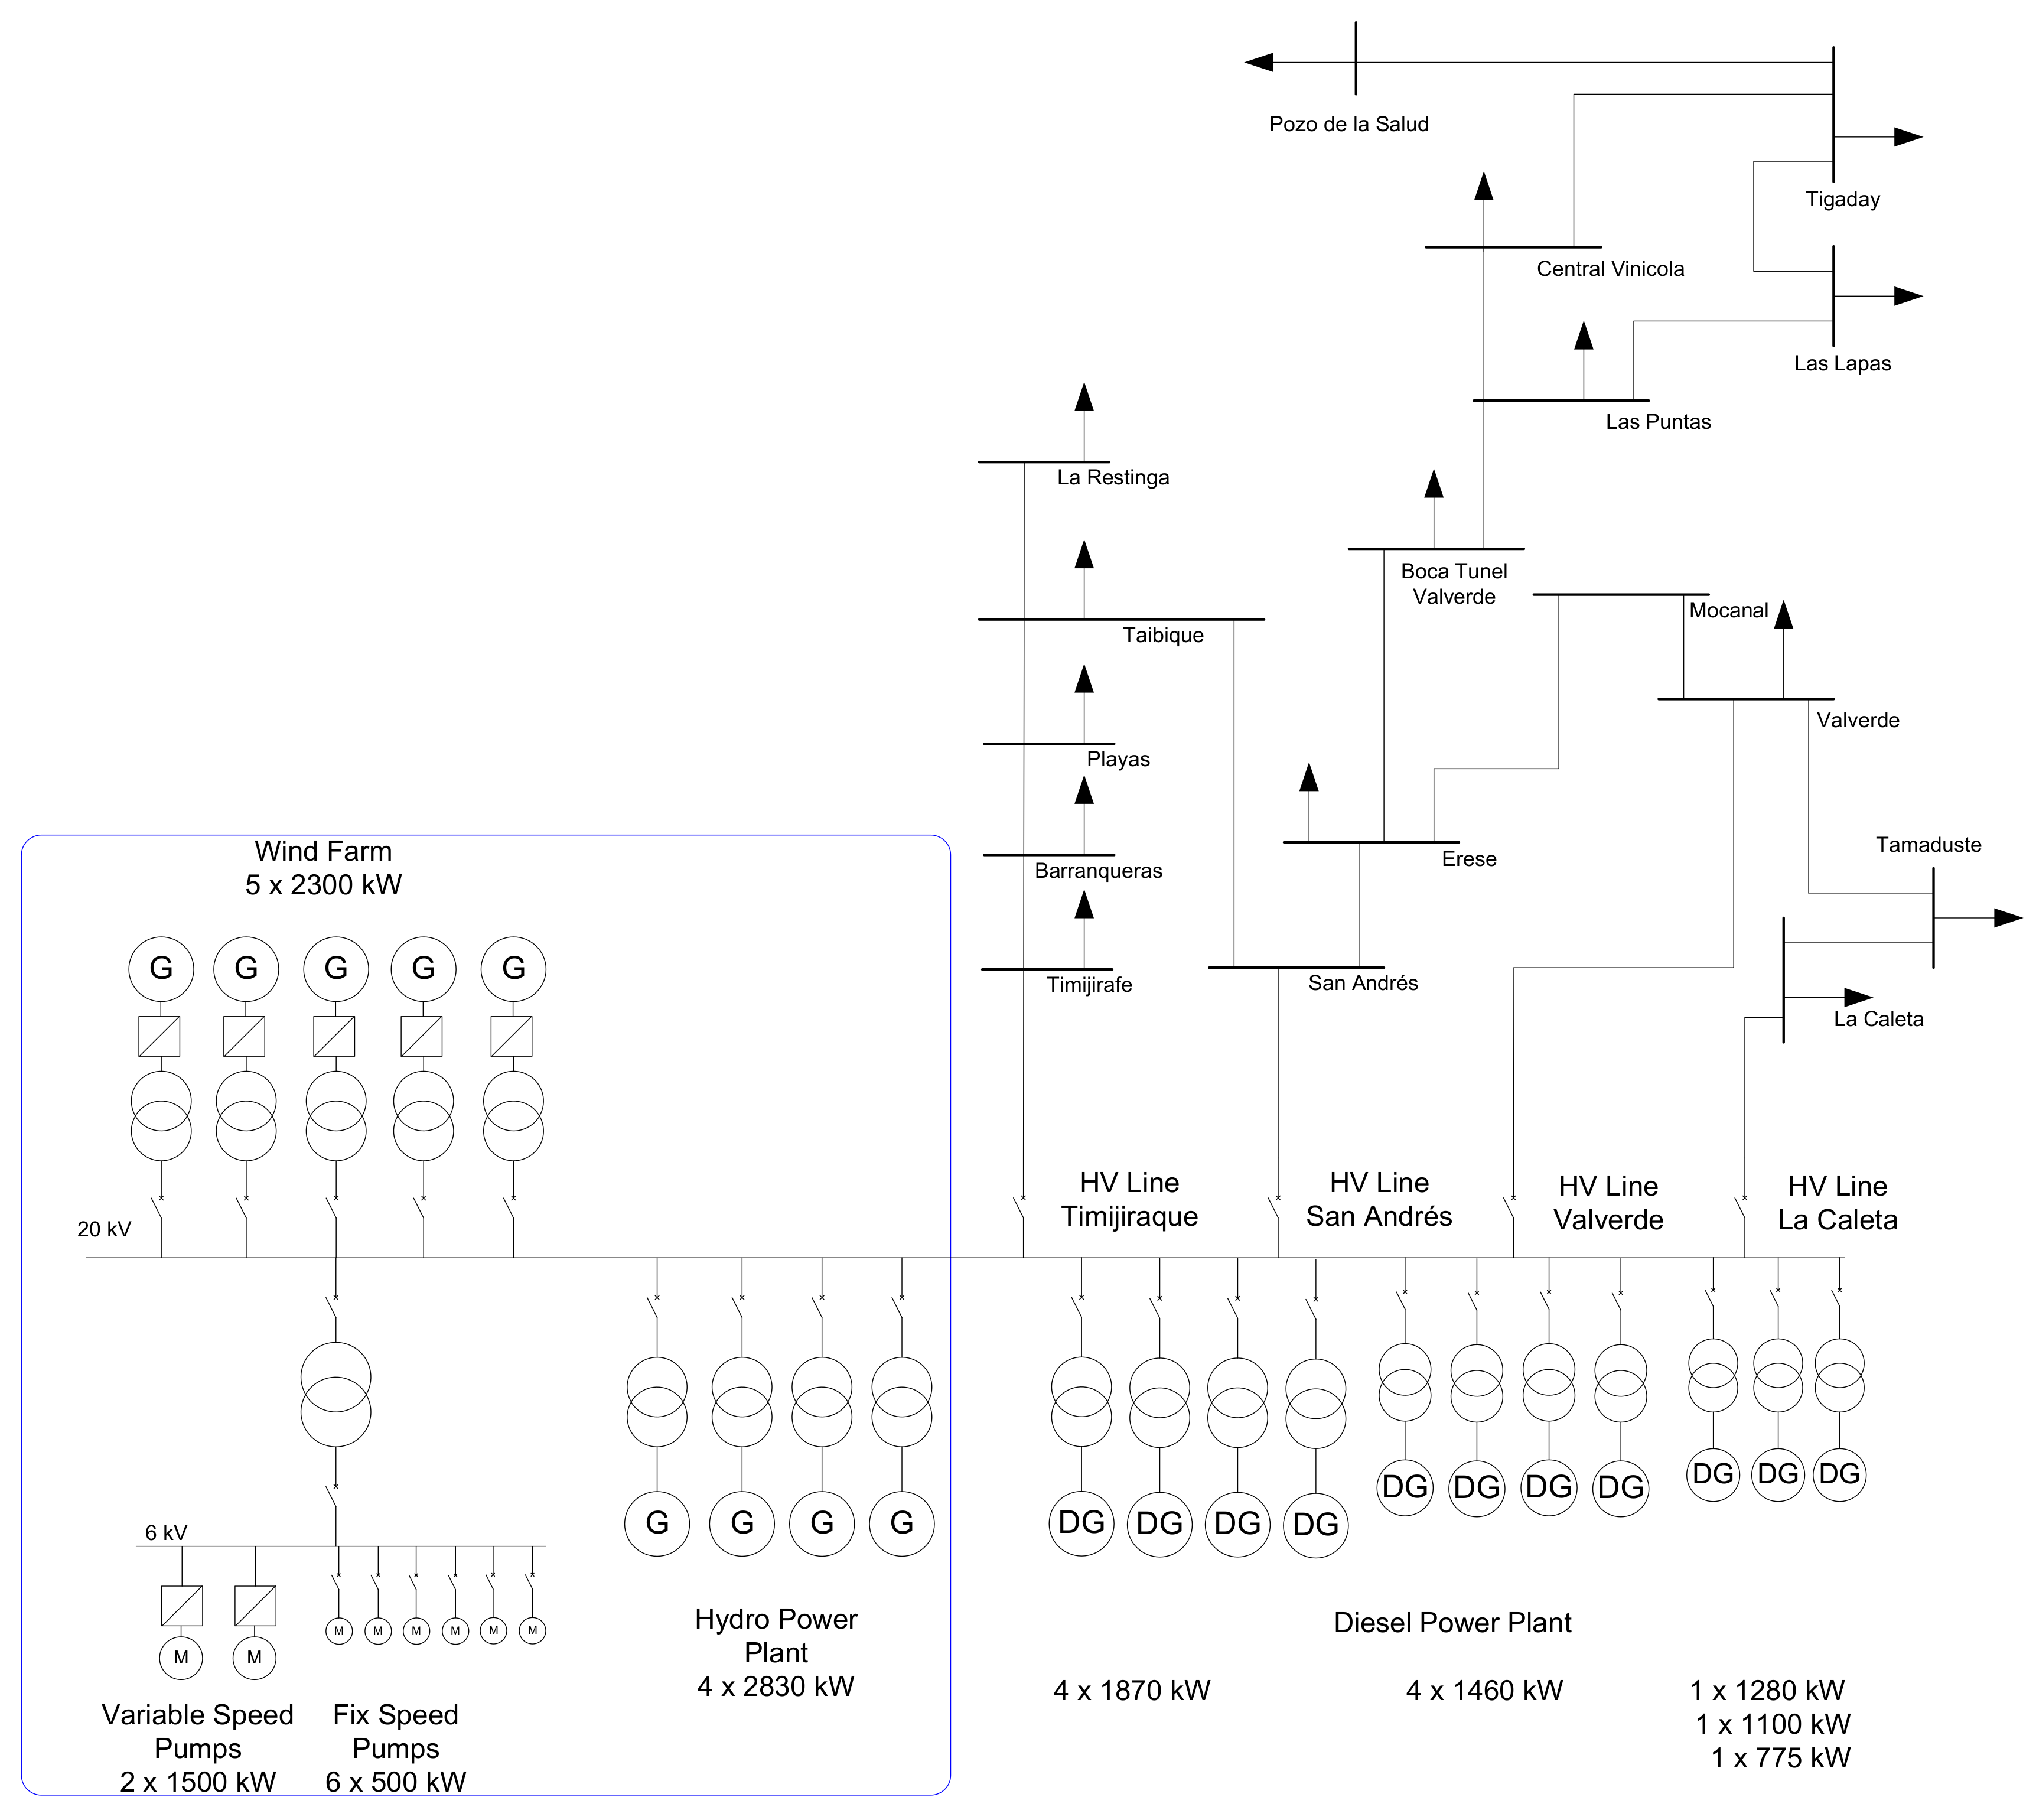
The El Hierro power system is isolated [
20]. Currently, it has a diesel power plant with 10 units, a wind farm with 5 Enercon-E70 wind generators (total wind power of 11.5 MW) and a pumped storage hydropower plant. Their annual electric demand is around 50 GWh and its maximum demand is around 8 MW [
21].
Table 1 shows the island power demand in recent years.
The pumped-storage hydropower plant has an upper reservoir of 380,000 m
3 and a lower reservoir of 150,000 m
3. Their height difference is 655 m. These reservoirs are connected by two pipes. One pipe, 2350 m length and 1 m diameter, starts in the upper reservoir and ends in a hydroelectric power plant with four 2.83 MW Pelton turbines. The other pipe has 3015 m length and 0.8 m diameter and starts at the upper reservoir and ends at the 6 MW pumping station [
5].
The hydroelectric power plant is connected to the grid through a 12 MVA transformer. Each turbine drives a 3.3 MVA synchronous generator. The losses of these machines are shown in
Table 2. The pumping station is fed through an 8 MVA transformer. It has two 1.5 MW variable-speed pumps and six 0.5 MW fixed-speed pumps.
Table 3 and
Table 4 show the characteristics of these pumps and those of the motors that drive them.
Table 5 shows the characteristics of the diesel power plant.
This power system has a 20 kV electric grid.
Figure 1 shows a one-line diagram of this grid.
3. Materials and Methods
In order to simulate the performance of a power system, models of the power plants are needed. As this study provides an estimation of the energy mix based on optimizing its efficiency, the models of the power system components should evaluate their efficiency depending on their operating point. In what follows, the applicable models are described.
3.1. Wind Farm Model
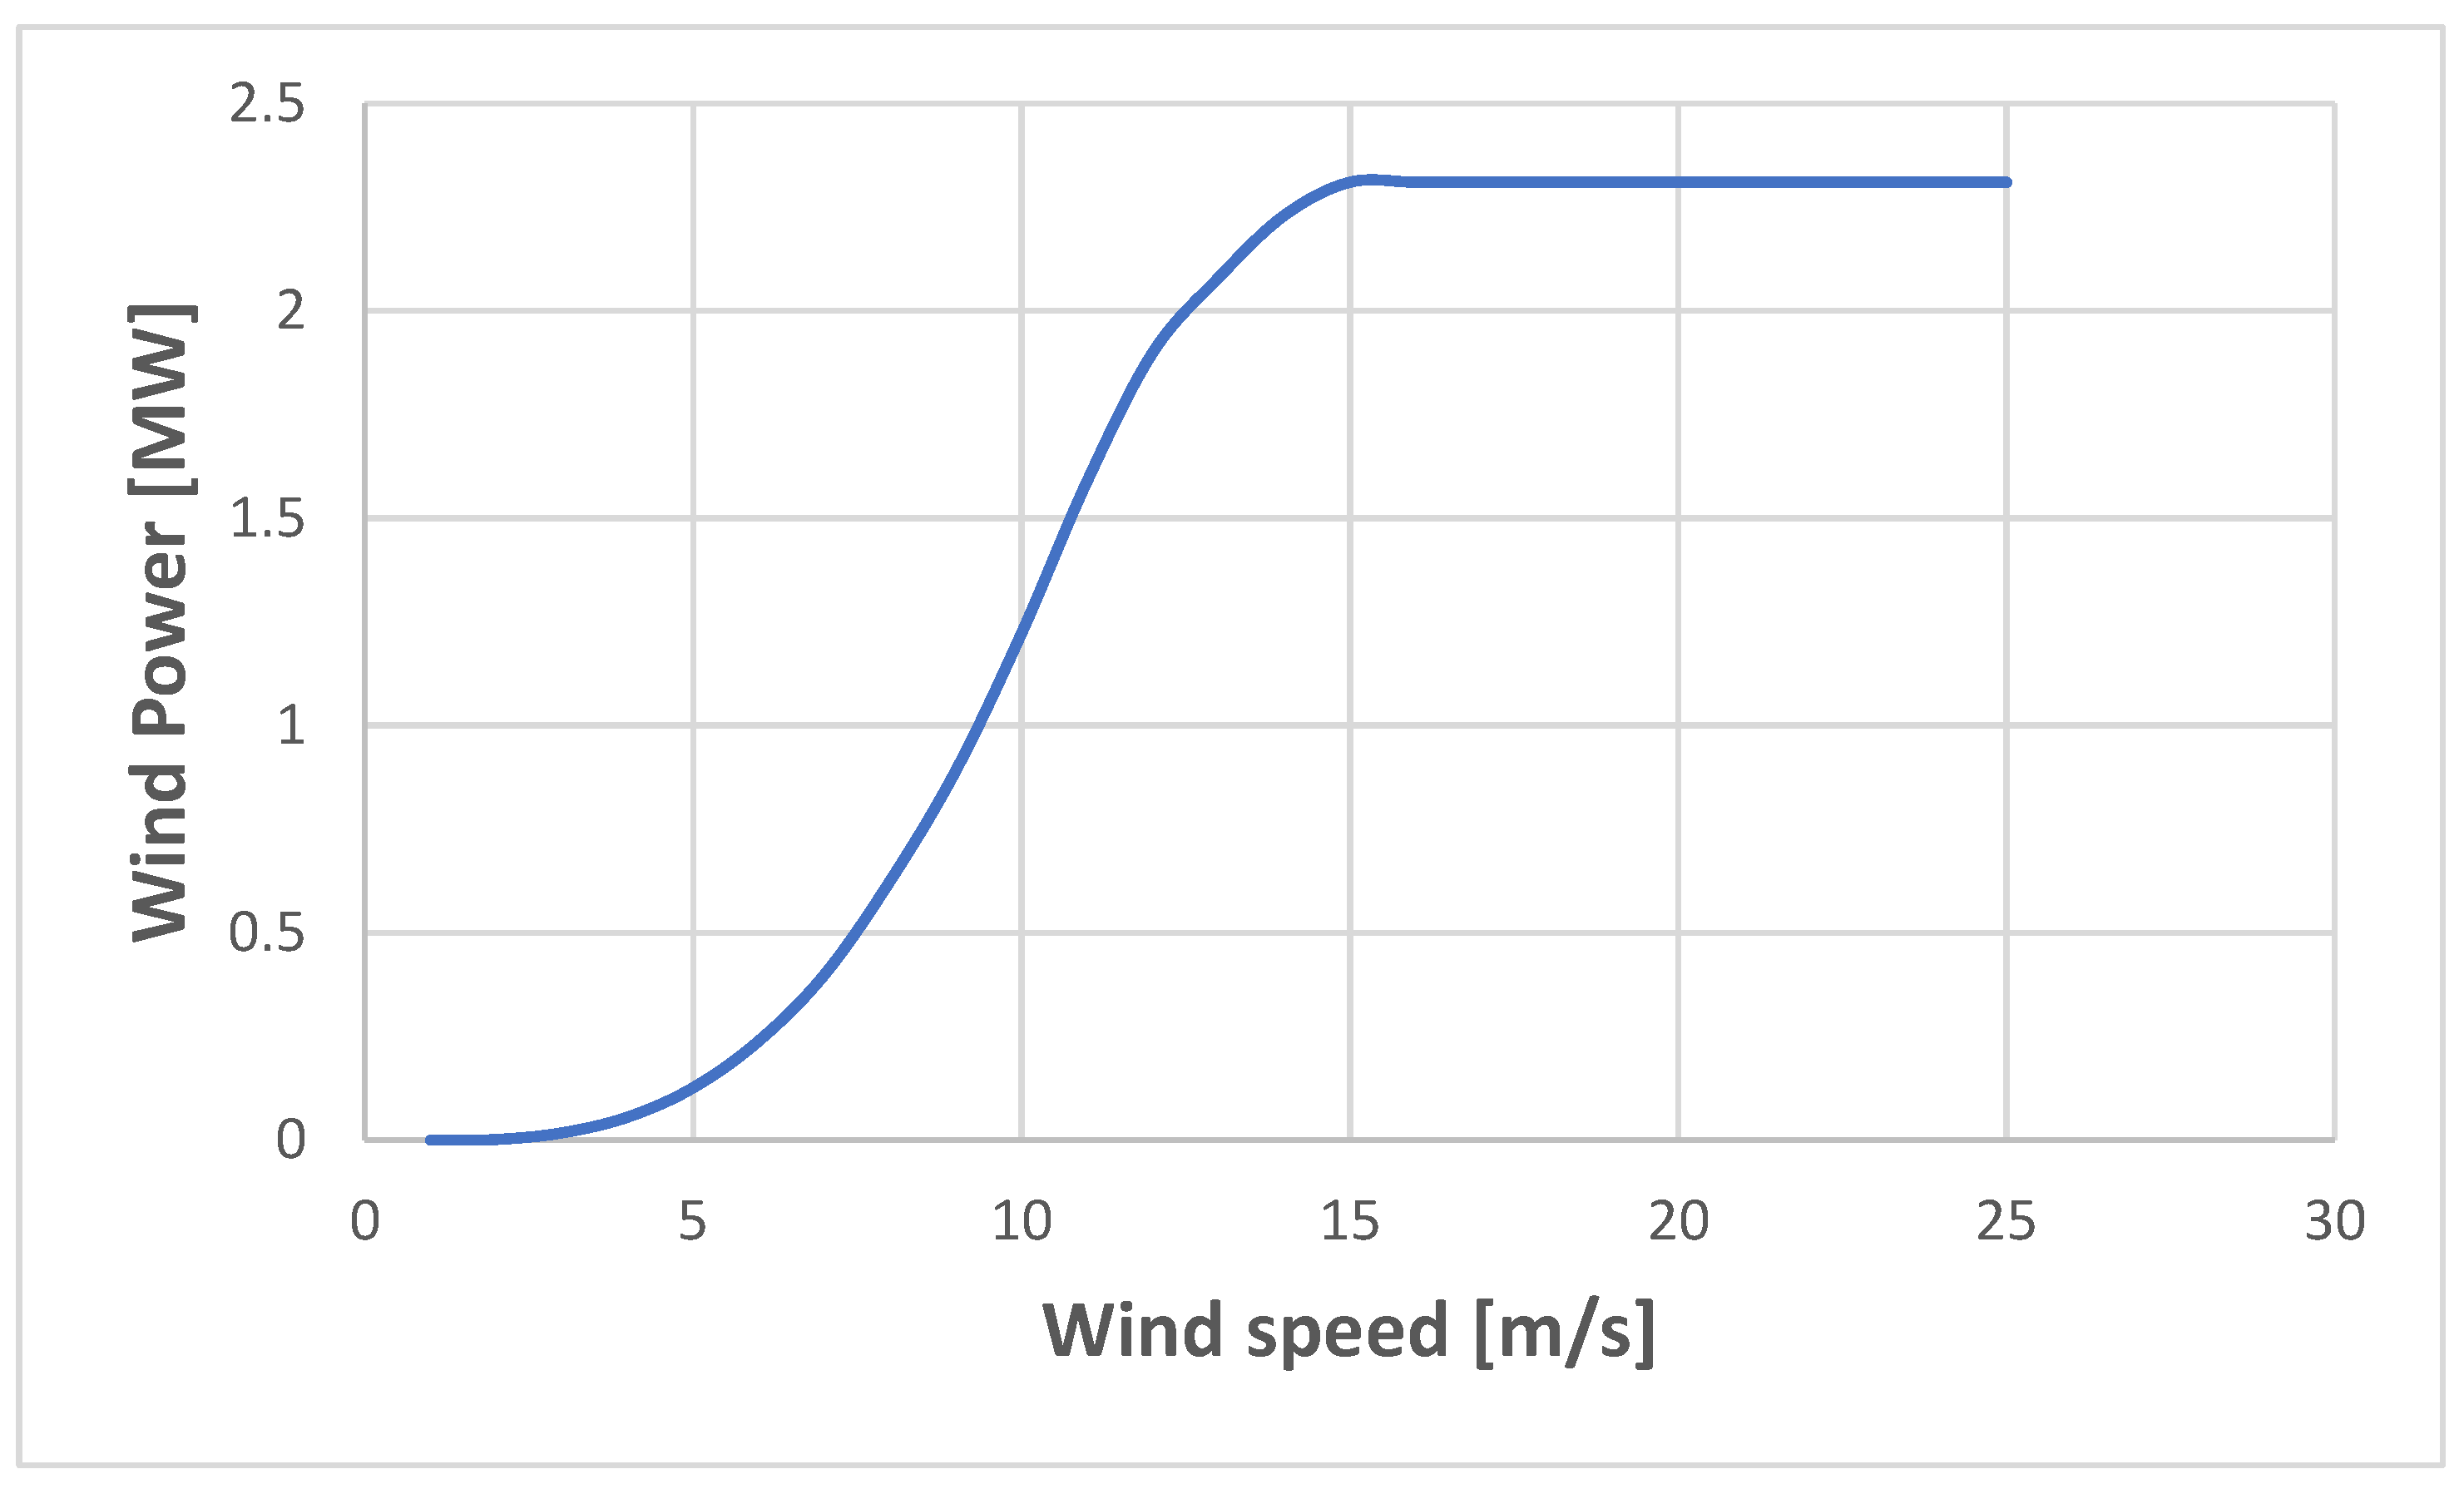
The wind generators installed in the wind farm have a synchronous generator connected through a full converter to the grid. Thus, they are modelled using the manufacturer’s provided power curve [
22]. These wind generators have their own transformer that steps up their voltage from 690 V to 20 kV, which is the voltage of the island grid. Therefore, the input to the wind farm model is the wind speed and its output is the electrical power supplied to the island grid. In order to create the simulations, the manufacturer’s power curve is approximated by third-order polynomials.
Figure 2 shows the power curve.
3.2. Hydropower Plant Model
The hydropower plant converts the potential energy stored in the upper reservoir into electrical energy supplied to the island grid. The hydraulic turbines are also used to provide grid stability. They provide inertia and short-circuit power to contribute to island grid stability.
Regarding the energy conversion process, there are three elements involved:
Hydraulic turbines: They convert water kinetic and pressure energy into mechanical rotating energy.
Synchronous generators: They convert the mechanical rotating energy provided by the turbines into electrical energy. Also, they can contribute to grid voltage regulation.
Electrical transformer: It adapts the electrical power provided by the synchronous generators from their voltage level to the island grid voltage.
Every device will be individually modelled and their combined efficiency will provide the relationship between turbined water and electrical power supplied to the island grid.
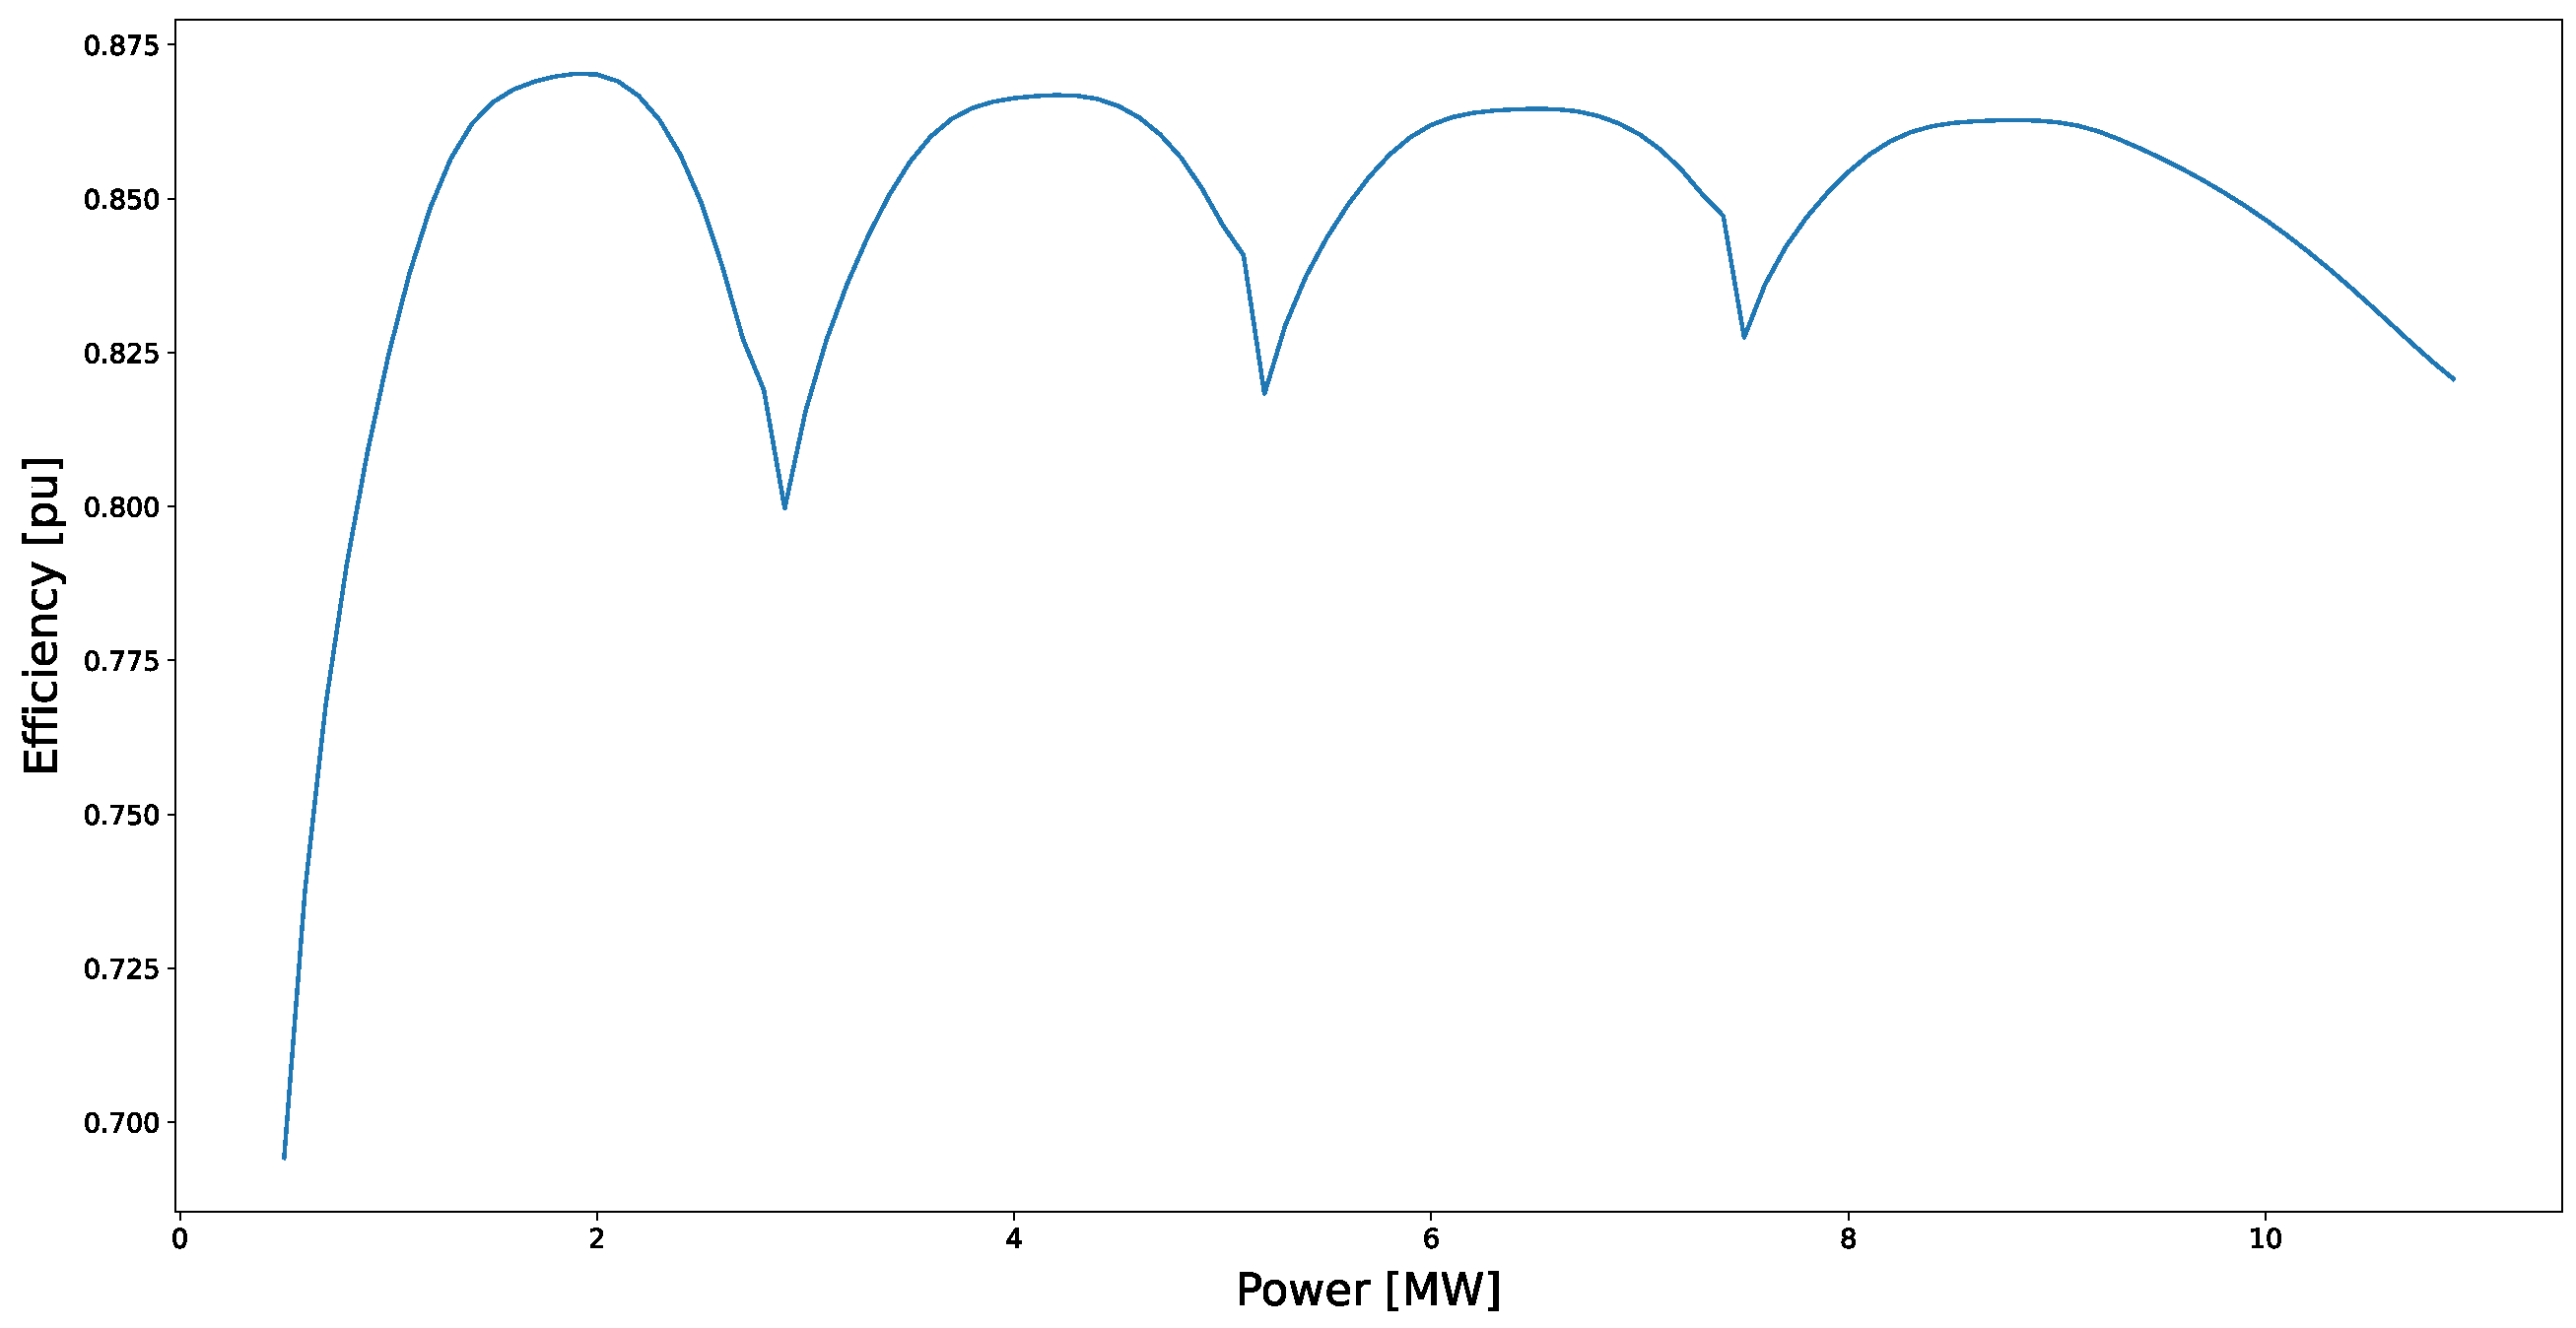
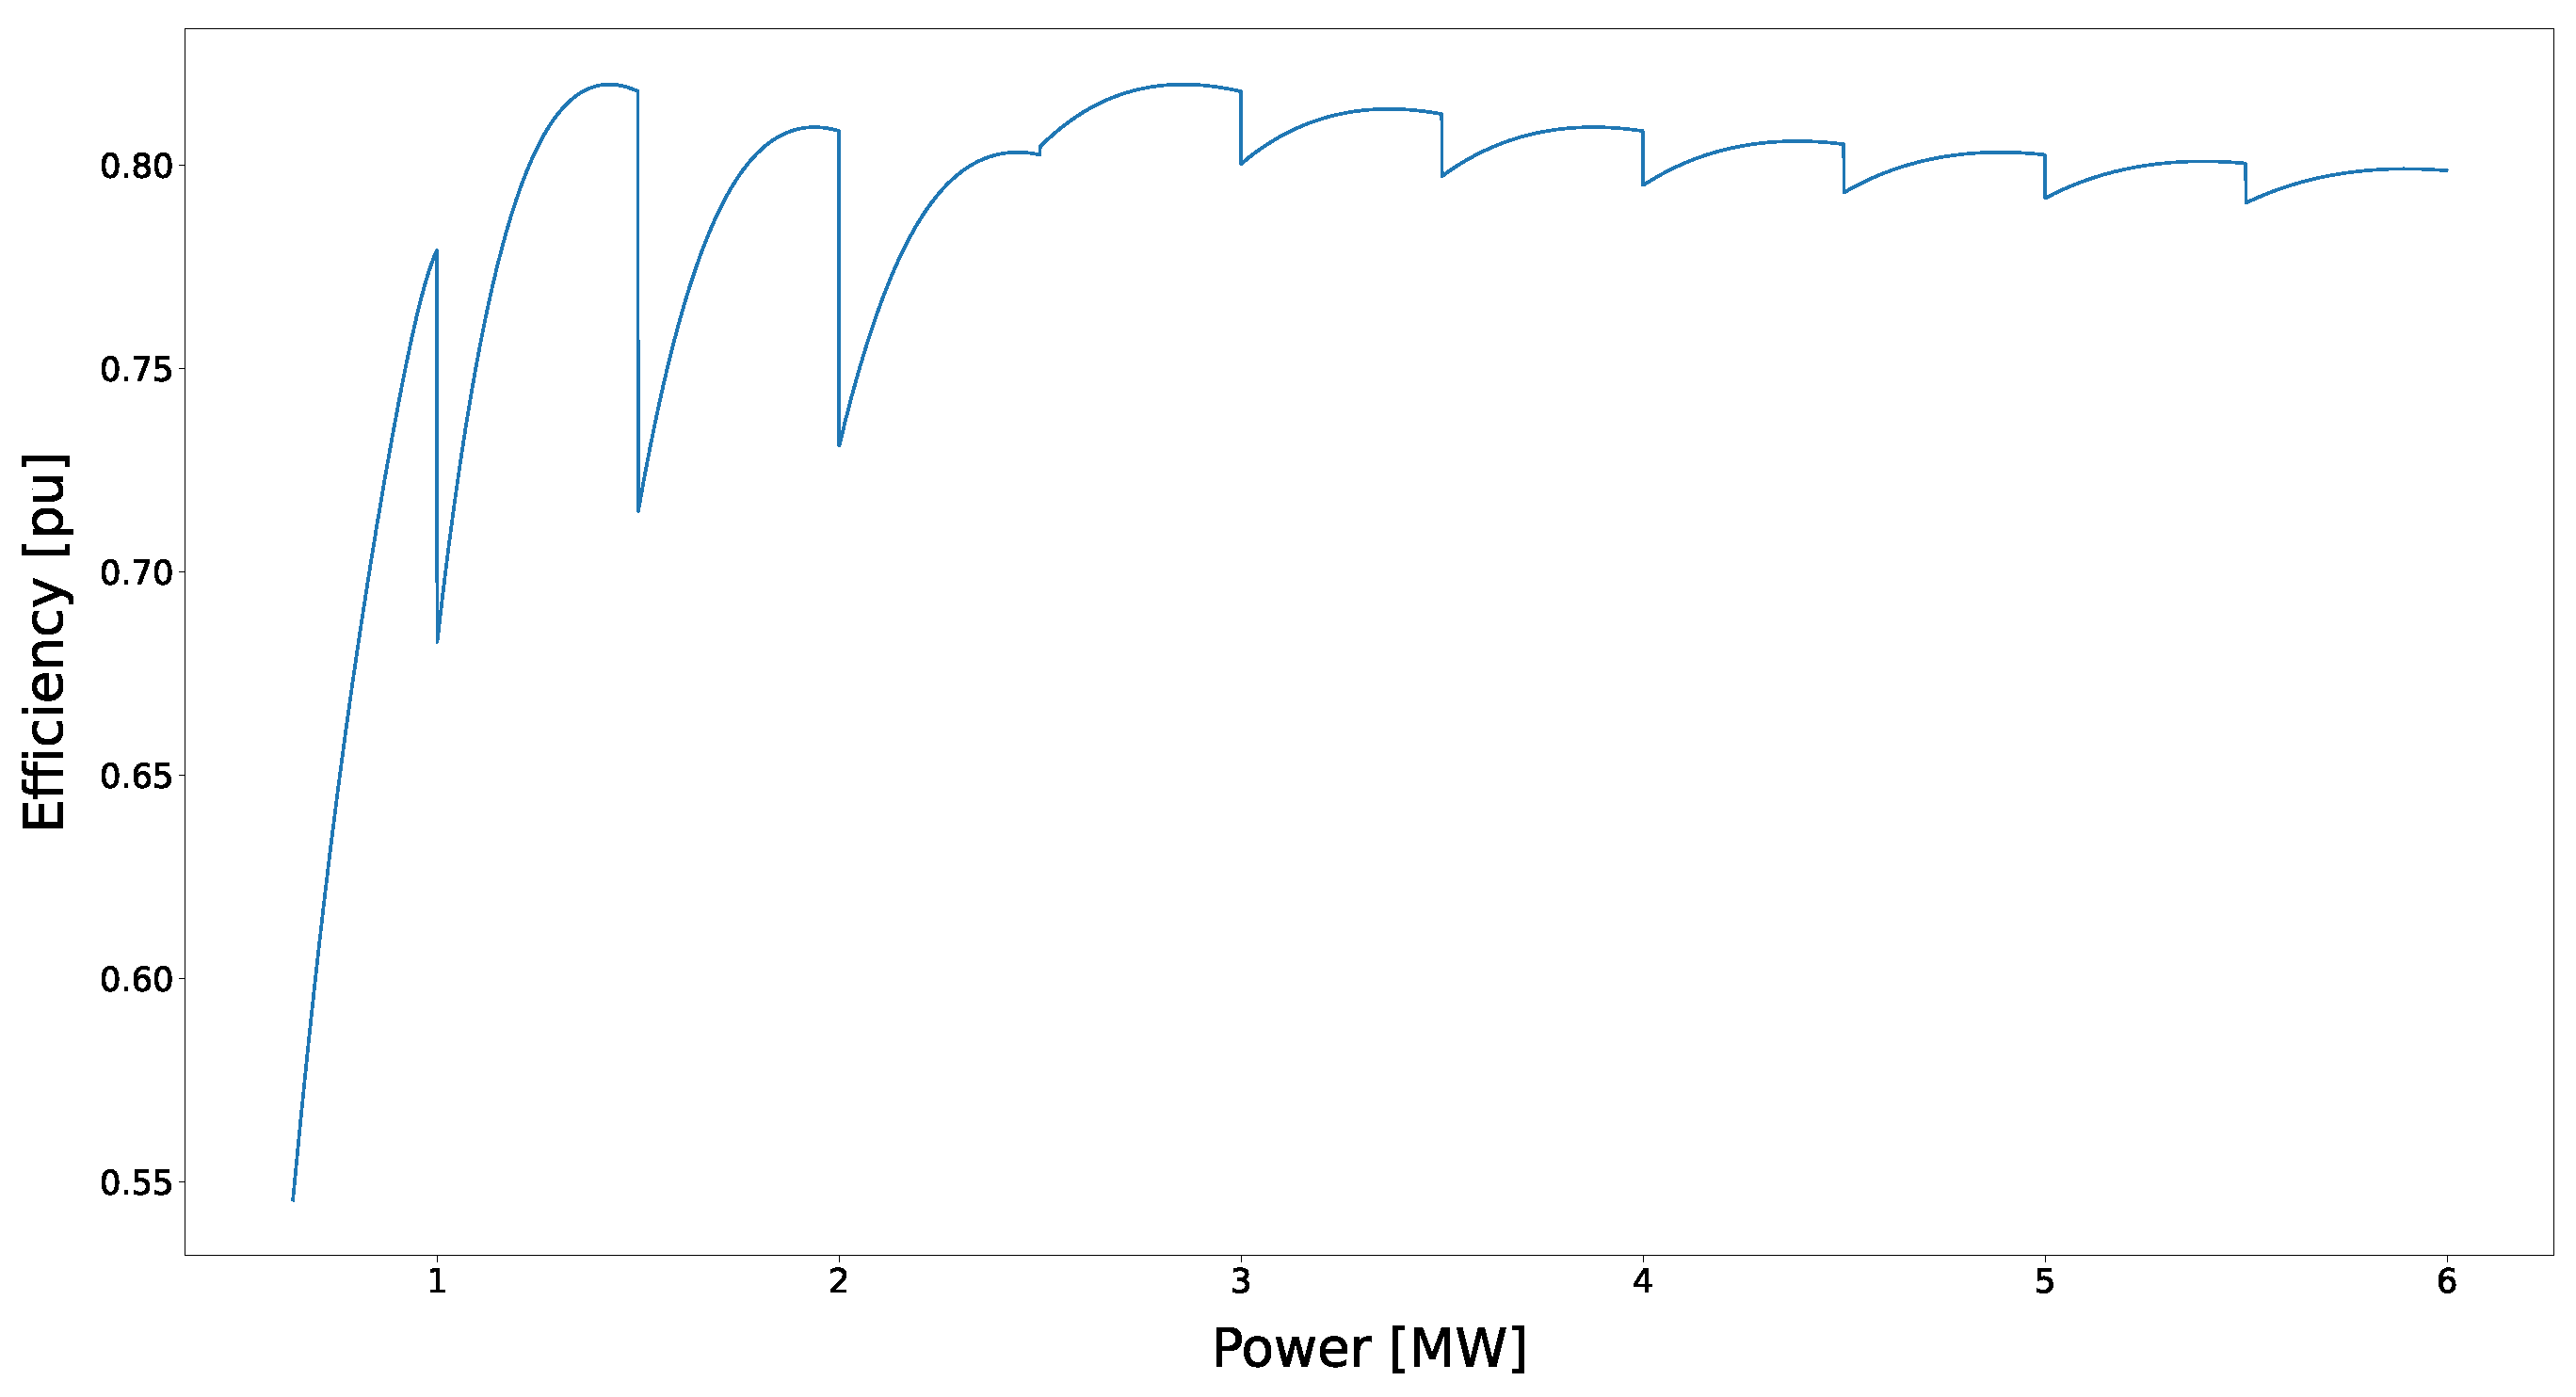
The efficiency of a hydraulic turbine depends on their actual flow and net head. Pelton turbines efficiency is nearly constant for flow variations between 20% and 100%. However, their efficiency falls abruptly if the head departs from its design head. In the case that there are several units in the same power plant, the units are started and stopped in order to optimize their global efficiency.
Figure 3 shows their combined efficiency curve. In this way, no turbine operates below its technical minimum. The turbines’ electrical generation is defined by the power demand not covered by renewal sources [
5].
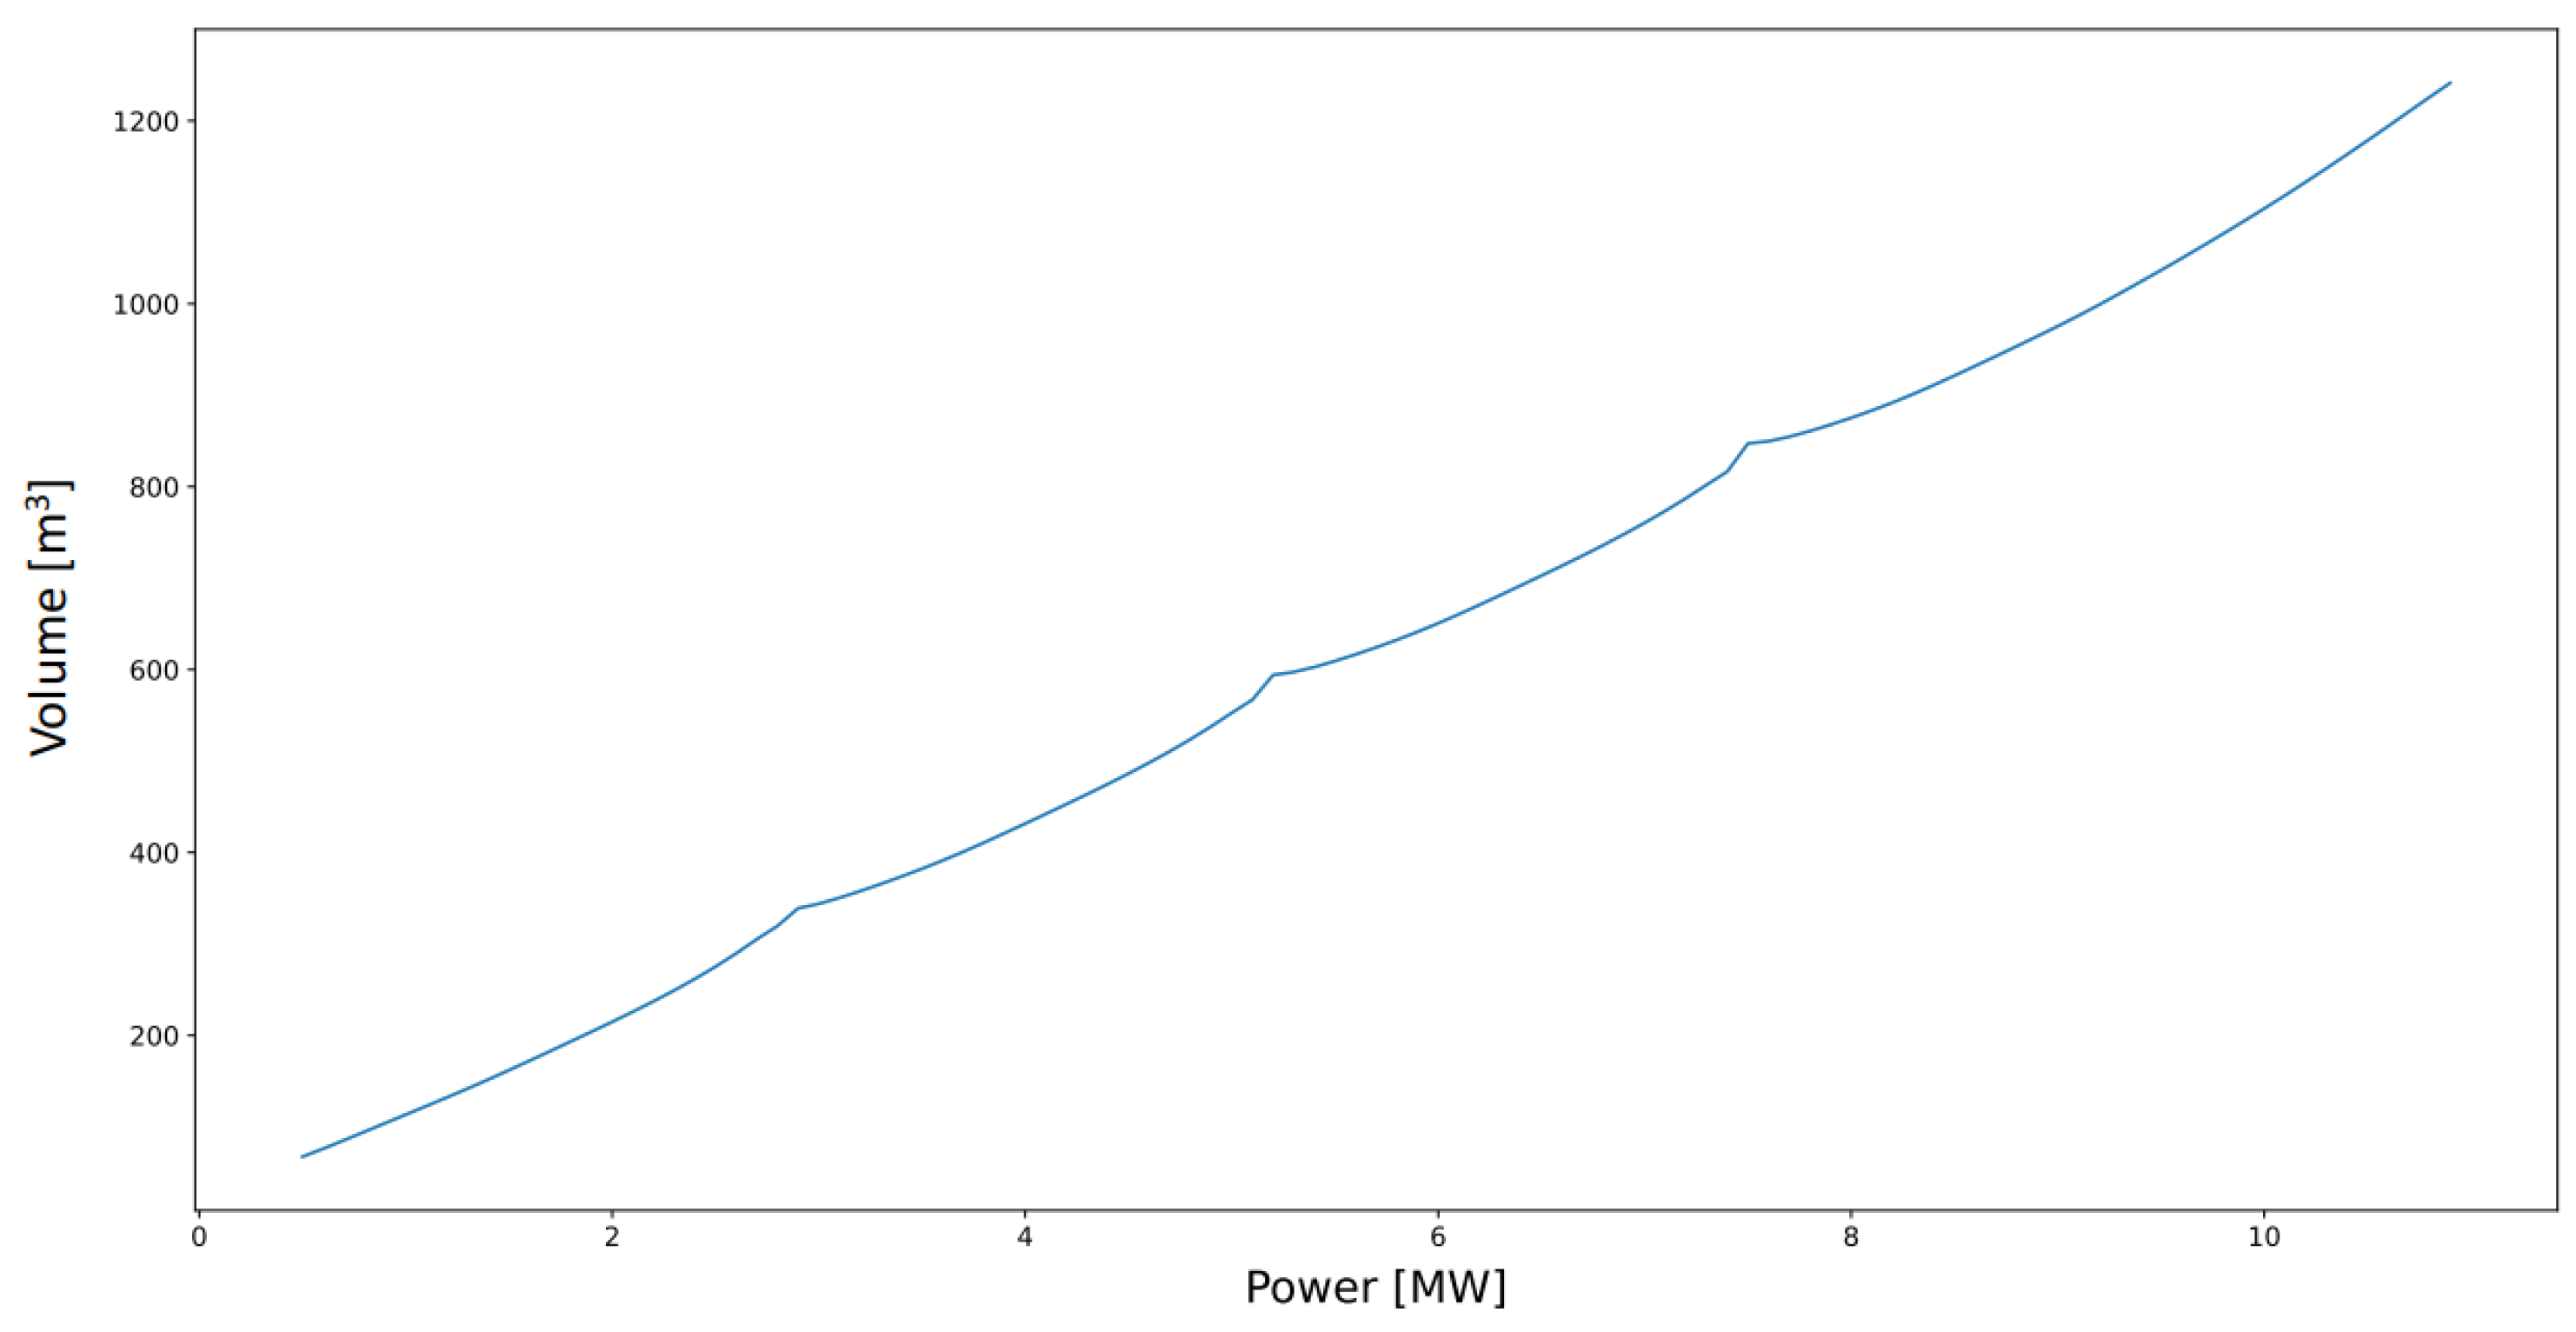
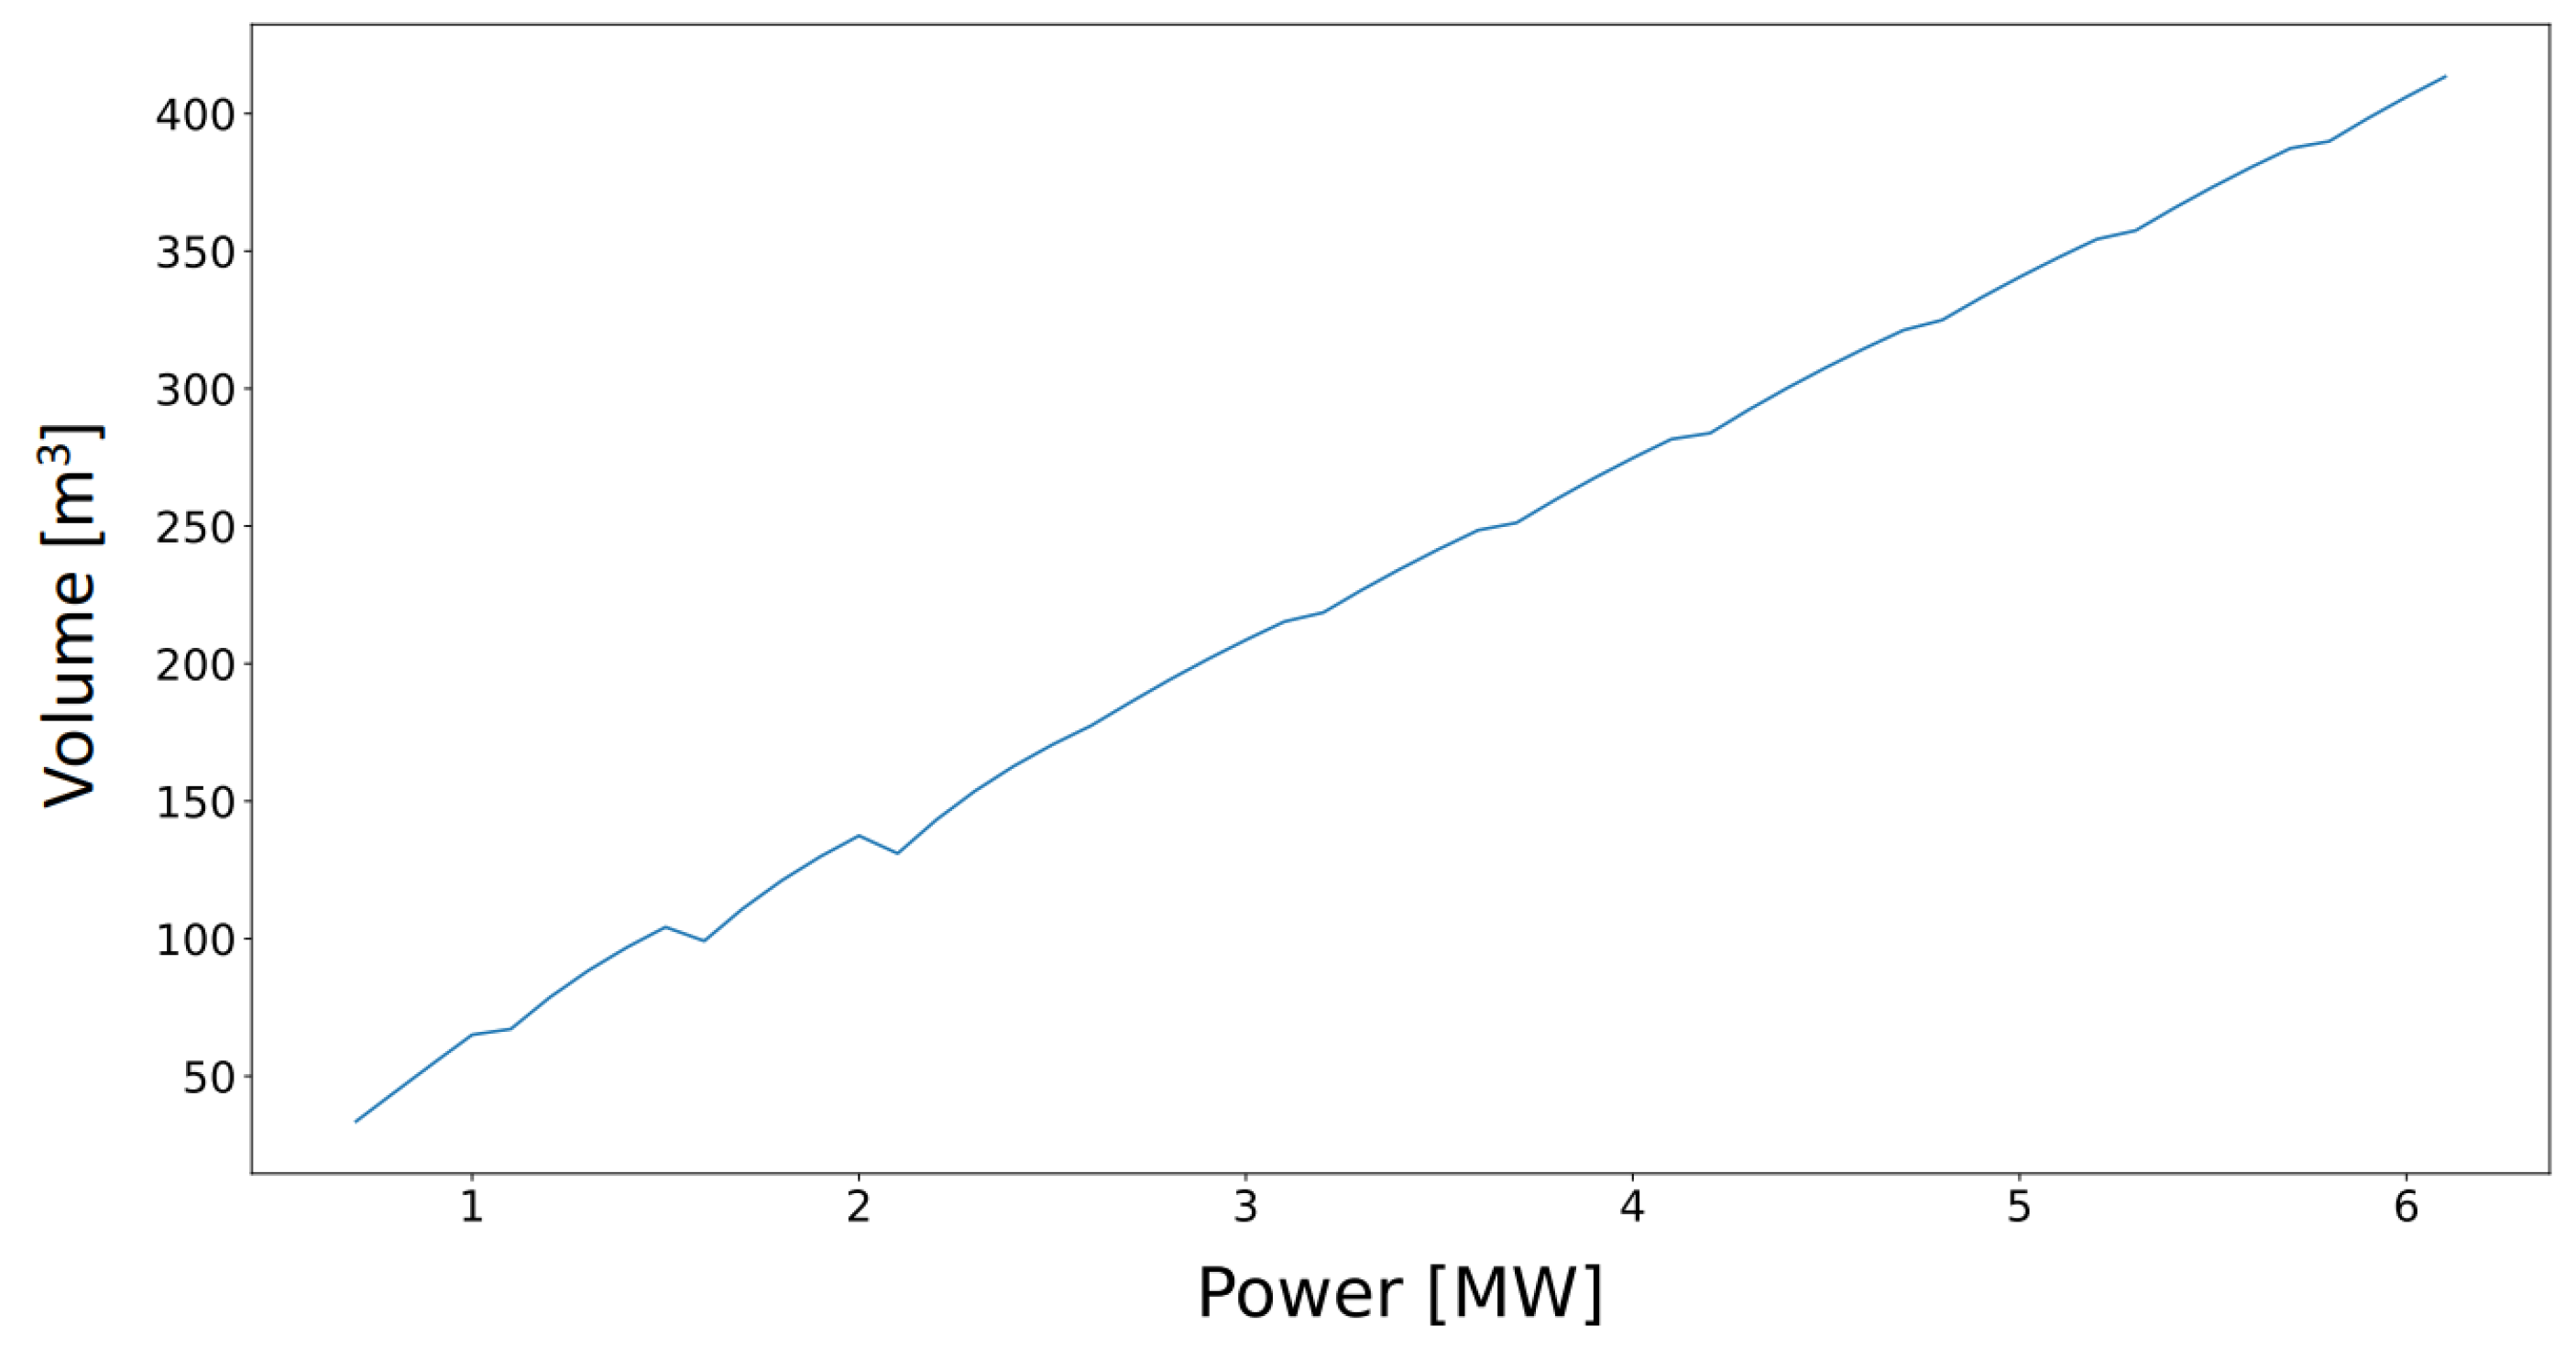
These hydraulic turbines drive synchronous generators. Thus, to obtain the electrical power from the turbines’ power, generator losses have to be subtracted. They are fixed and variable losses. The installed generators have fixed losses of 46.23 kW and variable losses, at rated power, of 39.86 kW. In addition, the generators’ output is fed to a transformer which also has its own fixed and variable losses. Taking everything into account,
Figure 4 shows water volume variation, every ten minutes, when demand is covered by hydropower [
5].
When pumping, the process is similar but in reverse order. Besides moving water to the upper reservoir, pumping can contribute to power frequency regulation. In order to achieve that, power demanded by the pumps can be modified to match the energy generated by the wind farm. This match is possible because, in addition to fixed-speed pumps (that can only be on or off), there are variable-speed pumps. These variable-speed pumps can continuously modify their working point.
Regarding the energy conversion process, there are also three devices:
A transformer (whose model is similar to the hydropower plant transformer).
Six motors for the fixed-speed pumps (0.6 MW each motor) and two motors for the variable-speed pumps (whose rated power is 1.6 MW). The first six motors are modelled, as were the synchronous generators, using their fixed and variable losses. The motors that drive the variable speed pumps are modelled using a constant efficiency of 96.3%.
Six fixed-speed pumps (0.5 MW each) and two variable-speed pumps (1.5 MW rated power). The operating point of the fixed-speed pumps depend on the gross head, so their efficiency (and of the corresponding motors) depend on that operating point. In the same way, the efficiency of the variable speed pumps can be calculated.
As in the case of the turbines, the pumping process includes the sequential start-up of the eight pumps. The strategy is based on starting one of the variable-speed pumps. When the pumping power is large enough, one of the fixed-speed pumps is started (lowering the power demanded by the variable-speed pump). If it is necessary to increase pumping power demand over these two pumps, another fixed speed pump will be started. This process will continue until all the pumps reach their rated power [
23]. The combined efficiency curve is shown in
Figure 5 [
5].
Combining the efficiencies of the transformers, induction motors and pumps, the water volume raised to the upper reservoir for every pumping power is calculated. Therefore,
Figure 6 shows water volume variation, every ten minutes, when wind generated electric power is used to pump water.
3.3. Data
To carry out simulations, input data are also required. The data used are solar irradiation, wind speed and load demand historical data sampled every ten minutes.
Solar data were obtained through the PVGIS and PVSyst software tools using the “SARAH2” database [
17]. From the software and database, the electric power supplied to the grid from sunlight is obtained for each ten-minute period. A 12 kWp installation with 10 kVA converter is assumed.
Wind data were taken from Spain’s AEMET, which has a nearby weather station. These data were correlated with published mean wind values of Gorona wind farm.
Load data were taken from REE [
14] through web-scraping procedures. Also, data on power generated by the island power stations were also gathered in 10-min periods. Therefore, a check of the simulator could be performed.
4. Results and Discussion
The simulation tool assigns power to the renewable sources and the storage whenever possible.
Figure 7 shows a flow diagram of the algorithm.
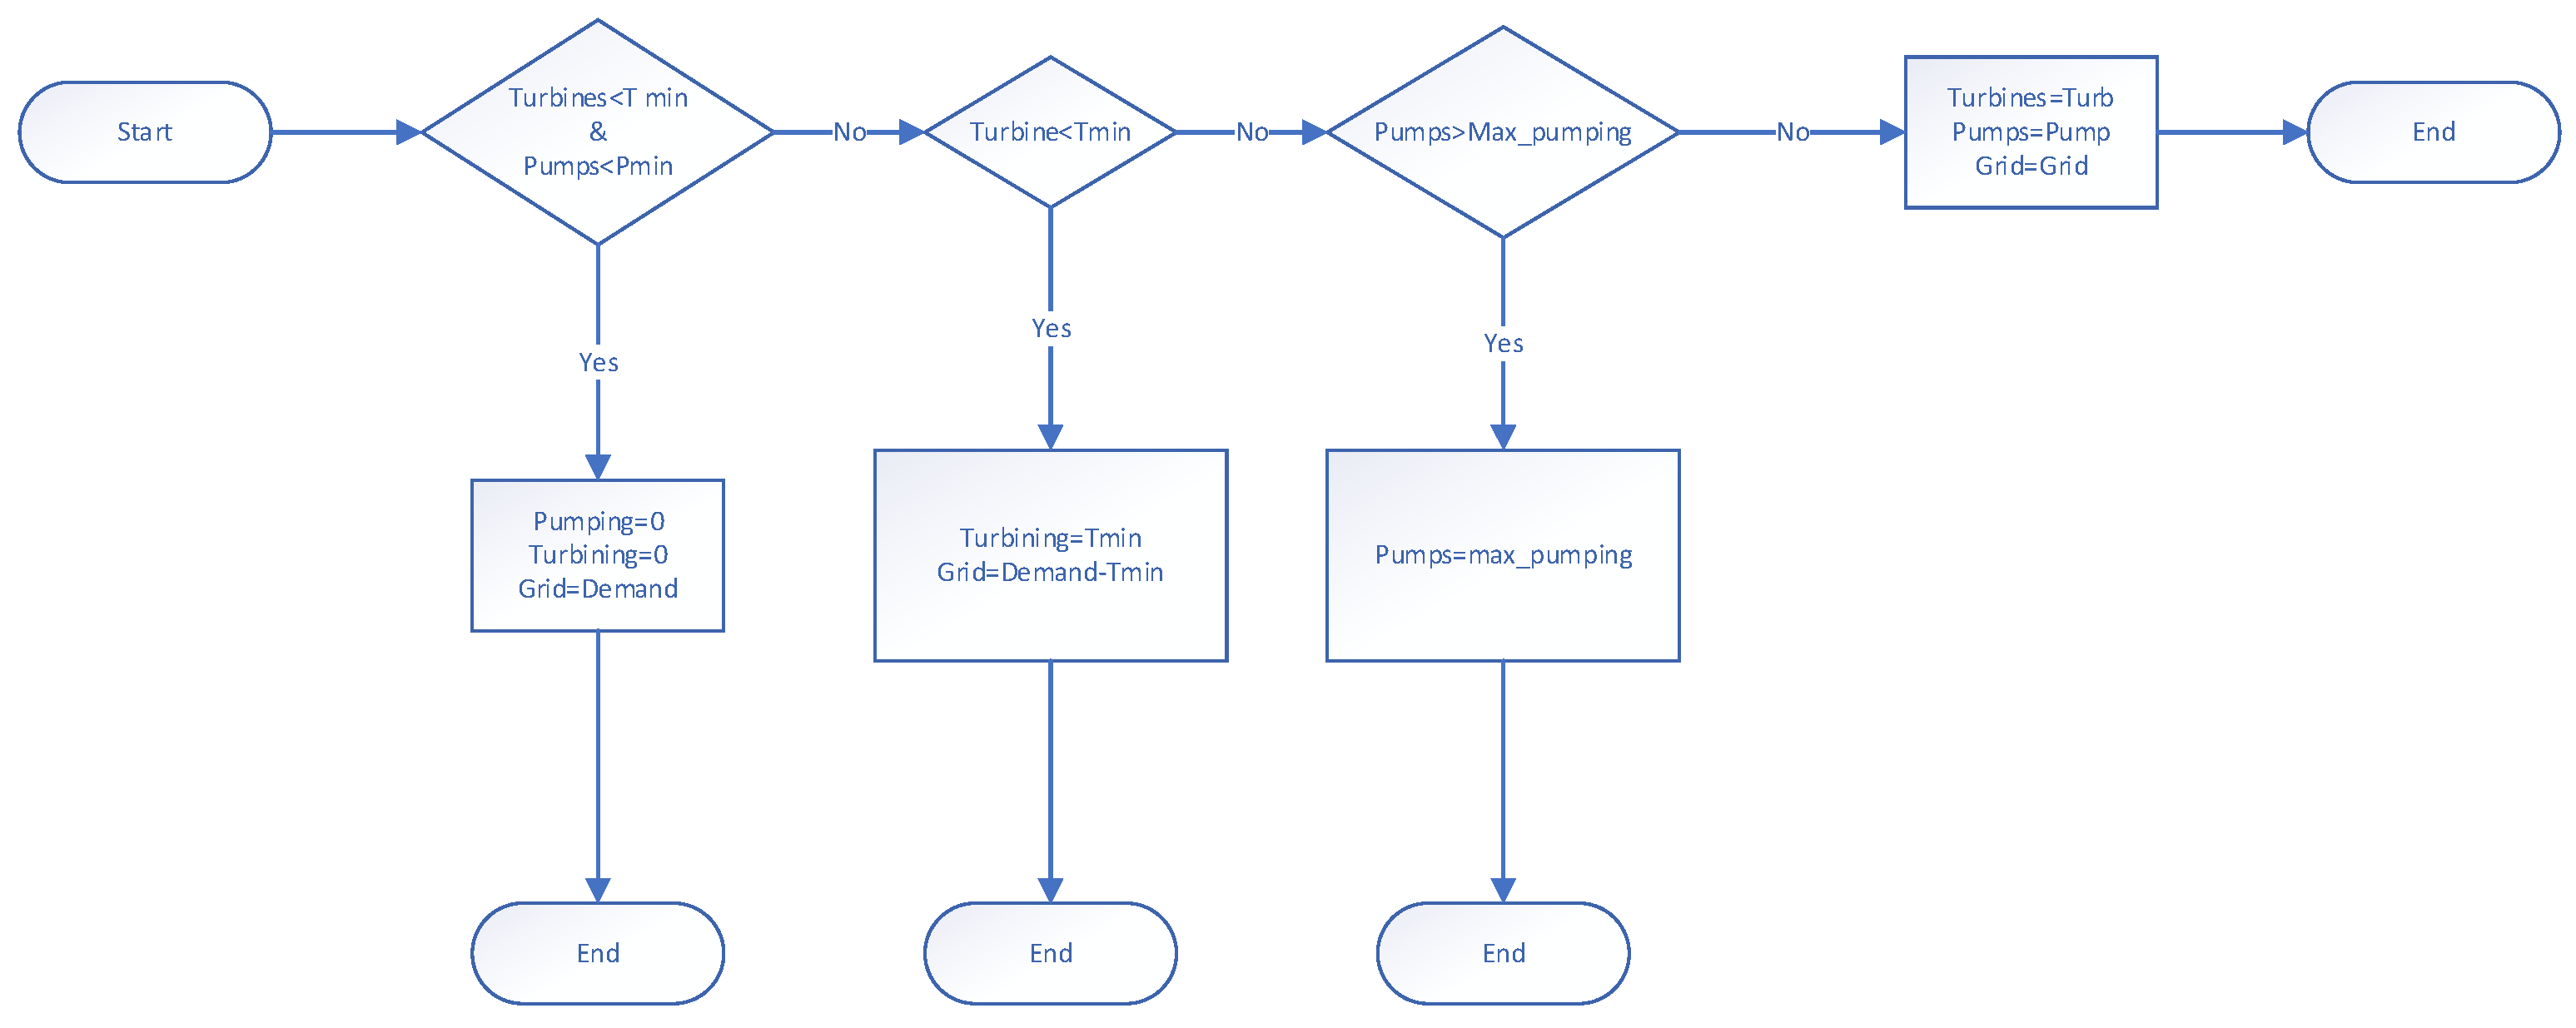
When the energy generated by wind and sunlight are larger than grid demand, power generated from turbines and consumed by pumps should be corrected according to the flowchart depicted in
Figure 8.
If the power assigned to turbines and pumps is lower than their minimum values, it is set to zero. If only the power assigned to the turbines is lower than their minimum value, this power will be increased up to this minimum and the energy provided by wind and sunlight will be reduced accordingly. And, last, if the power assigned to pumping is larger than the pumps’ maximum power, the pumps’ power will be their maximum power. After these corrections, the energy surplus is determined.
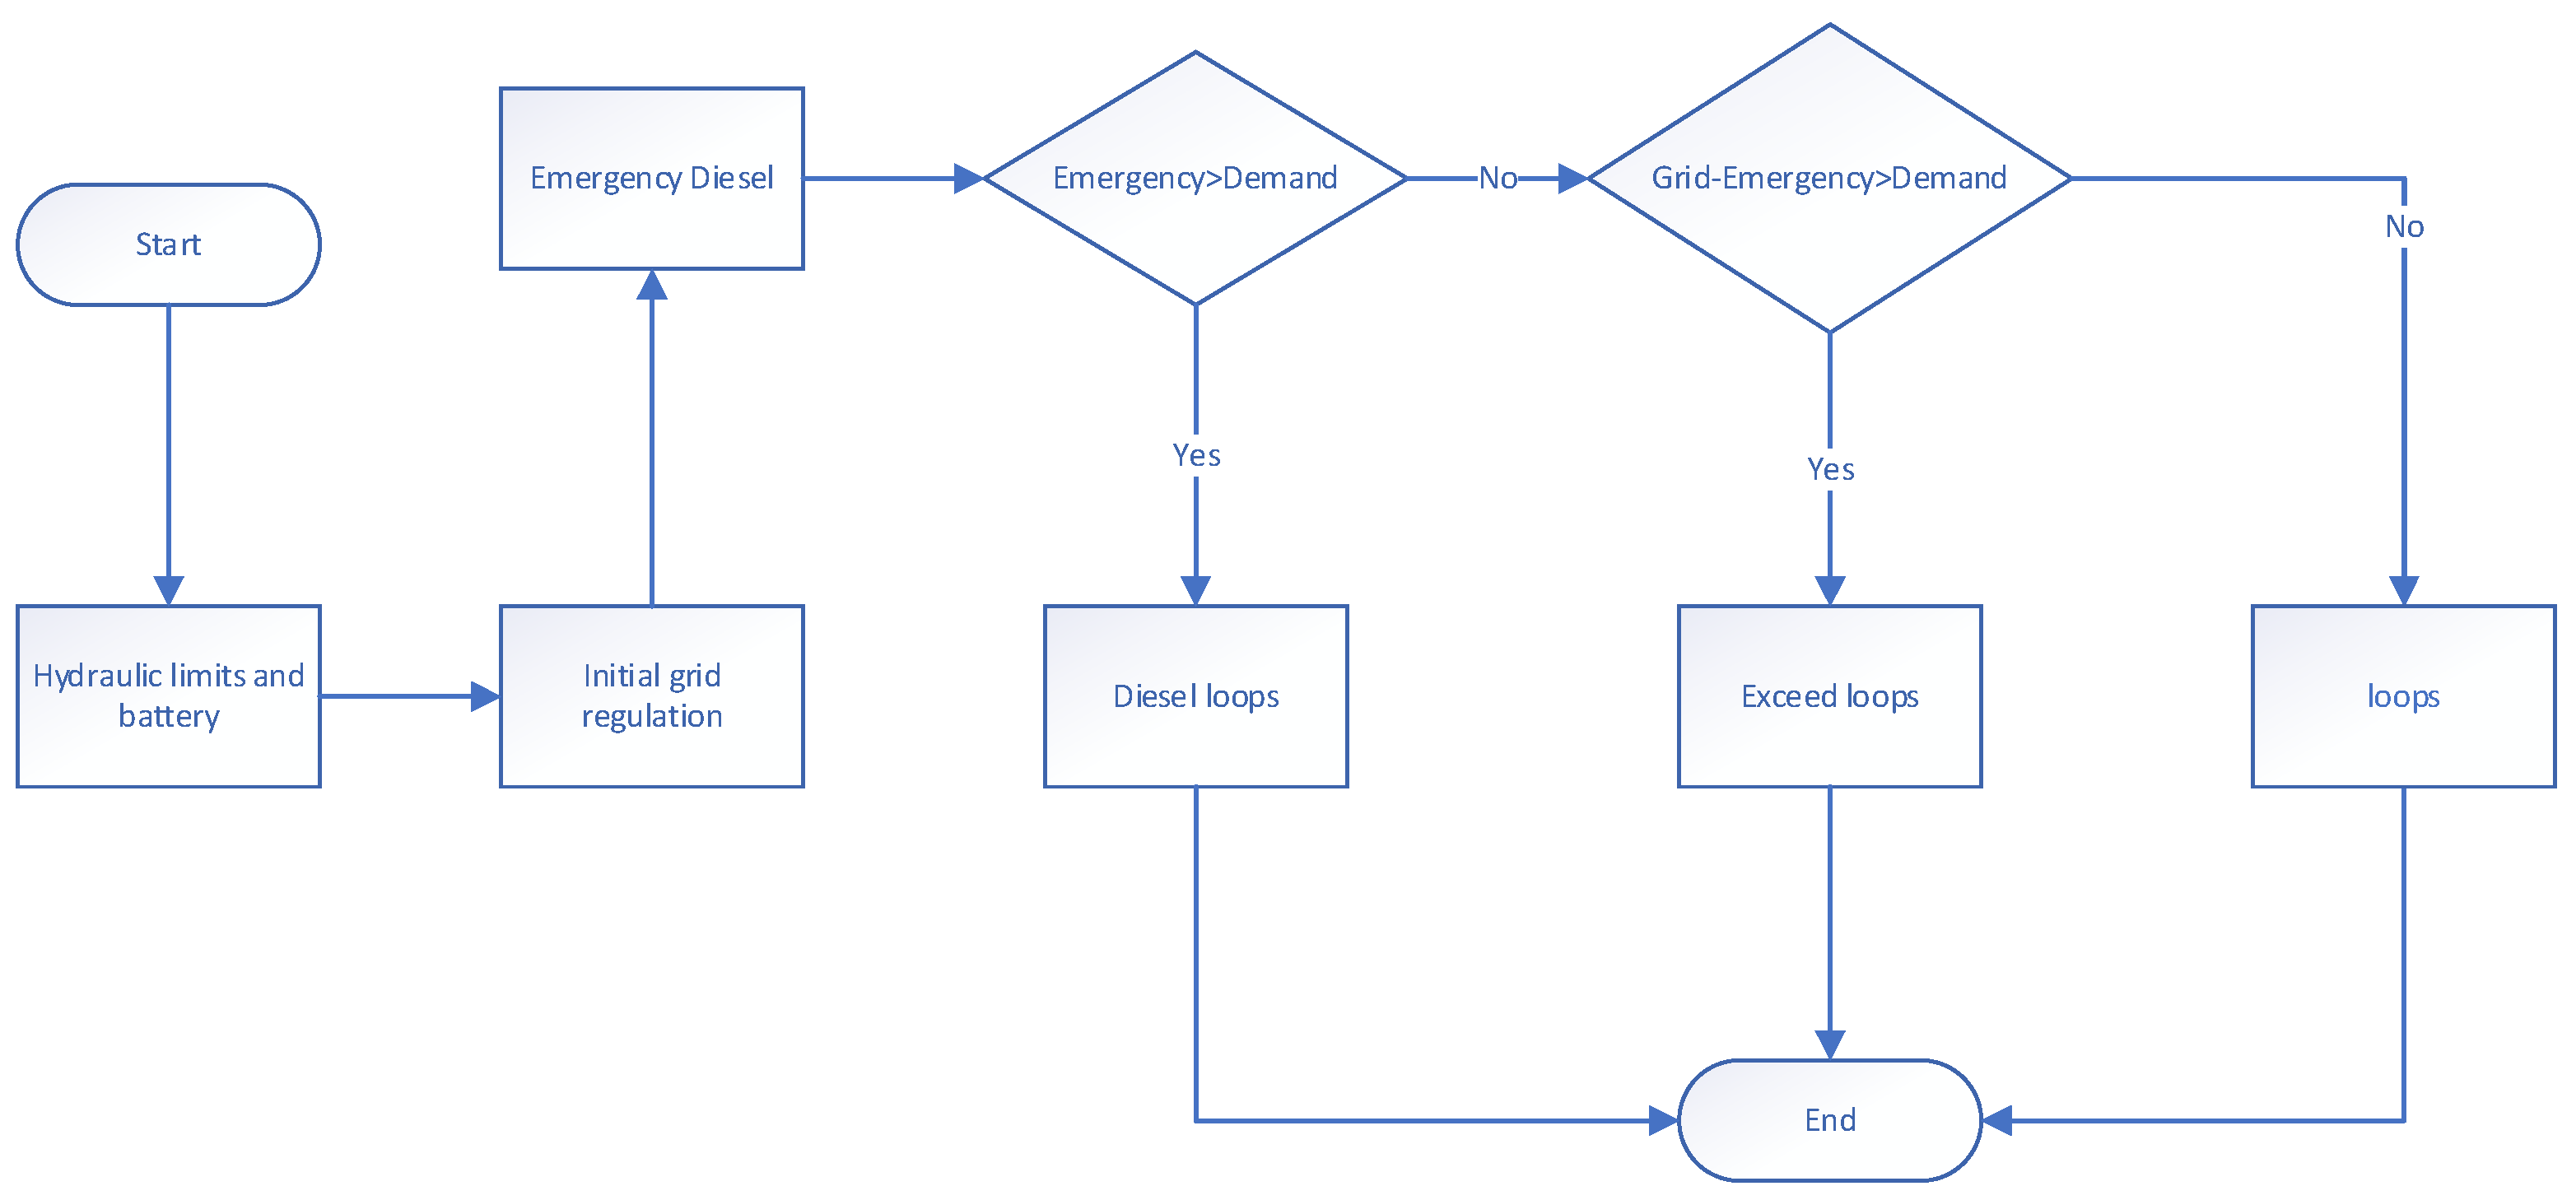
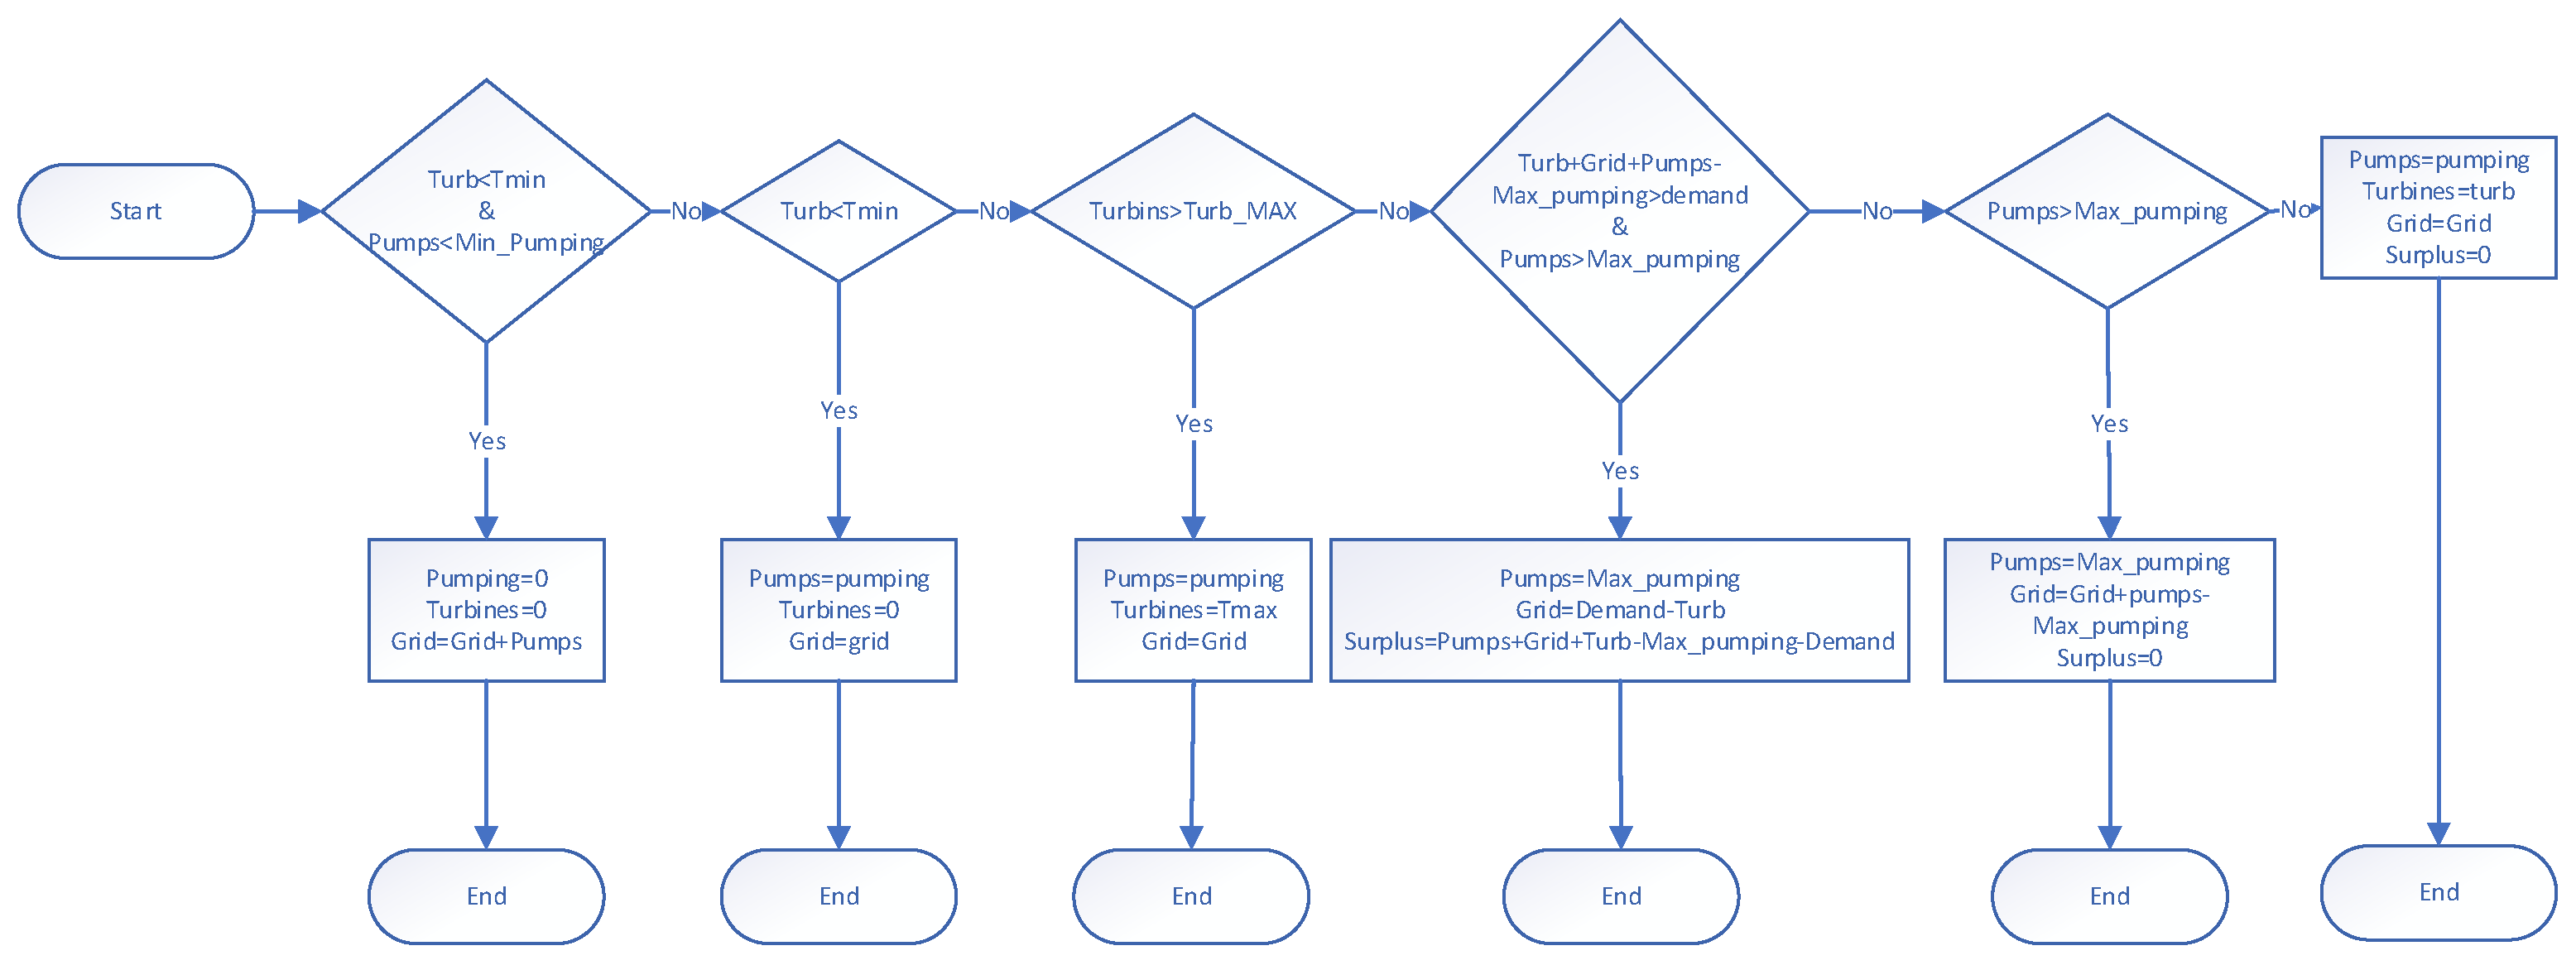
When the energy generated by wind and sunlight are lower than grid demand, power generated from turbines and consumed by pumps should be corrected according to the flowchart depicted in
Figure 9.
As in the previous case, if the power assigned to turbines and pumps is lower than their minimum values, they are set to zero. In this situation, the grid will receive what was initially assigned plus the energy not used to pump water. If only the power assigned to the turbines is lower than their minimum value, it will also be set to zero. If it is larger than their maximum value, the turbines’ power will be limited to their maximum value.
Regarding pumping limits, if the pumps’ assigned power is larger than their maximum power, an additional check is needed. Because the power assigned to pumping plus the wind and solar energy assigned to cover demand minus maximum pumping power should be lower (or equal) than load demand. If it is larger, a surplus appears. Otherwise, there will be no surplus.
After programming the tool, its performance was verified by carrying out a simulation with the current data of El Hierro island’s power system. As it is considered unsafe that wind turbines were the only generating power plant, if wind resources can supply more than 50% of load demand, the surplus power is used to pump water. Therefore, pumps and turbines of the pumped storage power plant are used simultaneously some of the time. In summary, it is assumed that around 30% of the energy provided by Gorona power plant is of hydraulic origin. Thus, 50% of wind resources are used to pump water.
Table 6 shows the results of this simulation.
The results shown in
Table 6 do not correspond with operational history. The biggest difference is caused by the theoretical efficiency of pumping storage (around 62%). As a consequence, demand covered by renewables is around 65%. However, the actual efficiency of pumping storage is around 43% and demand covered by renewables is around 56%, at best. The results obtained after modifying hydraulic efficiencies are shown in
Table 7. These results show a good agreement with the actual operation of Gorona power plant.
Once simulator agreement with actual operation has been obtained, new scenarios can be simulated. The first scenario is a proposal, made in 2020 [
12], of installing 1 MW of solar photovoltaic and a battery of 1.4 MWh capacity and 1.5 MW power.
Table 8 shows the results of the simulation assuming the same operational strategy of the pumped storage hydropower plant. As can be seen in
Table 8, this added renewable capacity increase is a 3% renewable demand coverage.
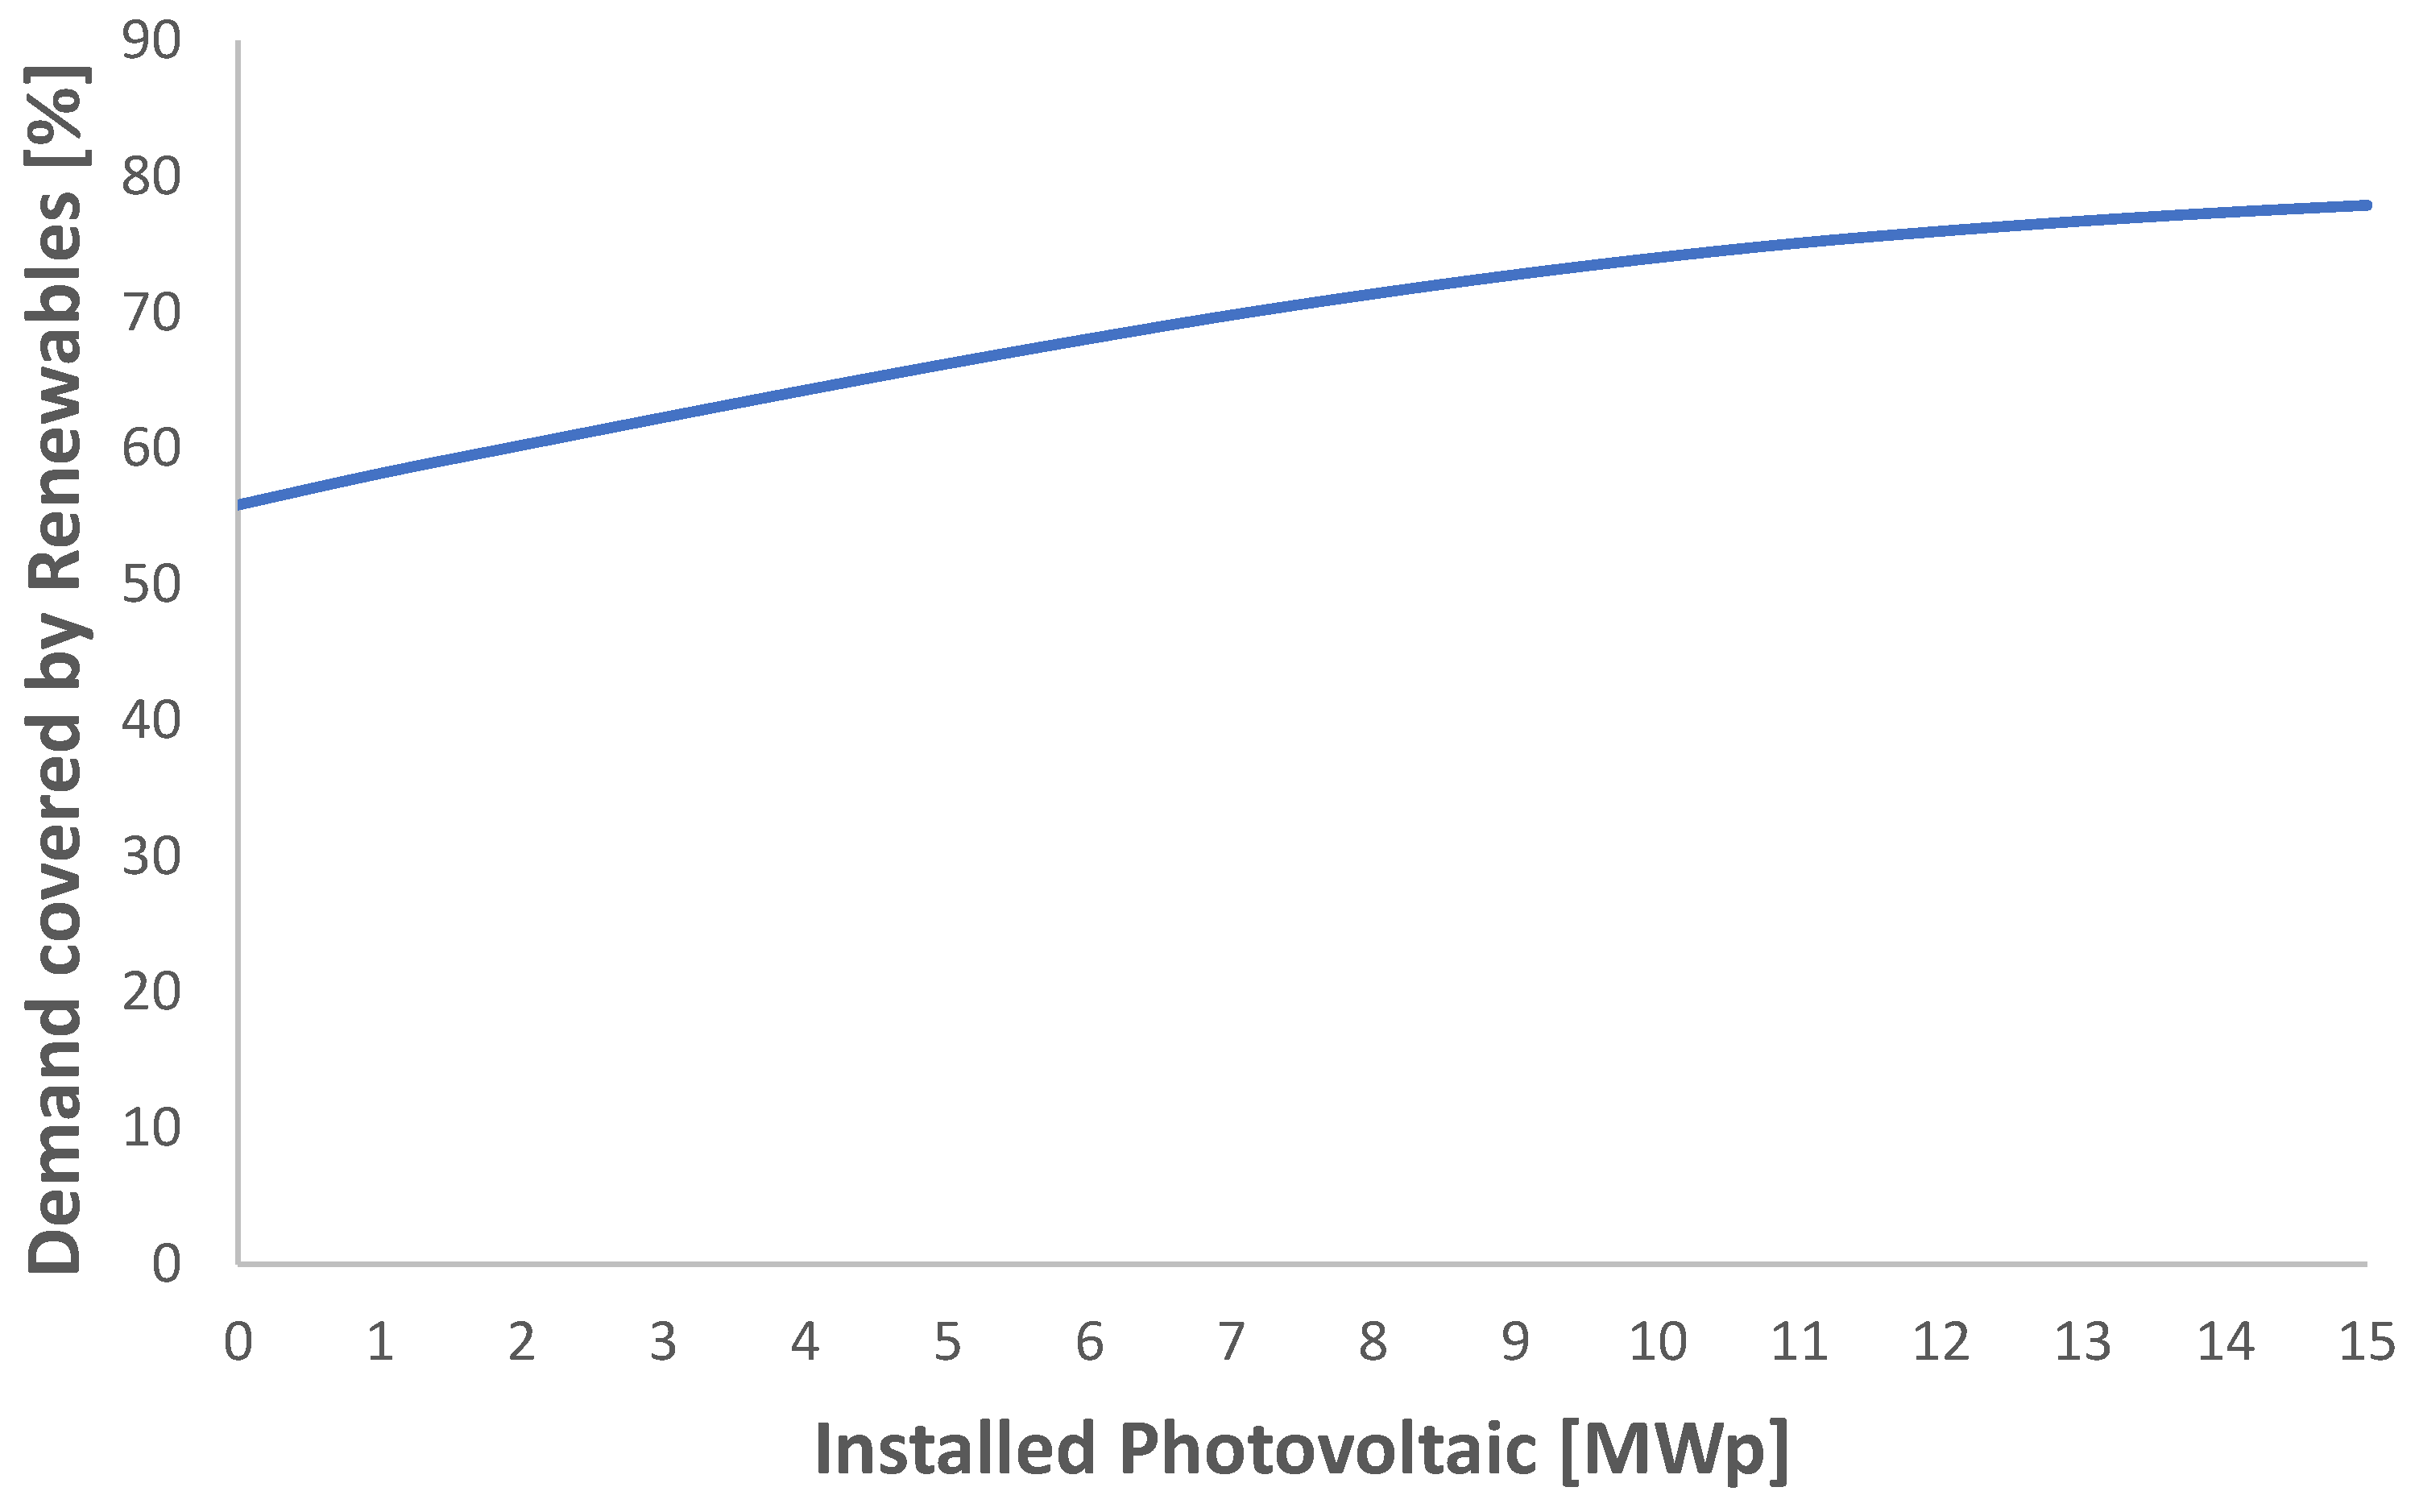
Several scenarios of photovoltaic power were simulated by using the remaining power plants.
Figure 10 shows the results. As can be seen from the figure, to obtain a renewable demand coverage of 80%, more than 14 MW of solar photovoltaic should be installed.
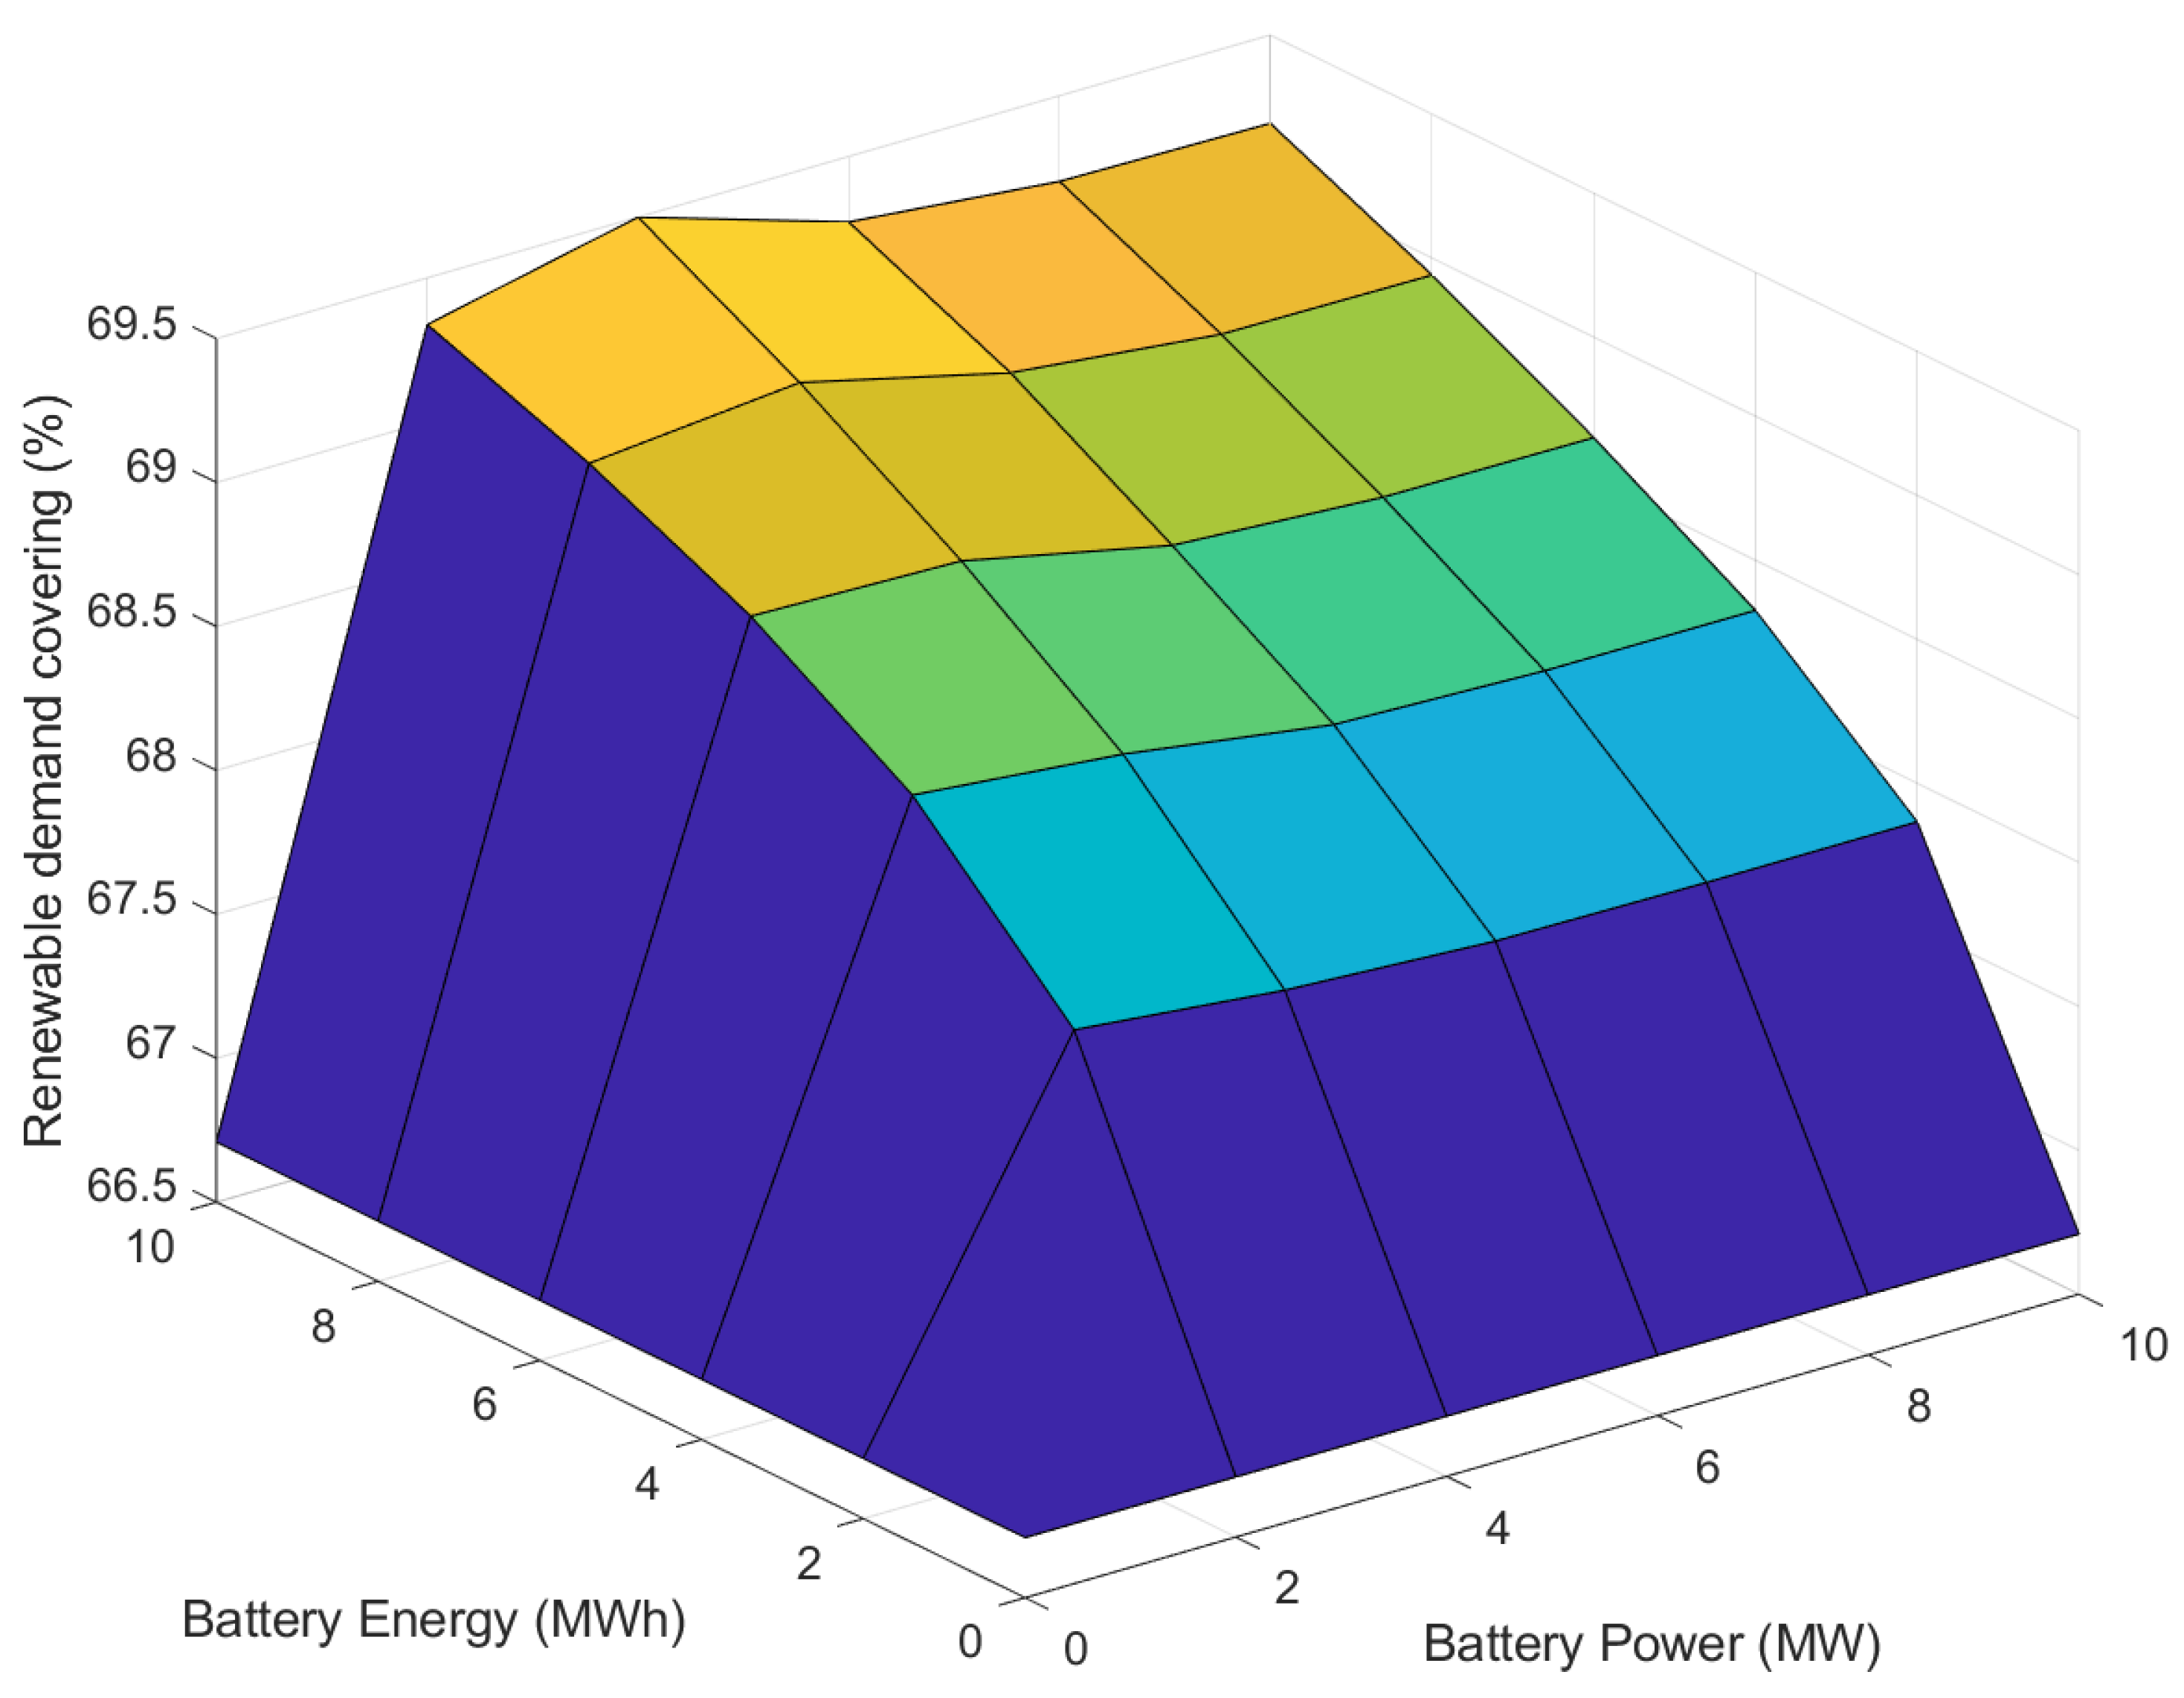
Also, several scenarios of batteries’ power and energy have been considered (0–10 MW and 0–10 MWh) for 5 MW solar photovoltaic installed power.
Figure 11 shows the results. As can be seen from the figure, the batteries’ effect is nearly power independent and strongly dependent on their energy capacity. In any case, its effect on demand covered by renewables is very low (a 2% increase between 0 and 10 MWh battery capacity).
As batteries’ contribution is very small, it would be better to use them for frequency regulation [
24], reducing the requirement that at least 50% of generation comes from synchronous machines (hydraulic turbines or diesel). Another option would be to install a flywheel [
25]. Both options require the availability of grid-forming converters [
26,
27].
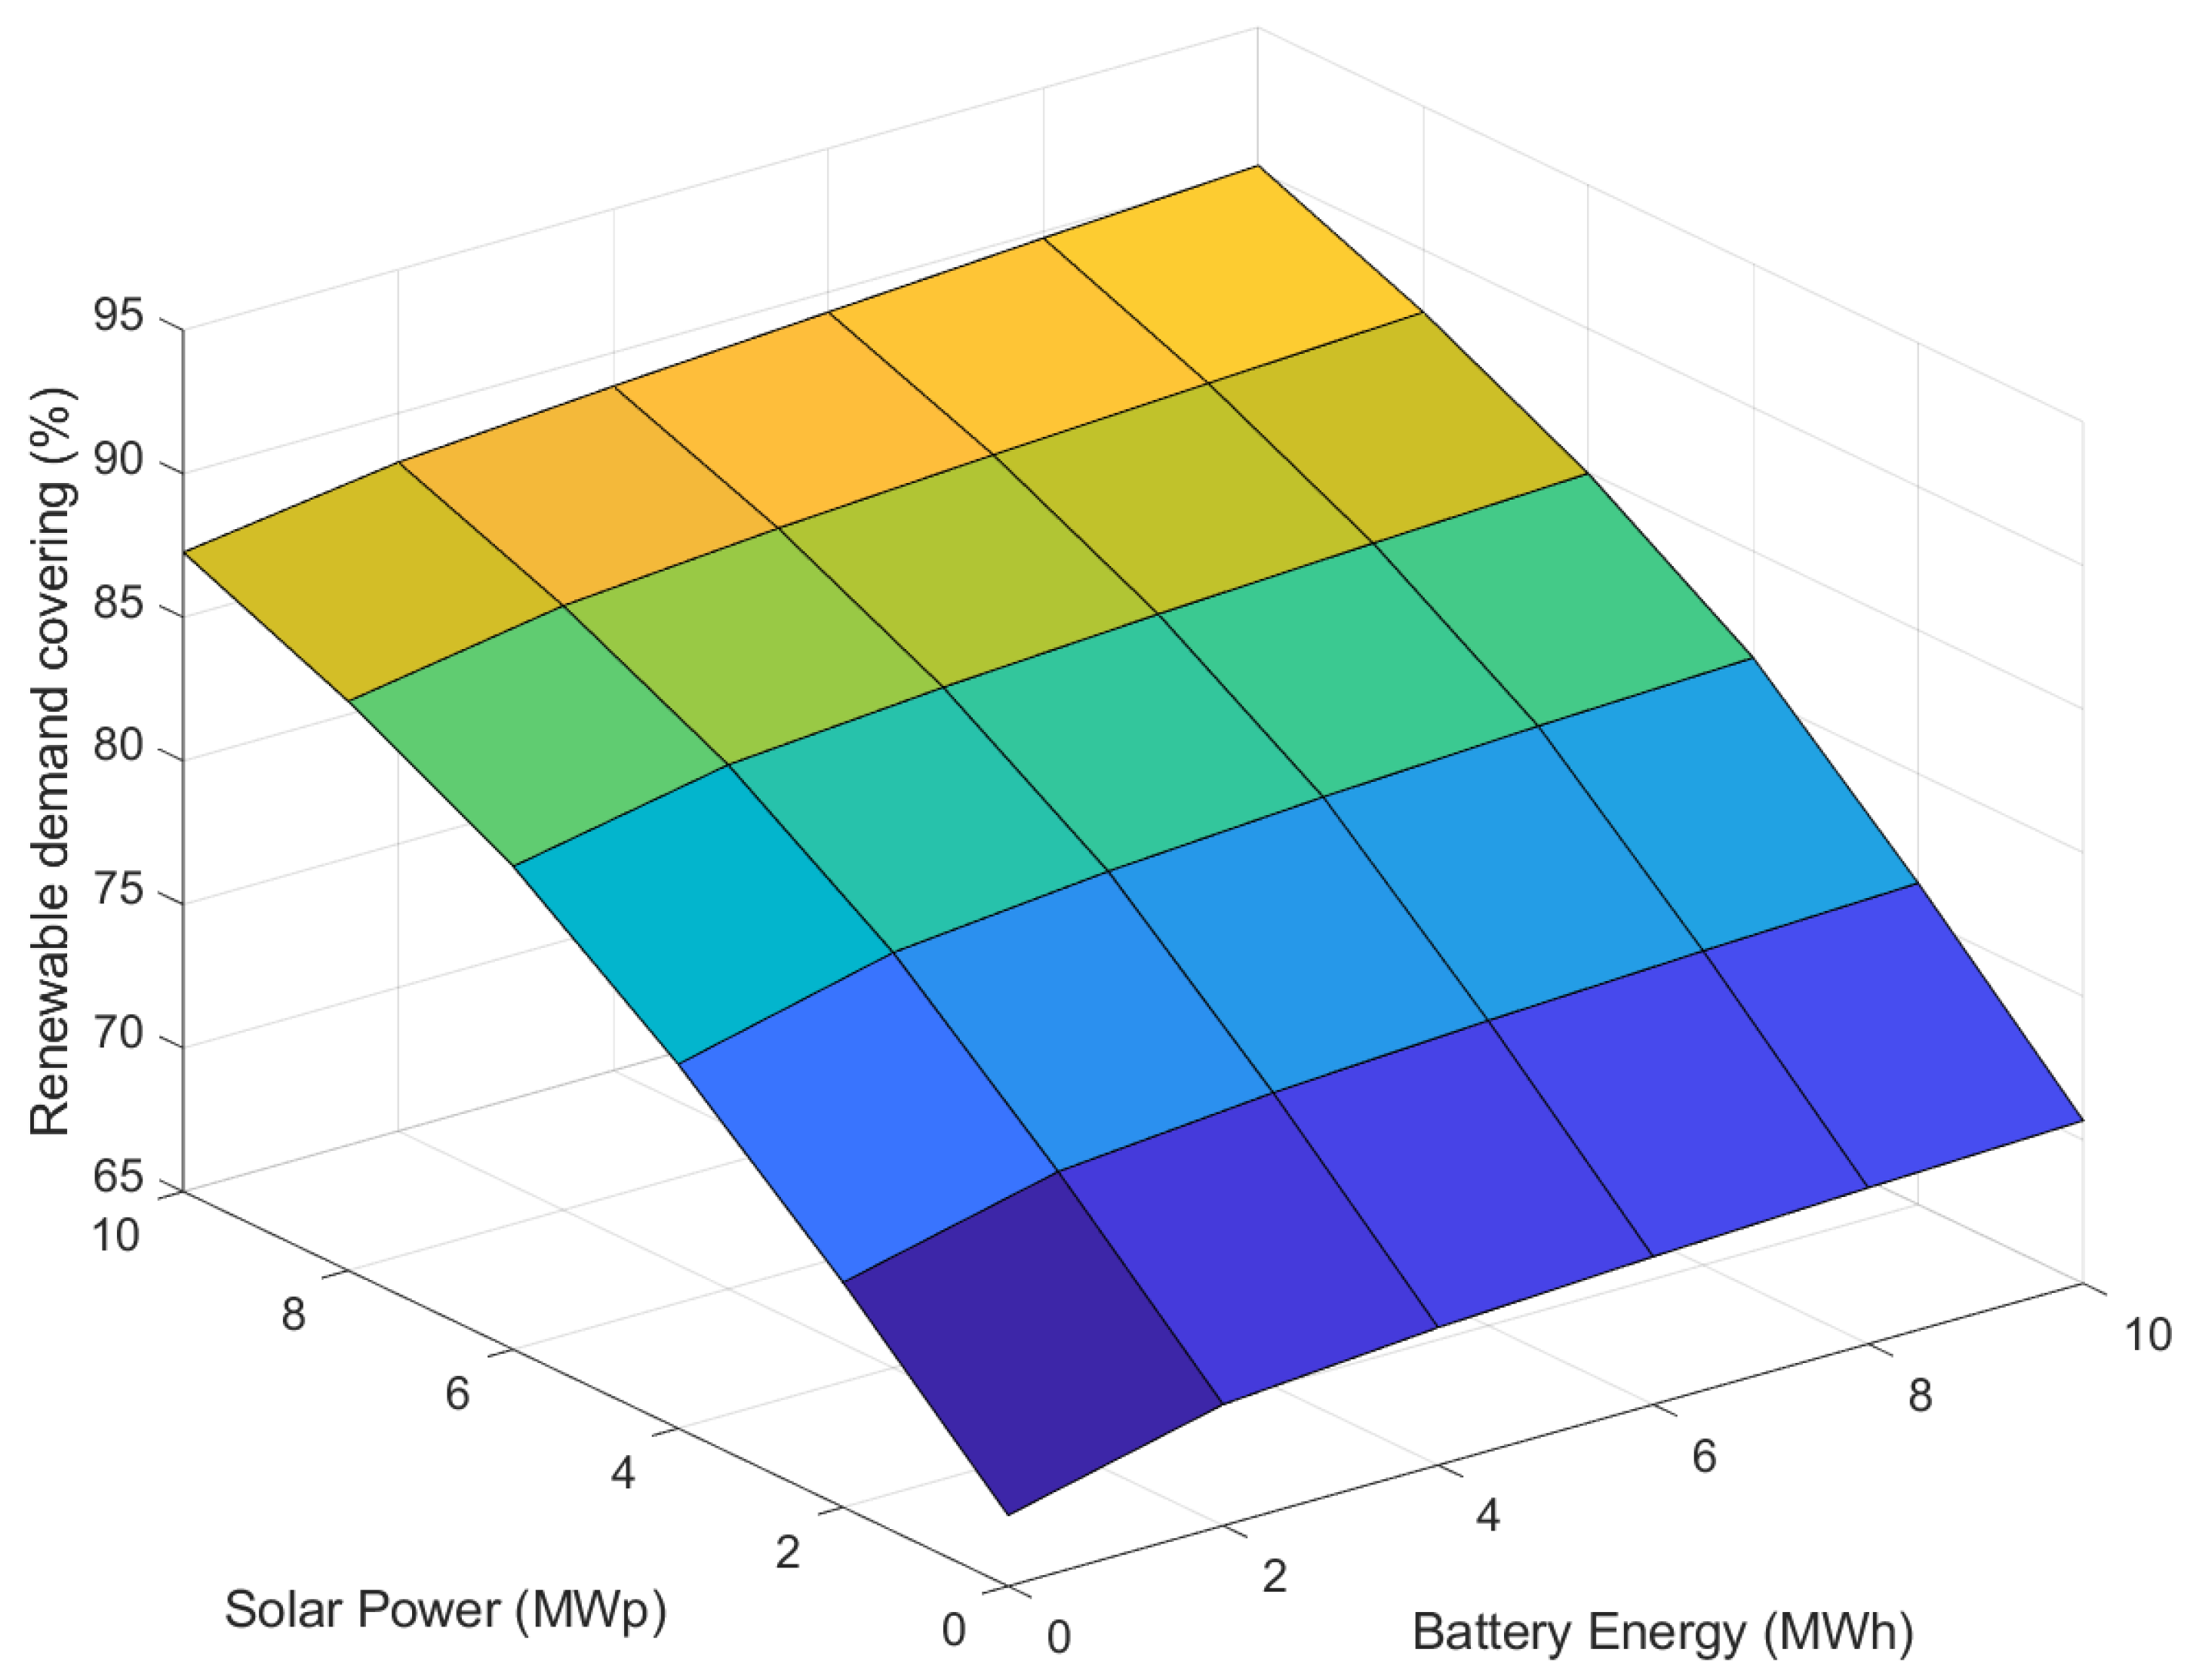
Figure 12 shows the effect of increasing battery energy and solar photovoltaic power without using simultaneous pumping and turbining. As can be seen from the figure, 90% of load demand could be covered by renewables using this approach.
Table 9 provides detailed results for the case of 10 MW solar photovoltaic and a battery of 4 MW power and 4 MWh energy. Remaining power plants are not changed but there is no required percentage of synchronous generation.
5. Conclusions
Data analysis has confirmed that the historically followed operational strategy in El Hierro aims to maintain constant water storage and avoids wind generation to grid larger than 50% of load demand. To this end, when needed, hydraulic turbines and pumps operate simultaneously. Simulations have confirmed that this operational strategy is the main limiter of renewable demand coverage. Therefore, alternative operational strategies are needed. Nowadays, the most promising alternative is using batteries combined with advanced grid-forming inverters to provide frequency regulation. For this reason, battery sizing should be performed for frequency regulation instead of for adding energy storage capacity.
In addition, more renewable generation is needed to reach the aim of 100% renewable energy demand coverage. The total renewable power installed should be around 200% of maximum demand, while energy storage should be in the order of maximum power demand. In particular, the following should be achieved:
Install at least 10 MW of solar photovoltaic.
Install batteries with grid-forming inverters.
Minimize the simultaneous use of turbines and pumps.
Use another inertial provider such as synchronous condensers, or flywheels.
If possible, increase wind farm power.
In particular, for the El Hierro island, it has been verified that with the additional installation of 10 MWp photovoltaic solar power and a battery capacity of 4 MW with 1 h of storage, up to 95% renewable coverage can be achieved, as long as the regulation strategy is modified.


