Article

Isotopic Signatures of Nitrogen in Selected Soils from Croatia

1
Department of General Agronomy, Faculty of Agriculture, University of Zagreb, Svetosimunska Cesta 25, 10000 Zagreb, Croatia
2
Graduate Study in Organic Agriculture and Agrotourism, Department of General Agronomy, Faculty of Agriculture, University of Zagreb, Svetosimunska Cesta 25, 10000 Zagreb, Croatia
*
Author to whom correspondence should be addressed.
Sustainability 2023, 15(23), 16174; https://doi.org/10.3390/su152316174
Submission received: 15 September 2023 / Revised: 3 November 2023 / Accepted: 4 November 2023 / Published: 21 November 2023

Abstract

:
The mobility of nitrogen (N) in the environment is conditioned by its cycling between atmospheric, terrestrial, and marine ecosystems. It is a key element for global biogeochemistry, and although isotope analysis has been an integral part of many studies over the past eighty years, the complexity of the nitrogen cycle hinders a correct and detailed understanding of the mechanisms behind its processes. It could be argued that the interpretation of the isotopic signatures of nitrogen in soils is still in its infancy. In Croatia, such research has recently begun and is driven by a need for the comprehensive study of nitrogen isotopes in terrestrial ecosystems. The aim of this study was to compare the abundance of the 15N isotope in soils from continental and coastal parts of Croatia with different types of land use (arable land/crop production, meadows, forests, orchards, ski slopes, urban soil/city roads) and to authenticate the nitrogen origin in soils in relation to different soil management practices. This research was based on 27 soil samples collected at 11 locations in Croatia. The samples differed according to soil type, land use, applied mineral and organic nitrogen fertilization, and climatic condition at each specific location. The determination of δ15NT (T—total nitrogen) values in bulk samples was performed in duplicate with the IRMS (Isotope Ratio Mass Spectrometry) method using an IsoPrime100-Vario PYRO Cube (OH/CHN Pyrolyser/Elemental Analyzer). The results reveal that the mean δ15N abundance in soils according to different land use declines in the following order: crop production (+5.66 ± 1.06‰) > apple orchard (+5.60 ± 0.10‰) > city road (+4.33 ± 0.38‰) > meadow (+3.71 ± 0.85‰) > ski slope (+2.20 ± 0.10‰) > forest (+2.15 ± 1.86‰). The individual values were in the range from 0.00 ± 0.10‰ in the forest soil in continental Croatia to +7.19 ± 0.07‰ in the vegetable garden (crop production) soil in coastal Croatia. Among the investigated soil properties and weather conditions, PCA analysis identified close correlations between P2O5 content and δ115N abundance in arable soils, as well as between soil reaction (pH) and mean annual temperatures, while high C/N ratio values explained the isotopic distribution in non-arable soils (city roads and forests). Despite the long-term application of mineral nitrogen fertilizers, the results represent nitrogen of organic origin in the arable soils (crop production), which partly confirms the sustainable management of those agroecosystems.

1. Introduction

The use of stable isotopes to understand the biochemical cycle of carbon (C), nitrogen (N), sulfur (S), oxygen (O), and hydrogen (H) in the environment [1,2,3,4,5,6], along with their applications in food origin and quality assessment [7], forensics [8], drug metabolism [9], athlete doping testing [10], and archaeology and anthropology [11], has been developed over eight decades. Their use started with the development of mass spectrometry after World War II [12] with the design of the mass spectrometer (gas inlet, ion source, tube, magnet, ion collectors, mercury diffusion pump) and isotope analysis routines by Alfred Nier in 1947 [13]. Today’s mass spectrometers are designed for isotope ratio measurements (IRMS method—Isotope Ratio Mass Spectrometry) and use dedicated static magnetic sector fields and multicollection with discrete Faraday cups for the simultaneous quantification of all ion beams with precision in the determination of isotopes in the sub-ppm range [14]. The IRMS analysis determines the stable isotope concentrations in the analyzed sample, which are expressed as the molar ratio of the heavy and light isotope. Due to the fact that the quantified ratio is low, stable isotope abundances are presented relative to an international standard using the following δ notation:
δX = (Rsample/Rstandard − 1) × 1000
where δX is the delta value of the sample for element X (N, S, H, O, C, etc.) in parts per thousand (‰) and R is the molar ratio of the heavy (less common) to light (more common) isotope in the sample and in an international standard, respectively [15]. Considering that nitrogen is found in nature as a mixture of two stable isotopes, 14N and 15N, where the isotope 14N comprises 99.64% and isotope 15N 0.36% [16], Equation (1) can be rewritten as
δ15N = (15N/14Nsample/15N/14Nstandard − 1) × 1000
Atmospheric N2 represents the reference value of the standard in δ15N measurements [17] in which the ratio of stable nitrogen isotopes 15N/14N (1/272) is 0.0036764 or +3.68‰ [18].
The isotopic signature of nitrogen (δ15N) in terrestrial ecosystems is conditioned by the complexity of the nitrogen cycle, its numerous transformations, and the degrees of isotopic fractionation, along with the mean annual air temperature, annual precipitation, and the content of clay and organic carbon in the soil [19]. δ15N varies significantly from −20‰ to +30‰ in most terrestrial materials and from −49‰ to +102‰ in natural materials of terrestrial ecosystems [20]. Fifty-nine years ago, in 1964, the first isotopic abundances of nitrogen in USA soils were reported, and δ15N varied from +1‰ to +10‰ in cultivated soils and from +2‰ to 16‰ in natural soils [21] (Cheng et al., 1964). Recent studies have confirmed very similar ranges of isotopic nitrogen in the soils of the world, from −0.3‰ in forest soils in Germany to 3.59‰ in woodlands in Congo, and up to +9.48‰ in arable soils in Australia [22,23,24]. The interpretation of soil δ15N values is very challenging, not only due to the complexity of the nitrogen cycle, but also because of many other factors that influence the nitrogen content in soil. For example, mineralization/ammonification in soil influences the results, with isotopic fractionation abundance ranging from 0‰ to 5‰. Values also vary from 30‰ to 60‰ due to ammonia volatilization, from 15‰ to 35‰ due to nitrification, and from 28‰ to 33‰ due to denitrification, while N2 fixation depletes soil δ15N values due to the fact that atmospheric nitrogen has an isotopic value of 0‰ [25,26]. Also, during nitrogen fixation, soil bacteria convert nitrogen into ammonium, a process that itself does not induce a large isotopic fractionation but could lead to a shift from 0‰ to 2‰ [14]. The depletion of the nitrogen isotopic signature in soils can result from the application of mineral nitrogen fertilizers with isotopic values from −4.0‰ to +3.9‰ [27,28,29], while organic fertilizers (sewage sludge and animal manure) tend to have δ15N values between +8‰ and +20‰ [14], which can contribute to the enrichment of soil δ15N. Considering all of the above and the fact that δ15N of organic nitrogen in the soil ranges from +4.0‰ to +9.0‰ [30], the interpretation of the isotopic signatures of nitrogen in soil could be simplified as 0‰ to 2‰—atmospheric, 2‰ to 4‰—mineral, >4‰—organic origin.
Recently, many studies have focused on δ15N abundance in the optimization of nitrogen fertilizer use [31,32,33]. Using fertilizers labelled with 15N isotope made it possible to determine crop use efficiency and the optimal application of fertilizer, which will greatly enhance the sustainability of the agroecosystem. However, even without the use of labeled 15N tracking, knowledge of natural δ15N abundance in soil can even demystify the negative impact of mineral nitrogen fertilization and provide an insight into the path of nitrogen in soil. This can, in particular, refer to organic N recorded in arable land which is readily available to plants, and can also contribute to the sustainable management of the agroecosystem and to a reduction in fertilizer consumption.
The aim of this study was to compare the abundance of 15N isotopes of soils from continental and coastal parts of Croatia with different types of land use (arable land/crop production, meadows, forests, orchards, ski slopes, urban soil/city roads) and to authenticate the nitrogen origin in the soil regarding the different soil management types.

2. Materials and Methods

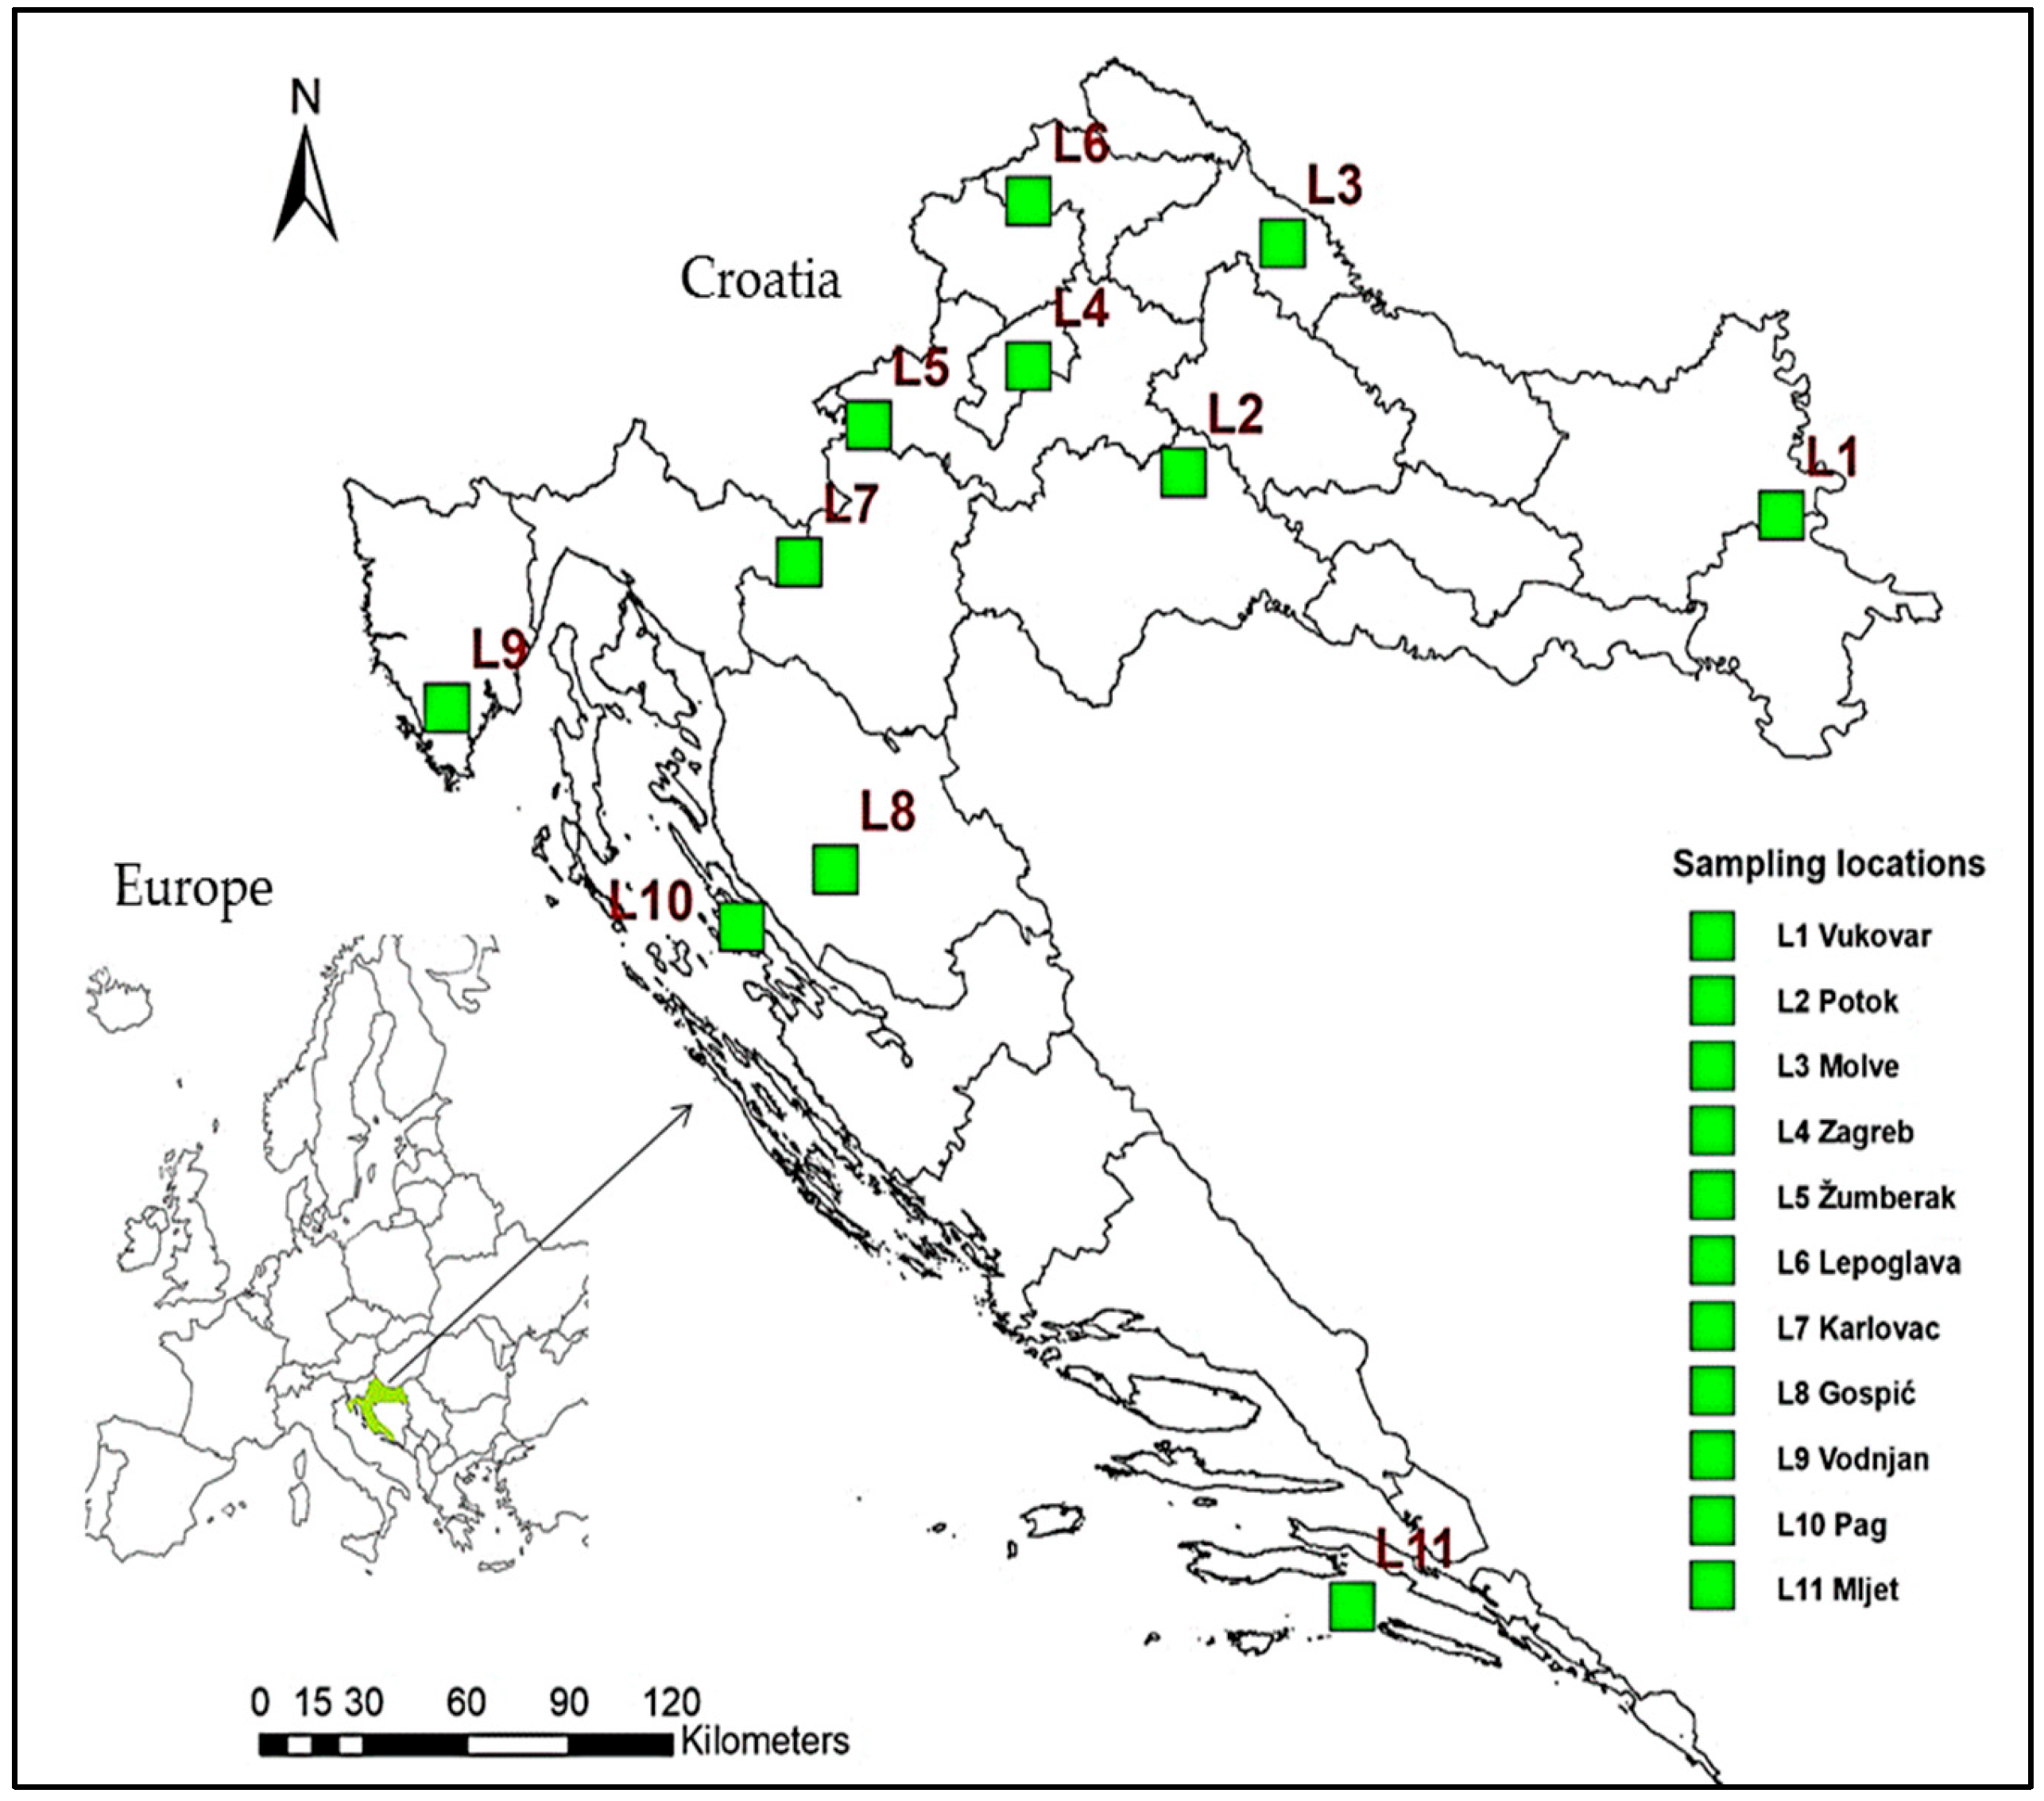
2.1. Site Descriptions and Soil Samples

In order to achieve our research goals, we first looked at the utility of soil nitrogen isotopes quantified in selected soils from Croatia and selected 27 soil samples—which had already been the focus of previous research—from the soil archive of the Department of General Agronomy, University of Zagreb Faculty of Agriculture, and enabled the initial database of δ15N abundance in Croatian soils. The selected soil samples, along with the chosen locations, covered all Croatian agricultural regions. The investigation even included composite soil samples from the only Croatian ski resort where world cup races (FIS Giant slalom) are held. This research included the analysis of soil samples collected—during the period of 2005–2020 as part of scientific research conducted by the employees of the Department of General Agronomy—from 11 locations (L1–L11) in Croatia (Figure 1, obtained via ArcGIS [34] based on the known coordinates of each location).
The samples were collected at six locations in the Pannonian agricultural region: three soil samples from Vukovar (eastern Pannonian agricultural subregion, L1); three from Potok; five from Molve; five from the area of the city of Zagreb, including the nearby Medvednica Nature Park; one from Zumberak–Samoborsko gorje Nature Park (western Pannonian agricultural subregion, L2, L3, L4, L5); and two from Lepoglava (northwestern Pannonian agricultural subregion, L6). Five samples were taken from two locations in mountainous agricultural regions: two samples from Karlovac (L7) and three samples from Gospic (L8). From the Adriatic agricultural region, three soil samples were selected: one sample from Vodnjan and one sample from the island of Pag (northern Adriatic agricultural subregion, L9 and L10), along with one soil sample from the island of Mljet (southern Adriatic agricultural subregion, L11) (Figure 1).
Continental Croatia (such as L1, L2, L3, L4, and L6) has temperate continental conditions (Cfwbx’’ climate) which are modified by the maritime influence of the Mediterranean. Mountainous districts with a higher altitude (L5, L7, L8) have a mountain climate (Cfcbx’’ climate), while on islands and in coastal areas (L9, L10, L11), an olive climate (Csa) is prevalent [35]. In terms of weather conditions, it is noticeable that, in a twenty-year period among the selected locations, the lowest mean annual temperature (MAT) of 9.3 °C occurred in the peak area of Zumberak, while the highest MAT (17.2 °C) was recorded at the southernmost point of the island of Mljet (L11). Precipitation in Croatia is the consequence of passing cyclones and related atmospheric fronts, and the annual amount of precipitation in continental Croatia decreases from west to east, because the moist air masses from the west lose their humidity on their way eastward [35]. This causes the lowest amount of precipitation (685.8 mm) to occur at the easternmost research location, Vukovar, location L1 (Table 1).
Soil samples differed according to soil type, land use, and mineral nitrogen fertilization (Table 2). All samples were collected from the surface soil layer (up 0.3 m depth). Out of 27 selected soil samples, 11 soil samples were collected from areas with intensive crop production as part of field experiments (L1, L2, L6, and L8). Samples from Vukovar are related to the five-year research on the temporal impact of nitrogen application (150 and 180 kg/ha) on corn yield and the spatial distribution of mineral nitrogen in the soil. The samples from Potok, Lepoglava, and Gospic represent soil conditions after the three-to-seven-year experiments of different liming materials and mineral nitrogen fertilizers (105, 150, 180, 200 k N/ha) on the yield of crops and soil chemical properties. From these four locations, soil samples were also selected from unfertilized plots (0 kg N/ha; CP_N0_L1, CP_N0_L2, CP_N0_L6, CP_N0_L8) in order to confirm the impact of the omission of nitrogen fertilization on the nitrogen isotopic signature. Also, one sample from Gospic was from a plot with solid manure applied at 30 t/ha (CP_SM_L8) (Table 2).
Five soil samples from Molve are related to the long-term monitoring of the environment of Molve central gas station. The sample from location L5 (AO_L5) represents soil from an apple orchard located in Nature Park Zumberak–Samoborsko gorje, and it was part of a study on the influence of different land use in the park on the soil chemical properties and flora distribution. Two soil samples from the Zagreb—M location represent the average soil samples from Nature Park Medvednica collected along the Red Slope at the Sljeme ski resort (SS_L4) and the surrounding forest (F_L4), while three soil samples (CR1-L4, CR2-L4, CR3-L4) from the Zagreb—C location represent soil in the vicinity of city roads. The sample from Pag (F_L10) represents soil from the only deciduous forest on the island of Pag (a mixed forest of pubescent oak Quercus pubescens Willd. (Fagales: Fagaceae) and hop hornbeam Ostrya carpinifolia Scop. (Fagales: Betulaceae)), while the soil sample from the island of Mljet (F_L11) is from a forest located in the targeted protection zone of Mljet National Park. Sample CP_N150VC_L9 represents soil from a vegetable garden where tomato was grown with the addition of mineral fertilization (150 kg N/ha) and vermicompost. The samples from Karlovac (M1_L7 and M2_L7) represent Holcus lanatus meadows invaded by bracken (Table 2).
Some basic soil properties have been described in previous studies (Table 3). The pH was detected using the potentiometric method (w/v 1:2.5; 1 mol L−1 KCl) [37]; total nitrogen (TN) and total carbon (TC) were detected using the dray combustion method [38,39]; and plant-available phosphorus and potassium were extracted using an ammonium lactate (AL) solution [40] and detected via spectrophotometry and flame spectrometry, respectively. Due to different soil types, the soil reaction (pH) varied from 3.76 in Dystric Cambisol at the L8 location up to 7.70 in Humic Leptosols at the L4 location. Nitrogen supply was between moderate (0.077%) and very rich (0.692%), and on average, soils contained 137.7 mg P2O5 kg−1 and 234.7 mg K2O kg−1.

2.2. Sample Analysis

The selected archived soil samples were already air dried, homogenized, and sieved (<2 mm), so no additional sample preparation was performed. δ15NT (T—total nitrogen) measurements in prepared soil samples were performed in 2021 at the Department of Environmental Science, by the Group of Organic Biogeochemistry at Jožef Stefan Institute at Reaktorski centar in Ljubljana. The determination of δ15N values in bulk samples was performed with the IsoPrime100-Vario PYRO Cube (OH/CHN Pyrolyser/Elemental Analyzer) (IsoPrime, Cheadle, Hulme, UK). Analyses were carried out automatically, where 30 mg of the soil sample was transferred directly into tin capsules, closed with tweezers, and put into an automatic sampler. Analyses were performed in duplicate. The results were normalized against the following international reference materials: USGS61 and USGS65, with δ15N = −2.87 ± 0.04‰ and δ15N = +20.68 ± 0.06‰, respectively. They were then calculated according to Equation (2). For independent quality control, international reference materials USGS64 with δ15N = +1.76 ± 0.06‰ and IAEN-N-1 with δ15N = +0.43 ± 0.07‰ were used, and the reproducibility of measurements was ±0.02‰.

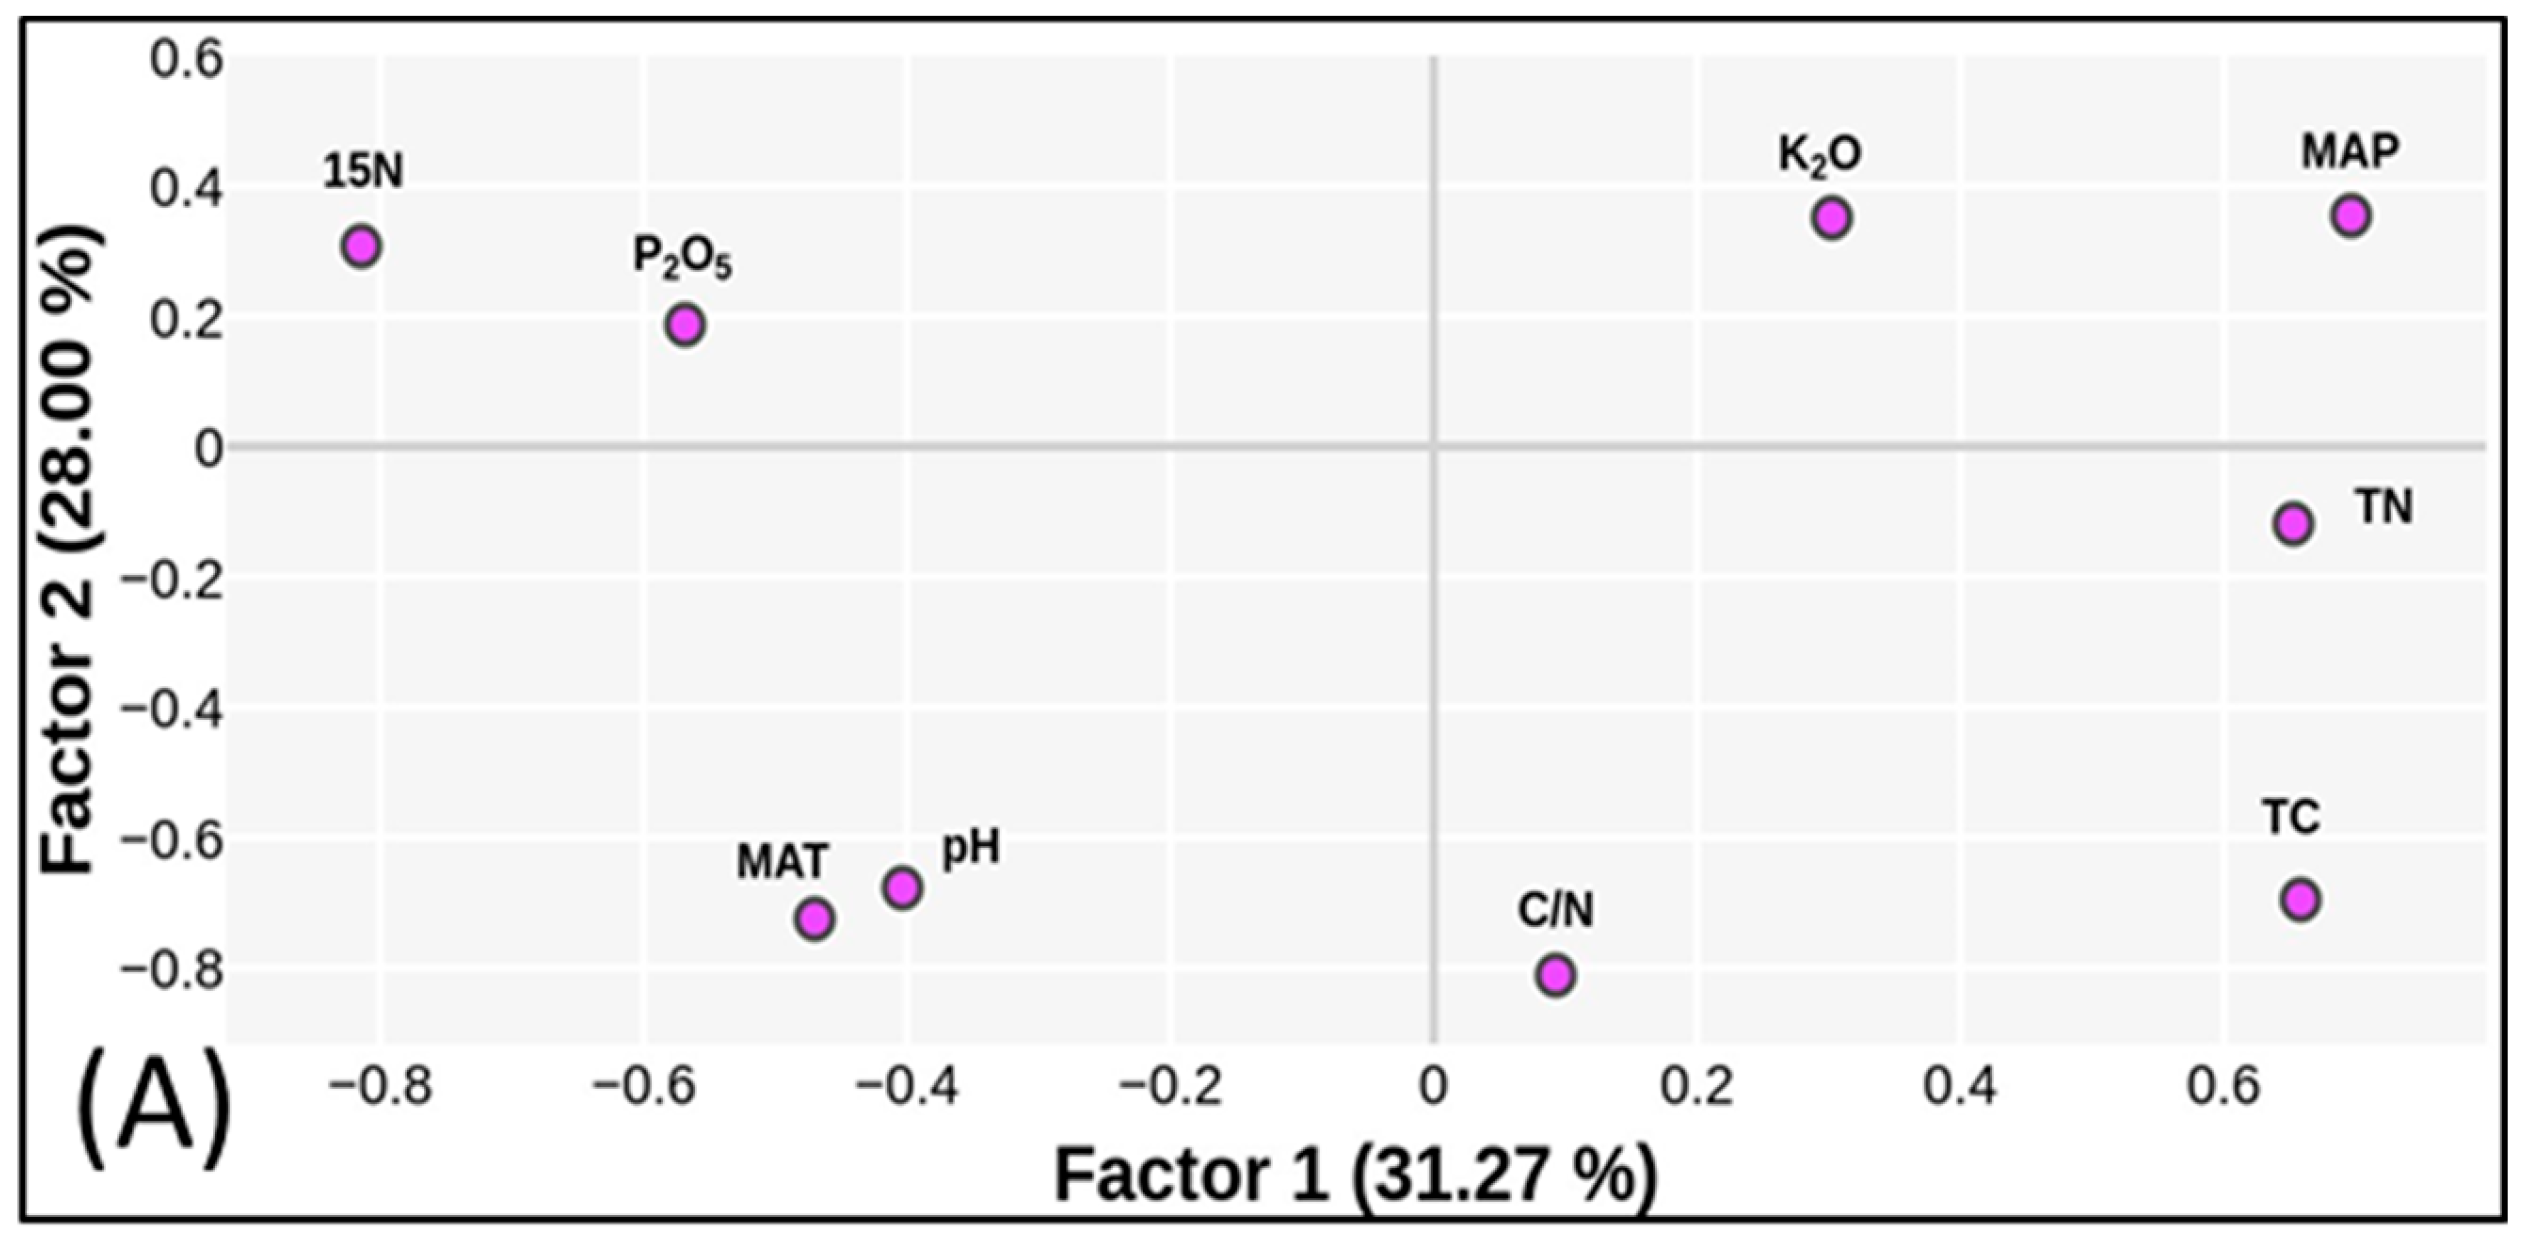
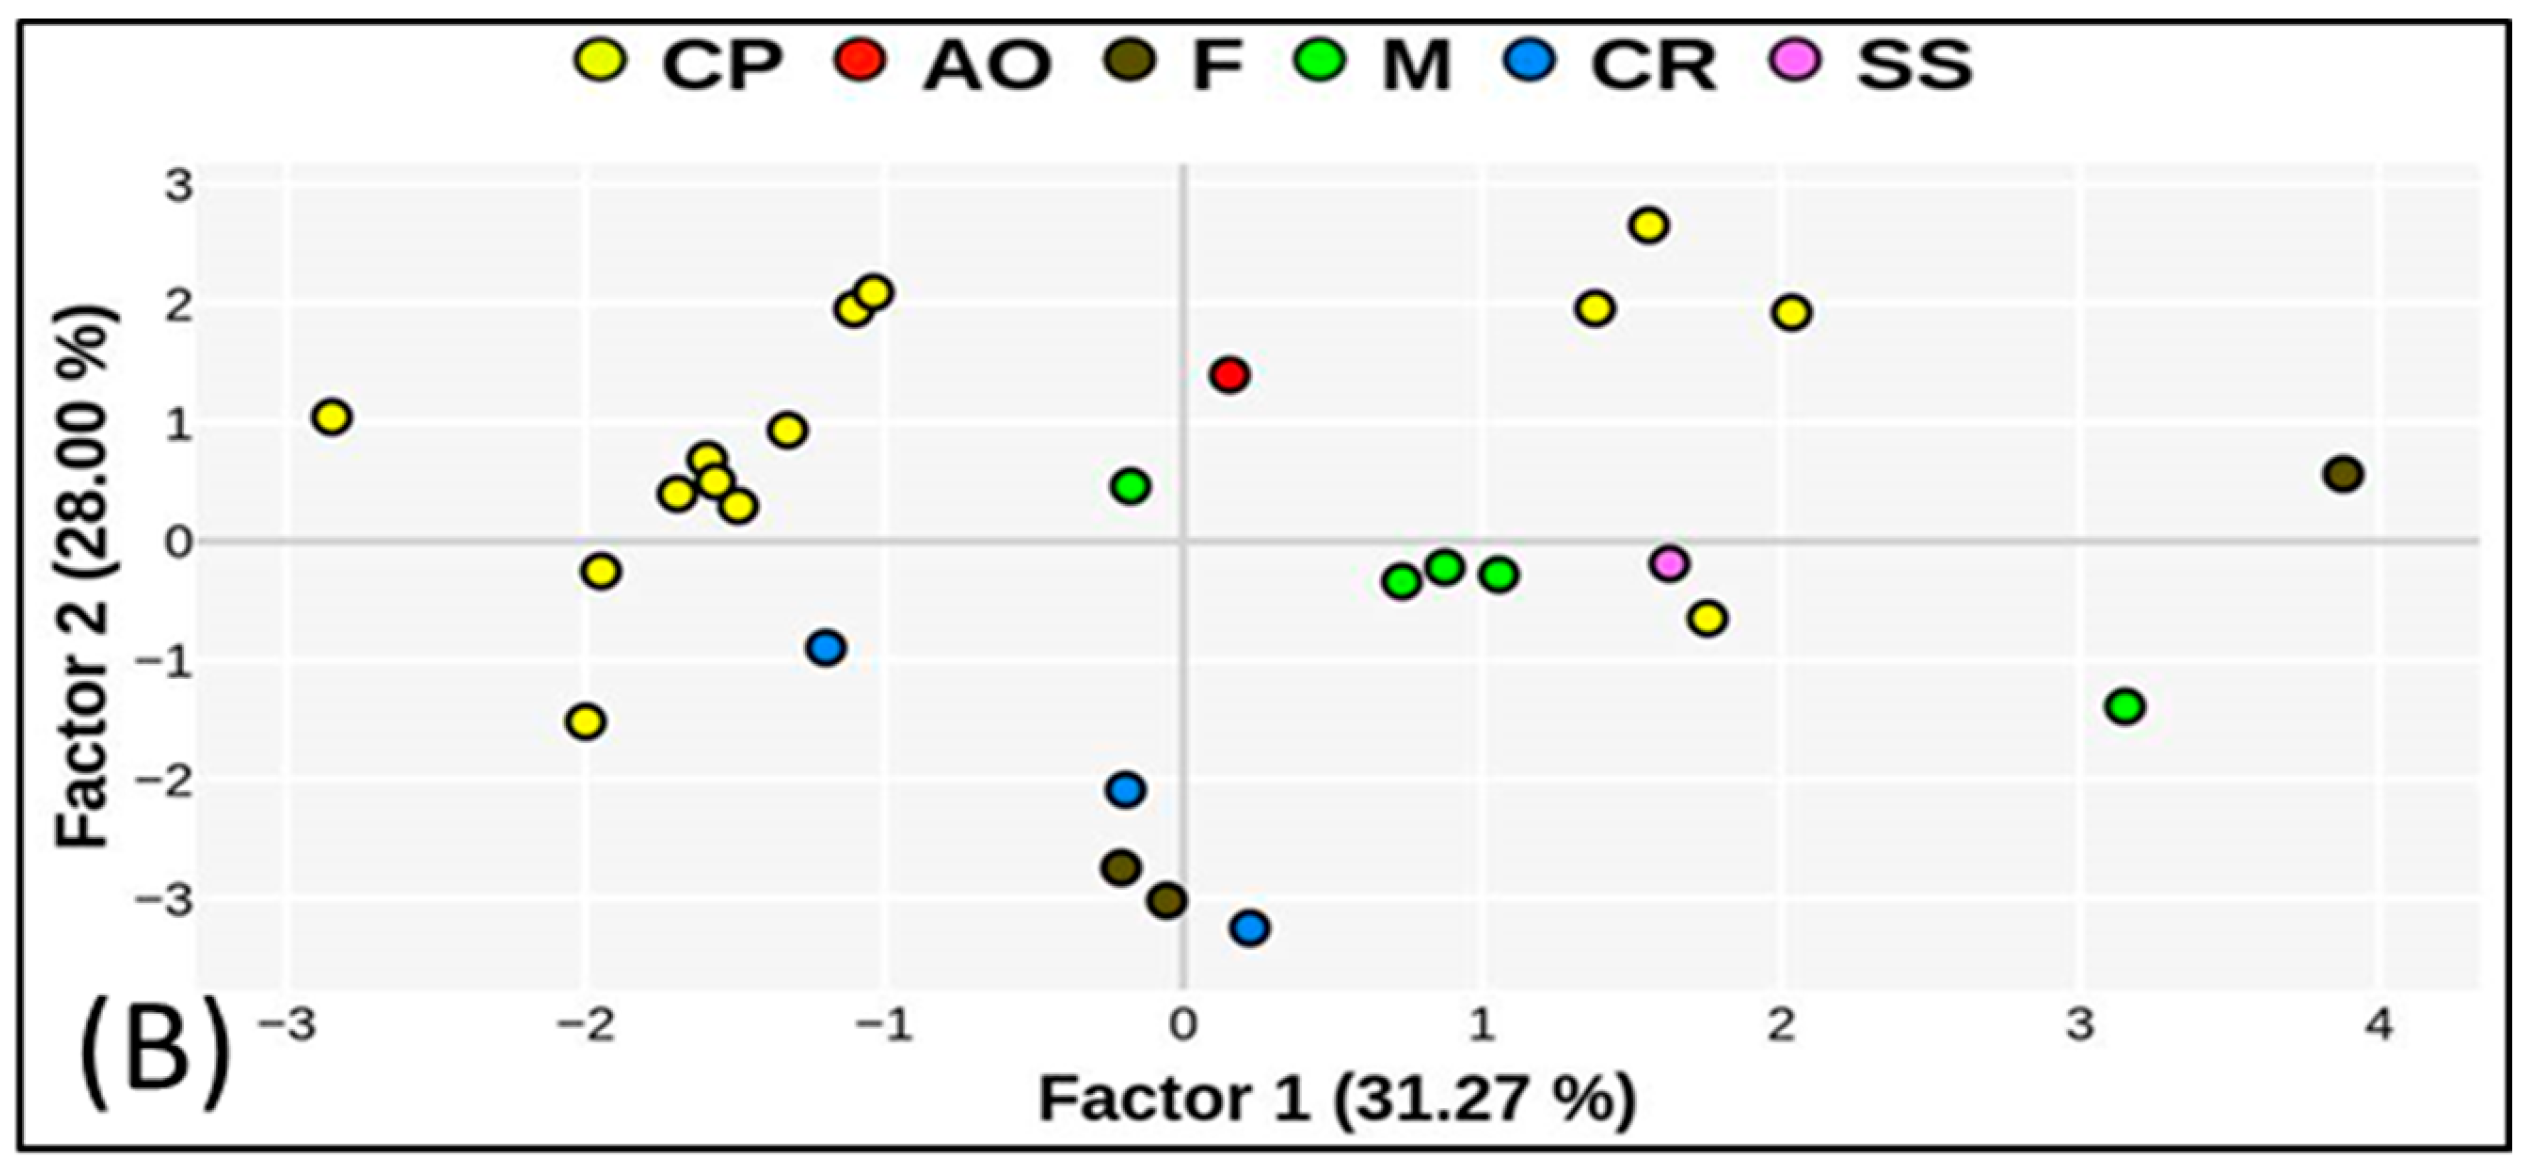
2.3. Statistical Analysis
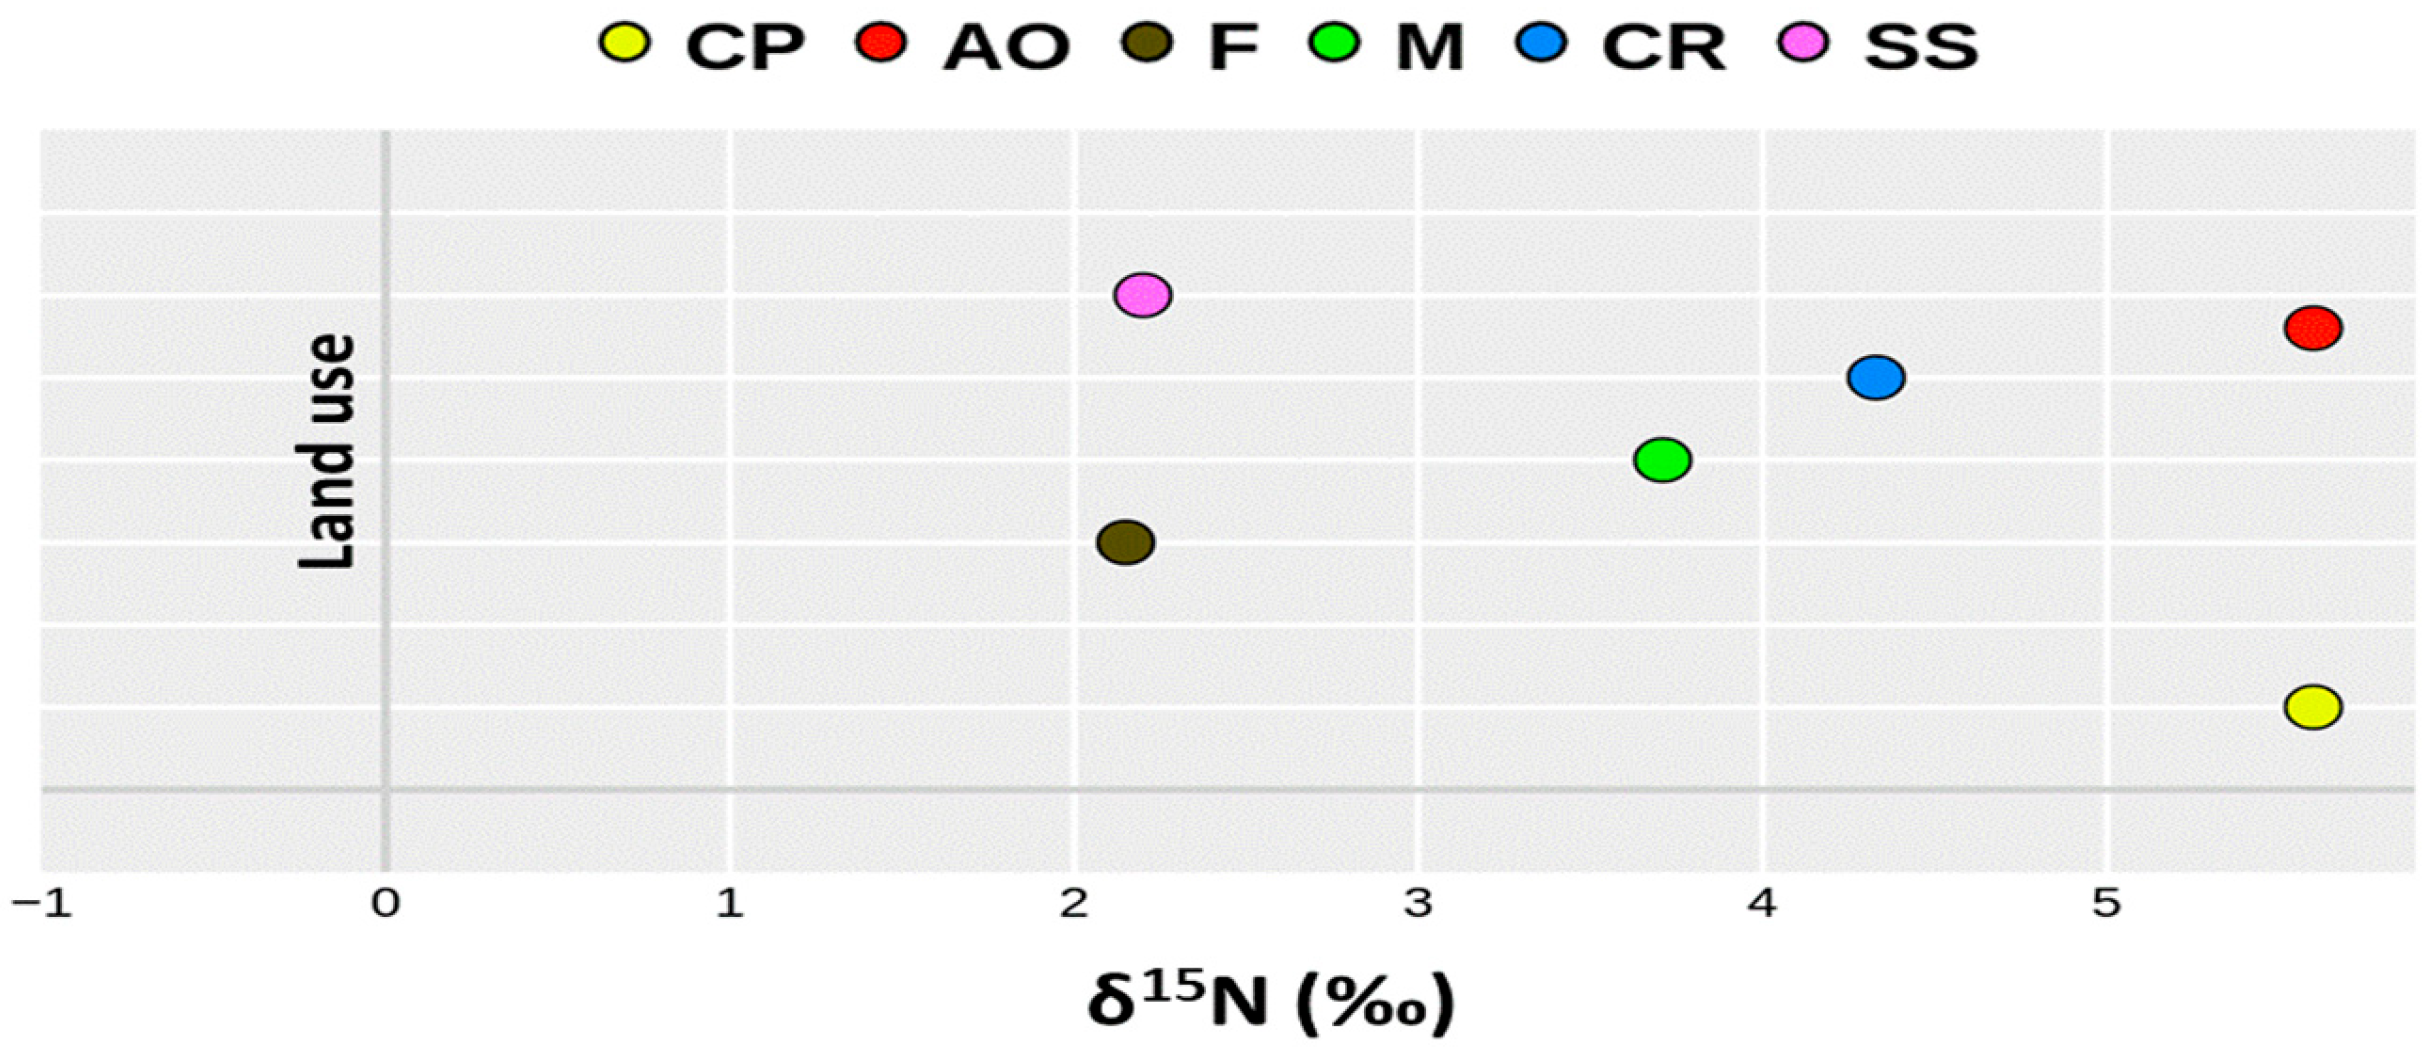
The obtained data of δ15N abundance in soil samples were processed at the level of descriptive statistics (the mean of δ15N for each selected soil sample and standard deviation), along with calculations of δ15N means and standard deviations according to different land use (crop production, apple orchards, forests, meadows, city roads, and ski slopes). Principal component analysis (PCA) was employed to examine important variables in a soil dataset and the relationship between the selected soil variables regarding land use and applied fertilization. Clusters of observations with similar characteristics with respect to measured soil variables and weather conditions (δ15N, pH, TN, TC, C/N, P2O5, K2O, MAT, MAP) were identified [41]. Figures were obtained via Plotly [42]. All the data in the tables and graphs are presented in their original state.

3. Results

The mean δ15N abundance in soils according to different land use decreases in the following order: crop production (+5.66 ± 1.06‰) > apple orchards (+5.60 ± 0.10‰) > city roads (+4.33 ± 0.38‰) > meadows (+3.71 ± 0.85‰) > ski slopes (+2.20 ± 0.10‰) > forests (+2.15 ± 1.86‰) (Figure 2). According to datasets from Table 3, the mean total nitrogen content observed in the soils decreases in following order: meadows (0.487 ± 0.29%) > forests (0.359 ± 0.08%) > crop production (0.293 ± 0.18%) > city roads (0.280 ± 0.05%) > apple orchards (0.261 ± 0.04%) > ski slopes (0.228 ± 0.06%), the while total carbon decreases in the following order: forests (6.10 ± 0.22%) > city roads (6.02 ± 1.63%) > meadows (5.61 ± 2.97%) > ski slopes (4.56 ± 0.19%) > apple orchards (2.31 ± 0.38%) > crop production (2.26 ± 1.63%). Due to the fact that only one sample was selected from an orchard and one from a ski slope, the mean values represent the results of duplicate measurements for those land uses. Comparatively, the lowest mean δ15N abundance in forest soils (+2.15 ± 1.86‰) is associated with the highest mean amount of total carbon (6.10 ± 0.22%) and a very rich nitrogen supply (0.359 ± 0.08%).
δ15N varied from 0.00 ± 0.10 ‰ in the forest soil at the L4 location to +7.19 ± 0.07‰ in the vegetable garden at the L9 location (Table 4). In arable soil with crop production, the lowest isotopic signature was recorded at the L8 location where 105 kg ha1 of mineral nitrogen was applied, while the highest abundance was recorded at the L9 location where a combination of mineral and organic fertilization was applied. The highest isotopic variation among the locations was recorded for forest land use, where δ15N ranged from 0.00 ± 0.10‰ at the continental L4 location to 3.24 ± 0.08‰ at the coastal L10 location, and varied by 86.6% according to the calculated coefficient of variation. Meadow soils located in the continental part of Croatia differed in δ15N abundance by 23.0% (from 2.50 ± 0.10‰ to 4.61 ± 0.06‰), while the lowest variation in nitrogen isotopic signature (CV = 8.74%) was recorded among urban soils in the vicinity of city roads in Zagreb (L4 location).
The relationship between PC1 and PC2 for all investigated locations is shown in Figure 3. The variables with the highest loadings are TC and TN in PC1, which explains 31% of the variance, and K2O and MAP in PC2, which accounts for 28% of the total variance. TN and TC were inversely related to P2O5 and δ115N, while the MAT and soil pH were related to K2O and MAP, respectively. Furthermore, the PCA analysis showed that P2O5 and δ115N, and pH and MAT, were highly correlated. The high negative values of PC2 for pH, MAT, and C/N demonstrate a distinction between non-agricultural land and crop production areas. Higher values of δ115N are responsible for organic N origin as well as the P2O5 content. High C/N ratio values explain the distribution of non-arable land (city roads and forests). K2O, to a lesser extent, was responsible for grouping fertilized agricultural soils. High TN and TC values in the PC1 plane indicated fertile meadows (M3_L3) and forest soils (F_L4).

4. Discussion

The recorded value of 0‰ in forests at the L4 location can be associated with atmospheric nitrogen, i.e., with moist deposition or nitrogen fixation. The isotopic composition of atmospheric molecular nitrogen is homogeneous and δ15N in the atmosphere is 0‰ [43]. A similar δ15N abundance (0.7‰ ± 0.1‰ to 0.9‰ ± 0.2‰) in the forest soils of Mediterranean cork oak, holm oak, and randomly mixed Montados was recorded in the Portuguese Alentejo region [44]. Tomatoes (‘’St. Pierre’’ variety) were grown in the vegetable garden at the L9 location, and in addition to basic fertilization with NPK 5-20-30 fertilizer, 100 g of pure solid vermicompost was deposited in the soil next to the root of each plant. The in-season application of vermicompost was also applied as a solution in a ratio of 1:2 (earthworm/water; v/v). The determined value of +7.19‰ indicates that the nitrogen in that soil originated from the vermicompost. This can be confirmed by the fact that the results of the δ15N analysis of vermicompost were +7.79 ± 0.10‰. According to several authors, the values of isotopic nitrogen in mineral nitrogen fertilizers range from −2.4‰ (urea) to +2.2‰ (NH4NO3) [45], and from −1.7‰ (NPK 15-15-15) to +3.9‰ (Ca(NO3)2 [28], as well as from −0.96‰ (LAN) to +3.26‰ (NPK 7-20-30) [29]. The values of isotopic nitrogen in organic fertilizers range from +3.5‰ to +16.2‰ [45]; therefore, the δ15N values of the vermicompost (+7.79 ± 0.10‰), as well as the soil sample (+7.19 ± 0.07‰) from the L9 location, were as expected. The results from the tomato garden in this study are in accordance with the results of δ15N abundance (5.25‰ to 11.02‰) in the soils of Spanish organic and conventional gardens where zucchini, cucumber, tomato, and pepper were grown [46]. The results from that study also reveal that the δ15N values of applied vermicompost (4.15‰), manure (8.89‰), and compost (15.38‰) resulted in a higher abundance of isotopic composition in the observed soils [46]. Ref. [47] explains that higher values of isotopic nitrogen in organic fertilizers are the result of several processes in the nitrogen cycle (ammonification, immobilization, nitrification, denitrification, NH3 volatilization, and leaching) that take place across different stages of manure maturation, and which consequently enrich organic manure with the δ15N isotope. Conversely, ref. [30] explains that the range of lower values of isotopic nitrogen in mineral fertilizers is caused by the fact that they are produced on the basis of the quantitative processes of the “industrial” fixation of atmospheric nitrogen. This results in low isotopic fractionation, which consequently causes mineral nitrogen fertilizers to have δ15N values close to zero (0‰).
Following the aforementioned values of isotopic nitrogen in organic and mineral fertilizers, it was to be expected that the values of δ15N in the soil samples collected from stationary field experiments where mineral nitrogen fertilization was applied would be in the range of −2.4‰ up to +3.9‰. It was thought that this would correspond to the isotopic signature of nitrogen from mineral fertilizers; however, this was not the case for the values of isotopic nitrogen in the soil from the L1 location (δ15N = +4.99 ± 0.09‰ and δ15N = +6.28 ± 0.06‰) and the L2 location (δ15N = +6.59 ± 0.03‰ and δ15N = +6.15 ± 0.012‰), where 150 kg N/ha and 180 kg N/ha were applied, respectively, as well as in the L6 location with 200 kg ha1 of mineral nitrogen (δ15N = +6.11 ± 0.09‰), indicating the organic origin of the nitrogen in soil. It is necessary to add that the observed soils were fertilized with mineral nitrogen for three to seven years, and a short period of fertilization could partly cause the δ15N in the soil to not be identical to the δ15N in mineral nitrogen fertilizers. A similar study was conducted in central Croatia (Dystric Cambisol), and the results indicate that a twenty-two-year nitrogen application of 300 kg ha1 and crop production led to a δ15N value of 6.80 ± 0.10‰ [29]. But it was expected that δ15N values in the samples from unfertilized plots at L1, L2, L6, and L8 (CP_N0_L1, CP_N0_L2, CP_N0_L6, CP_N0_L8) would be >4‰, which was confirmed (6.22 ± 0.07‰, 6.38 ± 0.04‰, 6.24 ± 0.13‰, 4.57 ± 0.03‰, respectively) and, according to ref. [30], indicates organic nitrogen. All of the above leads to the conclusion that observed trends in δ15N variation under long-term mineral nitrogen fertilization are conditioned by the nitrification process in soil, creating isotopically heavier ammonium and lighter nitrate in the soil. Nitrates were subsequently taken up by crops and removed from the system, resulting in soil with increased δ15N values in the long term [22]. Also, the δ15N value of +4.56 ± 0.10‰ determined in the CP_SM_L8 sample (soil with 30 t/ha of solid manure application) indicates nitrogen of organic origin and is in accordance with the ranges of isotopic nitrogen in the organic fertilizers in ref. [45]. This was confirmed by the PCA analysis, i.e., among all other analyzed soil variables, isotopic δ15N contributed the most to the clustering of soils with N of organic origin. The δ15N values observed in arable land, e.g., crop production (+4.00 ± 0.10‰ to +6.38 ± 0.04‰), are in line with the isotopic signatures of arable soils in Europe: +3.7‰ in Germany [23], +5.5‰ in Scotland [48], and from +3.5 to +7.3‰ in France [49].
Furthermore, the determined δ15N values of +2.20 ± 0.10‰ at the ski slope (SS_L4) and +2.50 ± 0.10‰ in the meadow (M1_L3) indicate the inorganic origin of nitrogen; more precisely, the δ15N values indicate a signature of NH4NO3 fertilizer. As reported by [28] in their example of 27 commercial single-component and complex mineral fertilizers, the isotopic signature of nitrogen in the majority of the tested nitrogen fertilizers ranged from −1.7‰ (NPK 15-15-15) to +1.5‰ (NH4)2SO4 with an average value of −0.34‰, although two fertilizers stand out with significantly higher δ15N values, NH4NO3 (+2.50‰) and Ca(NO3)2 (+3.90‰). The nitrogen signature at the ski slope was as expected, especially due to the fact that, for the production of artificial snow and the preparation of the ski slope, various salts are used, including nitrogen-based fertilizers, namely: urea, ammonium sulfate, and ammonium nitrate [50,51]. Their application as ‘’snow hardeners’’ improves the snow quality with the primary goal of providing fair and safe competition conditions for the FIS Ski World Cup, which also takes place at the L2 location. The inorganic origin of nitrogen in the meadows at the L3 location (+3.20 ± 0.10‰ and +2.50 ± 0.10‰) was unexpected, and those isotopic signatures also correspond to mineral fertilizers. This can be partly explained by the fact that both meadows are located in the vicinity of the arable crop land (more precisely, on the slope below the arable land) where, at the time of soil sampling (May 2019), the maize was in 8–10 leaf development, and in-season fertilization with ammonium nitrate had already been carried out. A certain amount of the applied nitrogen could have reached the meadow soil as a result of surface runoff. The soil from this location was sampled at a shallow depth (0–5 cm). The apple orchard at the L5 location is maintained by being mown twice a year, and the grass is left as mulch on the surface, which must have additionally contributed to the fact that the nitrogen in that location was of organic origin (5.60 ± 0.10‰). In the meadow soil at the L7 location, the isotopic signature of nitrogen (+4.25 ± 0.02‰ and +4.61 ± 0.06‰) indicates the as-expected organic origin of nitrogen, while the forest soils from the islands of Pag (δ15N = +3.24 ± 0.08‰) and Mljet (δ15N = +3.22 ± 0.07‰) indicate the atmospheric origin of nitrogen in these soils. The results from the forest soils from coastal Croatia are in accordance with the δ15N abundance (3.29 ± 0.69‰) determined in Huajiang Grand Canyon in China, an area with a primarily subtropical monsoon climate, an average annual precipitation of 1100 mm, and an annual average temperature of 18.4 °C [52]. The isotopic signatures observed in the meadow soils were similar to those from previous studies of isotopic signatures in meadow and grassland soils, from +2.9‰ to 4.4‰ [48,49,53], and the enrichment of δ15N can be associated with higher microbial activity in those soils. Ultimately, the results from this research indicate that the origin of nitrogen in soils from land used for crop production; orchards; and meadows is organic (δ15N > 4‰), just as was reported from southern China, where δ15N values were in the range of 4.79‰ to 8.01‰ in peach orchard soils, meadows, and soils from land used for paddy, maize, and tobacco production; the maximum δ15N values were found in the soil surface layer (0–20 cm) of the maize fields [54]. Regarding the δ15N abundance in forest soils, it must be pointed out that forest soils usually have lower δ15N values—from −0.3‰ to +2.94‰ [24,55]—compared to arable soils and meadows, and along with N2 fixation, decreased isotopic signatures can be caused by the decomposition of litter. Higher δ15N variability in forest soils (0.00 ± 0.10‰ to 3.24 ± 0.08‰, CV = 86.6%) can be associated with the weather conditions in different locations. For example, a lower isotopic abundance (0.00 ± 0.10‰) was recorded in colder locations with more humid atmospheric conditions (8.5 °C and 1321.3 mm), whereas a higher δ15N value (3.24 ± 0.08‰) was recorded in warmer and less humid locations (16.4 °C and 972.6 mm). Previous analyses have shown that δ15N soil decreases with a decrease in MAT (mean annual temperature) and with an increase in MAP (mean annual precipitation) [56].
Overall, the results of this study indicate that variations in the stable nitrogen isotope in forests, cultivated areas, meadows, orchards, and urban soil are the result of internal ecosystem transformations, whereas the abundance of the stable nitrogen isotope in the soil of the ski slope was influenced by an external nitrogen source, i.e., the application of mineral fertilizers. It should be added that, although mineral nitrogen fertilization did not affect the isotopic signature of nitrogen in arable soils, it can negatively contribute to the environment. The increasing use of nitrogen fertilizers in food production worldwide has resulted in an increase in N2O concentration in the atmosphere, where it remains as a greenhouse gas and is 298 times more potent than carbon dioxide [57]. In 2015, 40% of surface waterbodies and more than 50% of groundwater in the EU were affected by nutrient pollution, largely due to N fertilization and manure mismanagement [57]. From an economic point of view, variable doses of nitrogen fertilization can enhance maize grain yield, but after accounting for the costs of N fertilizer and other agricultural inputs, a farmers’ personal profit can only reach a maximum of USD 2038 ha−1 [58].

5. Conclusions

The results indicate that isotopic signatures in orchard, arable, and urban soils in Croatia are conditioned by organic nitrogen cycling, whereas in forest soils, atmospheric deposition is the main source of nitrogen. In meadow soils, the nitrogen isotopic fractionation is conditioned by the content of total carbon and total nitrogen. The isotopic signature in soils from ski slopes reveals the anthropogenic influence of mineral nitrogen fertilizers in their application as ‘’snow hardeners’’ during the ski season and ski races. The long-term application of 150, 180, and 200 kg N/ha, i.e., mineral fertilizers produced via the processes of the “industrial” fixation of atmospheric nitrogen, had a sustainable effect on the enrichment of the soil containing organic nitrogen. Even though this research was only based on 27 soil samples, it represents a valuable initial database and provides an important insight for future studies that will confirm and expand on the knowledge presented in this investigation. In addition, it provides support for continuing the use and research of all land use classes and δ15N abundance in Croatian soils in future.

Author Contributions

Conceptualization, A.P.; methodology, A.P.; formal analysis, A.P. and M.B.; investigation, A.P. and M.B.; resources, M.M. and I.K.; data curation, I.Š. and I.D.; writing—original draft preparation, A.P.; writing—review and editing, Ž.Z., I.K., M.M., I.Š. and I.D.; visualization, I.D. and I.Š. All authors have read and agreed to the published version of the manuscript.

Funding

This research received no external funding.

Institutional Review Board Statement

Not applicable.

Informed Consent Statement

Not applicable.

Data Availability Statement

Data are contained within the article.

Acknowledgments

The authors would especially like to thank the Croatian Meteorological and Hydrological Service for providing the climate data which enabled the creation of Table 1.

Conflicts of Interest

The authors declare no conflict of interest.

References

  1. Peterson, B.J.; Fry, B. Stable Isotopes in Ecosystem Studies. Annu. Rev. Ecol. Syst. 1987, 18, 293–320. [Google Scholar] [CrossRef]
  2. Sharp, Z. Chapter 9: Nitrogen. In Principles of Stable Isotope Geochemistry, 2nd ed.; Prentice Hall: Hoboken, NJ, USA, 2017; pp. 1–15. Available online: https://digitalrepository.unm.edu/unm_oer/1/ (accessed on 15 July 2022).
  3. Choi, W.O.; Ro, H.E.; Hobbie, E.A. Patterns of natural 15N in soils and plants from chemically and organically fertilized uplands. Soil Biol. Biochem. 2003, 35, 1493–1500. [Google Scholar] [CrossRef]
  4. International Atomic Energy Agency. Stable Isotope Measurement Techniques for Atmospheric Greenhouse Gases, IAEA-TECDOC-1268; IAEA: Vienna, Austria, 2002. Available online: https://www.iaea.org/publications/6363/stable-isotope-measurement-techniques-for-atmospheric-greenhouse-gases (accessed on 15 July 2022).
  5. International Atomic Energy Agency. Sampling and Isotope Analysis of Agricultural Pollutants in Water, IAEA-TECDOC-1850; IAEA: Vienna, Austria, 2018. Available online: https://www.iaea.org/publications/12374/sampling-and-isotope-analysis-of-agricultural-pollutants-in-water (accessed on 15 July 2022).
  6. Graven, H.; Keeling, R.F.; Rogelj, J. Changes to carbon isotopes in atmospheric CO2 over the industrial era and into the future. Glob. Biogeochem. Cycles 2020, 34, e2019GB006170. [Google Scholar] [CrossRef]
  7. Aceto, A. Chapter 9: Food Forensics. In Comprehensive Analytical Chemistry; Picó, J., Ed.; Elsevier: Amsterdam, The Netherlands, 2015; pp. 441–514. [Google Scholar]
  8. Drummer, O.H. Mass Spectrometry|Forensic Applications. In Encyclopedia of Analytical Science, 3rd ed.; Worsfold, P., Poole, C., Townshend, A., Miró, M., Eds.; Academic Press: Cambridge, MA, USA, 2019; pp. 351–357. [Google Scholar]
  9. Nnane, I.P.; Tao, X. Drug metabolism|Isotope Studies. In Encyclopedia of Analytical Science, 2nd ed.; Worsfold, P., Townshend, A., Poole, C., Eds.; Elsevier: Amsterdam, The Netherlands, 2005; pp. 311–316. [Google Scholar]
  10. Hackney, A.C. Chapter 10: Athlete Testing, Analytical Procedures, and Adverse Analytical Findings. In Emerging Issues in Analytical Chemistry, Doping, Performance Enhancing Drugs, and Hormones in Sport; Hackney, A.C., Ed.; Elsevier: Amsterdam, The Netherlands, 2018; pp. 113–127. [Google Scholar]
  11. Jantzi, S.C.; Almirall, J.R. Trace Evidence: Glass, Paint, Soil, and Bone. In Treatise on Geochemistry, 2nd ed.; Holland, H.D., Turekian, K.K., Eds.; Elsevier: Amsterdam, The Netherlands, 2014; pp. 271–284. [Google Scholar]
  12. Flenker, U. Isotope ratio mass spectrometry—History and terminology in brief. Drug Test. Anal. 2012, 4, 893–896. [Google Scholar] [CrossRef]
  13. Nier, A.O. A mass spectrometer for isotope and gas analysis. Rev. Sci. Instrum. 1947, 18, 398–411. [Google Scholar] [CrossRef]
  14. Kelly, S.; Brodie, C.; Hilkert, A. Chapter 11: Isotopic-Spectroscopic Technique: Stable Isotope-Ratio Mass Spectrometry (IRMS). In Modern Techniques for Food Authenticatio, 2nd ed.; Sun, D.W., Ed.; Academic Press: Cambridge, MA, USA, 2018; pp. 349–413. [Google Scholar]
  15. Gonfiantini, R. Standards for stable isotope measurements in natural compounds. Nature 1978, 271, 534–536. [Google Scholar] [CrossRef]
  16. Ryabenko, E. Stable Isotope Methods for the Study of the Nitrogen Cycle. In Topics of Oceanography; Zambianchi, E., Ed.; IntechOpen: London, UK, 2013; pp. 1–4. [Google Scholar]
  17. Mariotti, A.; Germon, J.C.; Hubert, P. Experimental determination of nitrogen kinetic isotope fractionation: Some principles; illustration for the denitrification and nitrification processes. Plant Soil 1981, 62, 413–430. [Google Scholar] [CrossRef]
  18. Robinson, D. δ15N as an integrator of the nitrogen cycle. Trends Ecol. Evol. 2001, 16, 153–162. [Google Scholar] [CrossRef]
  19. Craine, J.; Brookshire, E.N.J.; Crames, M.D.; Hasselquist, N.J.; Kobe, K.; Marin-Spiotta, E.; Wang, L. Ecological interpretations of nitrogen isotope ratios of terrestrial plants and soils. Plant Soil 2015, 36, 1–26. [Google Scholar] [CrossRef]
  20. Böhlke, K.; Gwinn, C.J.; Coplen, T.B. New reference materials for nitrogen-isotope-ratio measurements. Geostand. Newsl. 1993, 17, 159–164. [Google Scholar] [CrossRef]
  21. Cheng, H.H.; Bremner, J.M.; Edwards, A.P. Variations of Nitrogen-15 Abundance in Soils. Science 1964, 146, 1574–1575. [Google Scholar] [CrossRef]
  22. Jones, A.R.; Dalal, R.C. Enrichment of natural 15N abundance during soil N losses under 20 years of continuous cereal cropping. Sci. Total Environ. 2017, 574, 282–287. [Google Scholar] [CrossRef]
  23. Nitzsche, K. Applying Isotope Geochemistry to Identify Mechanisms Regulating the Aquatic-Terrestrial Carbon and Nitrogen Dynamics across Scales in a Moraine Landscape. Ph.D. Thesis, Humboldt-Universität zu Berlin, Berlin, Germany, 2017. [Google Scholar]
  24. Baumgartner, S.; Bauters, M.; Barthel, M.; Drake, T.W.; Ntaboba, L.C.; Bazirake, B.M.; Six, J.; Boeckx, P.; Van Oost, K. Stable isotope signatures of soil nitrogen on an environmental-geomorphic gradient within the Congo Basin. Soil 2021, 7, 83–94. [Google Scholar] [CrossRef]
  25. Högberg, P. Tansley Review No. 95 15N natural abundance in soil-plant systems. New Phytol. 1997, 137, 179–203. [Google Scholar] [CrossRef]
  26. Szpak, P. Complexities of nitrogen isotope biogeochemistry in plant-soil systems: Implications for the study of ancient agricultural and animal management practices. Front. Plant Sci. 2014, 5, 288. [Google Scholar] [CrossRef]
  27. Kendall, C.; Silva, S.R.; Stober, Q.J.; Meyer, P. Mapping spatial variability in marsh redox conditions in the Florida everglades using biomass stable isotopic compositions. EOS Trans. Am. Geophys. Union 1998, 79, S88. [Google Scholar]
  28. Vitòria, L.; Otero, N.; Soler, A.; Canals, À. Fertilizer Characterization: Isotopic Dana (N, S, O, C, and Sr). Environ. Sci. Technol. 2004, 38, 3254–3262. [Google Scholar] [CrossRef]
  29. Perčin, A.; Fiolić, M.; Karažija, T.; Zgorelec, Ž.; Šestak, I.; Mesić, M. Long-Term Effects of Mineral Nitrogen Fertilization on the Origin of Total Nitrogen in Soil. In Book of Abstracts “Soil Degradation—Challenge in Agricultural Production”, Proceedings of the 14th Congress of the Croatian Society of Soil Science, Sveti Martin na Muri, Croatia, 12–16 September 2022; Popović, B., Zebec, V., Prečin, A., Eds.; The Croatian Society of Soil Science: Sveti Martin na Muri, Croatia, 2022; pp. 71–72. [Google Scholar]
  30. Heaton, T.H.E. Isotopic studies of nitrogen pollution in the hydrosphere and atmosphere: A review. Chem. Geol. Isot. Geosci. Sect. 1986, 59, 87–102. [Google Scholar] [CrossRef]
  31. Lei, H.; Lian, Y.; Kyaw, P.E.E.; Bai, M.; Leghari, S.J.; Pan, H.; Xiao, Z.; Chen, D. Using 15N Isotope to Evaluate the Effect of Brown Coal Application on the Nitrogen Fate in the Soil–Plant System. Agronomy 2023, 13, 263. [Google Scholar] [CrossRef]
  32. Folina, A.; Tataridas, A.; Mavroeidis, A.; Kousta, A.; Katsenios, N.; Efthimiadou, A.; Travlos, I.S.; Roussis, I.; Darawsheh, M.K.; Papastylianou, P.; et al. Evaluation of Various Nitrogen Indices in N-Fertilizers with Inhibitors in Field Crops: A Review. Agronomy 2021, 11, 418. [Google Scholar] [CrossRef]
  33. Salazar, O.; Diaz, R.; Nario, A.; Videla, X.; Alonso-Ayuso, M.; Quemada, M. Nitrogen Fertilizer Efficiency Determined by the 15N Dilution Technique in Maize Followed or Not by a Cover Crop in Mediterranean Chile. Agriculture 2021, 11, 721. [Google Scholar] [CrossRef]
  34. Esri® ArcGIS Desktop 10.7; Copyright 1999–2018u; Environmental Systems Research Institute: Redlands, CA, USA, 2019.
  35. Zaninović, K.; Gajić-Čapka, M.; Perčec Tadić, M.; Vučetić, M.; Milković, J.; Bajić, A.; Cindric, K.; Cvitan, L.; Katušin, Z.; Kaučić, D.; et al. (Eds.) Klimatski atlas Hrvatske/Climate Atlas of Croatia 1961–1990, 1971–2000; Croatian Meteorological and Hydrological Service: Zagreb, Croatia, 2008. [Google Scholar]
  36. USS Working Group. World Reference Base for Soil Resources 2014, update 2015 International soil classification system for naming soils and creating legends for soil maps. In World Soil Resources Reports No. 106; FAO: Rome, Italy, 2015. [Google Scholar]
  37. ISO 10390; Soil Quality—Determination of pH. International Organization for Standardization: Geneva, Switzerland, 2005; pp. 1–7.
  38. ISO 13878; Soil Quality—Determination of Total Nitrogen Content by Dry Combustion (“Elemental Analysis”). International Organization for Standardization: Geneva, Switzerland, 1998; pp. 1–5.
  39. ISO 10694; Soil Quality—Determination of Organic and Total Carbon after Dry Combustion (Elementary Analysis). International Organization for Standardization: Geneva, Switzerland, 1995; pp. 1–7.
  40. Egner, H.; Riehm, H.; Domingo, W.R. Untersuchungen über die chemische Bodenanalyse als Grundlage für die Beurteilung des Nährstoffzustandes der Böden. II Chemische Extraktionsmethoden zur Phosphor und Kalium. Kungl. Lantbruk. Ann. 1960, 26, 45–61. [Google Scholar]
  41. STATISTICA Data Analysis Software System, Version 12; StatSoft, Inc.: Tulsa, OK, USA, 2014.
  42. Plotly. Available online: https://chart-studio.plotly.com (accessed on 1 September 2023).
  43. Cartigny, P.; Busigny, V. Nitrogen isotopes. In Encyclopedia of Geochemistry: A Comprehensive Reference Source on the Chemistry of the Earth; White, W.M., Ed.; Springer: Cham, Switzerland, 2018; pp. 991–1003. [Google Scholar]
  44. Alegria, C.; Antunes, C.; Giovanetti, M.; Abreu, M.; Máguas, C. Acorn Isotopic Composition: A New Promising Tool for Authenticity Maps of Montado’s High-Value Food Products. Molecules 2020, 25, 1535. [Google Scholar] [CrossRef]
  45. Bateman, S.A.; Kelly, S.D. Fertilizer nitrogen isotope signatures. Isot. Environ. Health Stud. 2007, 43, 237–247. [Google Scholar] [CrossRef]
  46. Muñoz-Redondo, J.M.; Montenegro, J.C.; Moreno-Rojas, J.M. Using Nitrogen Stable Isotopes to Authenticate Organically and Conventionally Grown Vegetables: A New Tracking Framework. Agronomy 2023, 13, 131. [Google Scholar] [CrossRef]
  47. Petersen, S.O.; Lind, A.M.; Sommer, S.G. Nitrogen and organic matter losses during storage of cattle and pig manure. J. Agric. Sci. 1998, 130, 69–79. [Google Scholar] [CrossRef]
  48. Thornton, B.; Martin, G.; Procee, M.; Miller, D.R.; Coull, M.; Yao, H.; Chapman, S.J.; Hudson, G.; Midwood, A.J. Distributions of carbon and nitrogen isotopes in Scotland’s topsoil: A national-scale study. Eur. J. Soil Sci. 2015, 66, 1002–1011. [Google Scholar] [CrossRef]
  49. Renoirt, M.; Angelier, F.; Cheron, M.; Bustamante, P.; Cherel, Y.; Brischoux, F. Stable isotopes of a terrestrial amphibian illustrate fertilizer-related nitrogen enrichment of food webs in agricultural habitats. Agric. Ecosyst. Environ. 2021, 319, 107553. [Google Scholar] [CrossRef]
  50. Rixen, C.; Stoeckli, V.; Ammann, W. Does artificial snow production affect soil and vegetation of ski pistes? Perspect. Plant Ecol. Evol. Syst. 2003, 5, 219–230. [Google Scholar] [CrossRef]
  51. Aalberg, J. Guidelines Salting of Cross-Country Ski Courses; International Ski Federation: Oberhofen, Switzerland, 2015; Available online: https://assets.fis-ski.com/image/upload/fis-prod/assets/Guidelines_for_Salting_of_Ski_Courses_Cross-Country.pdf (accessed on 20 July 2022).
  52. Yu, Y.; Wu, Y.; Song, Y.; Li, Y. Carbon and Nitrogen Stable Isotope Abundance and Soil Stoichiometry of Zanthoxylum planispinum var. dintanensis Plantations of Different Ages. Agronomy 2022, 12, 1248. [Google Scholar] [CrossRef]
  53. Makarov, M.I. The nitrogen isotopic composition in soils and plants: Its use in environmental studies (A Review). Eurasian Soil Sci. 2009, 42, 1335–1347. [Google Scholar] [CrossRef]
  54. Liu, Y.; Liu, Z.; Xiong, K.; Li, Y.; Lyu, X.; Cai, L. Carbon Nitrogen Isotope Coupling of Soils and Seasonal Variation Characteristics in a Small Karst Watershed in Southern China. Land 2023, 12, 501. [Google Scholar] [CrossRef]
  55. Brearley, F.Q. Nitrogen stable isotopes indicate differences in nitrogen cycling between two contrasting Jamaican montane forests. Plant Soil 2013, 367, 465–476. [Google Scholar] [CrossRef]
  56. Amundson, R.; Austin, A.T.; Schuur, E.A.G.; Yoo, K.; Matzek, V.; Kendall, C.; Uebersax, A.; Brenner, D.; Baisden, W.T. Global patterns of the isotopic composition of soil and plant nitrogen. Glob. Biogeochem. Cycles 2003, 17, 1031. [Google Scholar] [CrossRef]
  57. Martínez-Dalmau, J.; Berbel, J.; Ordóñez-Fernández, R. Nitrogen Fertilization. A Review of the Risks Associated with the Inefficiency of Its Use and Policy Responses. Sustainability 2021, 13, 5625. [Google Scholar] [CrossRef]
  58. Zhang, L.; Zhang, W.-S.; Meng, Q.-F.; Hu, Y.-C.; Schmidhalter, U.; Zhong, C.-H.; Zou, G.-Y.; Chen, X.-P. Optimizing Agronomic, Environmental, Health and Economic Performances in Summer Maize Production through Fertilizer Nitrogen Management Strategies. Plants 2023, 12, 1490. [Google Scholar] [CrossRef]
Figure 1. Geographic position of the 11 sampling locations (L1–L11).
Sustainability 15 16174 g001
Figure 2. Mean nitrogen isotopic values (δ15N) according to different land use. CP—crop production; AO—apple orchard; F—forest; M—meadow; CR—city road; SS—ski slope.
Sustainability 15 16174 g002
Figure 3. Relationship between factors 1 and 2: (A) variables, (B) cases. CP—crop production; AO—apple orchard; F—forest; M—meadow; CR—city road; SS—ski slope.
Sustainability 15 16174 g003aSustainability 15 16174 g003b
Table 1. Weather conditions at selected locations—averages from 2000 to 2020.
LocationMAT, °CMAP, mm
L1Vukovar12.0685.8
L2Potok12.2954.7
L3Molve11.3815.3
L4Zagreb12.2867.3
L5Zumberak9.31229.8
L6Lepoglava11.4891.4
L7Karlovac11.51135.5
L8Gospic10.11379.5
L9Vodnjan15.2874.3
L10Pag16.21111.9
L11Mljet17.2875.9
MAT—mean annual temperature; MAP—mean annual precipitation.
Table 2. Site and soil sample descriptions.
LocationSampling YearSoil Type *Land UseNitrogen Fertilization **Sample ID
L1Vukovar2016Calcic ChernozemCrop production0CP_N0_L1
2016180CP_N180_L1
2015150CP_N150_L1
L2Potok2016Dystric StagnosolCrop production0CP_N0_L2
2016150CP_N150_L2
2020180CP_N180_L2
L3Molve2019Dystric RegosolCrop productionUnknownCP1_L3
2019Gleyic StagnosolMeadow-M1_L3
2019Stagnic GleysolMeadow-M2_L3
2019VertisolMeadow-M3_L3
2019Dystric AnthrosolCrop productionUnknownCP2_L3
L4Zagreb—C2019Humic LeptosolsCity road-CR1_L4
2019City road-CR2_L4
2019City road-CR3_L4
Zagreb—M2015Dystric CambisolForest-F_L4
2015Ski slope-SS_L4
L5Zumberak2016Regi-hortic AnthrosolsApple orchardUnknownAO_L5
L6Lepoglava2009Dystric CambisolCrop production0CP_N0_L6
2009200CP_N200_L6
L7Karlovac2020Dystric CambisolMeadow-M1_L7
2020-M2_L7
L8Gospic2005Dystric CambisolCrop production0CP_N0_L8
2005105CP_N105_L8
2005SM 30 ***CP_SM_L8
L9Vodnjan2020Rhodic LixisolCrop production150 + VCCP_N150VC_L9
L10Pag2015Rendzic LeptosolsForest-F_L10
L11Mljet2016Humic LeptosolsForest-F_L11
* Soils according to [36]; Zagreb—C: city; Zagreb—M: Medvednica Nature Park; VC—vermicompost. ** Nitrogen fertilization: mineral fertilization in kg ha−1; *** SM 30—solid manure 30 t/ha.
Table 3. Soil chemical properties.
LocationSample IDpHKClTN,
%
TC,
%
CN
Ratio
P2O5,
mg kg−1
K2O,
mg kg−1
L1VukovarCP_N0_L16.950.4511.864.1143.0190.0
CP_N180_L16.750.5051.803.6284.0238.0
CP_N150_L17.280.1411.6611.8214.0265.0
L2PotokCP_N0_L24.040.1911.015.3203.0273.0
CP_N150_L23.820.2110.994.7188.0280.0
CP_N180_L24.530.2381.184.911.0188.0
L3MolveCP1_L34.800.6927.2210.416.0218.0
M1_L34.700.3474.0211.655.0200.0
M2_L34.760.5315.4610.340.0204.0
M3_L34.830.98310.610.722.0240.0
CP2_L37.450.0771.2316.0262.0361.0
L4Zagreb—CCR1_L47.570.3236.3519.6113.0160.0
CR2_L47.430.2834.2515.0410.0207.0
CR3_L47.700.2337.4531.987.0185.0
Zagreb—MF_L45.160.4496.3214.144.0421.0
SS_L47.070.2284.5620.0135.0289.0
L5ZumberakAO_L55.480.2612.318.9113.0160.0
L6LepoglavaCP_N0_L65.580.1371.3810.1602.0207.0
CP_N200_L65.520.1391.4310.387.0185.0
L7KarlovacM1_L74.050.3305.2916.016.0218.0
M2_L74.250.2422.7411.355.0200.0
L8GospicCP_N0_L83.980.3162.578.140.0204.0
CP_N105_L83.760.3933.148.022.0240.0
CP_SM_L84.150.4462.936.6262.0361.0
L9VodnjanCP_N150VC_L97.430.1673.2219.373.0243.0
L10PagF_L107.280.2866.6423.2106.0209.0
L11MljetF_L117.050.3436.2318.2116.0192.0
Table 4. Variability of δ15N abundance in soil according to land use and locations.
Sampleδ15N ± SD (‰) Sampleδ15N ± SD (‰)
Arable land/Crop productionCP_N0_L16.22 ± 0.07MeadowM1_L32.50 ± 0.10
CP_N180_L16.28 ± 0.06
CP_N150_L14.99 ± 0.09M2_L34.00 ± 0.10
CP_N0_L26.38 ± 0.04M3_L33.20 ± 0.10
CP_N150_L26.59 ± 0.03M1_L74.25 ± 0.02
CP_N180_L26.15 ± 0.12M2_L74.61 ± 0.06
CP1_L34.00 ± 0.10ForestF_L40.00 ± 0.10
CP2_L36.20 ± 0.10
CP_N0_L66.24 ± 0.13F_L103.24 ± 0.08
CP_N200_L66.11 ± 0.09F_L113.22 ± 0.07
CP_N0_L84.57 ± 0.03City roadCR1_L44.60 ± 0.10
CP_N105_L83.81 ± 0.17
CP_SM_L84.56 ± 0.10CR2_L44.50 ± 0.10
CP_N150VC_L97.19 ± 0.07CR3_L43.90 ± 0.10
OrchardAO_L55.60 ± 0.10Ski slopeSS_L42.20 ± 0.10
Disclaimer/Publisher’s Note: The statements, opinions and data contained in all publications are solely those of the individual author(s) and contributor(s) and not of MDPI and/or the editor(s). MDPI and/or the editor(s) disclaim responsibility for any injury to people or property resulting from any ideas, methods, instructions or products referred to in the content.

