Abstract
Agriculture is a vulnerable sector to climate change due to its sensitivity to weather conditions. Changes in climatic parameters such as temperature and precipitation significantly affect productivity as well as the consumption of natural resources like water to meet irrigation water needs. There has been a large amount of research on regional climate change. However, this study placed specific crops at first place and considered their irrigation water needs that will arise due to evapotranspiration increase. The aim of this study was to estimate the future irrigation water needs of wheat, cotton, and alfalfa in the east part of Thessaly Plain in central Greece, where Lake Karla, a recently restored lake, is located. The Weather Research and Forecasting (WRF) model was applied as a high-resolution regional climate model to simulate temperature and precipitation for two 5-year periods, namely 2046–2050 (future period) and 2006–2010 (reference period). Simulations refer to the RCP8.5 emission scenario (worst-case). A methodology proposed by the Food and Agriculture Organization (FAO) of the United Nations was followed to estimate the reference crop evapotranspiration, the crop evapotranspiration based on each crop factor, which was determined for each crop, the effective rainfall, and finally, the irrigation water needs for each crop, for the two 5-year periods. Based on WRF simulations, temperature was projected to be 1.1 °C higher in the future period compared to the reference period, while precipitation and effective precipitation were projected to decrease by 32% and 45%, respectively. Based on the WRF projections, by 2025, the irrigation water needs of wheat and alfalfa are expected to increase by more than 16% and more than 11%, respectively, while irrigation water needs of cotton are expected to increase by 7%. An extension of wheat’s irrigation period for one month (i.e., December) was also identified. Good practices that could be applied in the frame of precision agriculture principles in order to save irrigation water were suggested. The results of this study could be exploited by water resources and land use managers when planning short and long-term strategies to adapt to climate change impacts.
1. Introduction
Agriculture is a sector significantly affected by climate change due to its dependence on weather conditions. Climate change induces various effects on agriculture that include loss of arable land, shortening of growing seasons, the viability of certain crops, and reduction in water reserves, which are related to serious economic and social issues (increase in prices, changes in the trade balance between different countries, food security, etc.) (e.g., [1,2]). One of the most important impacts of climate change on agriculture is the increase in water consumption to meet irrigation water needs. This is mainly expected due to the reduction in effective precipitation and due to the temperature rise that will trigger an increase in crop evapotranspiration. A potential reduction in water availability to the plant can lead to water stress, reduced photosynthetic activity, and reduced nutrient absorption (e.g., [3,4]).
Temperature and precipitation are factors that regulate and strongly affect agriculture. Although temperature is expected to increase on a global scale (but at a different rate), precipitation presents a significant variability from place to place. Globally, temperature has already reached ~1 °C increase compared to the pre-industrial levels, while it is expected to reach +1.5–+5 °C by the end of the current century, depending on the emissions scenario and policies that governments of the world will follow [5]. In addition, annual precipitation seems to decrease over mid-latitude areas, increasing though over higher latitudes [6]. Focusing on the Mediterranean, climate models estimate an increase of temperature by 1–6 °C (depending on the emissions scenario), with Greece being in the region with the highest temperature increases. Regarding precipitation, models agree on a decrease of up to −50% by the end of the century under RCP8.5. In Greece, precipitation decrease is estimated to be up to −10 to −30% [7], with maximum decrease being expected in spring and summer [8]. It is also highly important that agricultural droughts (thus droughts that are able to affect soil moisture and agricultural production) may extend by 2100 from 2 to 7 months depending on the area of the Mediterranean and emissions scenario, with Greece being ranked in the countries with the most prolonged drought periods during a year [9].
Such a change in climate has already significantly affected crops in Greece, and it is estimated that some crops may be in danger in the future. A literature review was performed on the quantity and quality aspects of water resources in Greece for each water body, focusing on water relation effects (aridity/drought, floods, and soil erosion by water) [10]. This review stated that water resources are under pressure in Greece due to the current and future climatic conditions and due to the intense agricultural and tourist activities that are taking place in the country. According to its findings, the region of Thessaly, which is the target region of the present study, is expected to be among the most affected by climate-water impacts in Greek regions, exhibiting reduced crop yields, greater risk of droughts and floods, agricultural land losses, declining water availability and degraded water resources (surface and groundwater). Regarding future crop yields specifically, in Thessaly and generally in Greece, some studies have been conducted that estimated that crop yields may increase or decrease in the near future (2021–2050 vs. 1961–1990 period) according to the assumptions made in each study, for example, if irrigation water supply will continue to be available despite the reduction in precipitation which will probably have adverse impacts on groundwater replenishment and consequently on the supply of irrigation water [11], or according to the applied climate model [12]. It is worth reminding that climate change is also related to significant socioeconomic issues. The potential trends of main socioeconomic factors through which climate change will affect agricultural production and international trade patterns were assessed [13]. This study showed that global food production, welfare, and gross domestic product are projected to fall by 2050 under the scenarios that they examined, while higher food prices are expected.
This study focused on the greater agricultural area around Lake Karla, which is located in the eastern part of Thessaly Plain (details are provided in Section 2.1 below). The management of irrigation water and land use is crucial for the sustainable growth of the greater area around the lake. Some studies have been conducted for these purposes. An optimization method was applied to evaluate the optimum volume of water that can be extracted from the aquifer and the optimum position of the irrigation wells, taking into consideration, among others, the climate change forcing for the year 2044 [14]. A similar approach was followed to evaluate the water deficit of the Lake Karla watershed for the years 2050 and 2100 [15]. Simulations of the nutrient flow dynamics in the lake when it was under restoration were performed [16] using PCLake model [17] and investigated the interrelations of nutrient cycling and trophic state. An attempt was made to propose policy measures for agricultural water saving and cost-effectiveness by testing different scenarios focusing on the technical, agronomic, and economic efficiency of applied irrigation and agricultural practices [18]. A holistic hydro-economic framework for sustainable water resources management was presented and examined under various management, climate, and pricing scenarios [19]. However, none of the studies presented above examined the impact of climate change on future irrigation water needs in the area, placing crops in the first place and considering the irrigation water needs of specific crops that will arise due to evapotranspiration increase. The latter was the special scope of this study.
The present study aimed to exploit future climate projections in order to estimate quantitatively the change in irrigation water needs that are expected to occur in the future in Thessaly Plain, Greece, and propose good practices in the frame of precision agriculture principles. This information could be exploited by water resources and land use managers when planning adaptation measures to handle efficiently climate change impacts.
2. Materials and Methods
2.1. Study Area
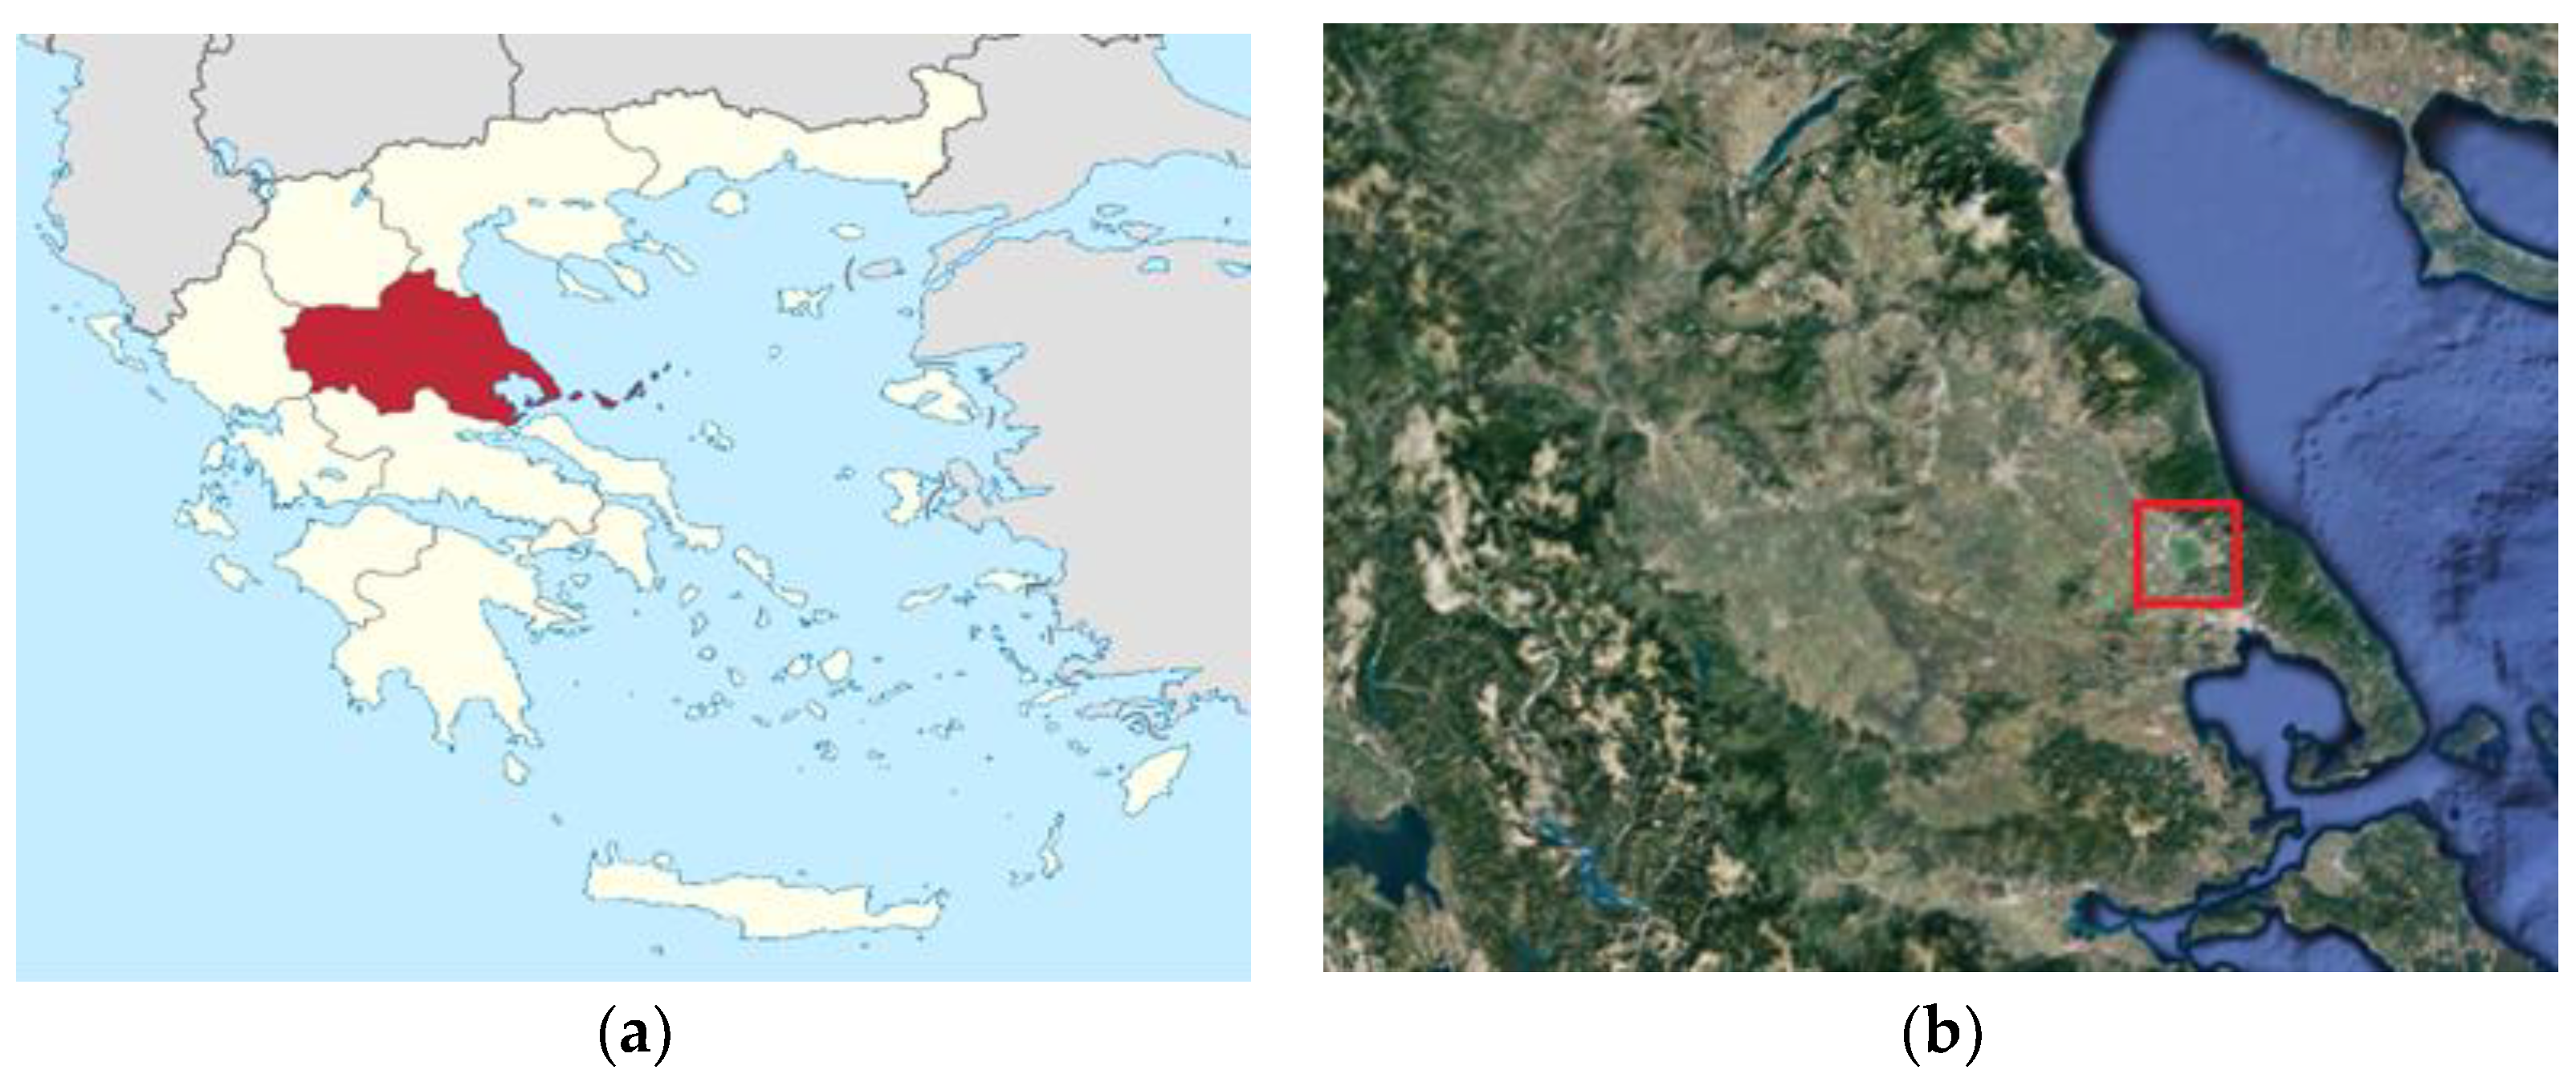
The Thessaly region is located in central Greece (Figure 1a). Its dominant geographical feature is its plain. Thessaly Plain is formed by the Pinios River and its tributaries and is surrounded by mountains (Figure 1b). It is an extremely fertile area, and a variety of crops are cultivated there. Irrigation accounts for more than 90% of the water consumption in the Thessaly region [10]. This study focuses on the greater agricultural area around Lake Karla, which is located in the eastern part of the Thessaly plain (Figure 1b). The soil type in the study area is characterized as naturally drained alluvion and marshy soil with solonetz and solonchak in the depression with a high level of groundwater, as mentioned in the soil map of Thessaly that is provided by EU JRC ESDAC [20]. Indicative values for bulk density and pH are 1.32 ± 0.10 g·cm−3 and 7.6 ± 0.4 [21]. The average cultivated area is about 25 acres [22]. Lake Karla was completely drained in 1962 to reclaim land for agriculture. However, this decision turned out to be a wrong choice, as agriculture was never successful in the saline soils of the former lake bed. Therefore, the local population and politicians proposed the restoration of approximately 40 km2 of the surface of the former lake (approximately 180 km2). This ambitious project, which is unique to the Balkans and Europe and is characterized by various environmental and economic benefits, finished in 2018 and was financially supported by the European Commission [23].
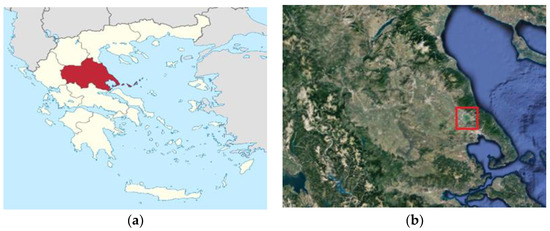
Figure 1.
(a) Location of Thessaly region (Wikipedia); (b) Geophysical map of Thessaly (Google Earth). The dark green area inside the red square indicates Lake Karla.
2.2. The Weather Research and Forecasting (WRF) Model
The Weather Research and Forecasting (WRF) Model is a state-of-the-art mesoscale numerical weather prediction system designed for both atmospheric research and operational forecasting applications. The WRF model uses a variety of physics schemes (microphysics, cumulus physics, planetary boundary and surface layer parameterizations, land surface physics, and short-wave and long-wave radiation) in order to simulate in detail processes that take part between the atmosphere and Earth. Each category has multiple options varying from simple and efficient to more sophisticated and computationally costly. Additionally, land cover is required as input information. Moreover, greenhouse gas emissions scenarios are considered in order to define the boundary conditions. Past studies used the WRF model to investigate the impacts of meteorological and climatological conditions on agriculture [24,25,26].
2.3. Model Setup, Evaluation, and Used Datasets
The WRF model was used as a high-resolution regional climate model in this study. The model has been applied and validated in several climate studies (e.g., [27,28,29]). Simulated future temperature and precipitation values with spatial resolution of 10 × 10 km and temporal resolution of 3 h that were produced in the frame of [29] were exploited in this study. The future period refers to the 5-year period 2046–2050, while the 5-year period 2006–2010 is considered as a reference period. Simulated values referring to the model’s cell that corresponds approximately to the red square area in Figure 1b were exploited in this study. Simulated values refer to the 8.5 Representative Concentration Pathway (RCP8.5). RCP8.5 is a popular emission scenario representing the worst-case scenario, as emissions are considered to continue rising throughout the 21st century under it [30]. Detailed information about the model’s setup (domains, physics schemes, land use, boundary conditions, etc.) is provided by [29].
The ability of the model to predict near-surface air temperature has been evaluated by [29]. However, the capability of the model to predict monthly temperature and precipitation values referring to the model’s cell that was used in this study was further evaluated in this study. The simulated values for the reference period were evaluated against a Typical Meteorological Year (TMY) that has been recently produced by exploiting data recorded by an automated meteorological station operated in the area by the Laboratory of Agricultural Constructions and Environmental Control of the University of Thessaly. The station is located in Velestino (22°45′ E–39°24′ N), in an agricultural area that is included in the red square marked in Figure 1b. The methodology proposed by [31] was followed to produce the TMY. The model performance was evaluated by means of three statistical indices, namely bias (BIAS) [32], mean absolute error (MAE) [32], and index of agreement (IOA) [33].
2.4. Estimation of Irrigation Water Needs
Irrigation water needs of specific crops were estimated for both periods (future and reference) by following a methodology proposed by the Food and Agriculture Organization (FAO) of the United Nations. Three cultivations popular in the area (i.e., wheat, cotton, alfalfa) were examined. It is worth mentioning that wheat and cotton occupy more than 70% of the cultivated land in the Thessaly region.
FAO’s methodology consists of specific steps: (a) estimation of the reference crop evapotranspiration, (b) estimation of crop evapotranspiration of each examined crop based on the corresponding crop factor, (c) estimation of the effective rainfall, and finally (d) estimation of the irrigation water needs of each examined crop. The methodology is briefly presented below, while detailed information can be found in [34].
2.4.1. Estimation of the Reference Crop Evapotranspiration
The Blaney—Criddle method (Equation (1)) was used to calculate the reference crop evapotranspiration ETo for each month. In Equation (1), ETo is the reference crop evapotranspiration (mm/day) as an average for a month, Tmean is the mean temperature of the month (°C), and p is the mean daily percentage of annual daytime hours for the month for a specific latitude.
ETo = p · (0.46 · Tmean + 8)
It is worth mentioning here that the aim of this study was to estimate quantitatively the change in irrigation water needs that are expected to occur in the future on a monthly basis, or even better on an annual basis, as the simulations of future temperature and precipitation values that were produced using the WRF model provides the possibility to make efficient estimates on such temporal bases. Therefore, a simple and easy-to-use method was chosen to calculate ETo instead of a more accurate but more data-demanding method [35].
2.4.2. Estimation of Crop Evapotranspiration of Each Examined Crop Based on the Corresponding Crop Factor
Crop evapotranspiration ETcrop for each month was calculated using Equation (2), in which ETcrop is the crop’s evapotranspiration (mm/month), Kc is the crop factor of the month to which ETcrop refers, ETo is the reference evapotranspiration (mm/day), and D is the number of days of the month to which ETcrop refers.
ETcrop = Kc · ETo · D
The total length of the growing season and the lengths of the various growth stages (i.e., initial stage, crop development stage, mid-season stage, late season stage) for wheat and cotton were defined and were used to determine the crop factor Kc for each crop for each month. A special procedure based on prevailing climate conditions was followed to determine the crop factor Kc for alfalfa for each month, as proposed by FAO [34].
2.4.3. Estimation of the Effective Rainfall
Effective rainfall is defined as the fraction of the total amount of rainwater that is retained in the root zone of a plant and is available to the plant to cover its irrigation water needs. The effective rainfall equals the total rainfall minus runoff, minus evaporation, minus deep percolation. The effective rainfall Pe for each month was calculated using Equations (3) and (4), in which Pe is the effective rainfall or effective precipitation (mm/month) and P is the rainfall or precipitation (mm/month). Equations (3) and (4) were proposed by FAO [34] to be applied in areas with a maximum slope of 4–5%, which is a condition that is fulfilled in the study area.
Pe = 0.8 · P − 25 when P ≥ 75 mm/month
Pe = 0.6 · P − 10 when P ≤ 75 mm/month
2.4.4. Estimation of the Irrigation Water Needs for Each Crop
The irrigation water needs of a crop can be covered by rainfall, by irrigation, or by a combination of irrigation and rainfall. Irrigation water needs (IN) equal zero (IN = 0) when all the water needed for the optimal growth of the crop is provided by rainfall (in these cases: Pe > ETcrop). Monthly IN is calculated by Equation (5) when all water has to be supplied to the crop by irrigation in cases where there is no rainfall at all during the growing season (in these cases: Pe = 0). In most cases, when part of the crop water needs is supplied by rainfall, and the remaining part is supplied by irrigation (in these cases: Pe < ETcrop), monthly IN are calculated by Equation (6).
IN = ETcrop
IN = ETcrop − Pe
2.5. Software Used
Statistical analysis was performed using Microsoft Excel 2013, while figures were produced using Golden Software Grapher 8.
3. Results and Discussion
3.1. Model Evaluation
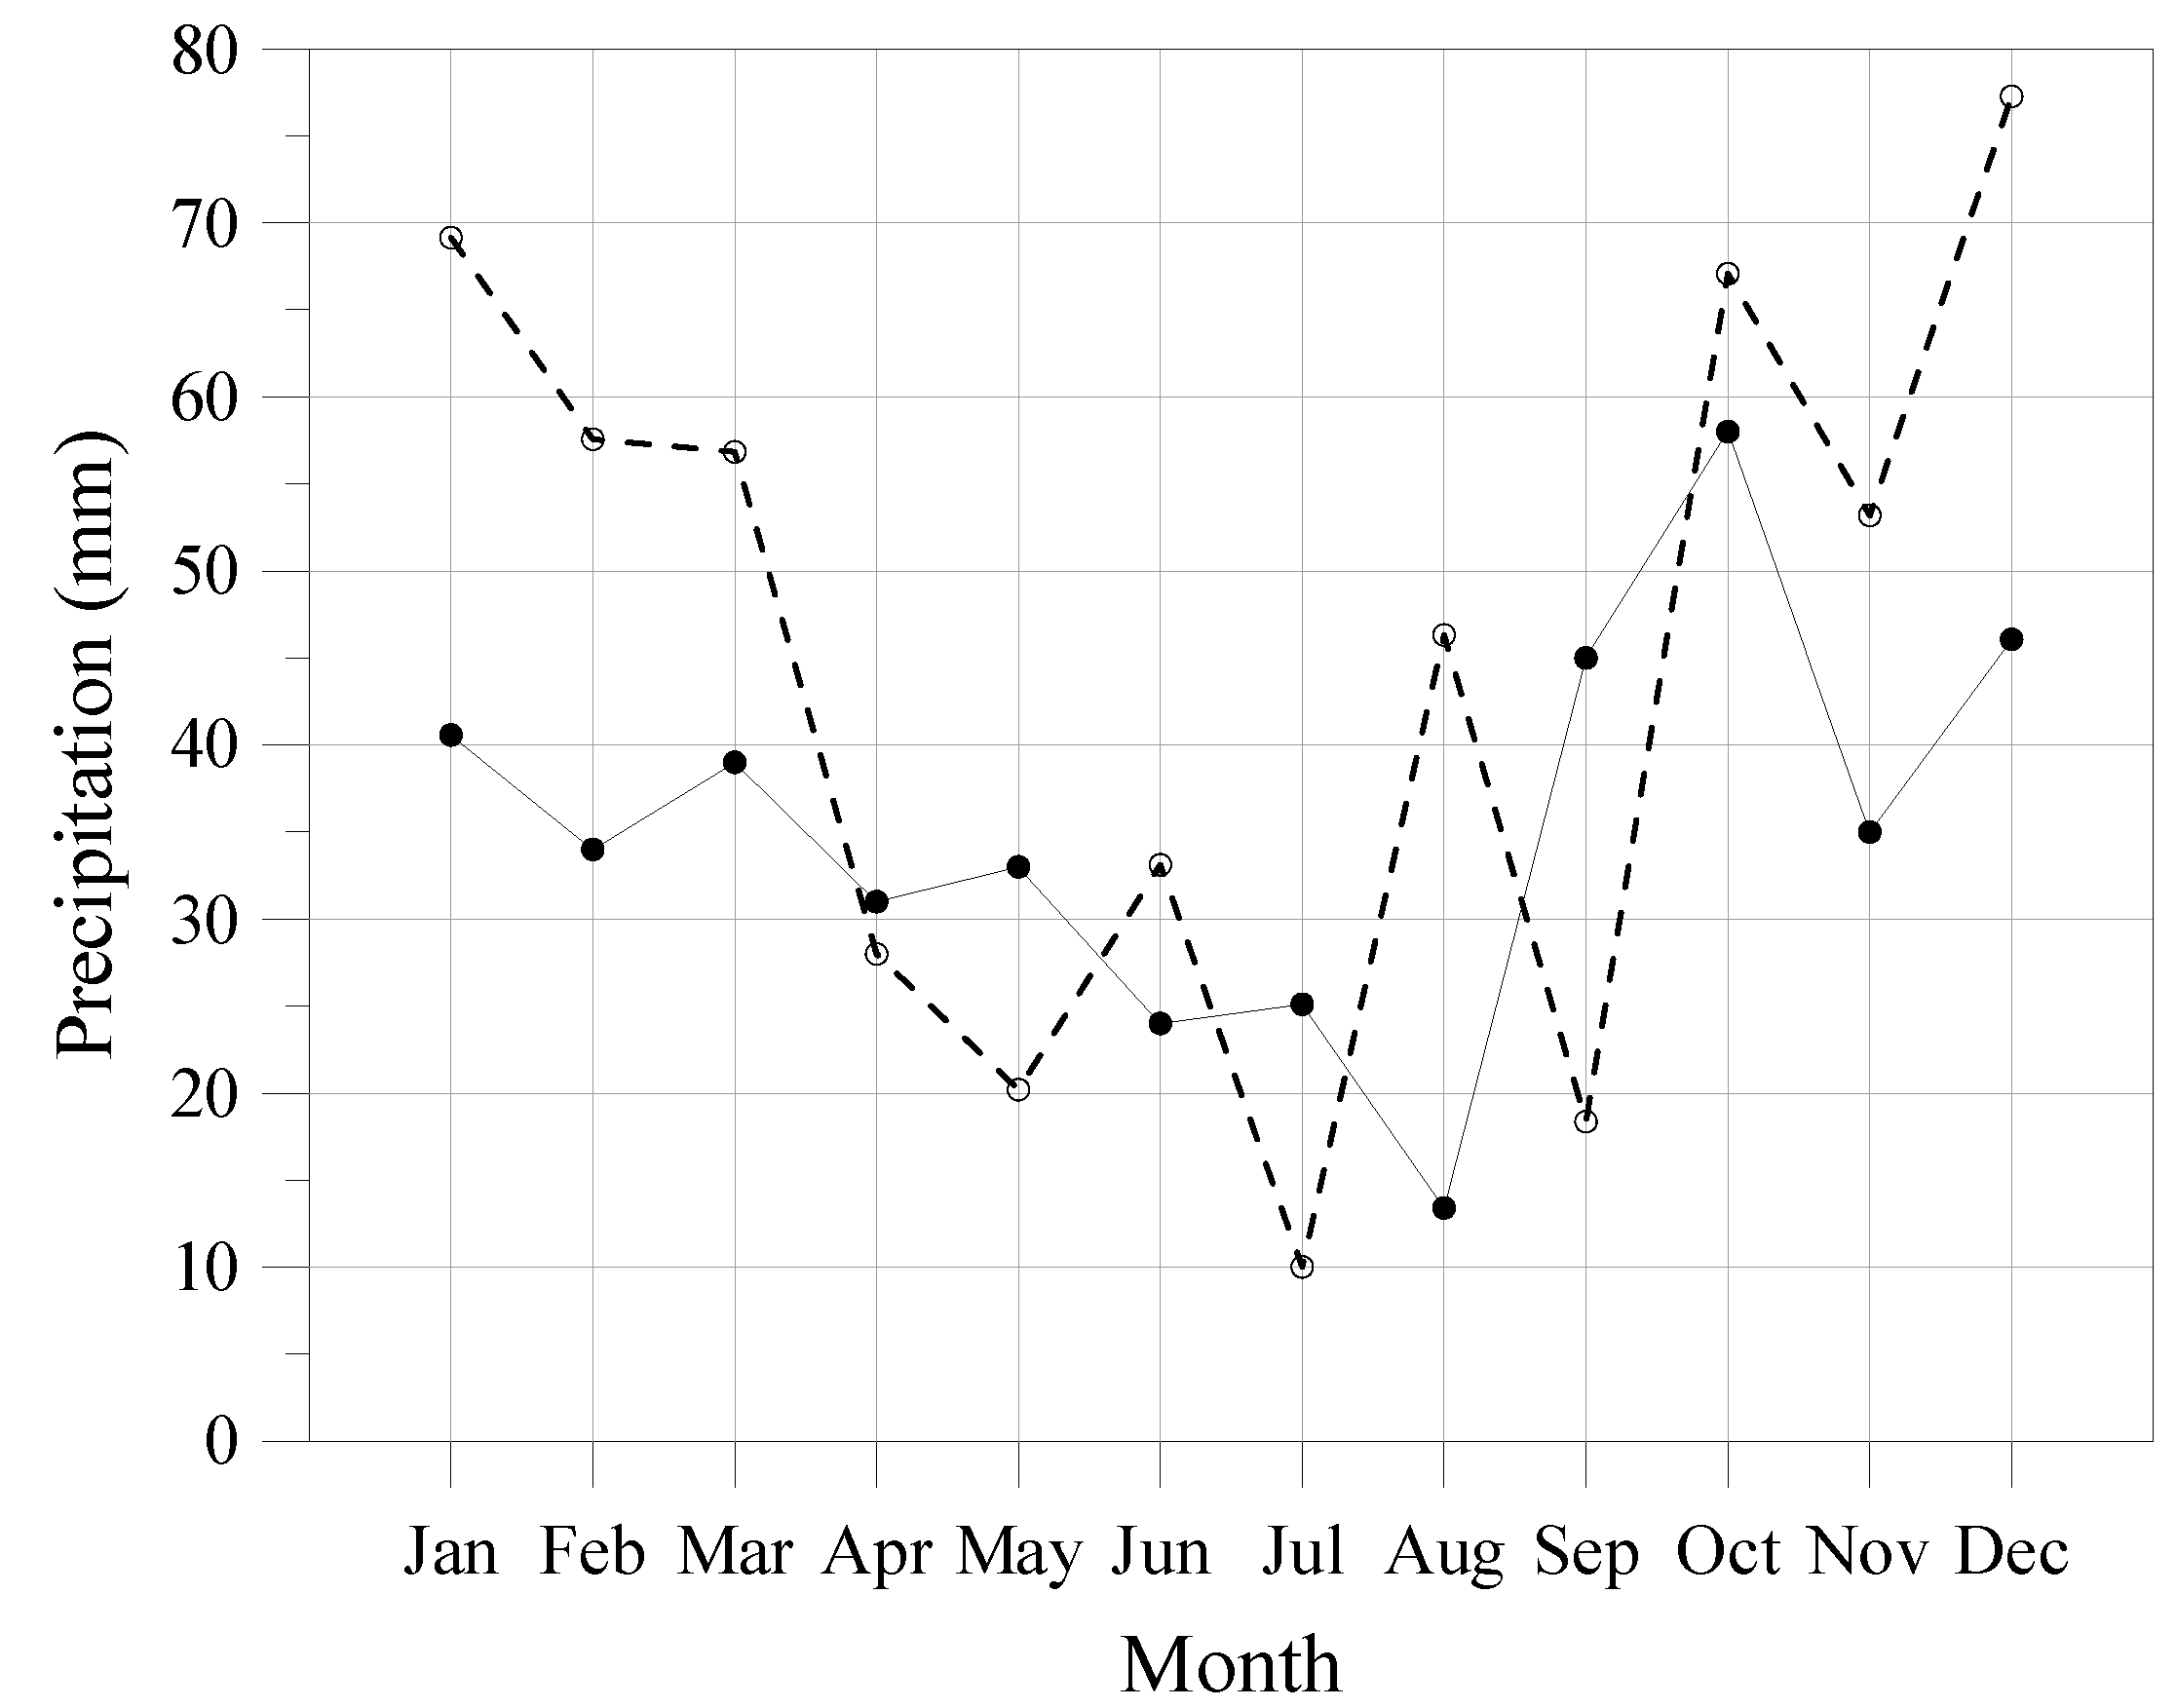
Figure 2 and Figure 3 present simulated values for the reference period and values referring to the TMY. Figure 2 presents the monthly average value of temperature, while Figure 3 presents the monthly total precipitation. Table 1 presents the values of the three statistical indices applied to evaluate the performance of the model. Figure 2 and Table 1 reveal that the model was able to reproduce accurately the observed monthly variation of temperature. However, Figure 3 shows that the performance of the model was weaker for precipitation. As the aim of this study was to exploit future climate projections in order to estimate quantitatively the change in irrigation water needs of three specific cultivations that are expected to occur in the future in Thessaly Plain, the performance of the model for precipitation was examined during the growing period of the three cultivations (Table 2 and Table 3). MAE values were relatively high for the three examined periods, while IOA values ranged between 0.467 and 0.640 (Table 1). Table 1 also reveals that the model overestimated monthly precipitation during the growing period of alfalfa (i.e., January to December) and wheat (January to May and December), as MBE values were positive. On the contrary, the model slightly underestimated monthly precipitation during the growing period of cotton (April to October), as the MBE value was slightly less than 0 °C.
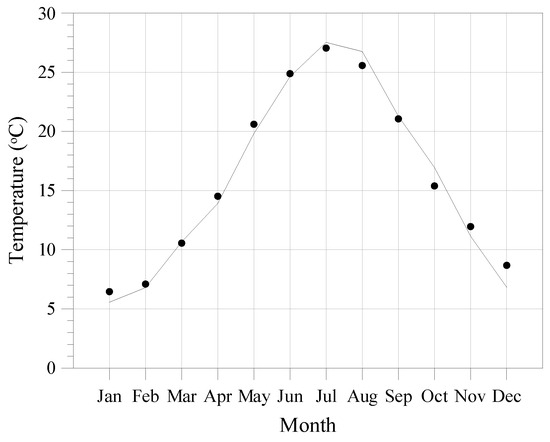
Figure 2.
Monthly average value of temperature. Solid line: simulated values for the reference period; black circles: values referring to the TMY.
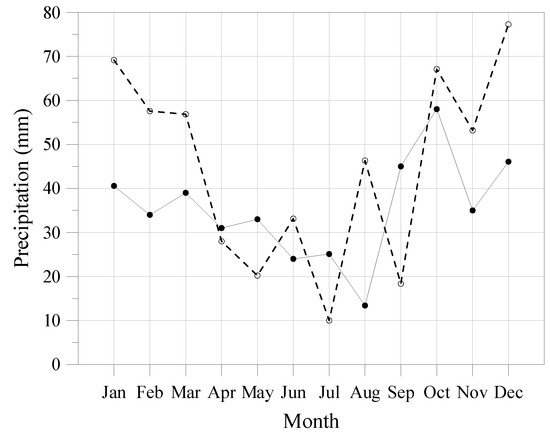
Figure 3.
Monthly total precipitation. Solid line with black circles: simulated values for the reference period; dashed line with white circles: values referring to the TMY.

Table 1.
Performance statistics for the evaluation of the model.
3.2. Description of Future Climate Conditions
Simulated temperature and precipitation data were processed in order to produce an indicative future year and an indicative reference year. Specifically, the indicative future year refers to the 5-year period 2046–2050 and includes 3 h values that are equal to the average of the corresponding 3 h values of each one of the five years included. The same applies for the indicative reference year but for the 5-year period 2006–2010.
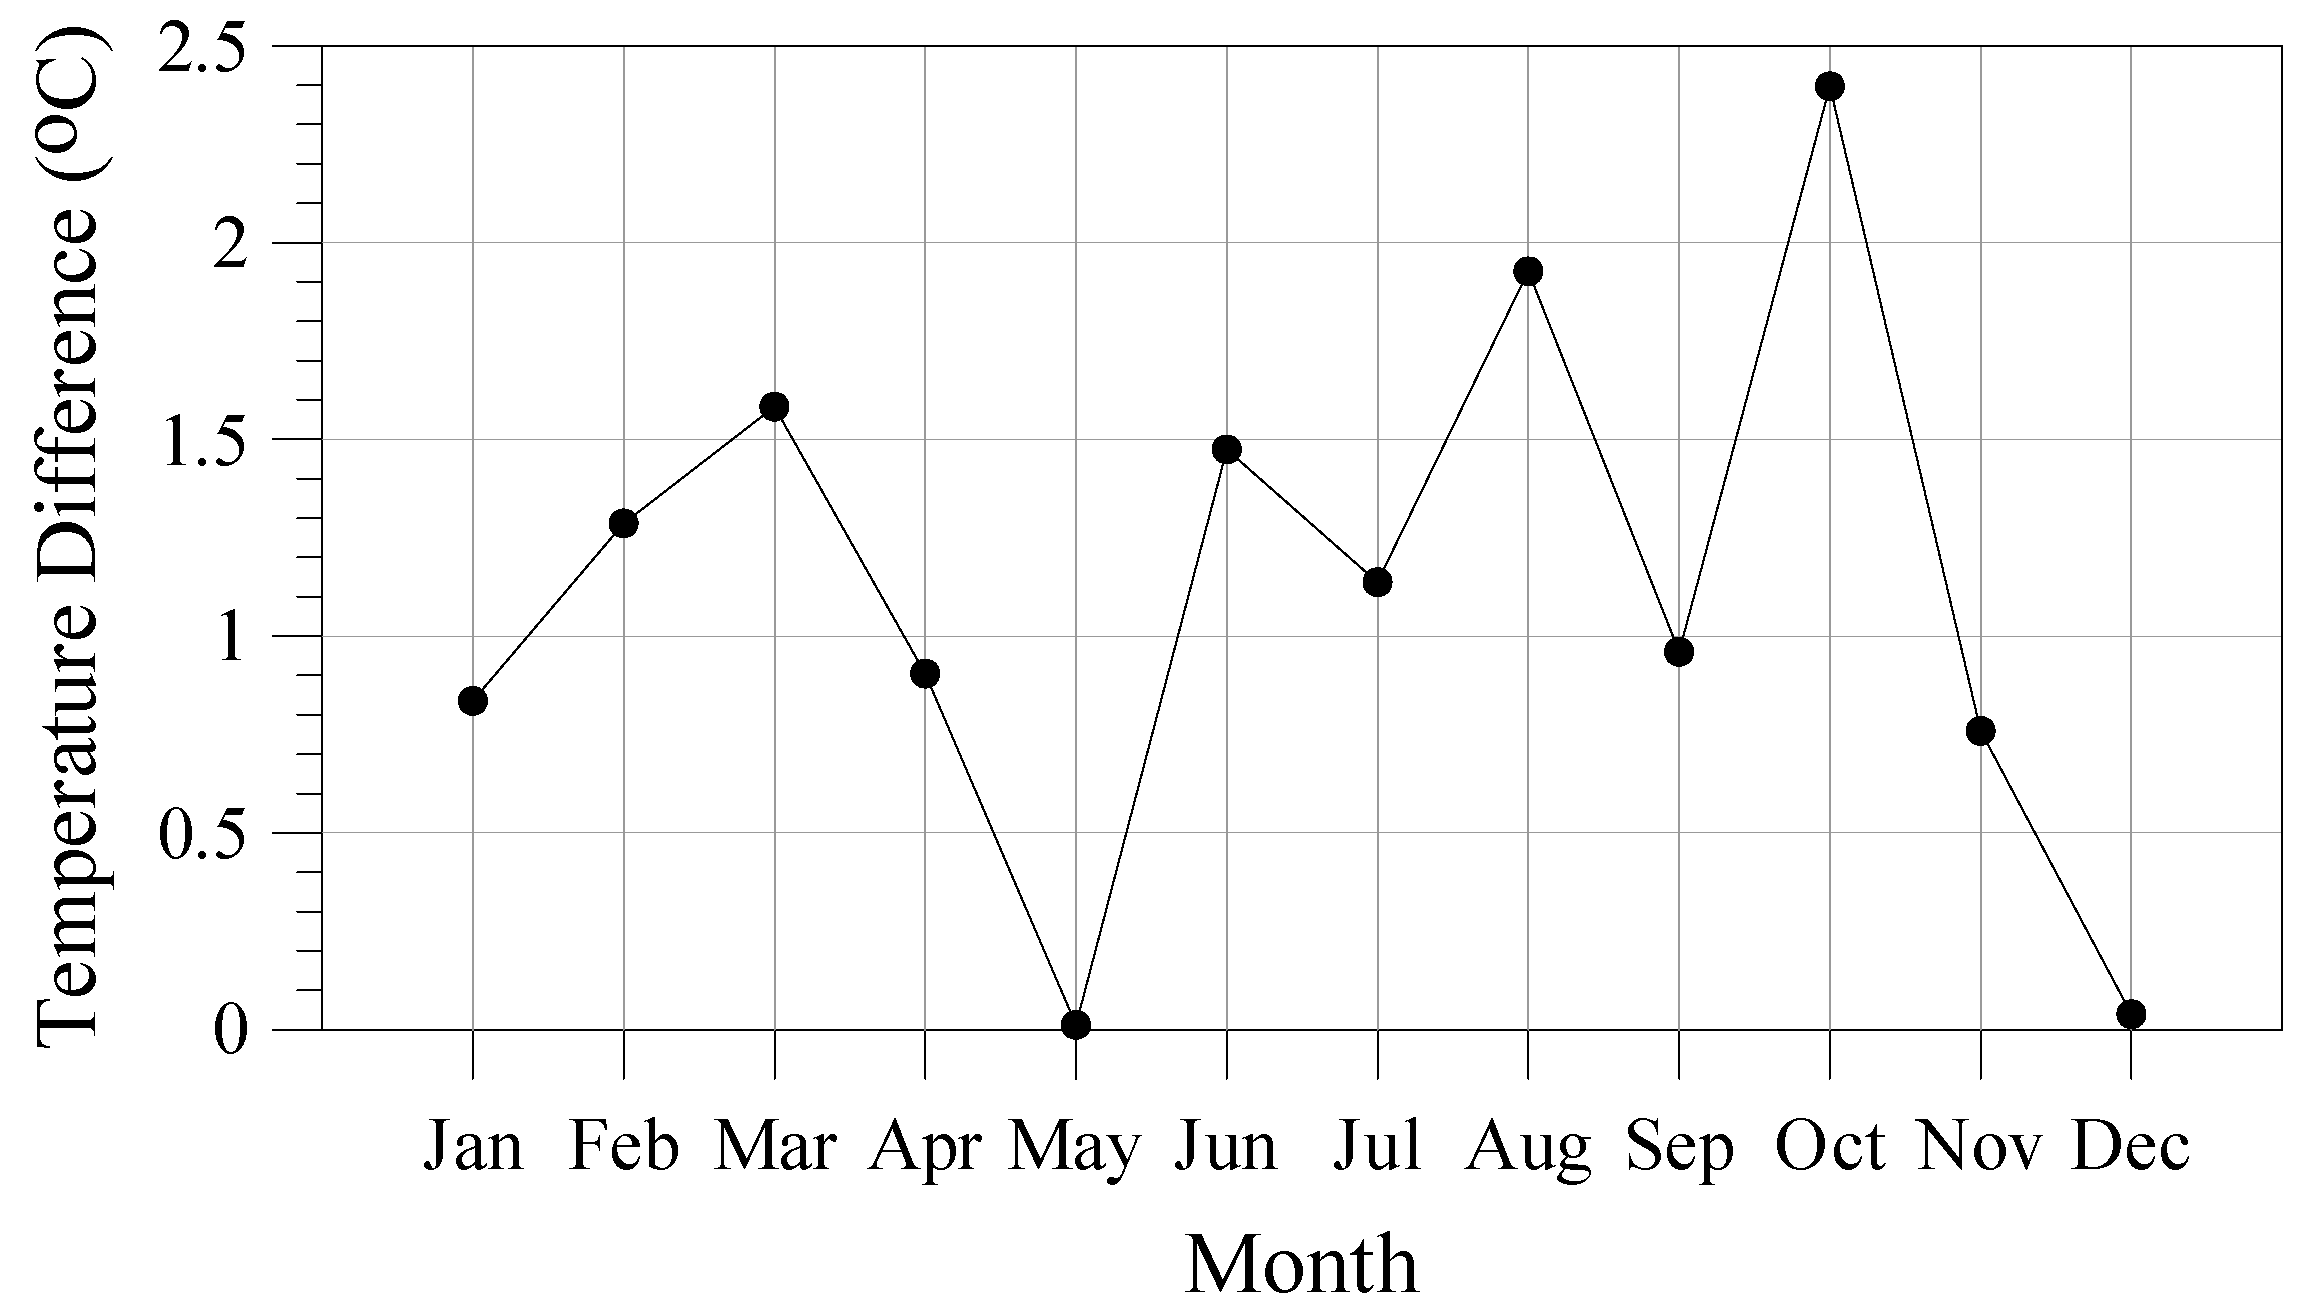
Figure 4 shows the differences in the monthly average values of temperature between the indicative future and the indicative reference year. All differences were positive, a fact that shows that the mean temperature of all months is expected to rise during the future period compared to the reference period. The analysis of the differences in the 3 h temperature values that were included in the two indicative years revealed that 74% of them were positive, while the rest, 26%, were negative. Overall, the average of the values of temperature that were included in the indicative future year was found to be 1.1 °C higher than the corresponding average for the indicative reference year.

Figure 4.
Differences in the monthly average values of temperature between the indicative future and the indicative reference year.
Figure 5 shows the % differences in the monthly average values of precipitation between the indicative future and the indicative reference year. Nine differences were negative, a fact that shows that the mean precipitation during these nine months is expected to reduce during the future period compared to the reference period. The analysis of the differences of the 3 h precipitation values that were included in two indicative years revealed that 37% of them were positive, 14% of them equaled zero, while the rest, 49%, was negative. Overall, the average of the values of precipitation that were included in the indicative future year was found to be 32% lower than the corresponding average for the indicative reference year.
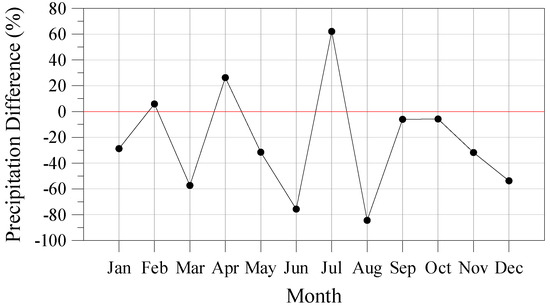
Figure 5.
Differences (%) of the monthly average values of precipitation between the indicative future and the indicative reference year.
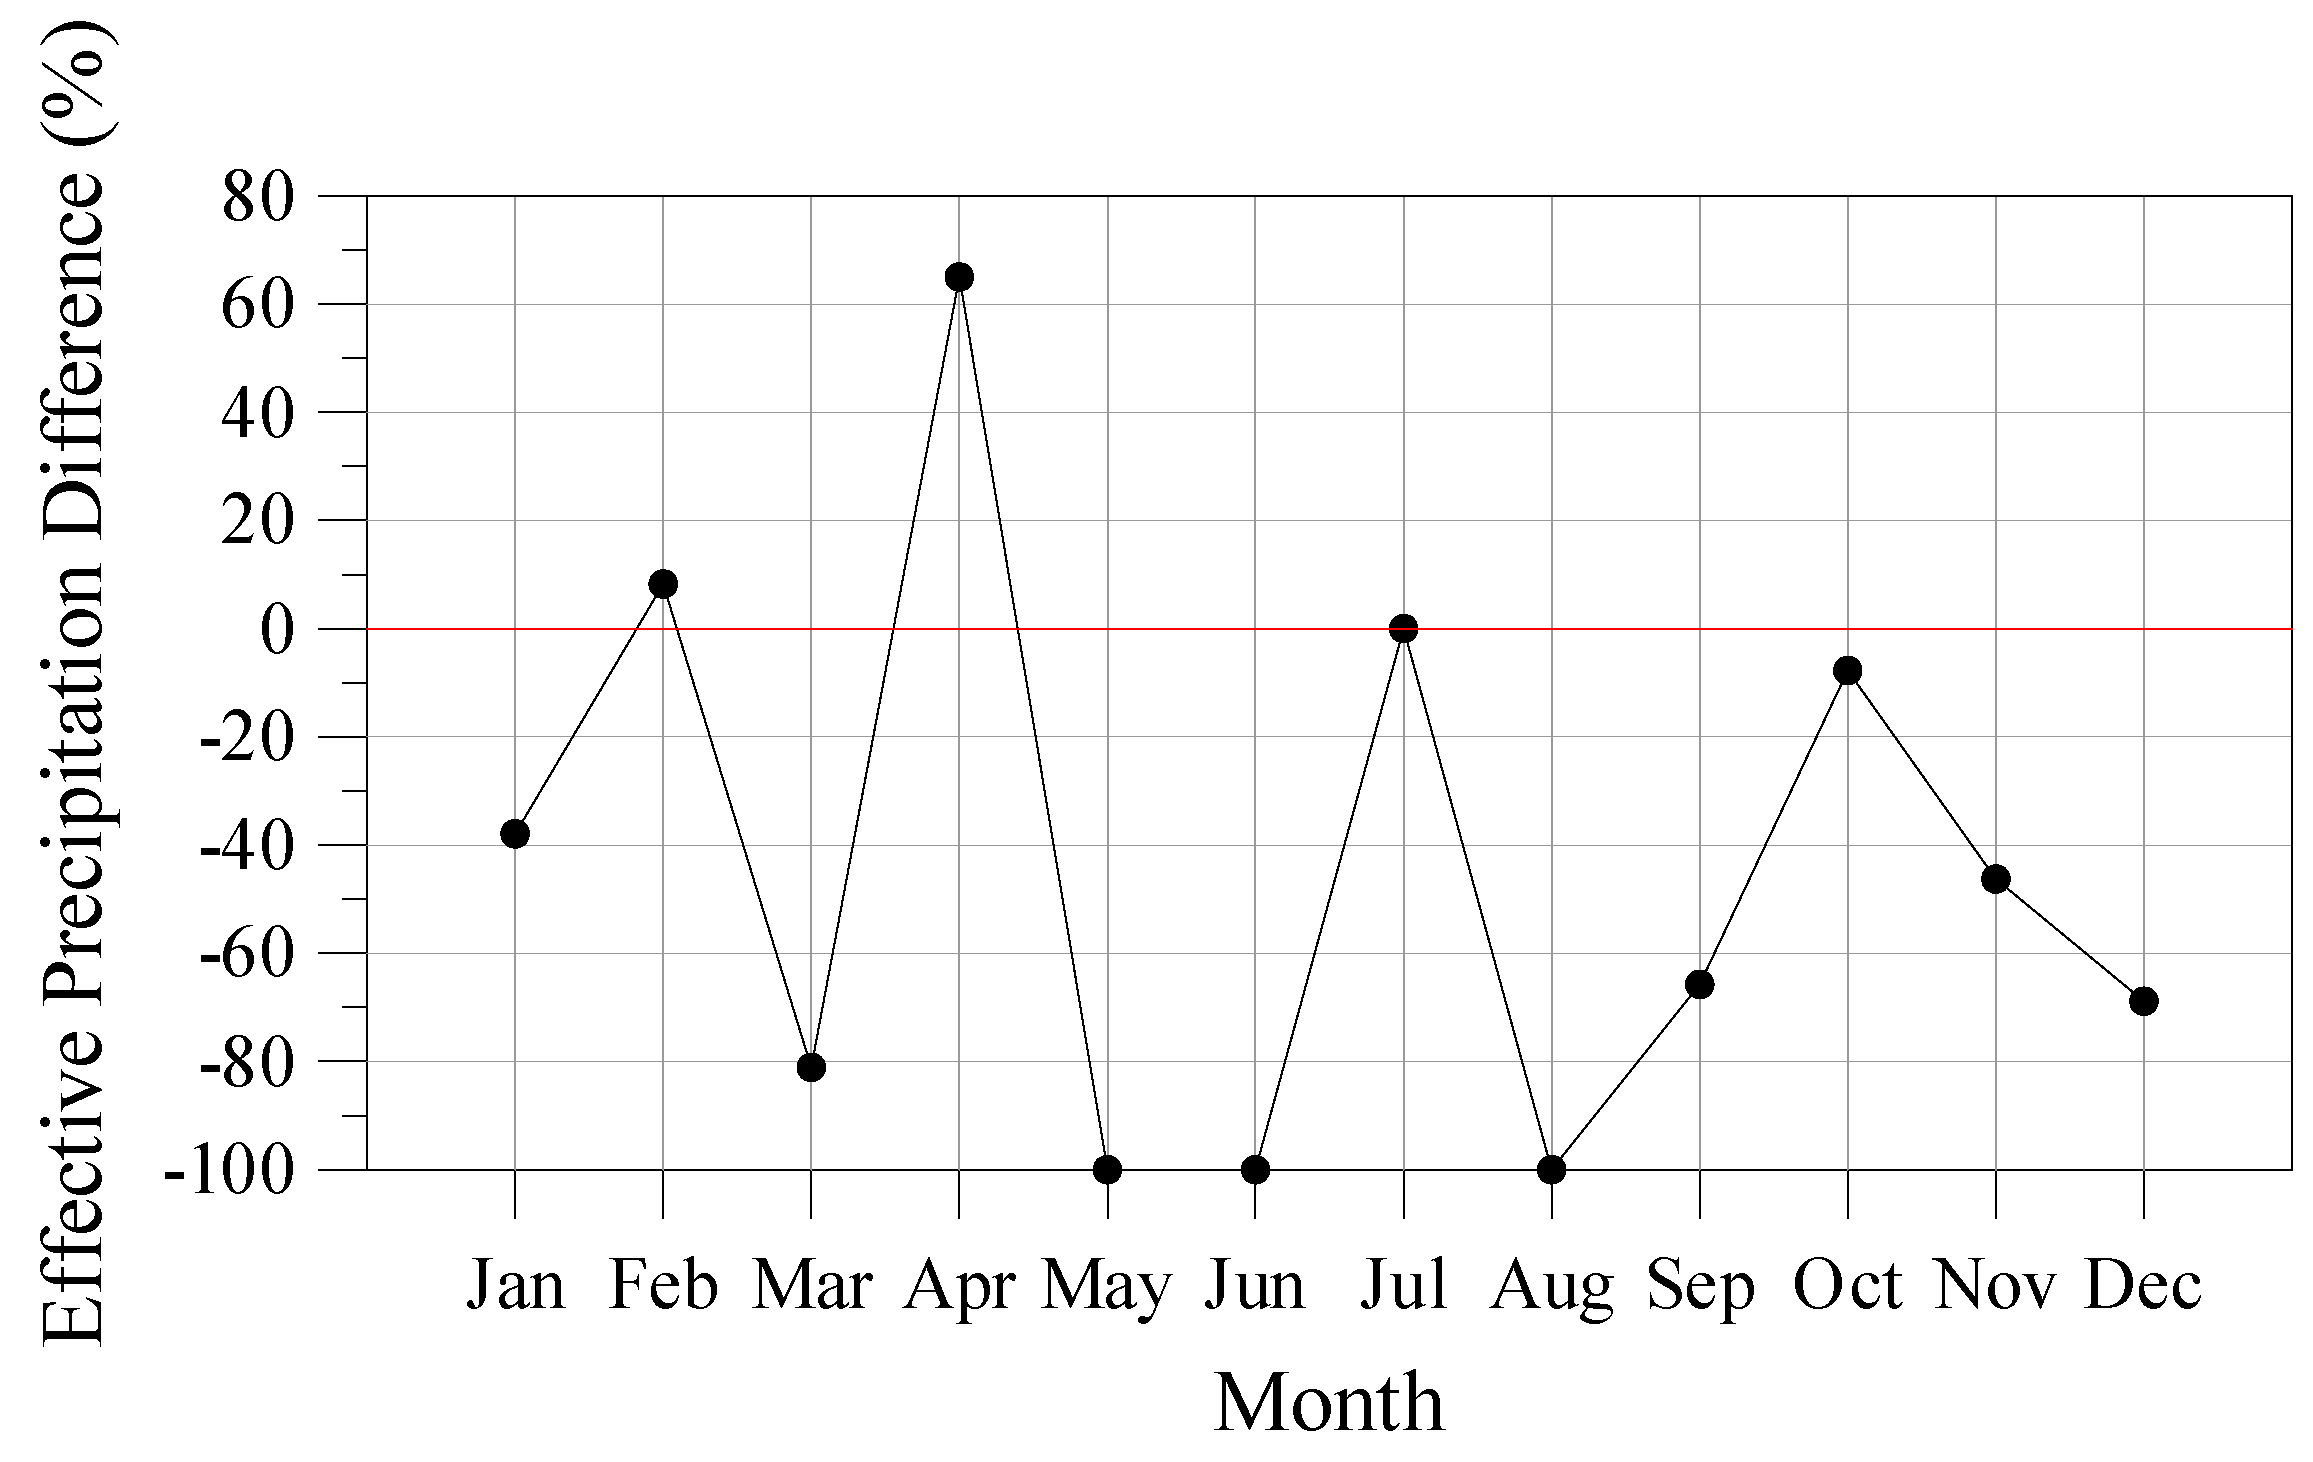
Figure 6 shows the % differences in the monthly average values of effective precipitation between the indicative future and the indicative reference year. Nine differences were negative, a fact that shows that the mean effective precipitation during these nine months is expected to reduce during the future period compared to the reference period. No effective precipitation was simulated for July of both the indicative future and the indicative reference year. Irrigation water needs are expected to rise during May, June, and August in the future, as no effective precipitation was simulated for May, June, and August of the indicative future year, although effective precipitation was simulated for these months of the indicative reference year. Overall, the average of the values of effective precipitation that were included in the indicative future year was found to be 45% lower than the corresponding average for the indicative reference year.
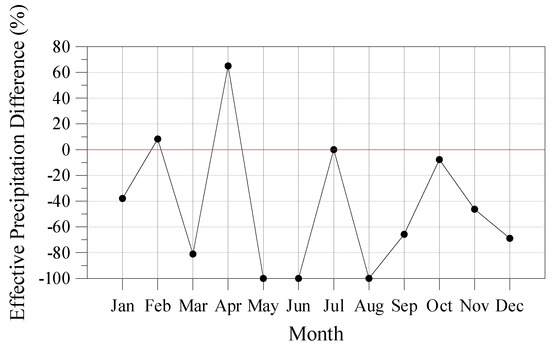
Figure 6.
Differences (%) of the monthly average values of effective precipitation between the indicative future and the indicative reference year.
3.3. Calculation of Kc for Each Examined Crop
The total length of the growing season and the lengths of the various growth stages for wheat and cotton were determined based on the present conditions and were considered the same for both the indicative future and the indicative reference year. These periods are presented in Table 2, together with the Kc values that are proposed by FAO for the growth stages of these crops [34]. The calculation of Kc for alfalfa is considered a special case by FAO [34]. Kc values are defined according to the prevailing climatic conditions. The types of climatic conditions are suggested by FAO [34]. The prevailing climatic conditions during the growing season of alfalfa and the corresponding Kc values are presented in Table 3. Table 4 summarizes the Kc values per month for the examined crops, as determined in Table 2 and Table 3.
Table 2.
The total length of the growing season and lengths of the various growth stages in Thessaly, Greece, for wheat and cotton, and Kc values for these growth stages of these crops.
Table 2.
The total length of the growing season and lengths of the various growth stages in Thessaly, Greece, for wheat and cotton, and Kc values for these growth stages of these crops.
| Crop | Total Growing Period | Initial Stage | Crop Development Stage | Mid Season Stage | Late Season Stage |
|---|---|---|---|---|---|
| Wheat | 15/12–31/5 | 15/12–31/12 | 01/01–31/01 | 01/02–15/04 | 16/04–31/05 |
| Cotton | 15/04–15/10 | 15/04–31/05 | 01/06–15/07 | 16/07–31/08 | 01/09–15/10 |
| Kc for Wheat: | 0.35 | 0.75 | 1.15 | 0.45 | |
| Kc for Cotton: | 0.45 | 0.75 | 1.15 | 0.75 | |
Table 3.
Climatic conditions per growing period of alfalfa and Kc value for each type of climatic conditions.
Table 3.
Climatic conditions per growing period of alfalfa and Kc value for each type of climatic conditions.
| Growing Period | Climatic Conditions | Kc |
|---|---|---|
| 01/04–30/09 | Dry Light/Medium Wind | 0.95 |
| 01/10–30/11 | Humid Light/Medium Wind | 0.85 |
| 01/12–31/01 | Humid or Dry Strong Wind | 1.05 |
| 01/02–31/03 | Humid Light/Medium Wind | 0.85 |
Table 4.
Kc values per month for wheat, cotton, and alfalfa.
Table 4.
Kc values per month for wheat, cotton, and alfalfa.
| Month | Wheat | Cotton | Alfalfa | Month | Wheat | Cotton | Alfalfa |
|---|---|---|---|---|---|---|---|
| 1 | 0.75 | - | 1.05 | 7 | - | 0.96 | 0.95 |
| 2 | 1.15 | - | 0.85 | 8 | - | 1.15 | 0.95 |
| 3 | 1.15 | - | 0.85 | 9 | - | 0.75 | 0.95 |
| 4 | 0.80 | 0.45 | 0.95 | 10 | - | 0.75 | 0.85 |
| 5 | 0.45 | 0.45 | 0.95 | 11 | - | - | 0.85 |
| 6 | - | 0.75 | 0.95 | 12 | 0.35 | - | 1.05 |
3.4. Estimation of the Irrigation Water Needs of Each Crop
Table 5 shows the % differences in the monthly irrigation water needs of the three examined crops between the indicative future and the indicative reference year. Table 5 shows that almost all differences were positive, a fact that reveals that irrigation water needs of wheat, cotton, and alfalfa are expected to increase during the future period compared to the reference period. It is worth mentioning that wheat will be irrigated in December in the future, while it is not irrigated in the present (this is indicated by Y (yes)–N (no) in Table 5). Overall, the irrigation water needs of wheat, cotton, and alfalfa were found to be 16%, 7%, and 11%, respectively, higher during the indicative future year than during the indicative reference year. It is worth noticing that, as simulated precipitation data were overestimated by the model during the growing period of alfalfa and wheat, the irrigation water needs of these cultivations are expected to be higher by more than 16% and more than 11%, respectively.
Table 5.
Differences (%) of the monthly average values of irrigation water needs between the indicative future and the indicative reference year.
3.5. Suggestions for Saving Irrigation Water
The aim of this section is to highlight available representative good practices that could be applied in order to save irrigation water for the three examined crops.
3.5.1. Precision Agriculture
Proper monitoring and control of environmental parameters significantly contribute to the conservation of natural resources, including water. Irrigation monitoring and advanced control systems that incorporate monitoring and advanced control concepts for precision irrigation were reviewed [36]. Advances and perspectives in the research field related to improving water use efficiency at different scales were reviewed, the key obstacles and possible solutions in practice were discussed, and a water-saving, quality-improving, high-efficient water use strategy was proposed [37]. Sensor applications for improving sustainability in agrifood systems by promoting the preservation of freshwater resources under the principles of smart farming or precision agriculture were reviewed [38]. Integrated satellite-based water consumption monitoring practices can also support this goal [39].
Research projects have been implemented that proposed state-of-the-art methods to forecast crop irrigation water needs. A hybrid framework that exploits models and observation data that could be applied to estimate daily irrigation water demand was introduced [40]. Earth observation data, weather forecasts, and numerical simulations were combined to produce short-term irrigation forecasts in order to plan more precisely water allocation in space and time in irrigated agriculture [41]. Crop irrigation water needs in an operative farm in the South of Italy were forecasted by applying a satellite-driven soil water balance model coupled with a meteorological forecast model [42].
3.5.2. Improvement in Irrigation System
A study in Mexico found that, with an efficient design by means of irrigation tests, characterization of the plot, and the calculation of the optimal flow through an analytical formula, it was possible to increase the water application efficiency by 43–95% and the water use efficiency up to 47% [43]. Special irrigation management practices could also be applied, like deficit irrigation. Deficit irrigation is an optimization strategy in which irrigation is applied during drought-sensitive growth stages of a crop, while outside these periods, irrigation is limited or even unnecessary if rainfall provides a minimum supply of water. The application of deficit irrigation was proposed in order to overcome the degradation of groundwater quality and quantity [44]. Another study also proposed deficit irrigation, as well as the use of non-conventional water resources (e.g., wastewater, brackish groundwater) in some cases, as part of climate change mitigation measures to tackle the water poverty issue [45].
4. Conclusions
This paper revealed potential changes in irrigation water consumption that may occur in the future (2046–2050) under the climate change worst-case scenario (RCP8.5) compared to a reference period (2006–2010). The analysis was based on WRF simulations that refer to the eastern part of Thessaly Plain in central Greece, following a methodology proposed by UN FAO. Results for the two periods were comparatively assessed, and it was found that temperature is expected to increase by 1.1 °C in the future, while precipitation and effective precipitation are expected to decrease by 32% and 45%, respectively, in the future. These projections will trigger an increase of more than 16%, 7%, and more than 11% in the irrigation water needs of wheat, cotton, and alfalfa, respectively. Good practices in the frame of precision agriculture principles are necessary in order to support agricultural production and preserve natural resources.
Author Contributions
Conceptualization, D.K.P., S.K., D.M. and N.K.; methodology, D.K.P., S.K., D.M. and N.K.; software, S.K. and D.M.; formal analysis, D.K.P., S.K., D.M. and N.K.; data curation, D.K.P. and S.K.; writing—original draft preparation, D.K.P. and S.K.; writing—review and editing, D.M. and N.K.; visualization, D.K.P.; supervision, D.K.P.; project administration, D.K.P. All authors have read and agreed to the published version of the manuscript.
Funding
This research was funded by the project entitled “Innovative actions to adapt to climate change impacts, with an emphasis on land uses and water resources management (Karla Climate–Land–Water)”, which was funded by the Green Fund, Hellenic Ministry of Environment and Energy, under the Call “Innovative Actions with Citizens”, of the Funding Program “Natural Environment and Innovative Actions 2020”.
Institutional Review Board Statement
Not applicable.
Informed Consent Statement
Not applicable.
Data Availability Statement
The data presented in this study are available on request from the corresponding author.
Conflicts of Interest
The authors declare no conflict of interest. The funders had no role in the design of the study; in the collection, analyses, or interpretation of data; in the writing of the manuscript; or in the decision to publish the results.
References
- Malhi, G.S.; Kaur, M.; Kaushik, P. Impact of Climate Change on Agriculture and Its Mitigation Strategies: A Review. Sustainability 2021, 13, 1318. [Google Scholar] [CrossRef]
- Kumari, A.; Lakshmi, G.A.; Krishna, G.K.; Patni, B.; Prakash, S.; Bhattacharyya, M.; Singh, S.K.; Verma, K.K. Climate Change and Its Impact on Crops: A Comprehensive Investigation for Sustainable Agriculture. Agronomy 2022, 12, 3008. [Google Scholar] [CrossRef]
- Kim, S.; Hwang, S.; Song, J.-H.; Lee, H.; Kang, M.-S. Impact of irrigation reservoirs on budget of the watershed-scale water cycle under climate change. Agric. Water Manag. 2023, 283, 8327. [Google Scholar] [CrossRef]
- Soares, D.; Paço, T.A.; Rolim, J. Assessing Climate Change Impacts on Irrigation Water Requirements under Mediterranean Conditions—A Review of the Methodological Approaches Focusing on Maize Crop. Agronomy 2023, 13, 117. [Google Scholar] [CrossRef]
- Lindsey, R.; Dahlman, L. Climate Change: Global Temperature. Available online: https://www.climate.gov/news-features/understanding-climate/climate-change-global-temperature (accessed on 21 June 2023).
- Collins, M.; Knutti, R.; Arblaster, J.; Dufresne, J.-L.; Fichefet, T.; Friedlingstein, P.; Gao, X.; Gutowski, W.J.; Johns, T.; Krinner, G.; et al. Long-term Climate Change: Projections, Commitments and Irreversibility. In Climate Change 2013: The Physical Science Basis; Contribution of Working Group I to the Fifth Assessment Report of the Intergovernmental Panel on Climate Change; Stocker, T.F., Qin, D., Plattner, G.-K., Tignor, M., Allen, S.K., Boschung, J., Nauels, A., Xia, Y., Bex, V., Midgley, P.M., Eds.; Cambridge University Press: Cambridge, UK; New York, NY, USA, 2013. [Google Scholar]
- Zittis, G.; Hadjinicolaou, P.; Klangidou, M.; Proestos, Y.; Lelieveld, J. A multi-model, multi-scenario, and multi-domain analysis of regional climate projections for the Mediterranean. Reg. Environ. Change 2019, 19, 2621–2635. [Google Scholar] [CrossRef]
- Moatti, J.P.; Thiébault, S. (Eds.) The Mediterranean Region under Climate Change: A Scientific Update; IRD Éditions: Marseille, France, 2018. [Google Scholar]
- Tramblay, Y.; Koutroulis, A.; Samaniego, L.; Vicente-Serrano, S.M.; Volaire, F.; Boone, A.; Le Page, M.; Llasat, M.-C.; Albergel, C.; Burak, S.; et al. Challenges for drought assessment in the Mediterranean region under future climate scenarios. Earth Sci. Rev. 2020, 210, 103348. [Google Scholar] [CrossRef]
- Kourgialas, Ν.Ν. A critical review of water resources in Greece: The key role of agricultural adaptation to climate-water effects. Sci. Total Environ. 2021, 775, 145857. [Google Scholar] [CrossRef]
- Georgopoulou, E.; Mirasgedis, S.; Sarafidis, Y.; Vitaliotou, M.; Lalas, D.P.; Theloudis, I.; Giannoulaki, K.-D.; Dimopoulos, D.; Zavras, V. Climate change impacts and adaptation options for the Greek agriculture in 2021–2050: A monetary assessment. Clim. Risk Manag. 2017, 16, 164–182. [Google Scholar] [CrossRef]
- Voloudakis, D.; Karamanos, A.; Economou, G.; Kapsomenakis, J.; Zerefos, C. A comparative estimate of climate change impacts on cotton and maize in Greece. J. Water Clim. Chang. 2018, 9, 643–656. [Google Scholar] [CrossRef]
- Calzadilla, A.; Rehdanz, K.; Betts, R.; Falloon, P.; Wiltshire, A.; Tol, R.S.J. Climate change impacts on global agriculture. Clim. Chang. 2013, 120, 357–374. [Google Scholar] [CrossRef]
- Sidiropoulos, P.; Mylopoulos, N.; Loukas, A. Optimal Management of an Overexploited Aquifer under Climate Change: The Lake Karla Case. Water Resour. Manag. 2013, 27, 1635–1649. [Google Scholar] [CrossRef]
- Tzabiras, J.; Vasiliades, L.; Sidiropoulos, P.; Loukas, A.; Mylopoulos, N. Evaluation of Water Resources Management Strategies to Overturn Climate Change Impacts on Lake Karla Watershed. Water Resour. Manag. 2016, 30, 5819–5844. [Google Scholar] [CrossRef]
- Mellios, N.; Kofinas, D.; Laspidou, C.; Papadimitriou, T. Mathematical Modeling of Trophic State and Nutrient Flows of Lake Karla using the PCLake Model. Environ. Process 2015, 2 (Suppl. S1), 85–100. [Google Scholar] [CrossRef]
- Janse, J.H.; Van Liere, L. PCLake—A modelling tool for the evaluation of lake restoration scenarios. Water Sci. Technol. 1995, 31, 371–374. [Google Scholar] [CrossRef]
- Alamanos, A.; Xenarios, S.; Mylopoulos, N.; Stålnacke, P. Integrated water resources management in agro-economy using linear programming: The case of lake Karla basin, Greece. Eur. Water 2017, 60, 41–47. [Google Scholar]
- Alamanos, A.; Latinopoulos, D.; Papaioannou, G.; Mylopoulos, N. Integrated Hydro-Economic Modeling for Sustainable Water Resources Management in Data-Scarce Areas: The Case of Lake Karla Watershed in Greece. Water Resour. Manag. 2019, 33, 2775–2790. [Google Scholar] [CrossRef]
- European Commission (EU). Joint Research Centre (JRC), European Soil Data Centre (ESDAC). Available online: https://esdac.jrc.ec.europa.eu/content/soil-map-thessaly-edafologikos-xartis-thessalias (accessed on 14 October 2023).
- Angelaki, A.; Dionysidis, A.; Sihag, P.; Golia, E.E. Assessment of Contamination Management Caused by Copper and Zinc Cations Leaching and Their Impact on the Hydraulic Properties of a Sandy and a Loamy Clay Soil. Land 2022, 11, 290. [Google Scholar] [CrossRef]
- Hellenic Statistical Authority. Available online: https://www.statistics.gr/en/statistics/-/publication/SPG32 (accessed on 14 October 2023).
- Panagopoulos, Y.; Dimitriou, E. A Large-Scale Nature-Based Solution in Agriculture for Sustainable Water Management: The Lake Karla Case. Sustainability 2020, 12, 6761. [Google Scholar] [CrossRef]
- Im, E.-S.; Ha, S.; Qiu, L.; Hur, J.; Jo, S.; Shim, K.-M. An evaluation of temperature-based agricultural indices over Korea from the high-resolution WRF simulation. Front. Earth Sci. 2021, 9, 656787. [Google Scholar] [CrossRef]
- Li, J.; Mahalov, A.; Hyde, P. Impacts of agricultural irrigation on ozone concentrations in the Central Valley of California and in the contiguous United States based on WRF-Chem simulations. Agric. For. Meteorol. 2016, 221, 34–49. [Google Scholar] [CrossRef]
- Hong, M.; Lee, S.-H.; Lee, S.-J.; Choi, J.Y. Application of high-resolution meteorological data from NCAM-WRF to characterize agricultural drought in small-scale farmlands based on soil moisture deficit. Agric. Water Manag. 2021, 243, 106494. [Google Scholar] [CrossRef]
- Marta-Almeida, M.; Teixeira, J.C.; Carvalho, M.J.; Melo-Gonçalves, P.; Rocha, A.M. High resolution WRF climatic simulations for the Iberian Peninsula: Model validation. Phys. Chem. Earth 2016, 94, 94–105. [Google Scholar] [CrossRef]
- Annor, T.; Lamptey, B.; Wagner, S.; Oguntunde, P.; Arnault, J.; Heinzeller, D.; Kunstmann, H. High-resolution long-term WRF climate simulations over Volta Basin. Part 1: Validation analysis for temperature and precipitation. Theor. Appl. Climatol. 2018, 133, 829–849. [Google Scholar] [CrossRef]
- Keppas, S.C.; Papadogiannaki, S.; Parliari, D.; Kontos, S.; Poupkou, A.; Tzoumaka, P.; Kelessis, A.; Zanis, P.; Casasanta, G.; de’Donato, F.; et al. Future Climate Change Impact on Urban Heat Island in Two Mediterranean Cities Based on High-Resolution Regional Climate Simulations. Atmosphere 2021, 12, 884. [Google Scholar] [CrossRef]
- Riahi, K.; Rao, S.; Krey, V.; Cho, C.; Chirkov, V.; Fischer, G.; Kindermann, G.; Nakicenovic, N.; Rafaj, P. RCP 8.5—A scenario of comparatively high greenhouse gas emissions. Clim. Chang. 2011, 109, 33–57. [Google Scholar] [CrossRef]
- Fernández, M.D.; López, J.C.; Baeza, E.; Céspedes, A.; Meca, D.E.; Bailey, B. Generation and evaluation of typical meteorological year datasets for greenhouse and external conditions on the Mediterranean coast. Int. J. Biometeorol. 2015, 59, 1067–1081. [Google Scholar] [CrossRef] [PubMed]
- Schlünzen, K.H.; Sokhi, R.S. Overview of Tools and Methods for Meteorological and Air Pollution Mesoscale Model Evaluation and User Training; GAW Report No. 181, Joint Report of COST Action 728 and GURME; World Meteorological Organization: Geneva, Switzerland, 2008. [Google Scholar]
- Willmott, C.J. On the validation of models. Phys. Geogr. 1981, 2, 184–194. [Google Scholar] [CrossRef]
- Brouwer, C.; Heibloem, M. Irrigation Water Management, Training Manual No. 3: Irrigation Water Needs. Food and Agriculture Organization of the United Nations. 1986. Available online: https://www.fao.org/3/s2022e/s2022e00.htm#Contents (accessed on 21 June 2023).
- Allen, R.G.; Pereira, L.S.; Raes, D.; Smith, M. Crop Evapotranspiration, Guidelines for Computing Crop Water Requirements, Irrigation and Drainage Paper 56. Food and Agriculture Organization of the United Nations. 1998. Available online: https://www.fao.org/3/X0490E/x0490e00.htm (accessed on 21 June 2023).
- Abioye, E.A.; Abidin, M.S.Z.; Mahmud, M.S.A.; Buyamin, S.; Ishak, M.H.I.; Rahman, M.K.I.A.; Otuoze, A.O.; Onotu, P.; Ramli, M.S.A. A review on monitoring and advanced control strategies for precision irrigation. Comput. Electron. Agric. 2020, 173, 105441. [Google Scholar] [CrossRef]
- Kang, J.; Hao, X.; Zhou, H.; Ding, R. An integrated strategy for improving water use efficiency by understanding physiological mechanisms of crops responding to water deficit: Present and prospect. Agric. Water Manag. 2021, 255, 107008. [Google Scholar] [CrossRef]
- Tsolakis, N.; Aivazidou, E.; Srai, J.S. Sensor applications in agrifood systems: Current trends and opportunities for water stewardship. Climate 2019, 7, 44. [Google Scholar] [CrossRef]
- Tan, S.; Wu, B.; Yan, N.; Zeng, H. Satellite-based water consumption dynamics monitoring in an extremely arid area. Remote Sens. 2018, 10, 1399. [Google Scholar] [CrossRef]
- Forouhar, L.; Wu, W.; Wang, Q.J.; Hakala, K. A hybrid framework for short-term irrigation demand forecasting. Agric. Water Manag. 2022, 273, 107861. [Google Scholar] [CrossRef]
- Chitu, Z.; Tomei, F.; Villani, G.; Felice, A.D.; Zampelli, G.; Paltineanu, I.C.; Visinescu, I.; Dumitrescu, A.; Bularda, M.; Neagu, D.; et al. Improving irrigation scheduling using MOSES short-term irrigation forecasts and in situ water resources measurements on Alluvial soils of Lower Danube Floodplain, Romania. Water 2020, 12, 520. [Google Scholar] [CrossRef]
- Corbari, C.; Salerno, R.; Ceppi, A.; Telesca, V.; Mancini, M. Smart irrigation forecast using satellite LANDSAT data and meteo-hydrological modeling. Agric. Water Manag. 2019, 212, 283–294. [Google Scholar] [CrossRef]
- Chávez, C.; Limón-Jiménez, I.; Espinoza-Alcántara, B.; López-Hernández, J.A.; Bárcenas-Ferruzca, E.; Trejo-Alonso, J. Water-use efficiency and productivity improvements in surface irrigation systems. Agronomy 2020, 10, 1759. [Google Scholar] [CrossRef]
- Lyra, A.; Loukas, A. Simulation and Evaluation of Water Resources Management Scenarios Under Climate Change for Adaptive Management of Coastal Agricultural Watersheds. Water Resour. Manag. 2023, 37, 2625–2642. [Google Scholar] [CrossRef]
- Nikolaou, G.; Neocleous, D.; Christou, A.; Kitta, E.; Katsoulas, N. Implementing Sustainable Irrigation in Water-Scarce Regions under the Impact of Climate Change. Agronomy 2020, 10, 1120. [Google Scholar] [CrossRef]


Disclaimer/Publisher’s Note: The statements, opinions and data contained in all publications are solely those of the individual author(s) and contributor(s) and not of MDPI and/or the editor(s). MDPI and/or the editor(s) disclaim responsibility for any injury to people or property resulting from any ideas, methods, instructions or products referred to in the content. |
© 2023 by the authors. Licensee MDPI, Basel, Switzerland. This article is an open access article distributed under the terms and conditions of the Creative Commons Attribution (CC BY) license (https://creativecommons.org/licenses/by/4.0/).