


Recycling Discarded Facemasks of COVID-19 Pandemic to New Novel Composite Thermal Insulation and Sound-Absorbing Materials


 ,
,
Abstract
1. Introduction
2. Materials, Methods, and Tests
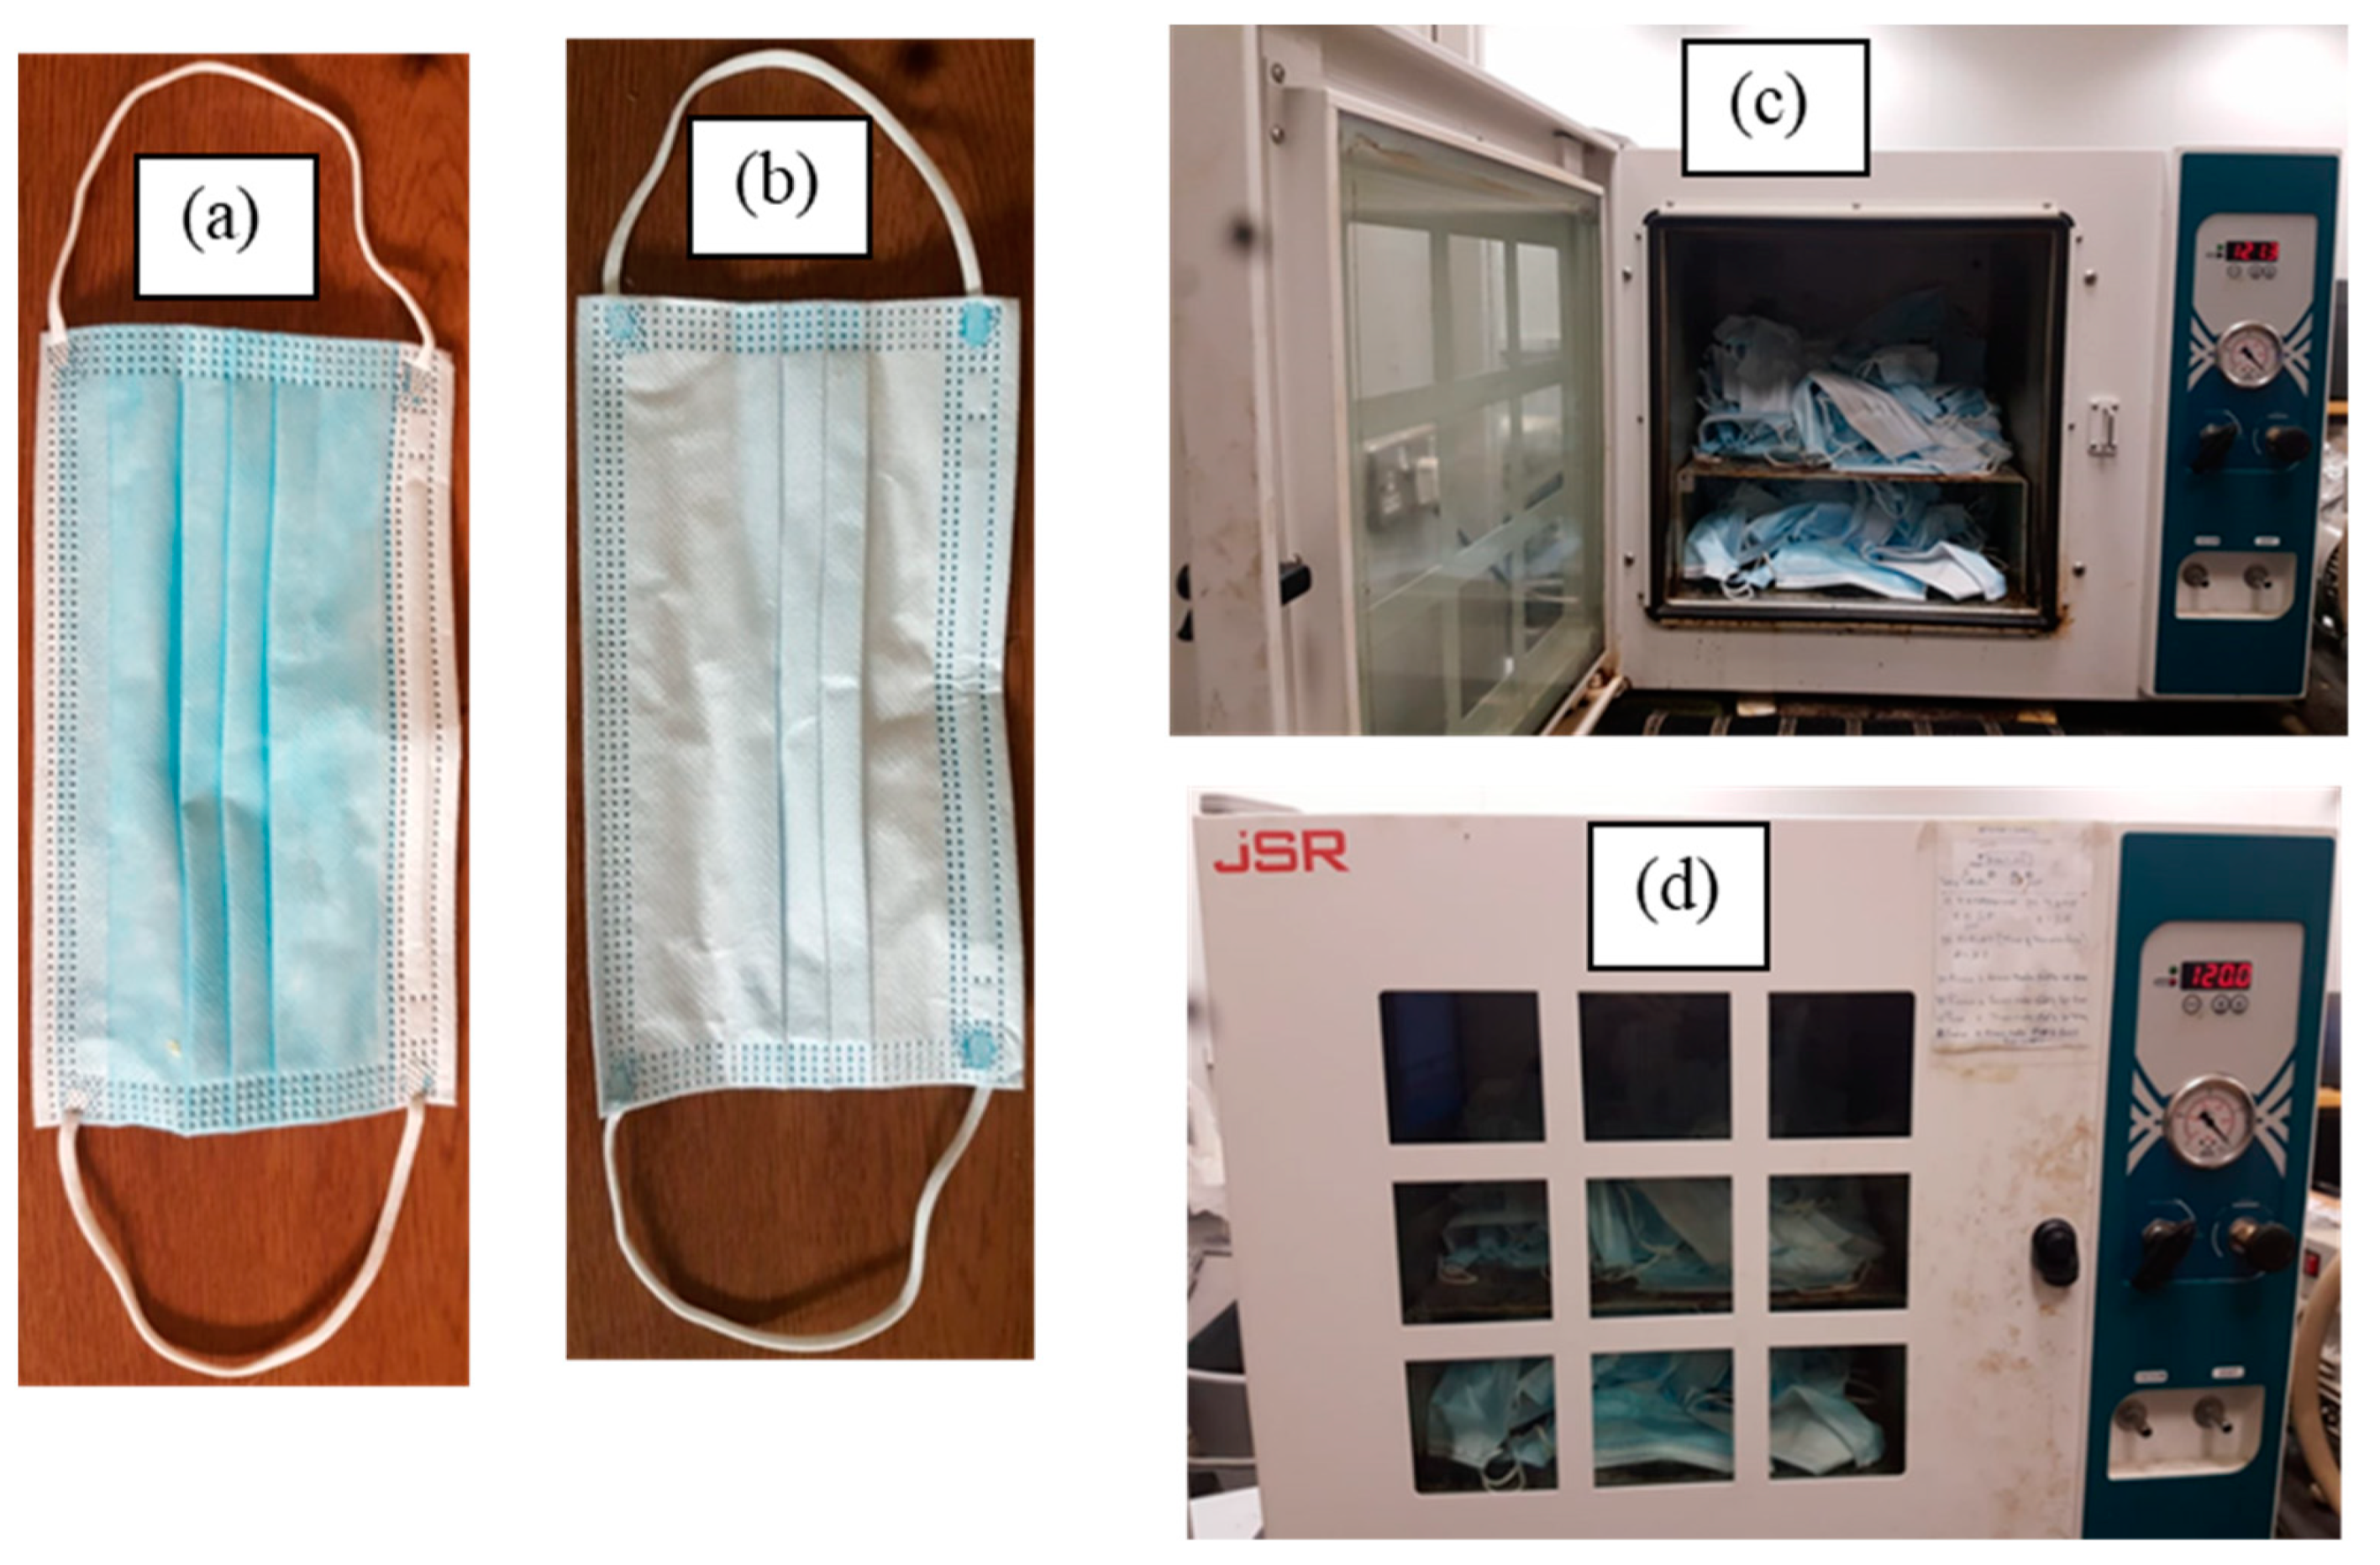
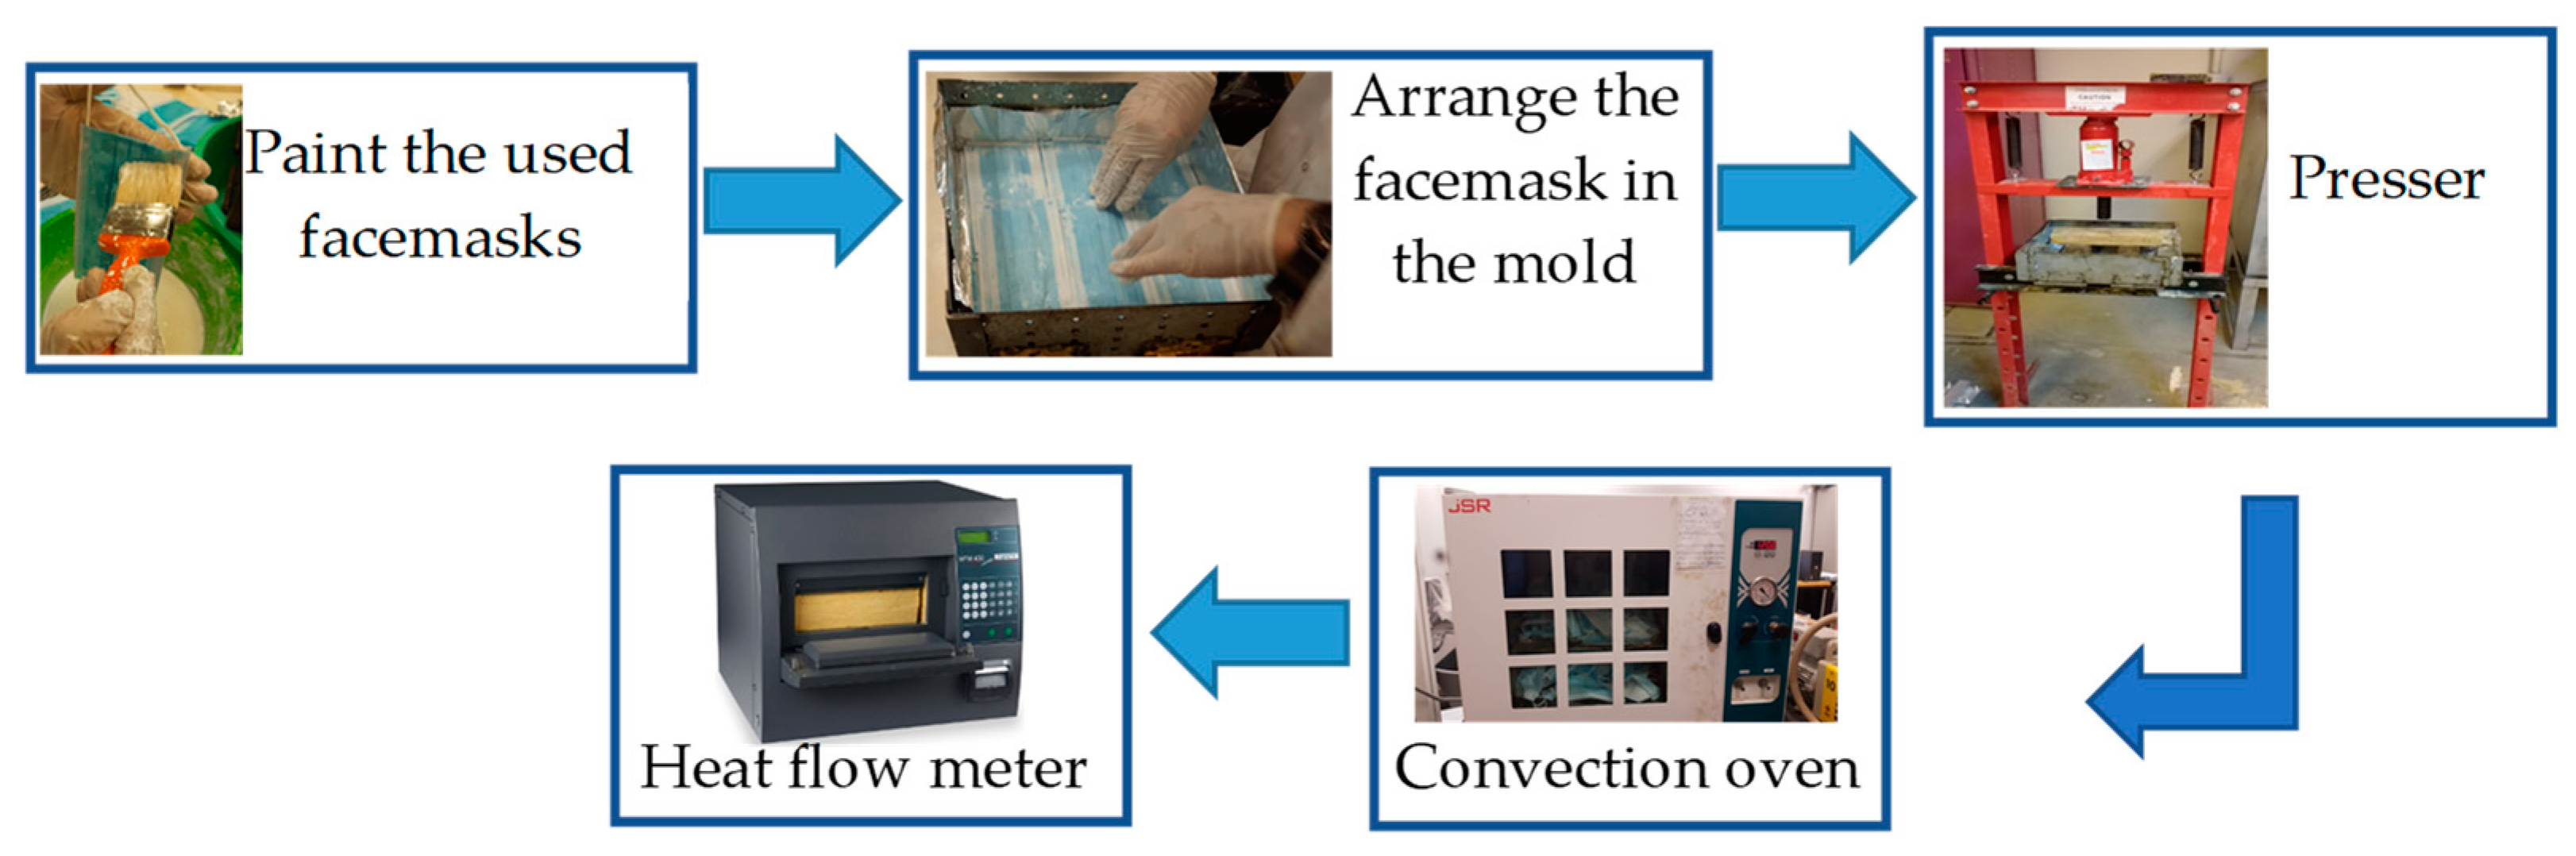
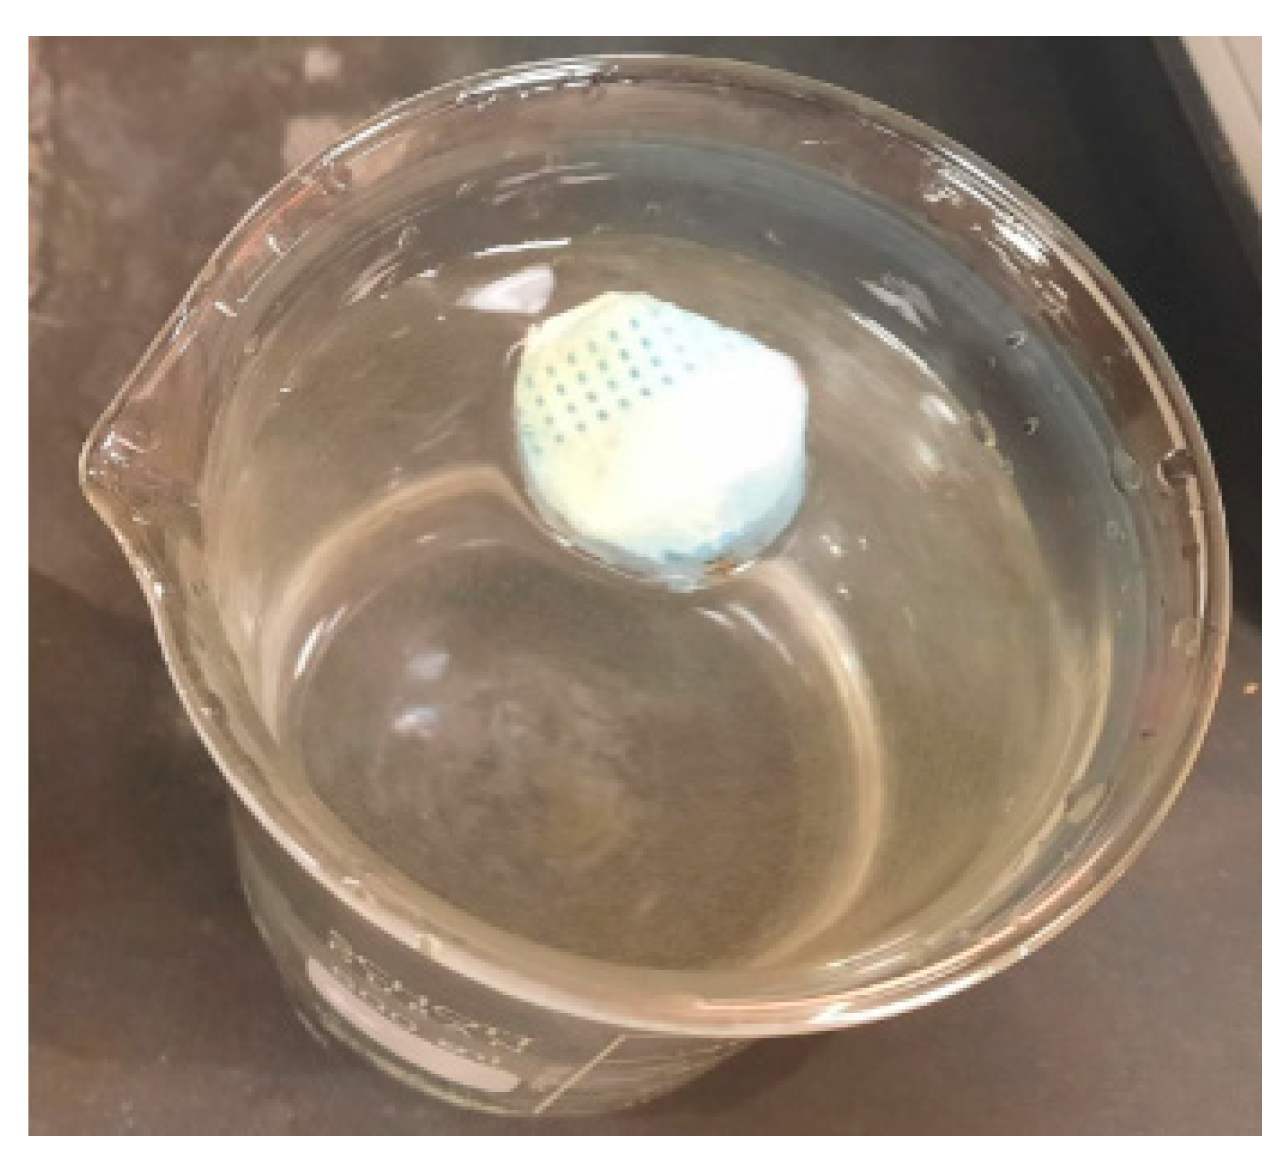
2.1. Collecting and Preparing the Discarded Facemasks
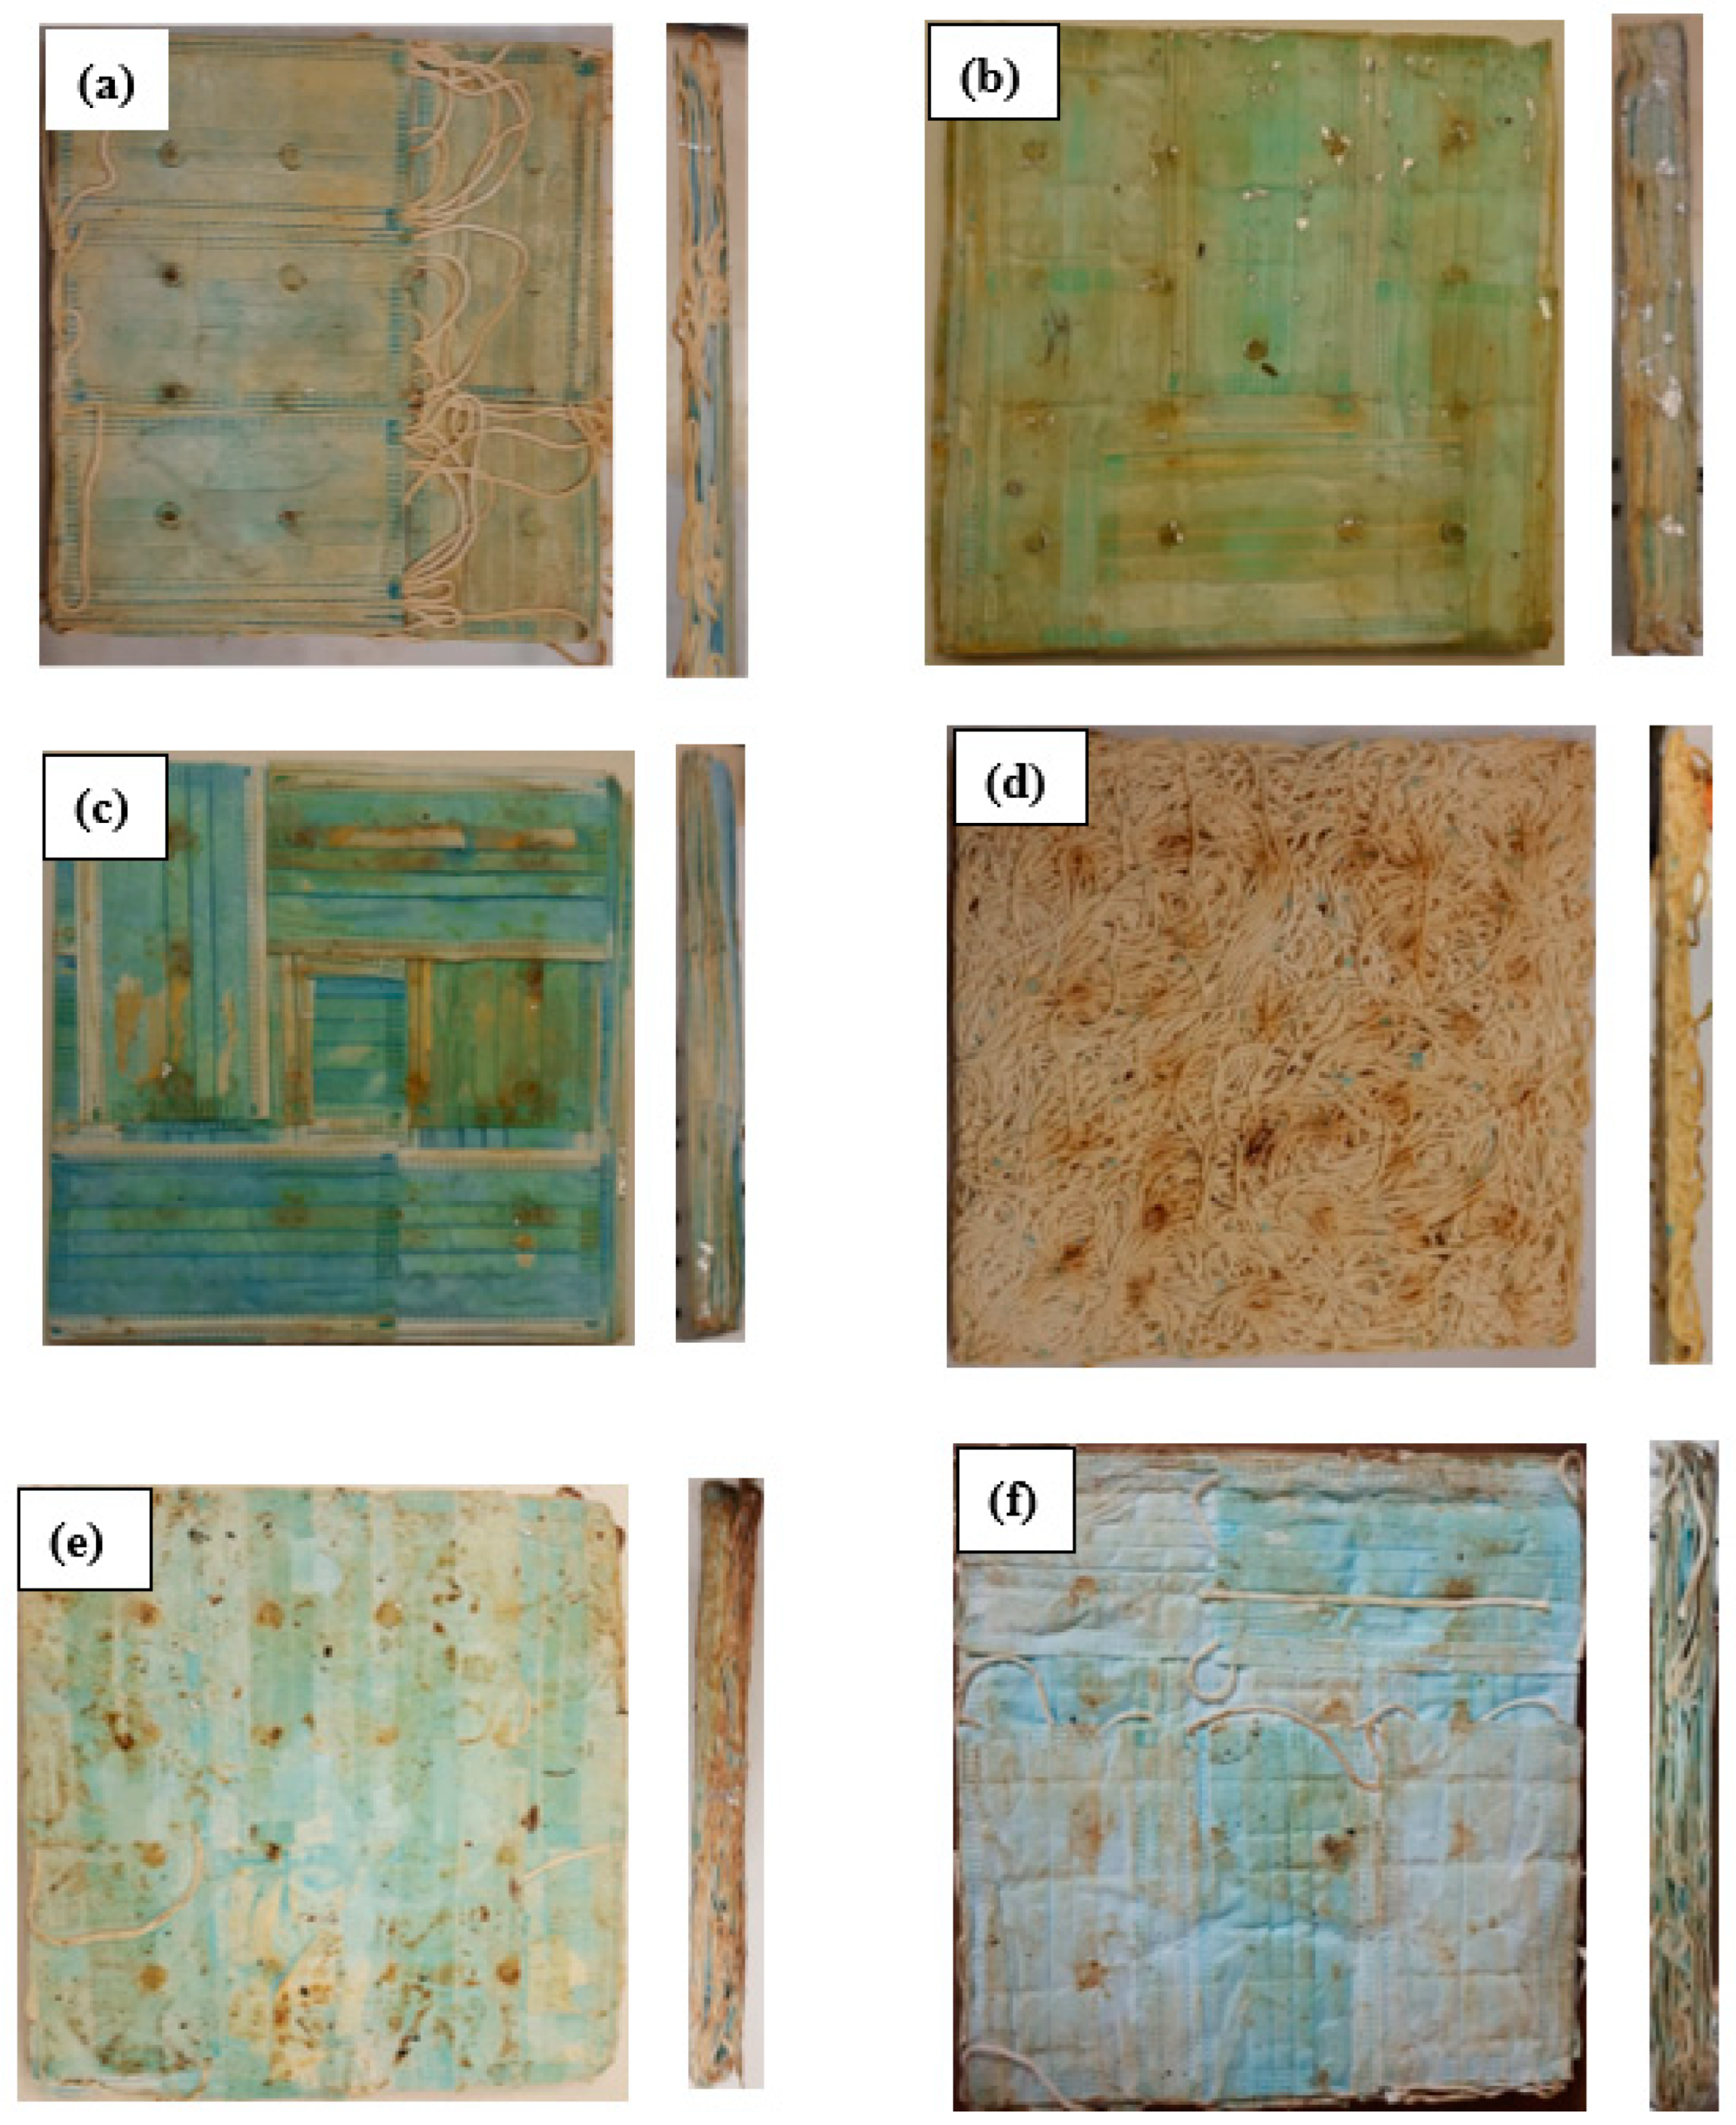
2.2. Preparing the Bound Facemasks’ Samples
2.3. Microstructure Analysis of the Composite Samples
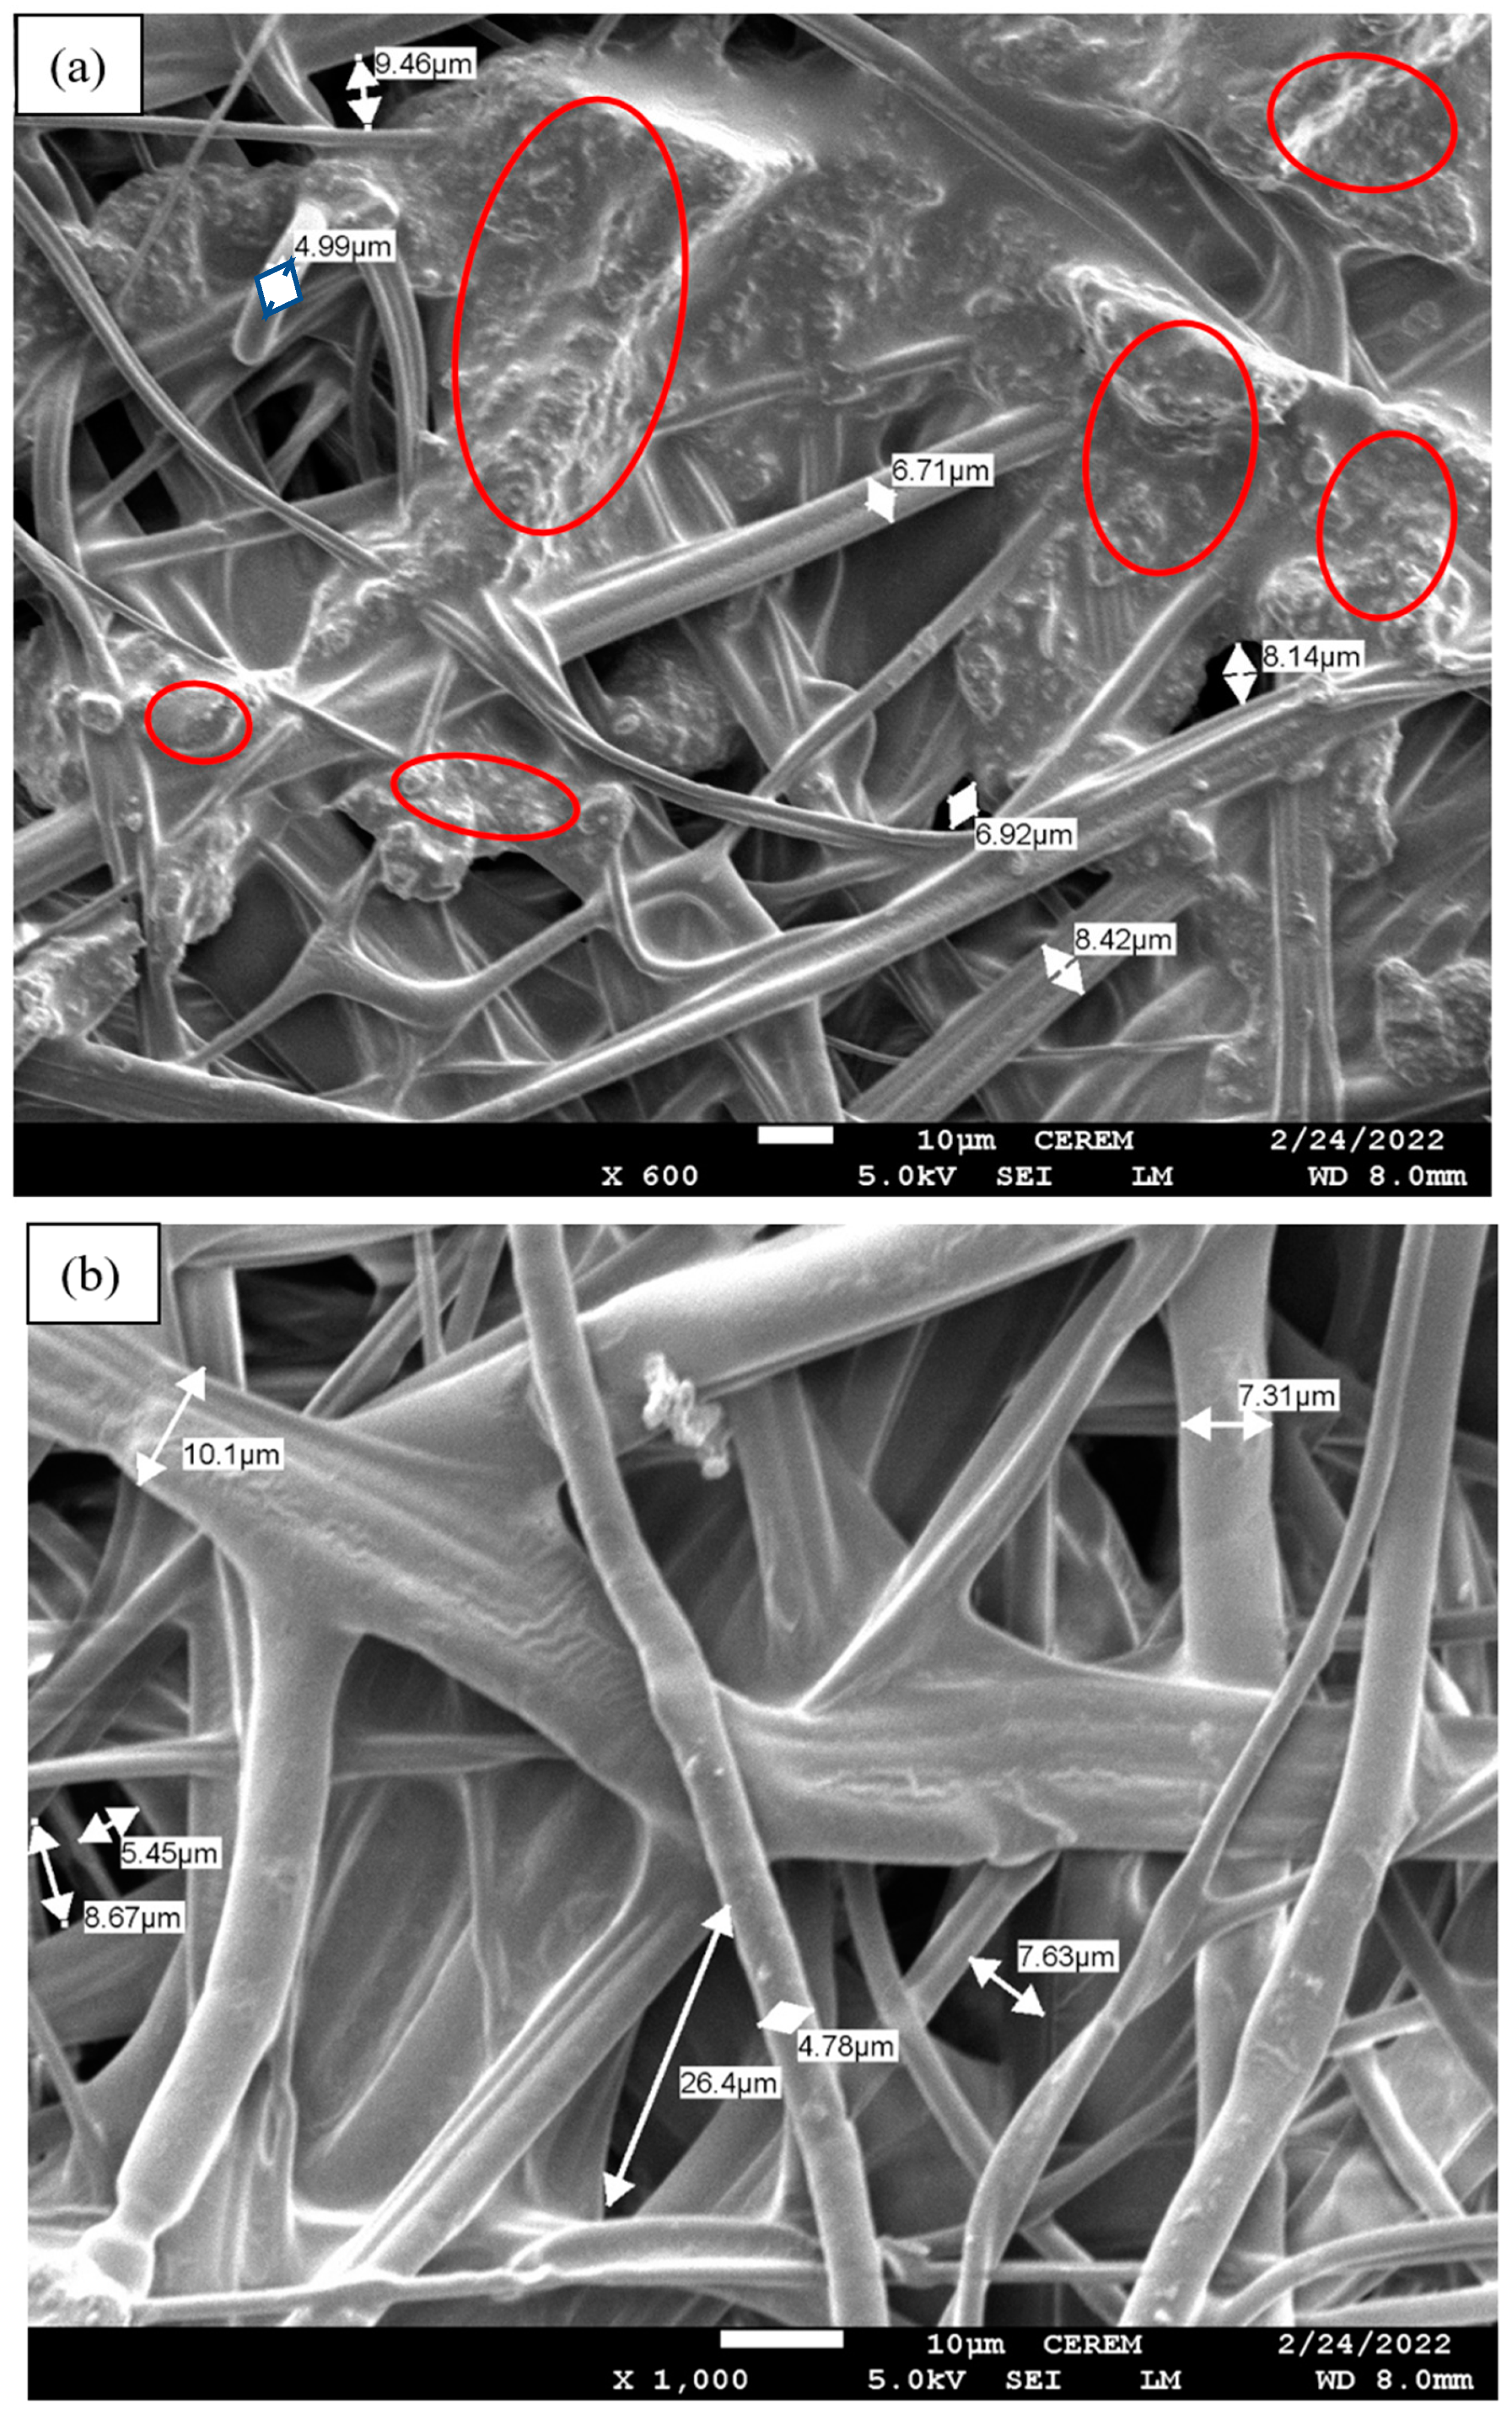
2.3.1. Scanning Electron Microscopy (SEM) Analysis
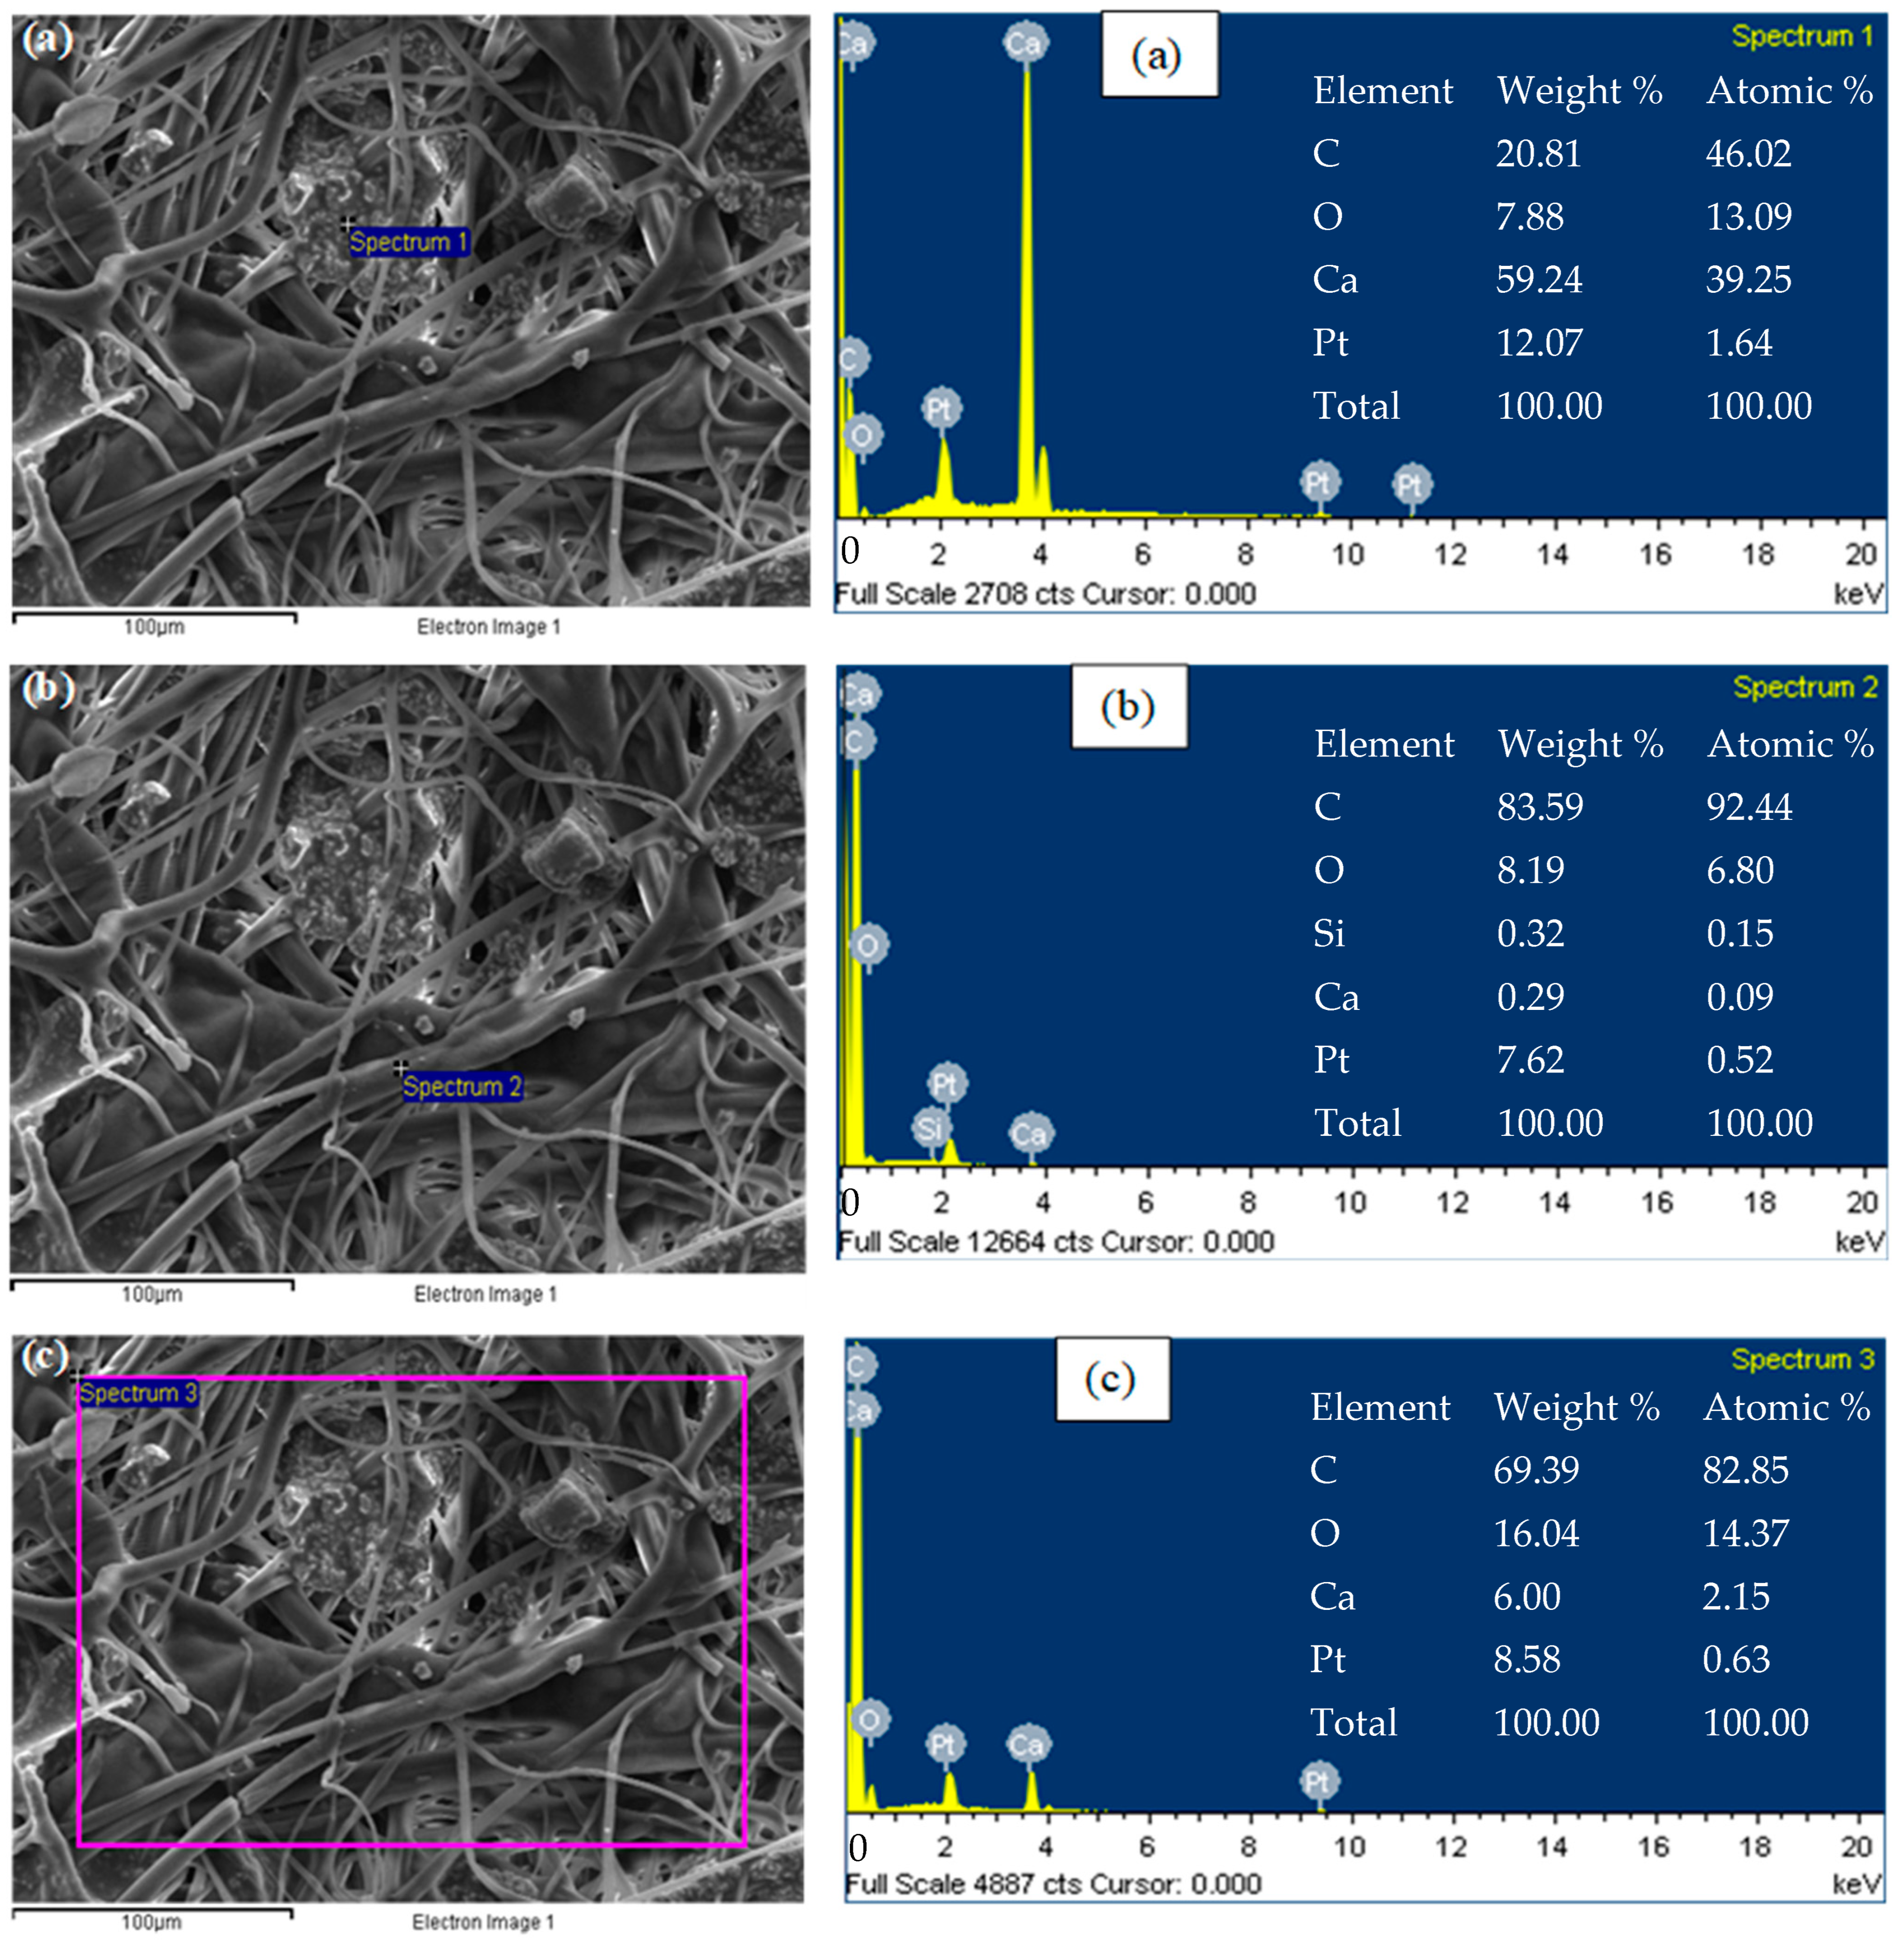
2.3.2. Energy Dispersive X-ray Spectroscopy (EDS) Analysis
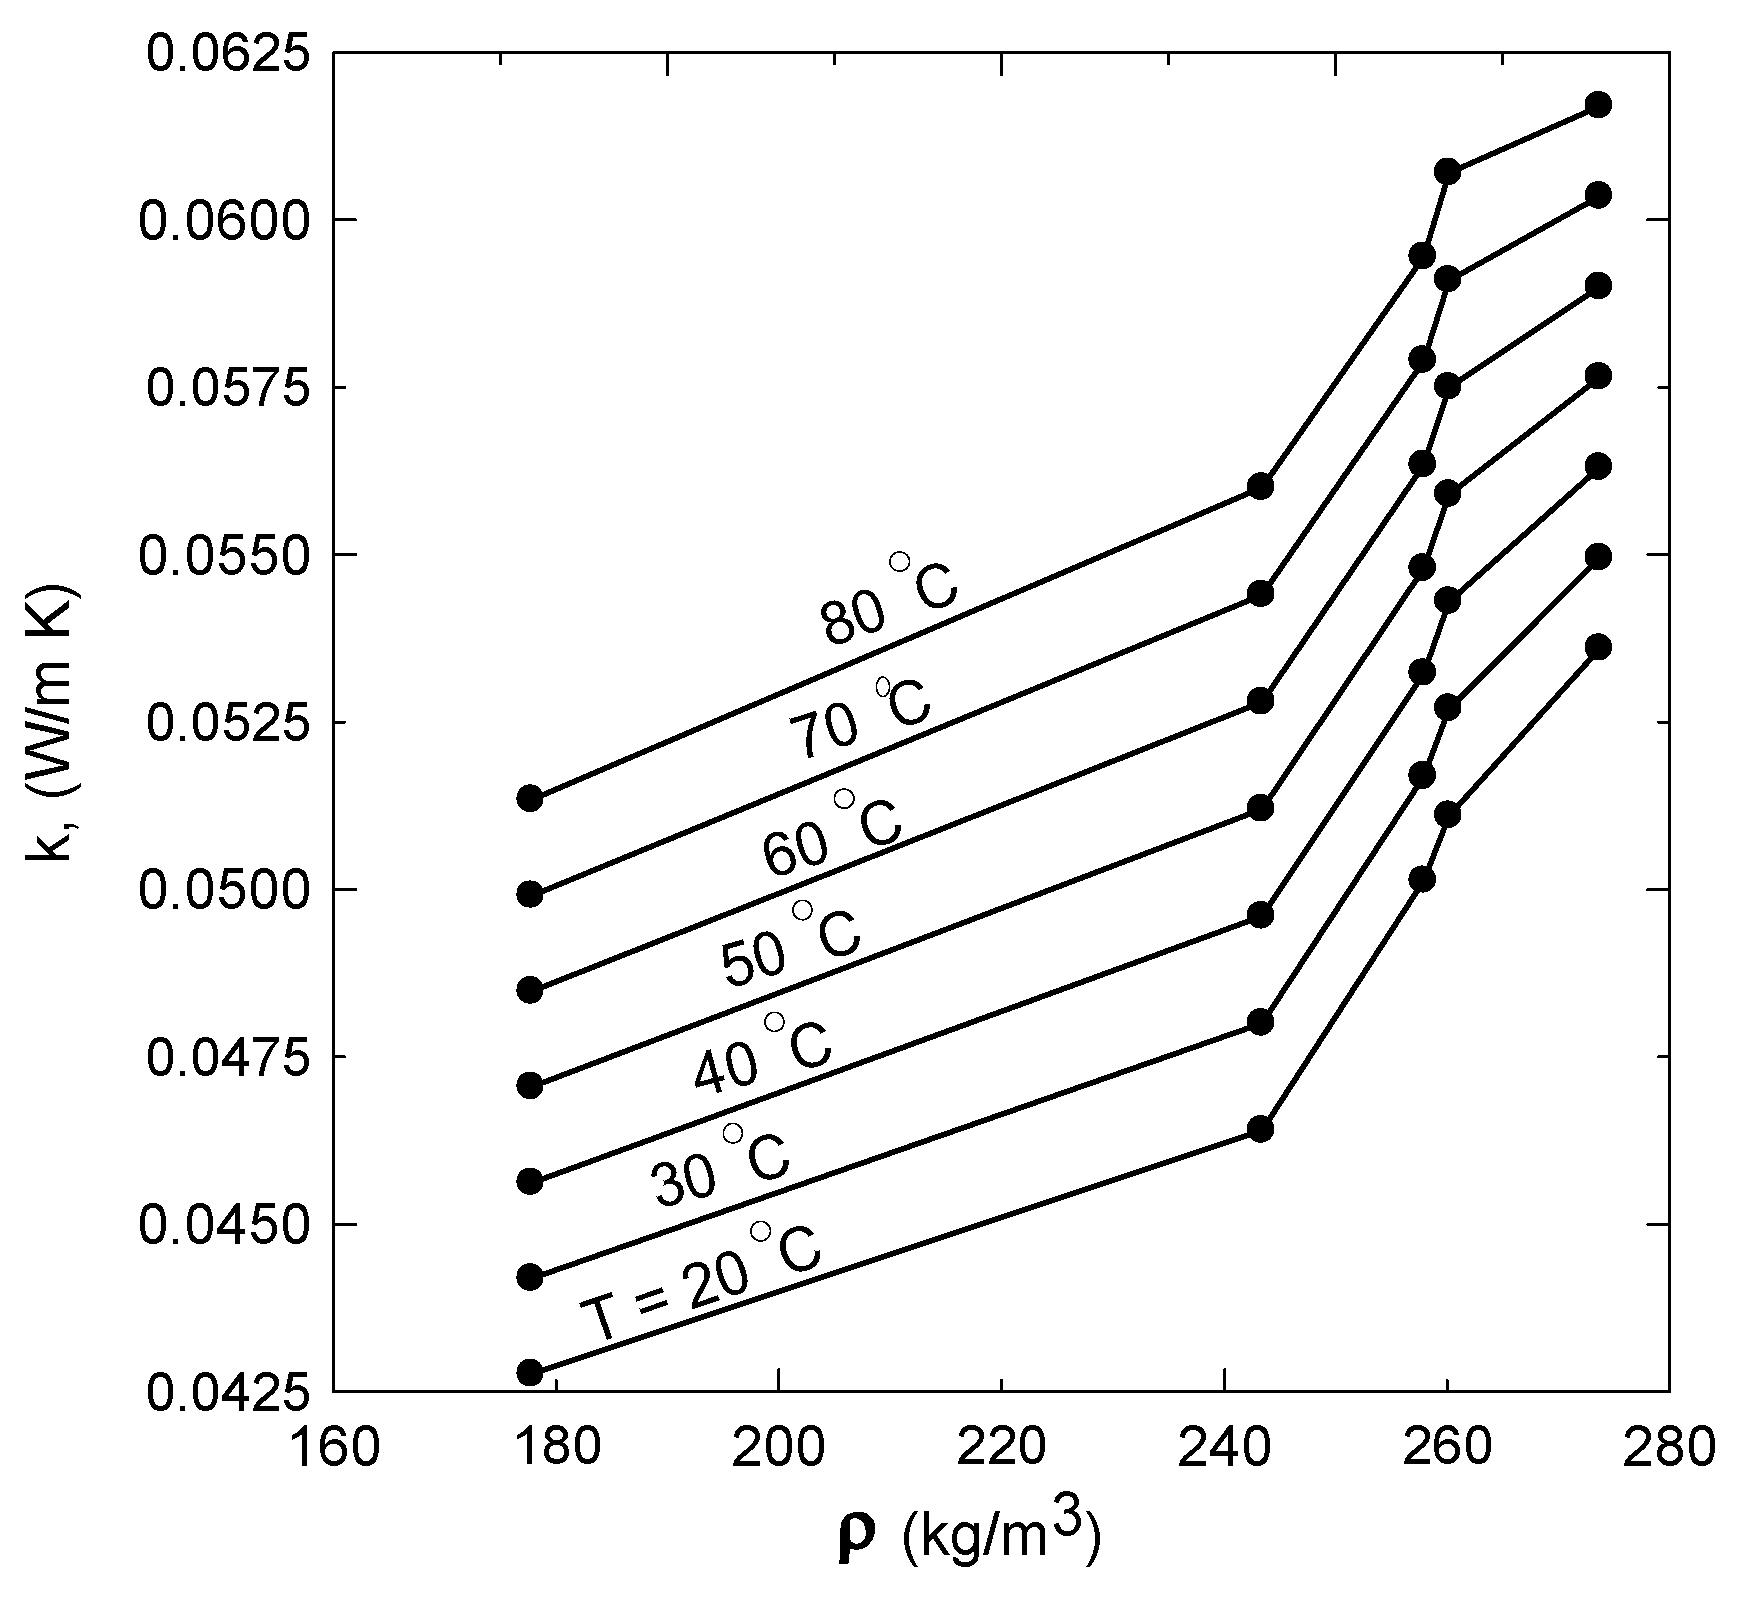
2.4. Thermal Conductivity Coefficient Measurement
2.5. Thermal Property Analysis
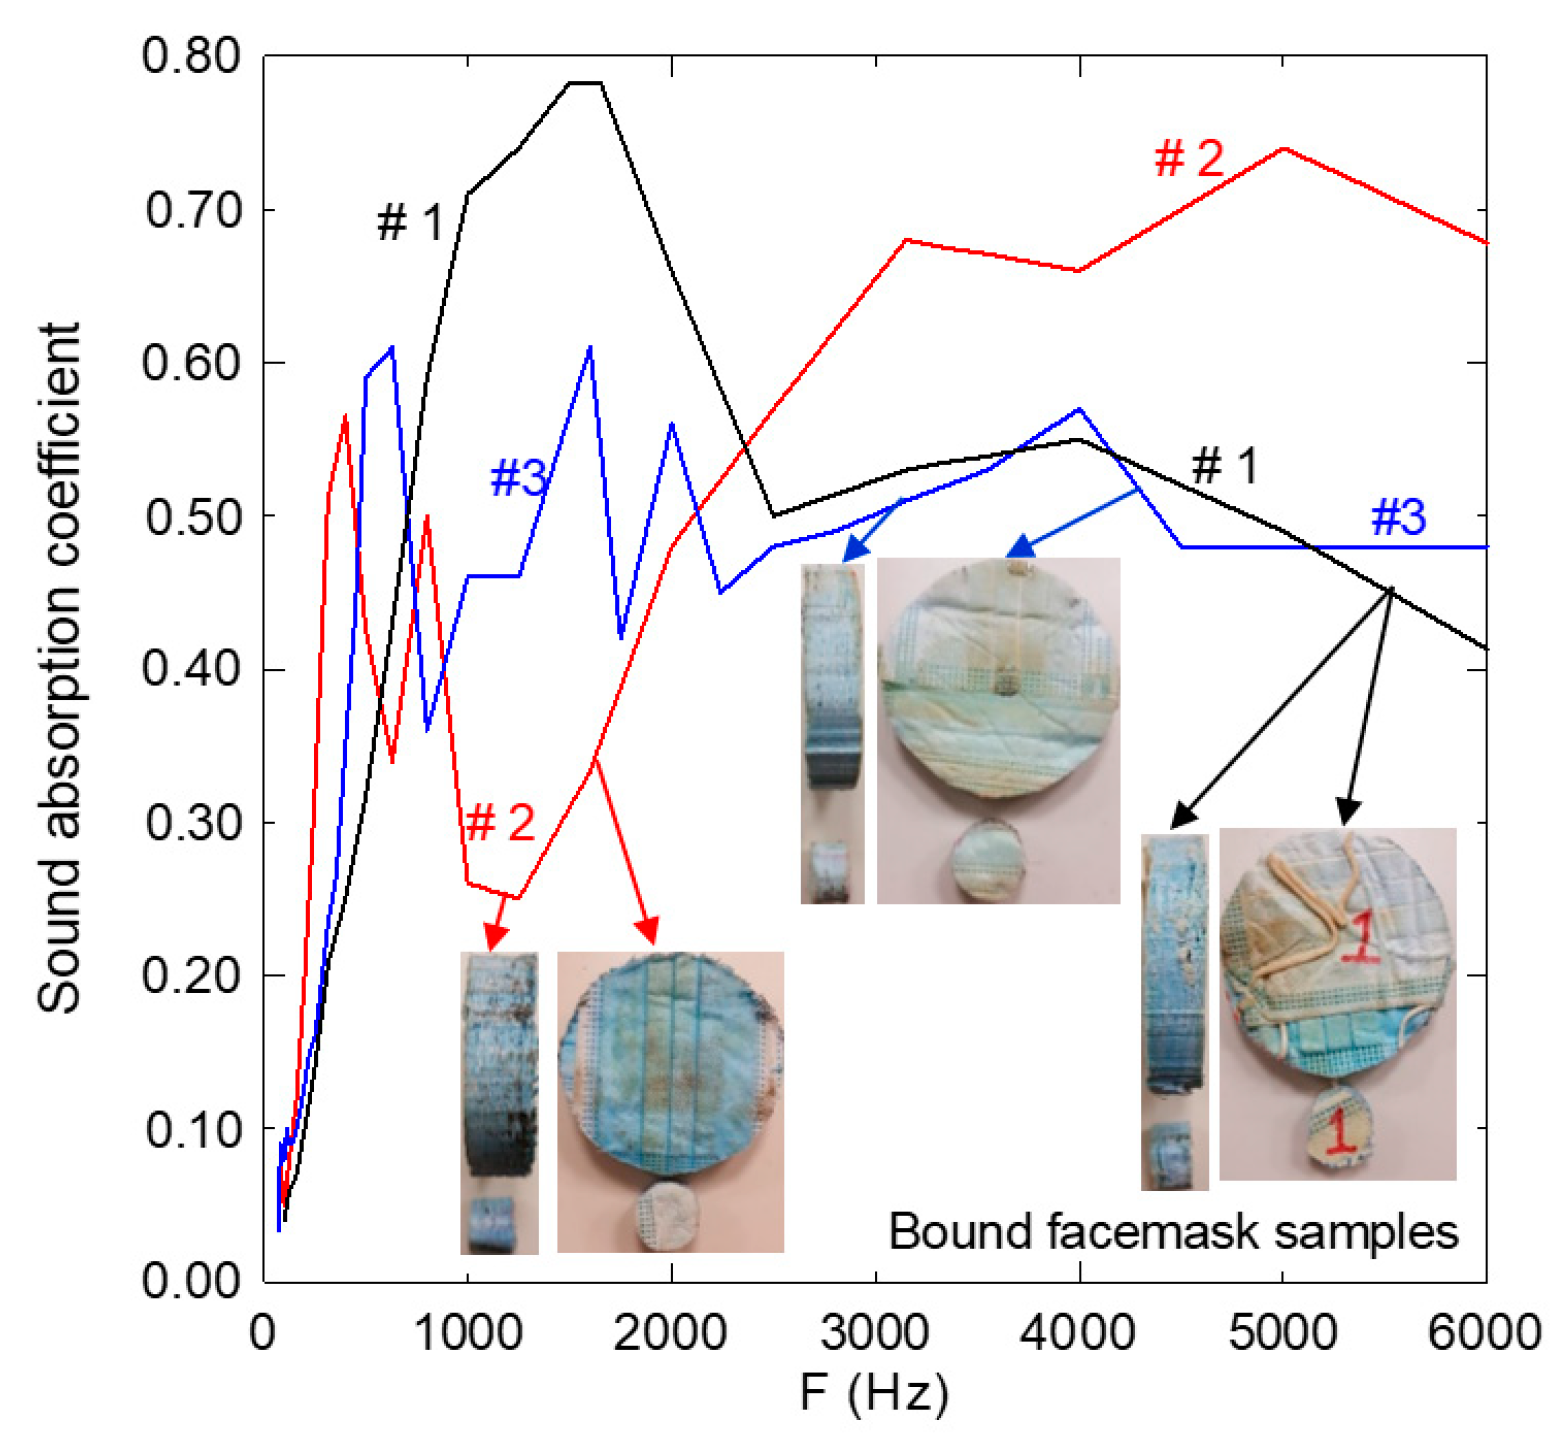
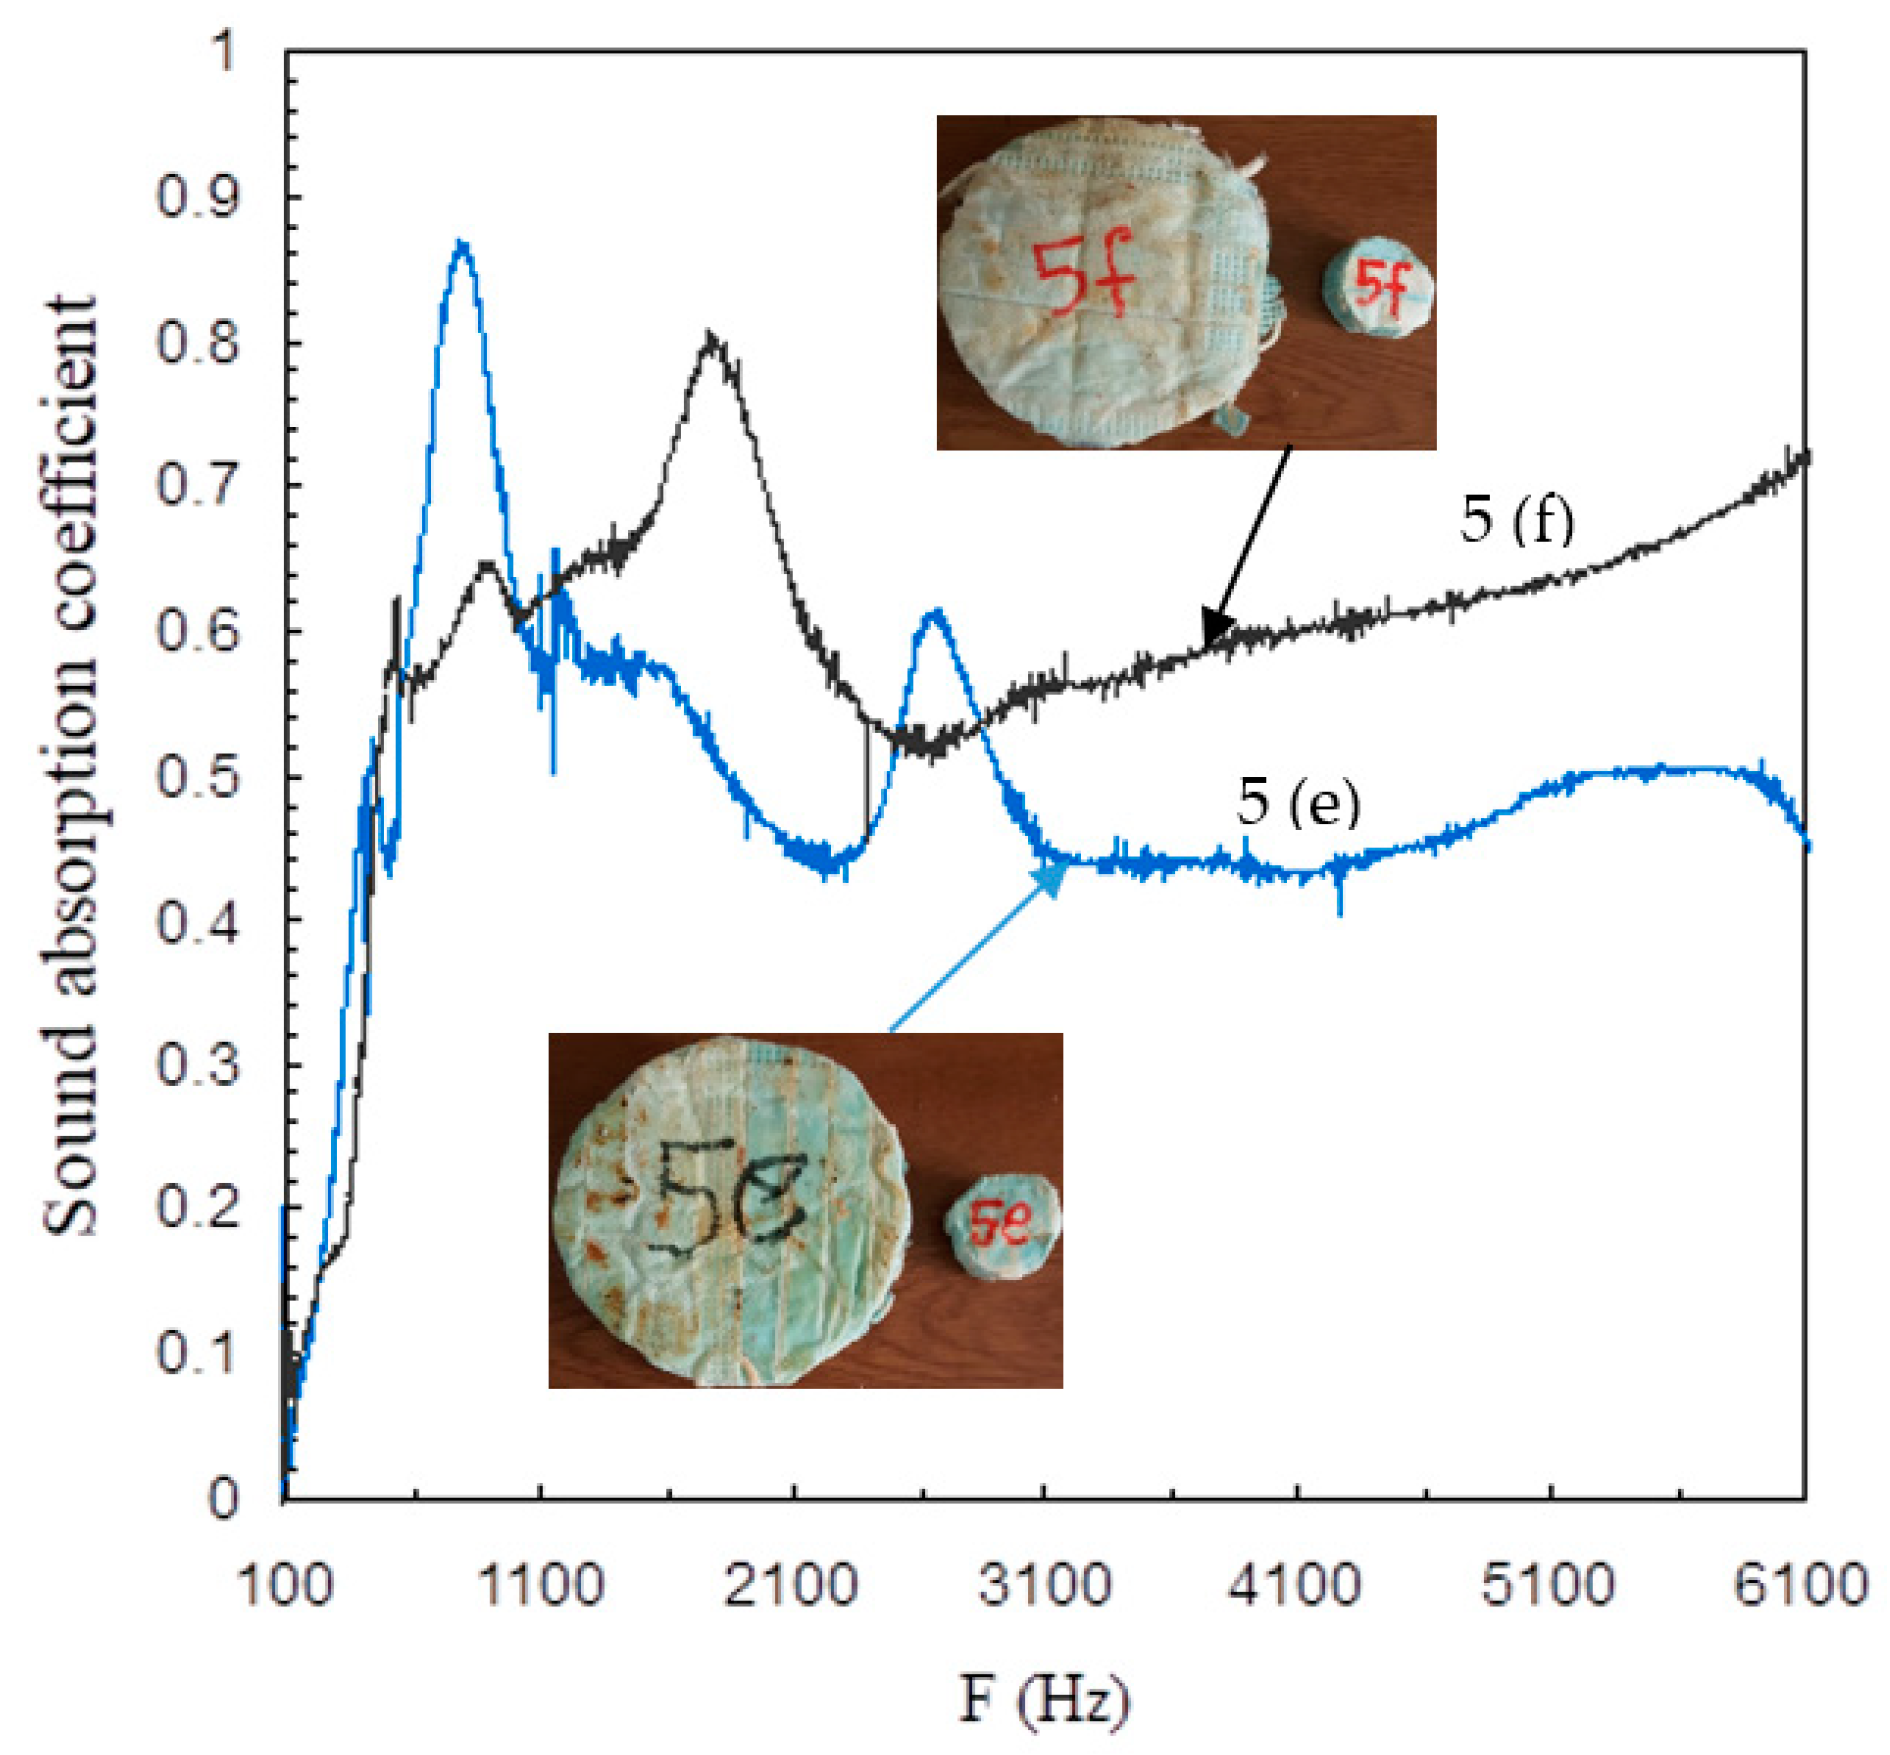
2.6. Sound Absorption Coefficient Determination
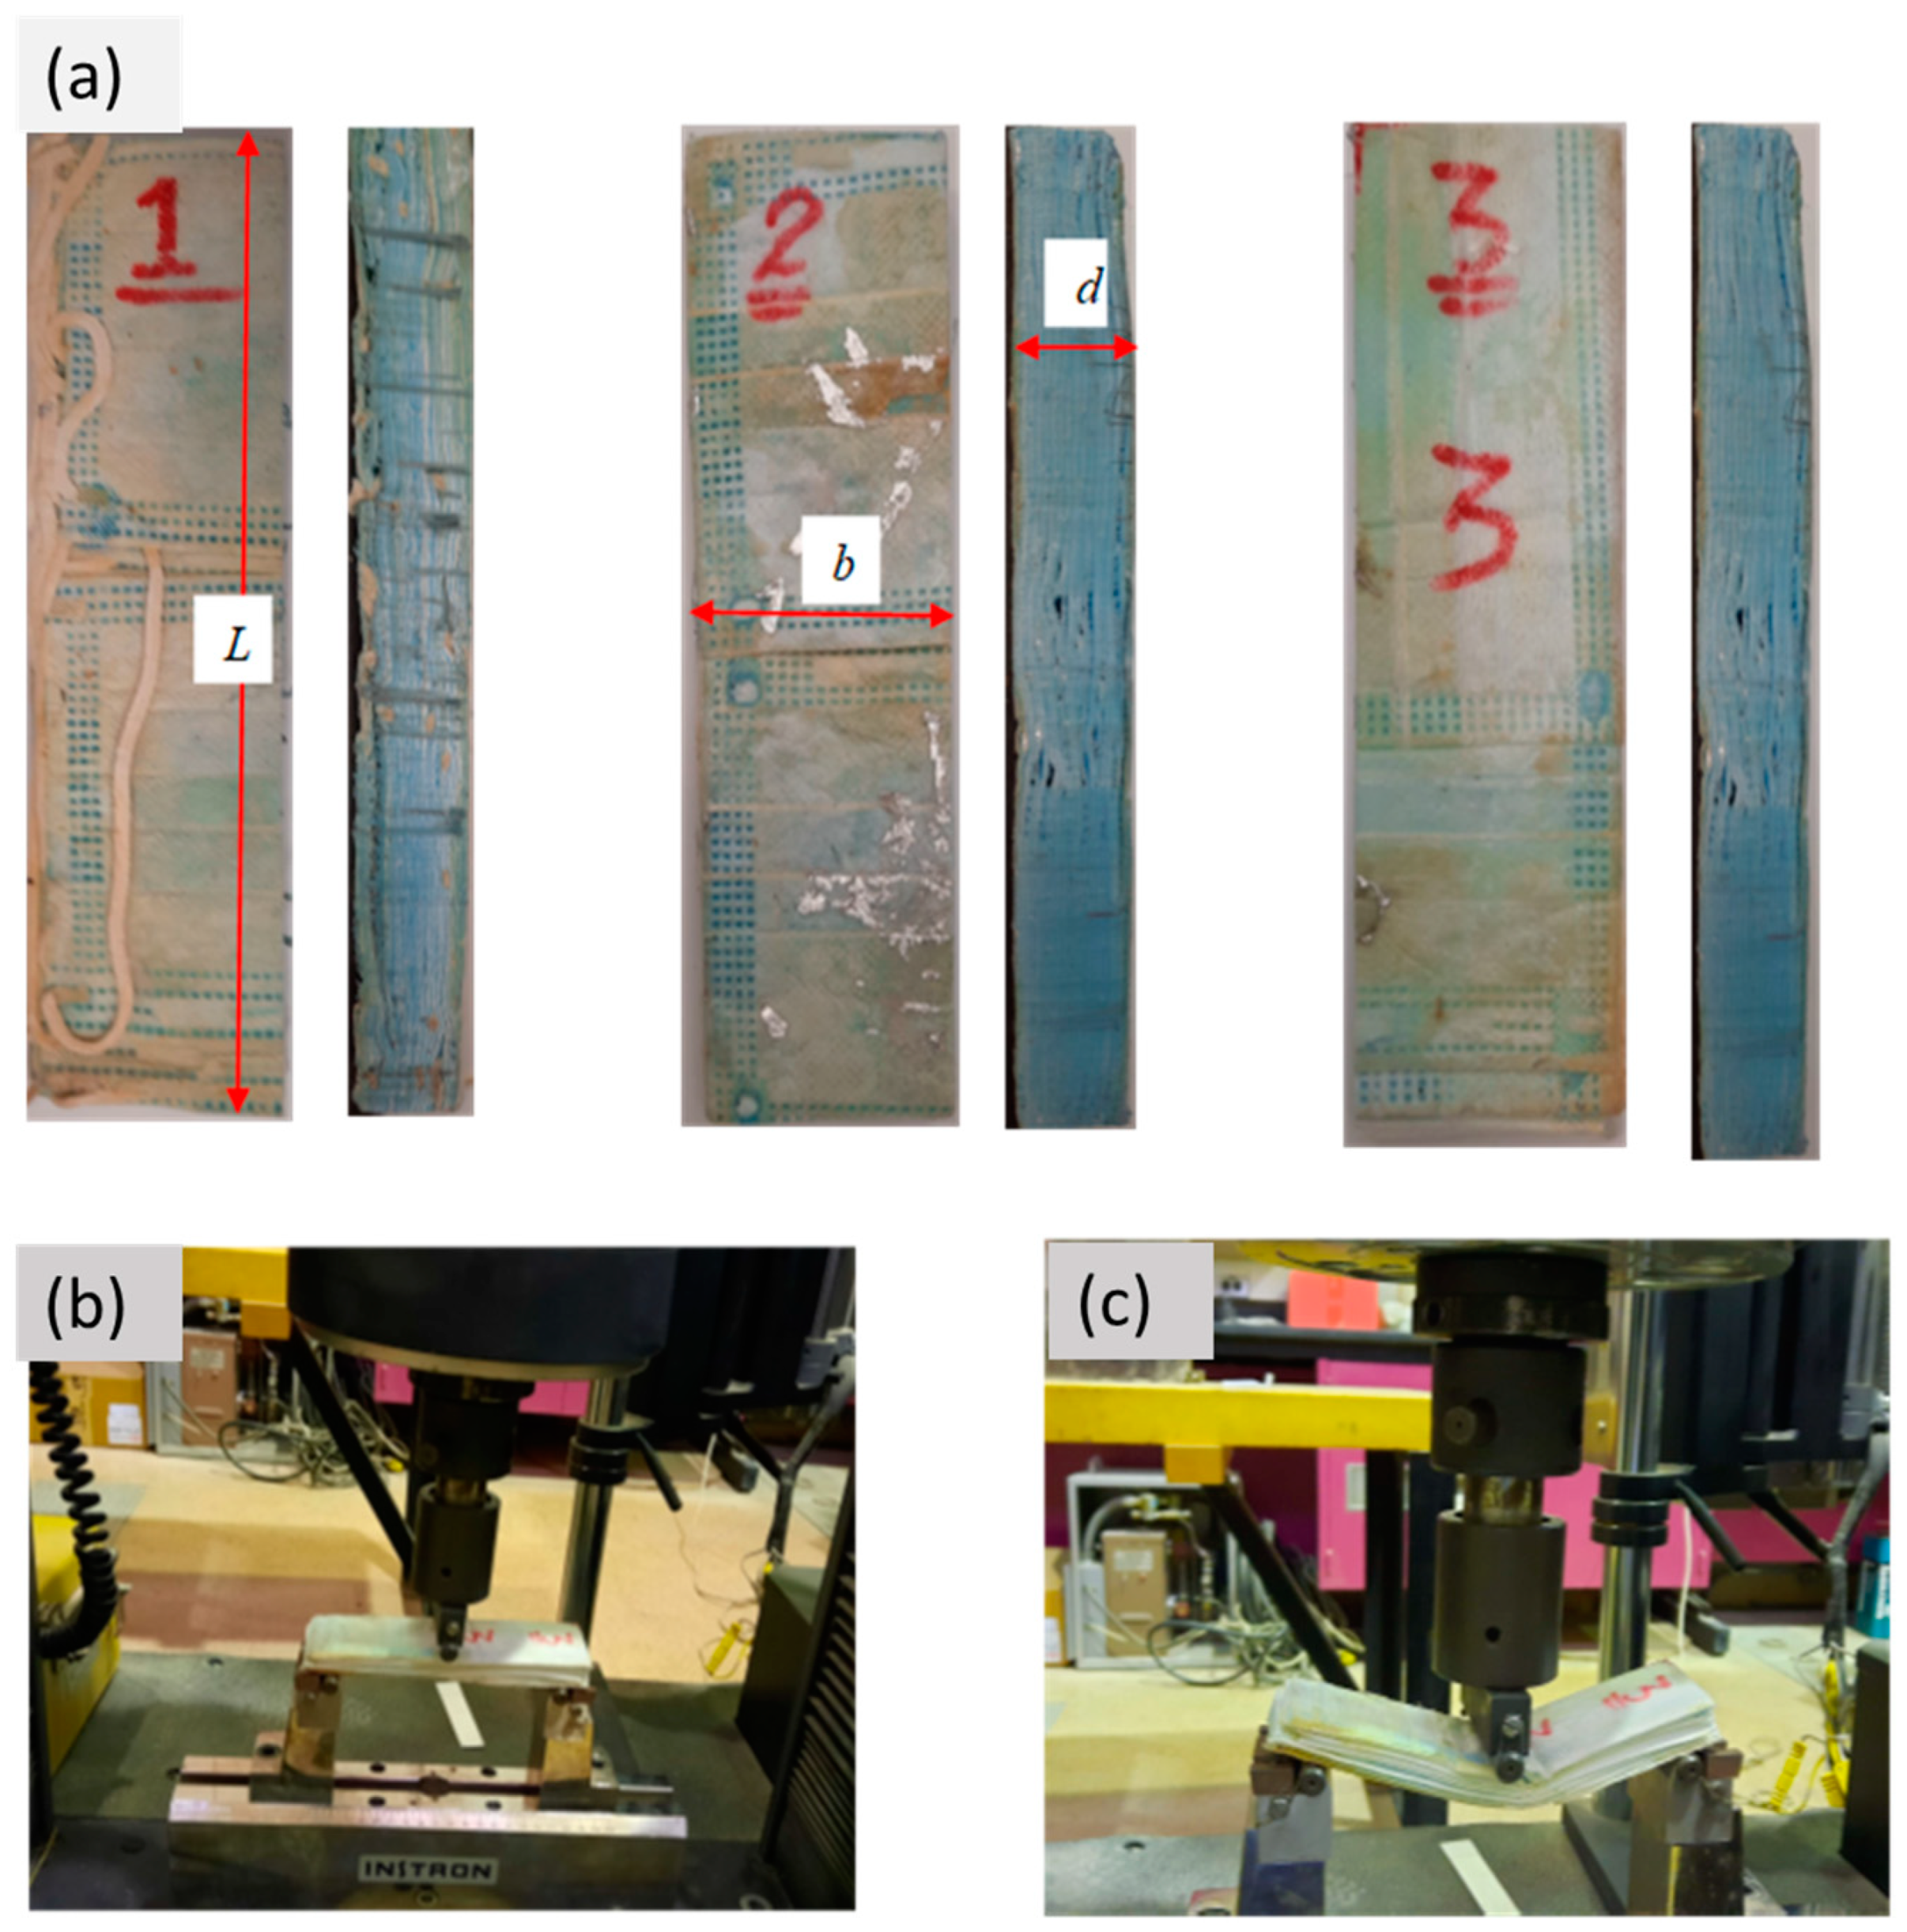
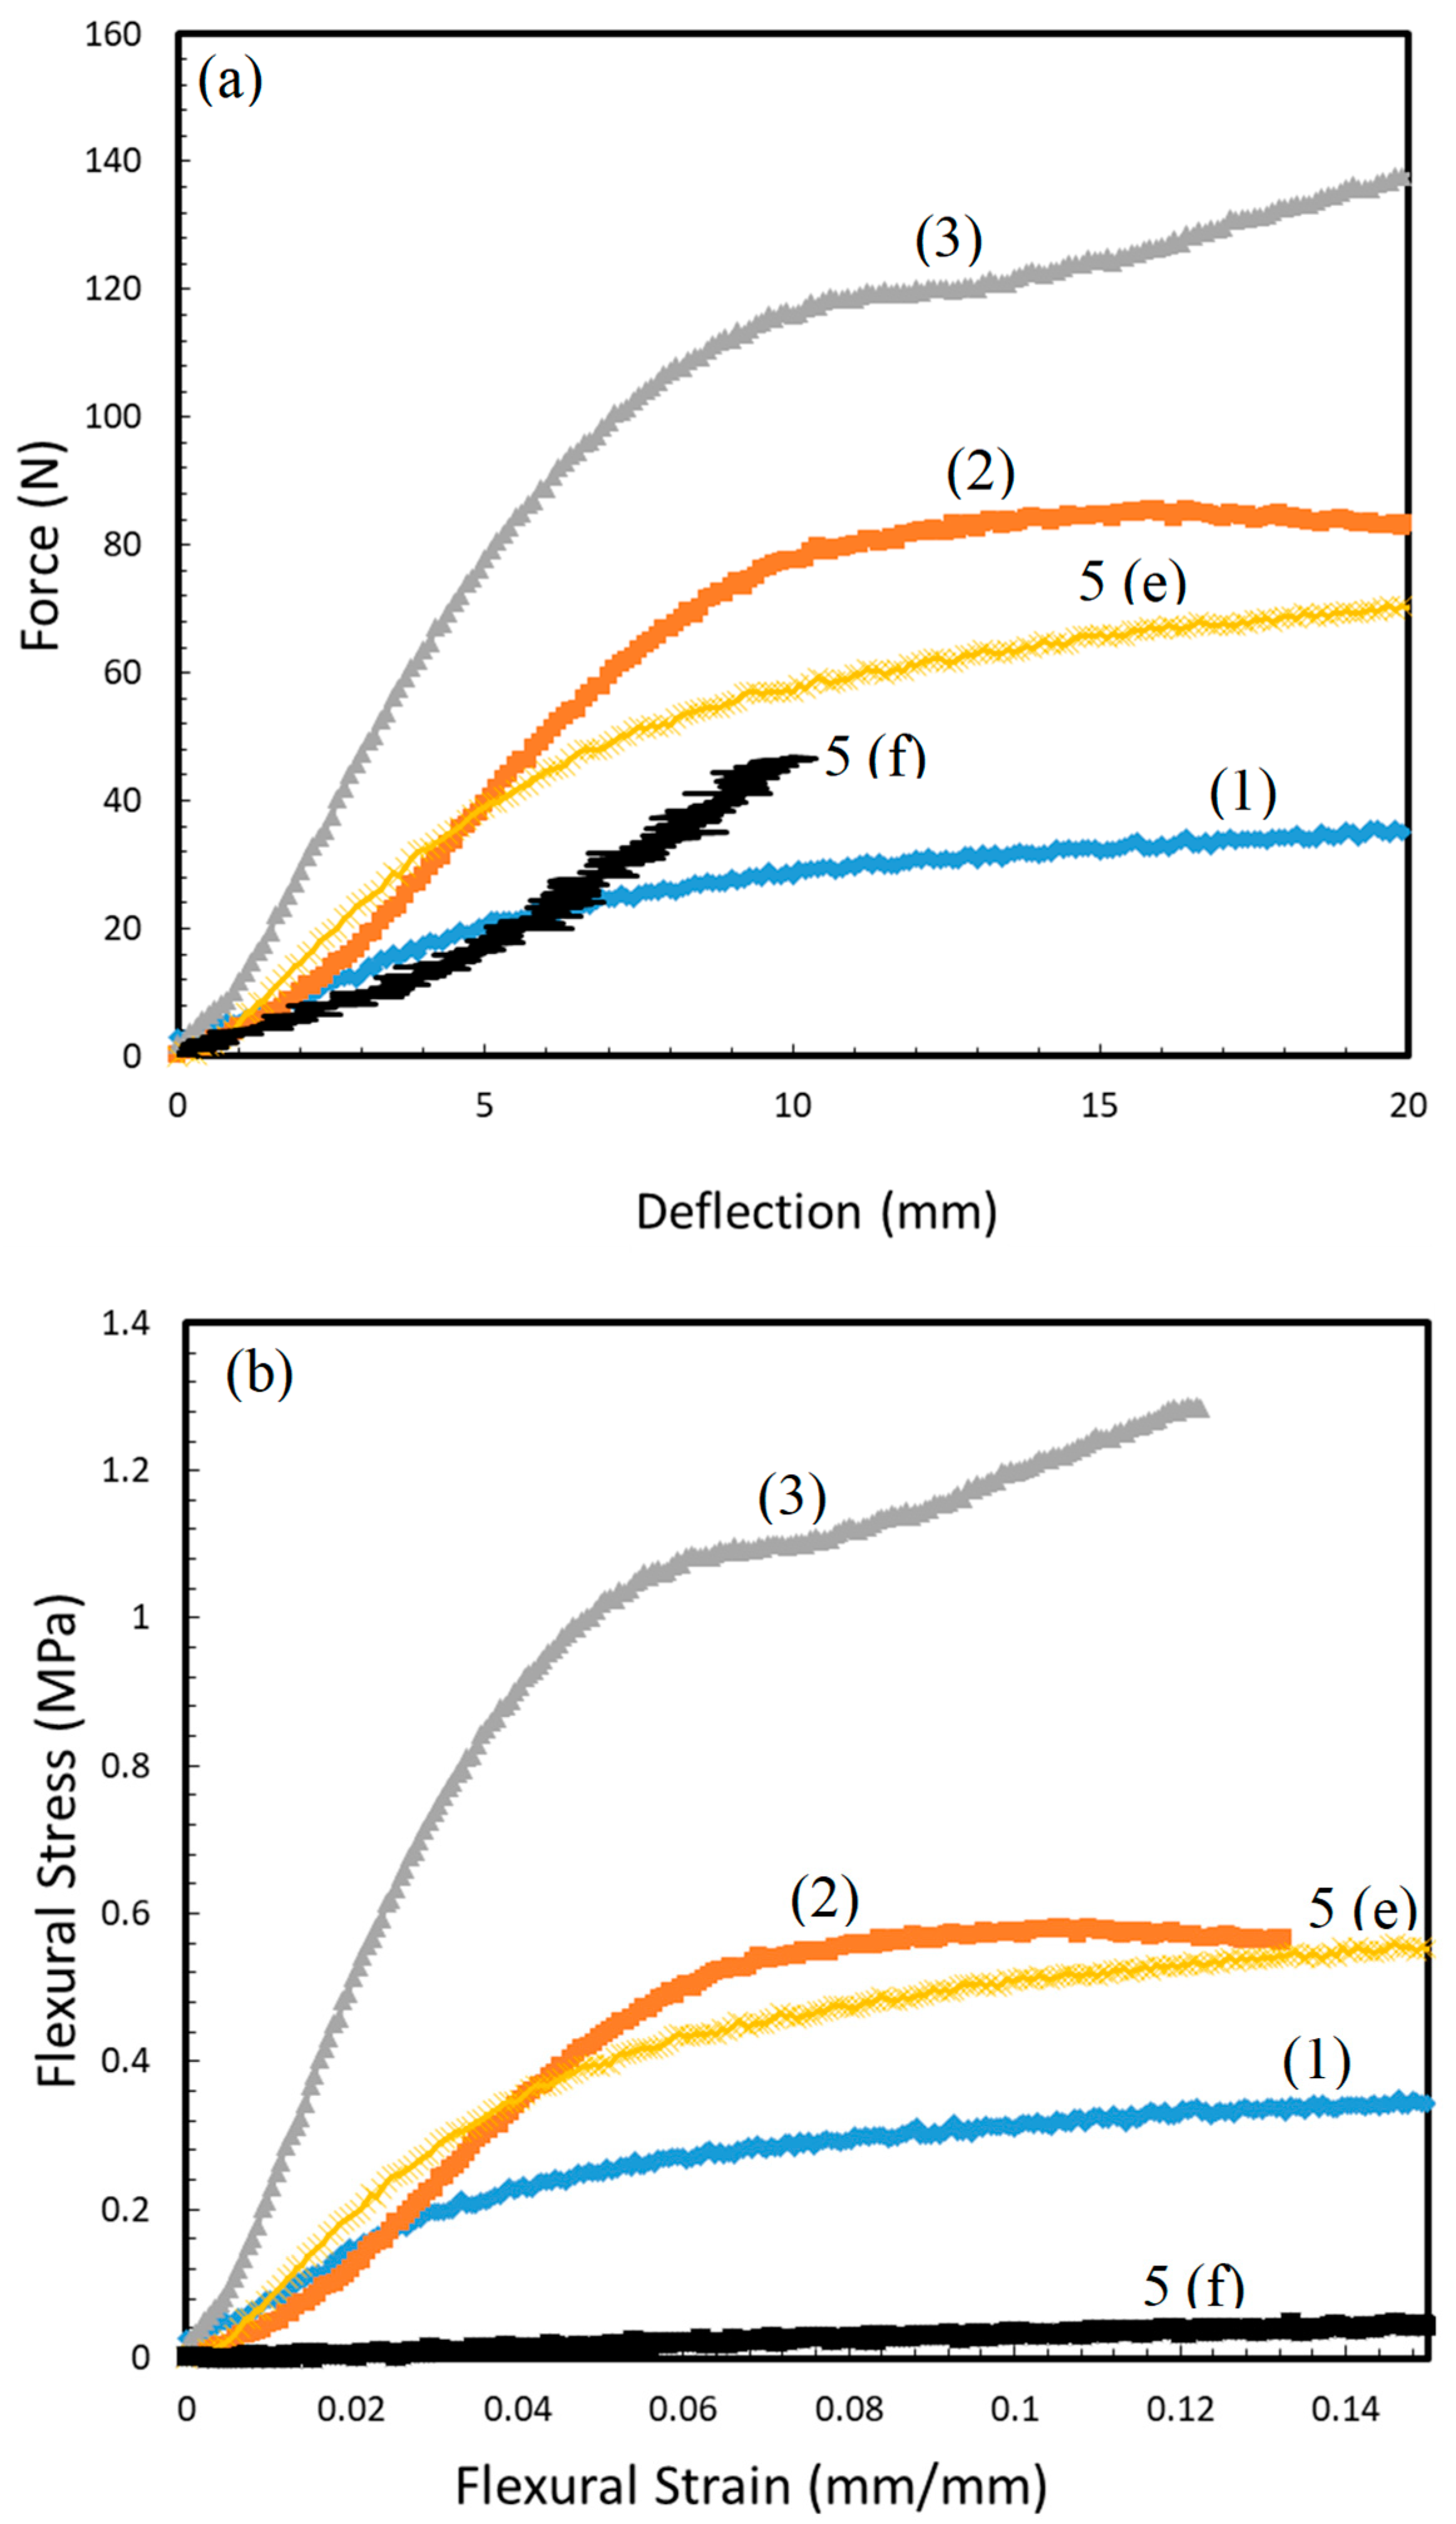
2.7. Bending Moment Tests of the Composite Samples
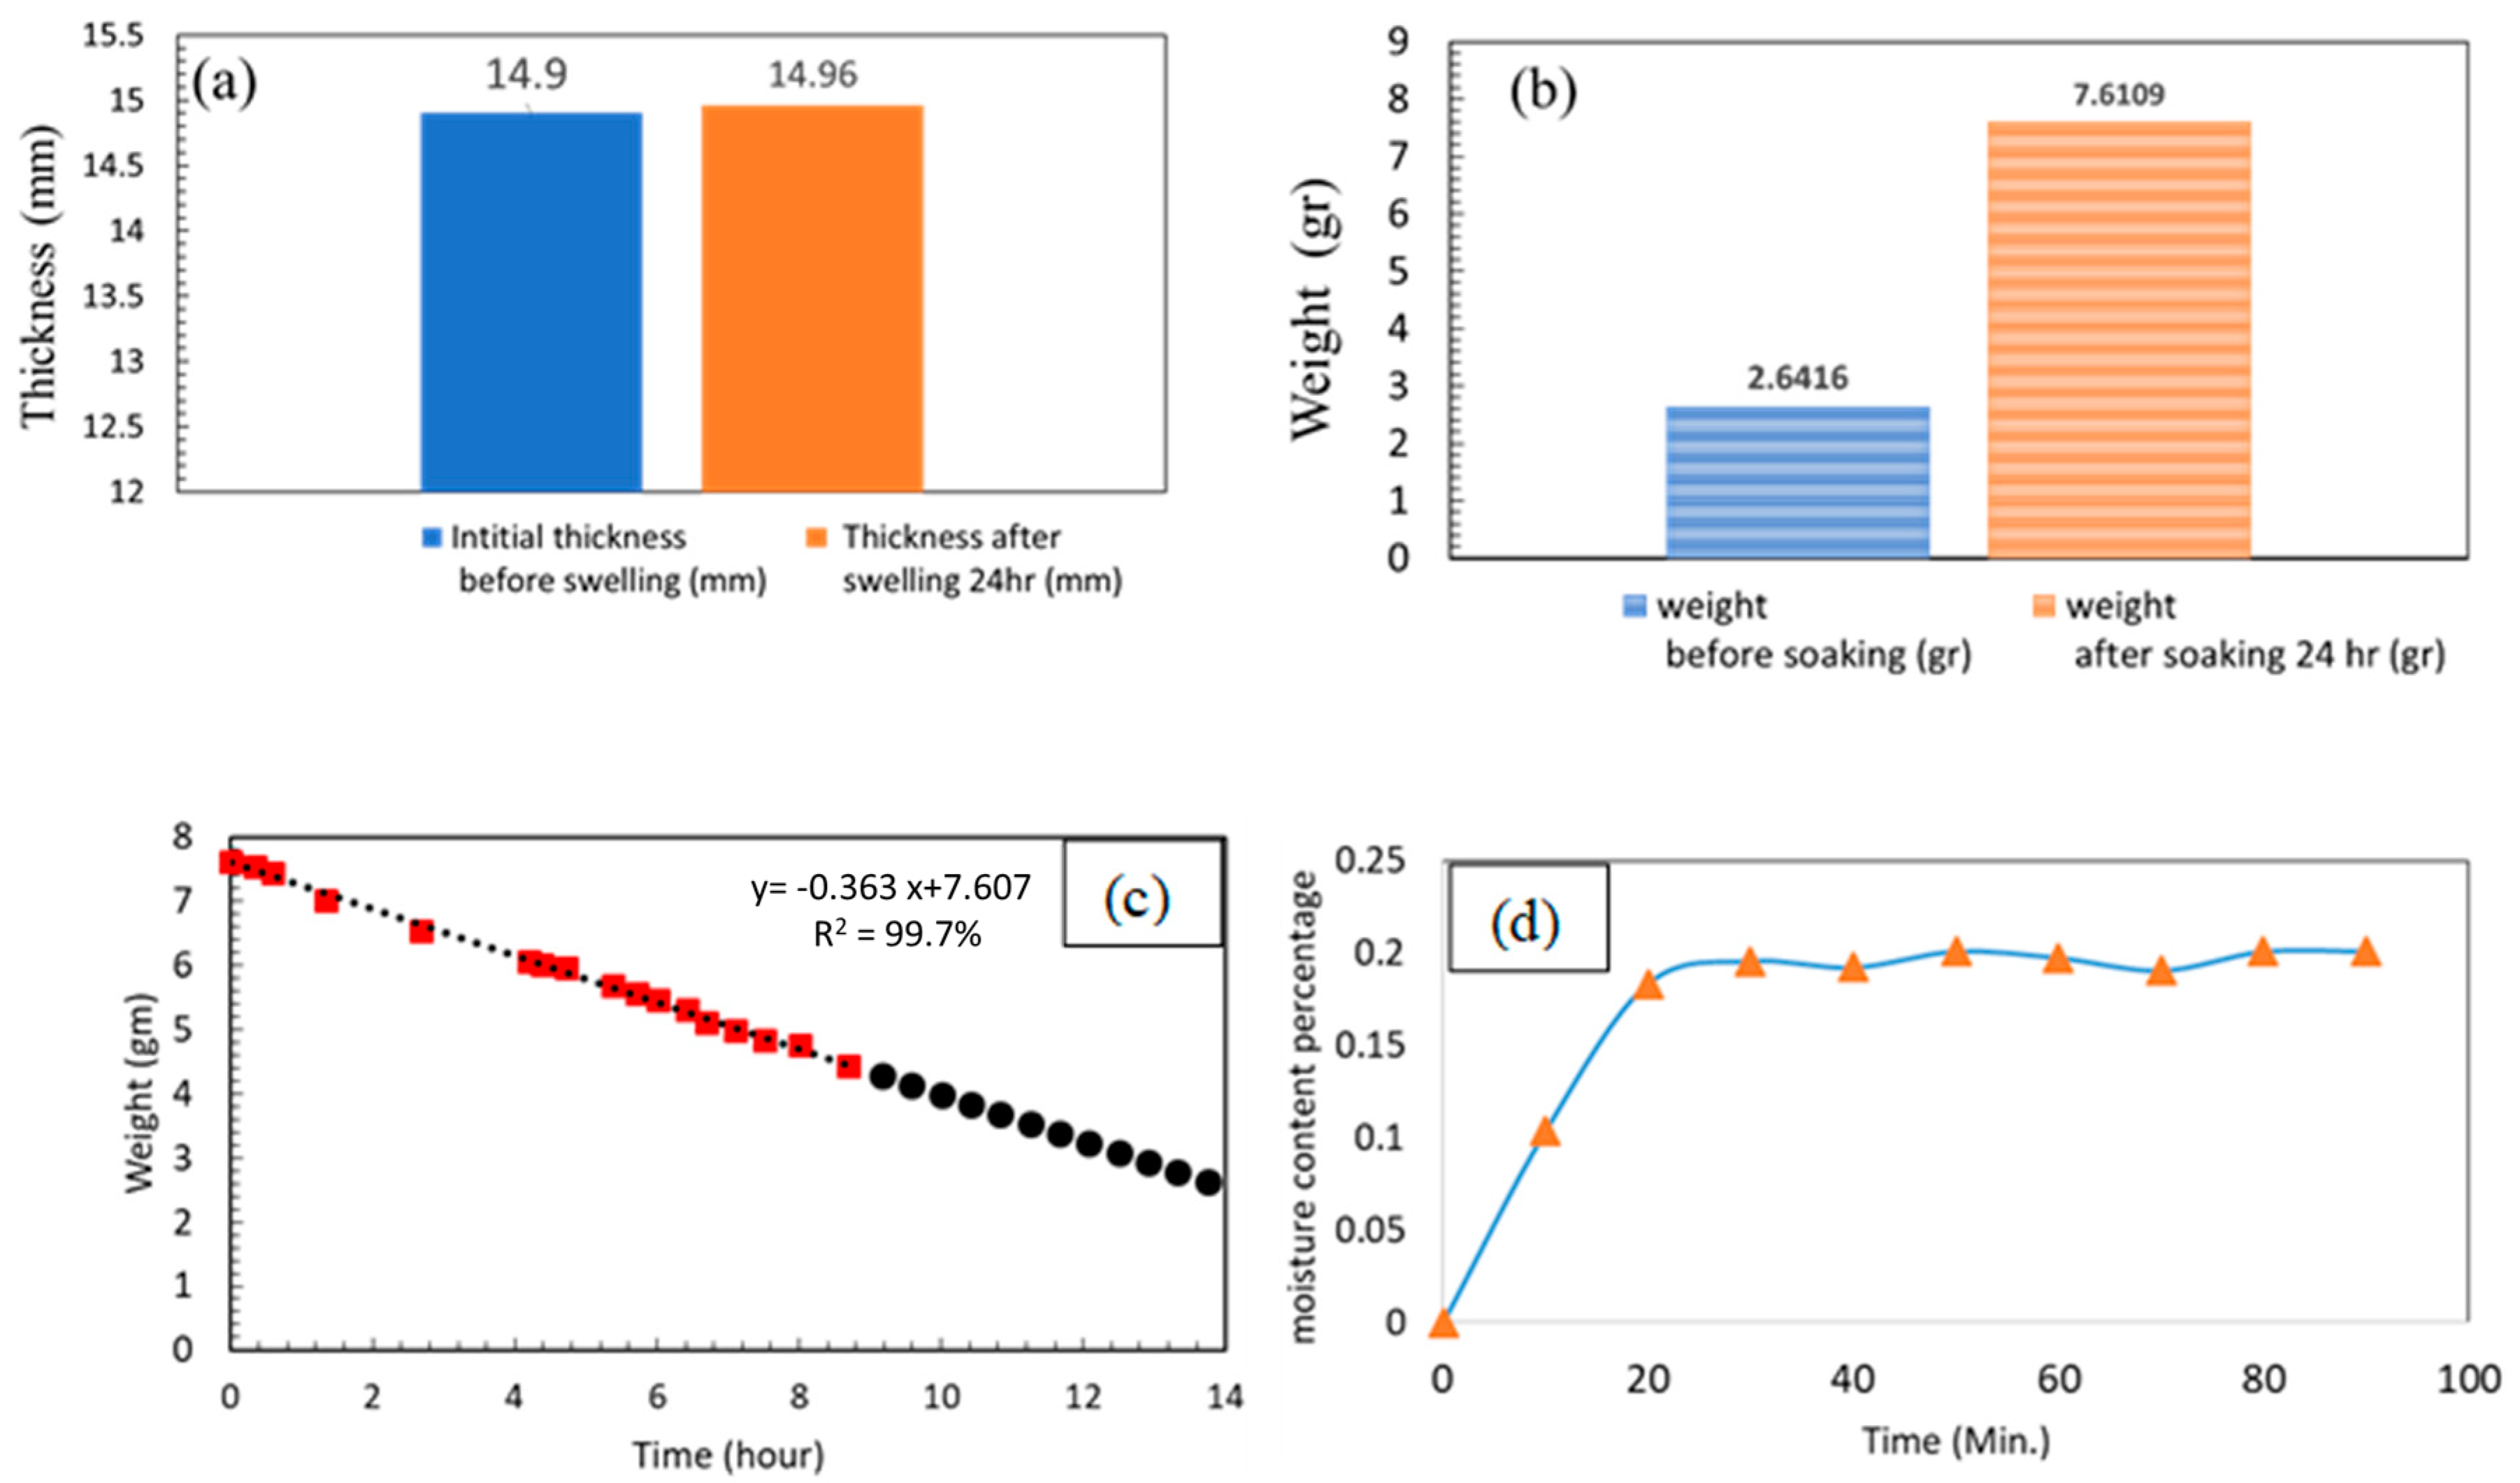
2.8. Swelling and Moisture Content Tests
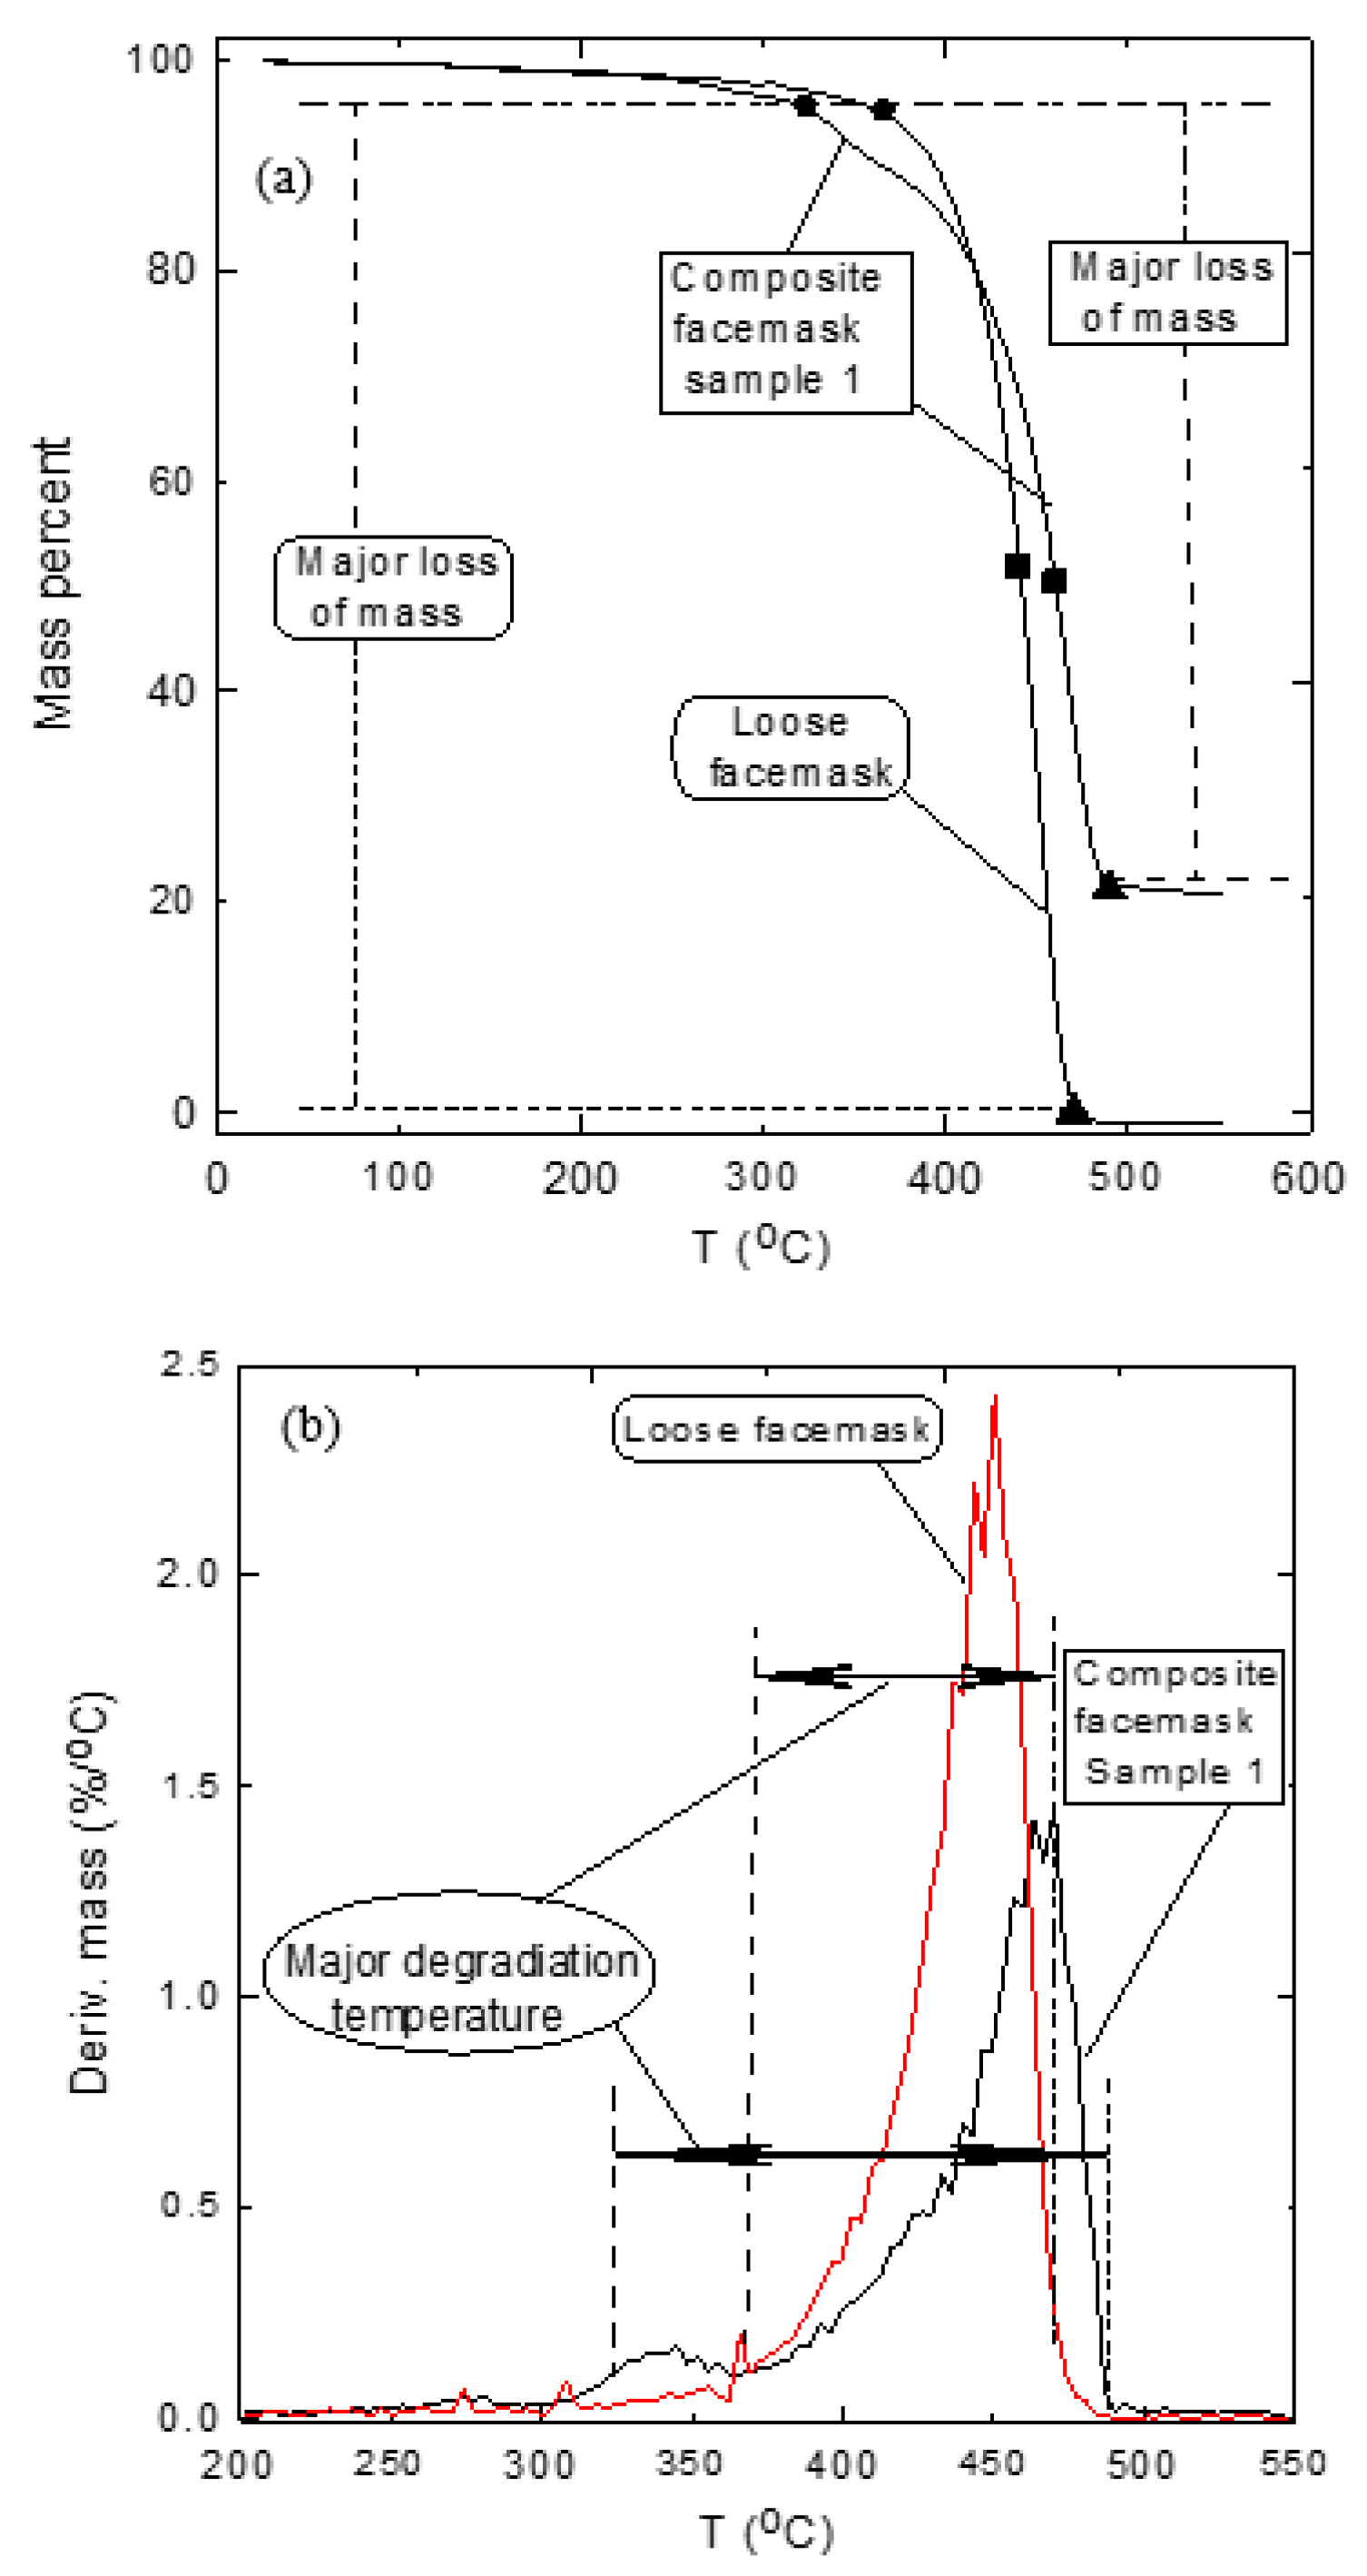
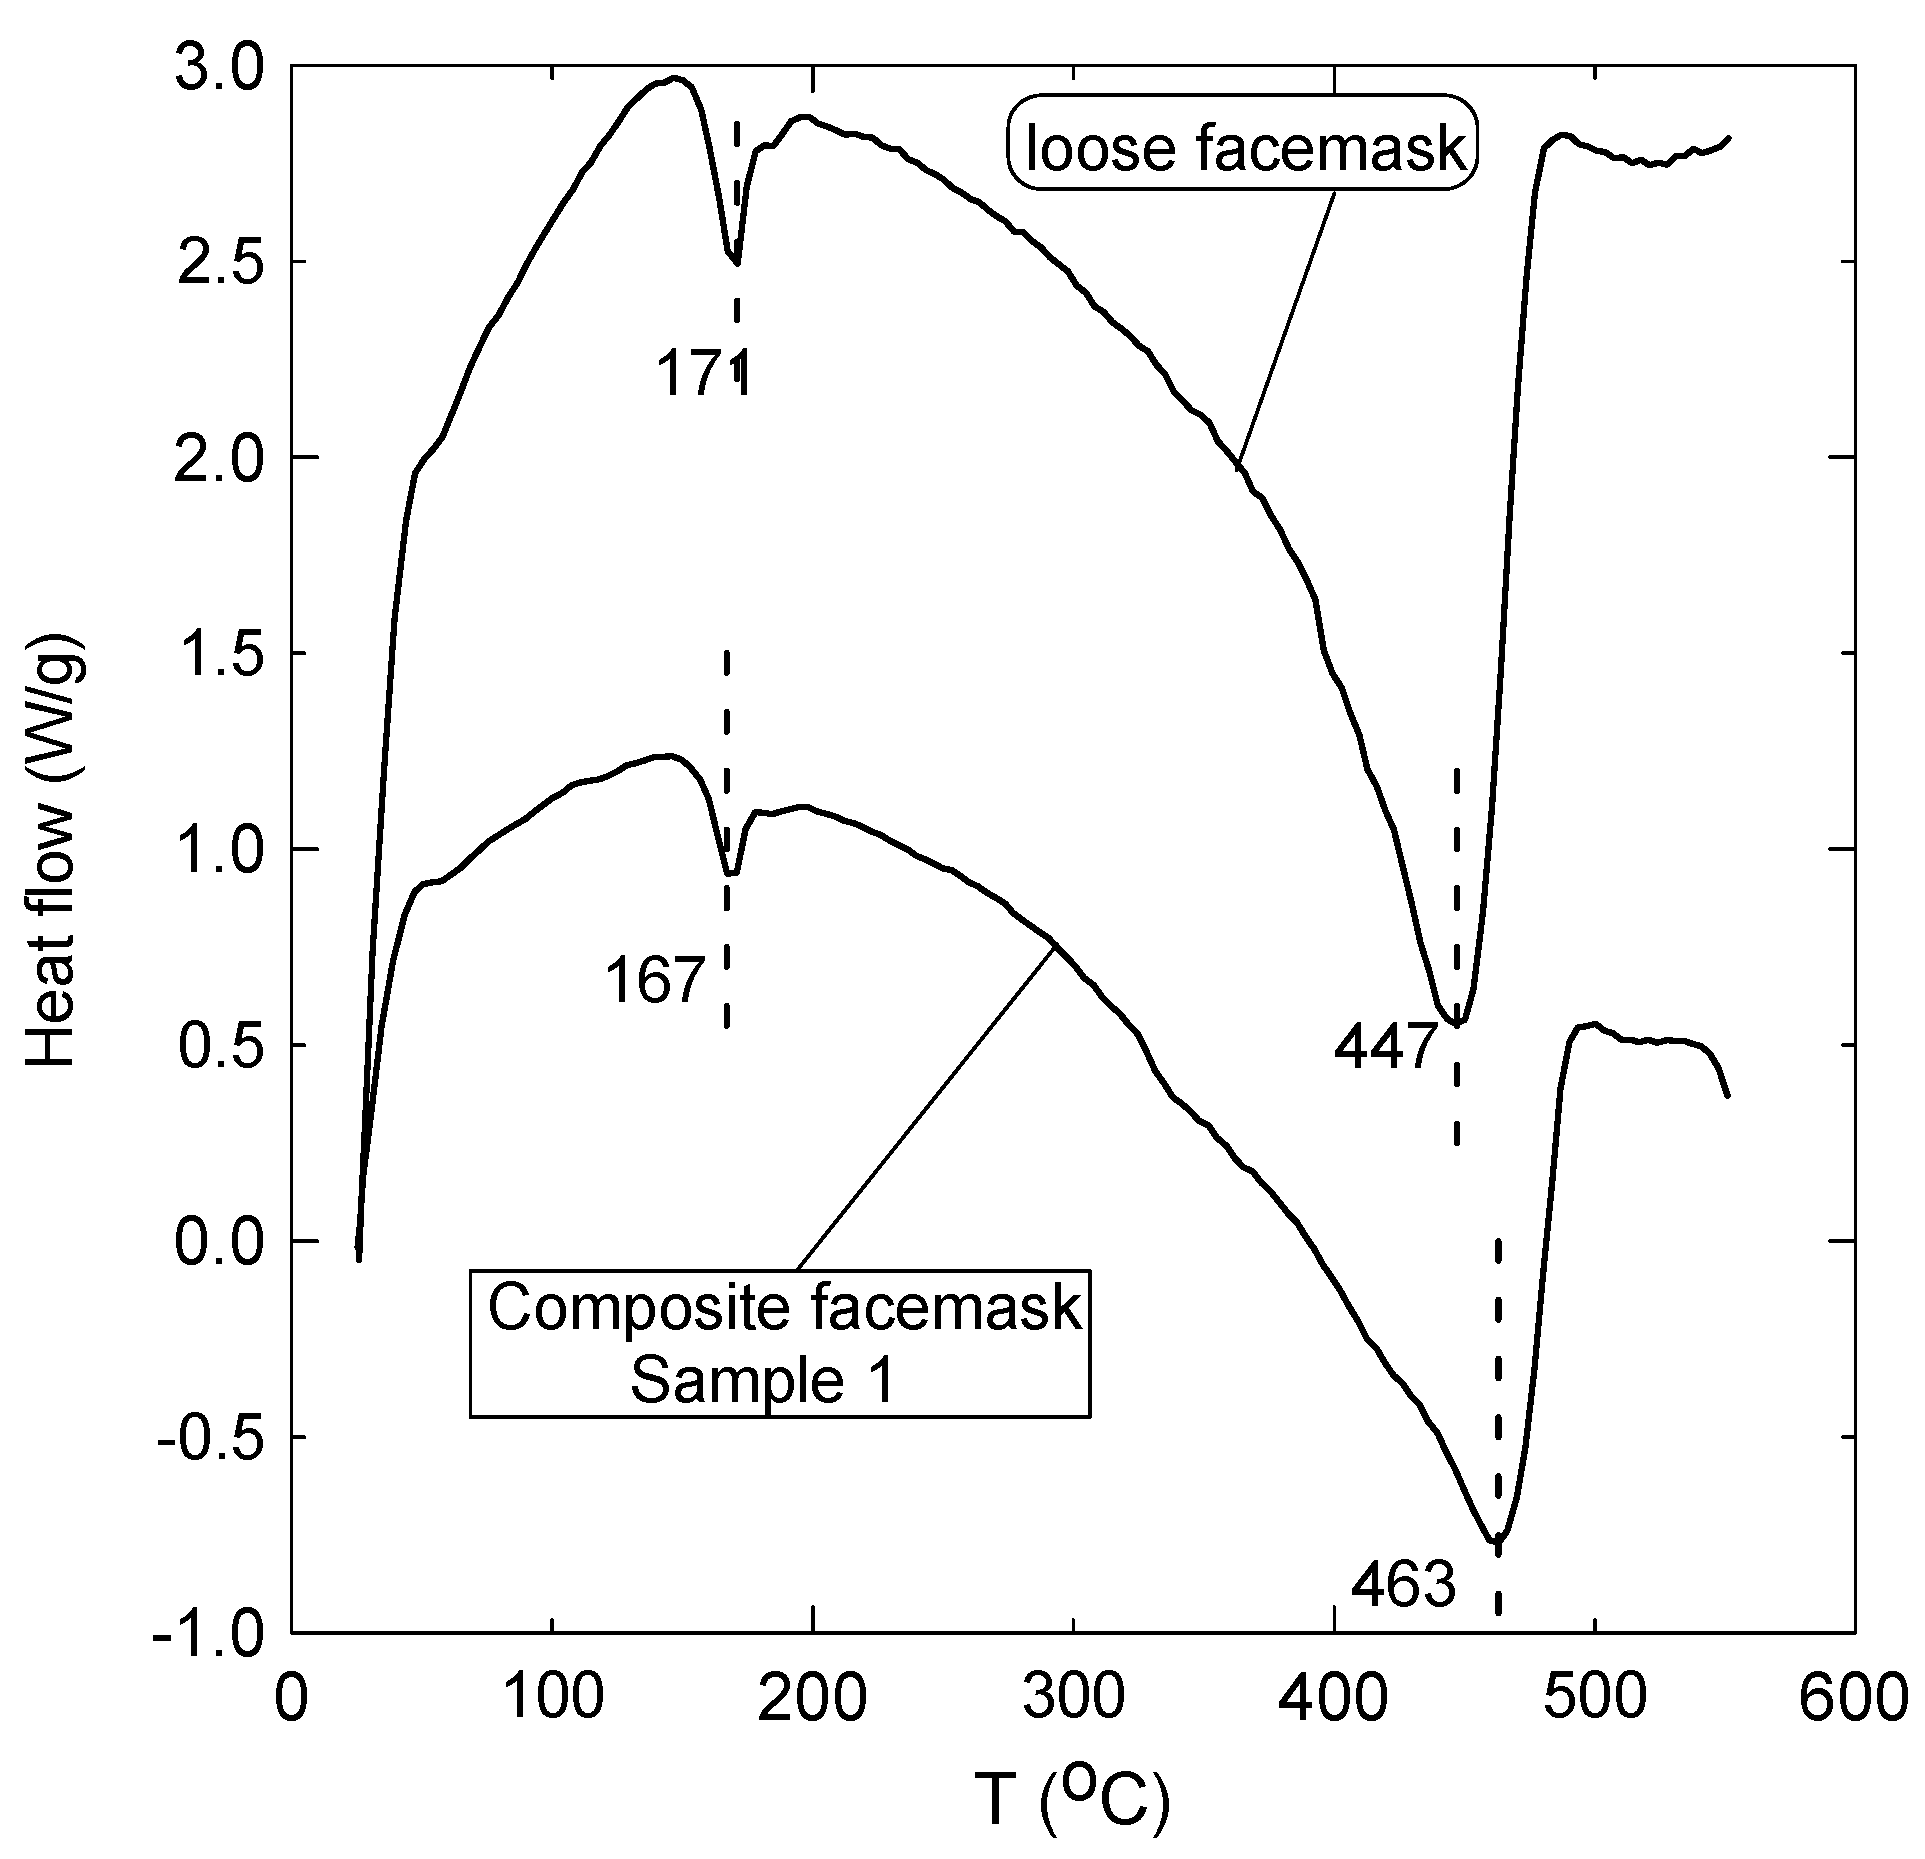
3. Results and Discussion
4. Conclusions
Author Contributions
Funding
Data Availability Statement
Conflicts of Interest
References
- Xu, E.G.; Ren, Z.J. Preventing masks from becoming the next plastic problem. Front. Environ. Sci. Eng. 2021, 15, 125. [Google Scholar] [CrossRef] [PubMed]
- Prata, J.C.; Silva, A.L.; Walker, T.R.; Duarte, A.C.; Rocha-Santos, T. COVID-19 pandemic repercussions on the use and management of plastics. Environ. Sci. Technol. 2020, 54, 7760–7765. [Google Scholar] [CrossRef]
- Silva, A.L.P.; Prata, J.C.; Duarte, A.C.; Barcelò, D.; Rocha-Santos, T. An urgent call to think globally and act locally on landfill disposable plastics under and after covid-19 pandemic: Pollution prevention and technological (Bio) remediation solutions. Chem. Eng. J. 2021, 426, 131201. [Google Scholar] [CrossRef] [PubMed]
- Torres, F.G.; De-la-Torre, G.E. Face mask waste generation and management during the COVID-19 pandemic: An overview and the Peruvian case. Sci. Total Environ. 2021, 786, 147628. [Google Scholar] [CrossRef]
- Zorko, D.J.; Gertsman, S.; O’Hearn, K.; Timmerman, N.; Ambu-Ali, N.; Dinh, T.; Sampson, M.; Sikora, L.; McNally, J.D.; Choong, K. Decontamination interventions for the reuse of surgical mask personal protective equipment: A systematic review. J. Hosp. Infect. 2020, 106, 283–294. [Google Scholar] [CrossRef]
- Côrtes, M.F.; Espinoza, E.P.S.; Noguera, S.L.V.; Silva, A.A.; de Medeiros, M.E.S.A.; Boas, L.S.V.; Ferreira, N.E.; Tozetto-Mendoza, T.R.; Morais, F.G.; de Queiroz, R.S. Decontamination and re-use of surgical masks and respirators during the COVID-19 pandemic. Int. J. Infect. Dis. 2021, 104, 320–328. [Google Scholar] [CrossRef] [PubMed]
- National Health Commission of the People’s Republic of China. Prevention and Control Program of COVID-19, 4th ed.; General Office of National Health Commission of the People’s Republic of China: Beijing, China, 2020. Available online: http://www.nhc.gov.cn/jkj/s3577/202002/573340613ab243b3a7f61df260551dd4/files/c791e5a7ea5149f680fdcb34dac0f54e.pdf (accessed on 1 May 2020).
- Wang, D.; Sun, B.-C.; Wang, J.-X.; Zhou, Y.-Y.; Chen, Z.-W.; Fang, Y.; Yue, W.-H.; Liu, S.-M.; Liu, K.-Y.; Zeng, X.-F. Can masks be reused after hot water decontamination during the COVID-19 pandemic? Engineering 2020, 6, 1115–1121. [Google Scholar] [CrossRef]
- Abraham, J.P.; Plourde, B.D.; Cheng, L. Using heat to kill SARS-CoV-2. Rev. Med. Virol. 2020, 30, e2115. [Google Scholar] [CrossRef] [PubMed]
- Saberian, M.; Li, J.; Kilmartin-Lynch, S.; Boroujeni, M. Repurposing of COVID-19 single-use face masks for pavements base/subbase. Sci. Total Environ. 2021, 769, 145527. [Google Scholar] [CrossRef]
- Koniorczyk, M.; Bednarska, D.; Masek, A.; Cichosz, S. Performance of concrete containing recycled masks used for personal protection during coronavirus pandemic. Constr. Build. Mater. 2022, 324, 126712. [Google Scholar] [CrossRef]
- Ali, M.; Opulencia, M.J.C.; Chandra, T.; Chandra, S.; Muda, I.; Dias, R.; Chetthamrongchai, P.; Jalil, A.T. An environmentally friendly solution for waste facial masks recycled in construction materials. Sustainability 2022, 14, 8739. [Google Scholar] [CrossRef]
- ur Rehman, Z.; Khalid, U. Reuse of COVID-19 face mask for the amelioration of mechanical properties of fat clay: A novel solution to an emerging waste problem. Sci. Total Environ. 2021, 794, 148746. [Google Scholar] [CrossRef]
- Kilmartin-Lynch, S.; Saberian, M.; Li, J.; Roychand, R.; Zhang, G. Preliminary evaluation of the feasibility of using polypropylene fibres from COVID-19 single-use face masks to improve the mechanical properties of concrete. J. Clean. Prod. 2021, 296, 126460. [Google Scholar] [CrossRef]
- Asim, N.; Badiei, M.; Sopian, K. Review of the valorization options for the proper disposal of face masks during the COVID-19 pandemic. Environ. Technol. Innov. 2021, 23, 101797. [Google Scholar] [CrossRef]
- Ray, S.S.; Lee, H.K.; Huyen, D.T.T.; Chen, S.-S.; Kwon, Y.-N. Microplastics waste in environment: A perspective on recycling issues from PPE kits and face masks during the COVID-19 pandemic. Environ. Technol. Innov. 2022, 26, 102290. [Google Scholar] [CrossRef] [PubMed]
- Emenike, E.C.; Iwuozor, K.O.; Agbana, S.A.; Otoikhian, K.S.; Adeniyi, A.G. Efficient recycling of disposable face masks via co-carbonization with waste biomass: A pathway to a cleaner environment. Clean. Environ. Syst. 2022, 6, 100094. [Google Scholar] [CrossRef]
- Abdullah, G.M.; Abd El Aal, A. Assessment of the reuse of Covid-19 healthy personal protective materials in enhancing geotechnical properties of Najran’s soil for road construction: Numerical and experimental study. J. Clean. Prod. 2021, 320, 128772. [Google Scholar] [CrossRef] [PubMed]
- Chen, X.; Chen, X.; Liu, Q.; Zhao, Q.; Xiong, X.; Wu, C. Used disposable face masks are significant sources of microplastics to environment. Environ. Pollut. 2021, 285, 117485. [Google Scholar] [CrossRef]
- Ali, M.; Almuzaiqer, R.; Al-Salem, K.; Alabdulkarem, A.; Nuhait, A. New novel thermal insulation and sound-absorbing materials from discarded facemasks of COVID-19 pandemic. Sci. Rep. 2021, 11, 23240. [Google Scholar] [CrossRef]
- Owodunni, A.A.; Lamaming, J.; Hashim, R.; Taiwo, O.F.A.; Hussin, M.H.; Mohamad Kassim, M.H.; Bustami, Y.; Sulaiman, O.; Amini, M.H.M.; Hiziroglu, S. Adhesive application on particleboard from natural fibers: A review. Polym. Compos. 2020, 41, 4448–4460. [Google Scholar] [CrossRef]
- Ali, M.; Alabdulkarem, A.; Nuhait, A.; Al-Salem, K.; Iannace, G.; Almuzaiqer, R. Characteristics of agro waste fibers as new thermal insulation and sound absorbing materials: Hybrid of date palm tree leaves and wheat straw fibers. J. Nat. Fibers 2022, 19, 6576–6594. [Google Scholar] [CrossRef]
- Alabdulkarem, A.; Ali, M.; Iannace, G.; Sadek, S.; Almuzaiqer, R. Thermal analysis, microstructure and acoustic characteristics of some hybrid natural insulating materials. Constr. Build. Mater. 2018, 187, 185–196. [Google Scholar] [CrossRef]
- Wood Adhesive 78-1040-Material Safety Data Sheet. Available online: https://www.gulfindustrialgroup.com/saaf/wp-content/uploads/2016/08/WOOD-ADHESIVE-78-1040-MSDS.pdf (accessed on 17 December 2022).
- ASTM-E1508-98; Standard Guide for Quantitative Analysis by Energy-Dispersive Spectroscopy. ASTM: West Conshohocken, PA, USA, 2008. Available online: www.astm.org (accessed on 17 December 2022).
- ASTM-C518; Standard Test Method for Steady-State Thermal Transmission Properties by Means of the Heat Flow Meter Apparatus (C 518). American Society of Testing and Materials (ASTM): West Conshohocken, PA, USA, 2021.
- ASTM D790-03; Standard Test Methods for Flexural Properties of Unreinforced and Reinforced Plastics and Electrical Insulating Materials. ASTM International: West Conshohocken, PA, USA, 2003. Available online: www.astm.org (accessed on 17 December 2022).
- ASTM-D2974-07A; Standard Test Methods for Moisture, Ash, and Organic Matter of Peat and Other Organic Soils. ASTM International: West Conshohocken, PA, USA, 2007. Available online: www.astm.org (accessed on 17 December 2022).
- Asdrubali, F.; D’Alessandro, F.; Schiavoni, S. A review of unconventional sustainable building insulation materials. Sustain. Mater. Technol. 2015, 4, 1–17. [Google Scholar] [CrossRef]
- Andrady, A.L.; Neal, M.A. Applications and societal benefits of plastics. Philos. Trans. R. Soc. B Biol. Sci. 2009, 364, 1977–1984. [Google Scholar] [CrossRef] [PubMed]
- Maddah, H.A. Polypropylene as a promising plastic: A review. Am. J. Polym. Sci 2016, 6, 1–11. [Google Scholar]
- Marichelvam, M.; Jawaid, M.; Asim, M. Corn and rice starch-based bio-plastics as alternative packaging materials. Fibers 2019, 7, 32. [Google Scholar] [CrossRef]
- Asim, M.; Paridah, M.T.; Chandrasekar, M.; Shahroze, R.M.; Jawaid, M.; Nasir, M.; Siakeng, R. Thermal stability of natural fibers and their polymer composites. Iran. Polym. J. 2020, 29, 625–648. [Google Scholar] [CrossRef]
- Shahroze, R.M.; Ishak, M.R.; Salit, M.S.; Leman, Z.; Chandrasekar, M.; Munawar, N.S.; Asim, M. Sugar palm fiber/polyester nanocomposites: Influence of adding nanoclay fillers on thermal, dynamic mechanical, and physical properties. J. Vinyl Addit. Technol. 2020, 26, 236–243. [Google Scholar] [CrossRef]
- Ball, R.; McIntosh, A.; Brindley, J. Feedback processes in cellulose thermal decomposition: Implications for fire-retarding strategies and treatments. Combust. Theory Model. 2004, 8, 281. [Google Scholar] [CrossRef]
- Biskupičová, A.; Ledererová, M.; Unčík, S.; Glorieux, C.; Rychtáriková, M. Sound absorption properties of materials based on recycled plastic granule mixtures. Slovak J. Civ. Eng. 2021, 29, 15–19. [Google Scholar] [CrossRef]
- RILEM-TC. Test for the determination of modulus of rupture and limit of proportionality of thin fibre reinforced cement sections. In RILEM Technical Recommendations for the Testing and Use of Construction Materials; CRC Press: Boca Raton, FL, USA, 1994. [Google Scholar]
- Nguyen, D.M.; Grillet, A.-C.; Diep, T.M.H.; Bui, Q.B.; Woloszyn, M. Influence of thermo-pressing conditions on insulation materials from bamboo fibers and proteins based bone glue. Ind. Crops Prod. 2018, 111, 834–845. [Google Scholar] [CrossRef]
- Dukhan, N.; Rayess, N.; Hadley, J. Characterization of aluminum foam–polypropylene interpenetrating phase composites: Flexural test results. Mech. Mater. 2010, 42, 134–141. [Google Scholar] [CrossRef]
- Bainbridge, D.A. High performance low cost buildings of straw. Agric. Ecosyst. Environ. 1986, 16, 281–284. [Google Scholar] [CrossRef]


| Ingredients | |||
| Name | Case-No. | Content % | |
| Polyvinyl Acetate | 9003-20-7 | 77–85 | |
| Water | 1132-18-58 | 5–10 | |
| Dibutyl phthalate (DBP) | 84-74-2 | 1–3 | |
| Calcium Carbonate | 1317-65-3 | 10-20 | |
| Physical and Chemical Properties | |||
| Base material | Polyvinyl Acetate | Coverage (Approx.) | 4–5 m3/kg, depends on the surfaces |
| Color | Milky white | Application temperature | 5 °C–50 °C |
| Viscosity at 25 °C, ASTM D2196 | 25,000–34,000 CPS (Sp.# 7 at 20 rpm) | Drying time | 30 min to approx 1 h. (depends on the thickness of the adhesive layer, kind of wood, and climatic condition) |
| Density | 1.10–1.5 g/cm3 | Open time | 1–5 min (depends on climatic condition) |
| PH, ASTM D 1172 | 6.5–8 | Full cure | 24 h (depends on climatic condition) |
| Solid contents, ASTM D 1644 | 51–56% | Pressing time | 12 h (depends on climatic condition and wood type) |
| Bound Samples Number | ||||||
|---|---|---|---|---|---|---|
| 1 | 2 | 3 | 4 | 5 | ||
| Material | Complete Facemasks | Masks with Iron Nose Clip Only | Masks with No Ear Loops and Iron Nose Clip | Elastic Ear Loops Only | Masks with Elastic Ear Loops Only | |
 |  |  |  |  | ||
| Figure No. | Figure 3a | Figure 3b | Figure 3c | Figure 3d | Figure 3e | Figure 3f |
| Total mass, g | 460 | 562 | 542 | 298 | 557 | 400 |
| Masks’ mass, g | 314 | 289 | 291 | 203 | 289 | 289 |
| Number of used facemasks | 103 | 116 | 125 | 372 | 100 | 100 |
| Binder’s mass, g | 146 | 273 | 251 | 95 | 268 | 111 |
| Percent of polymerized binder to total mass | 31.7% | 48.6% | 46.3% | 31.9% | 48.1% | 27.8% |
| Thickness, m | 0.021 | 0.024 | 0.022 | 0.018 | 0.024 | 0.025 |
| Density, kg/m3 | 243.4 | 260.2 | 273.7 | 184.0 | 257.9 | 177.8 |
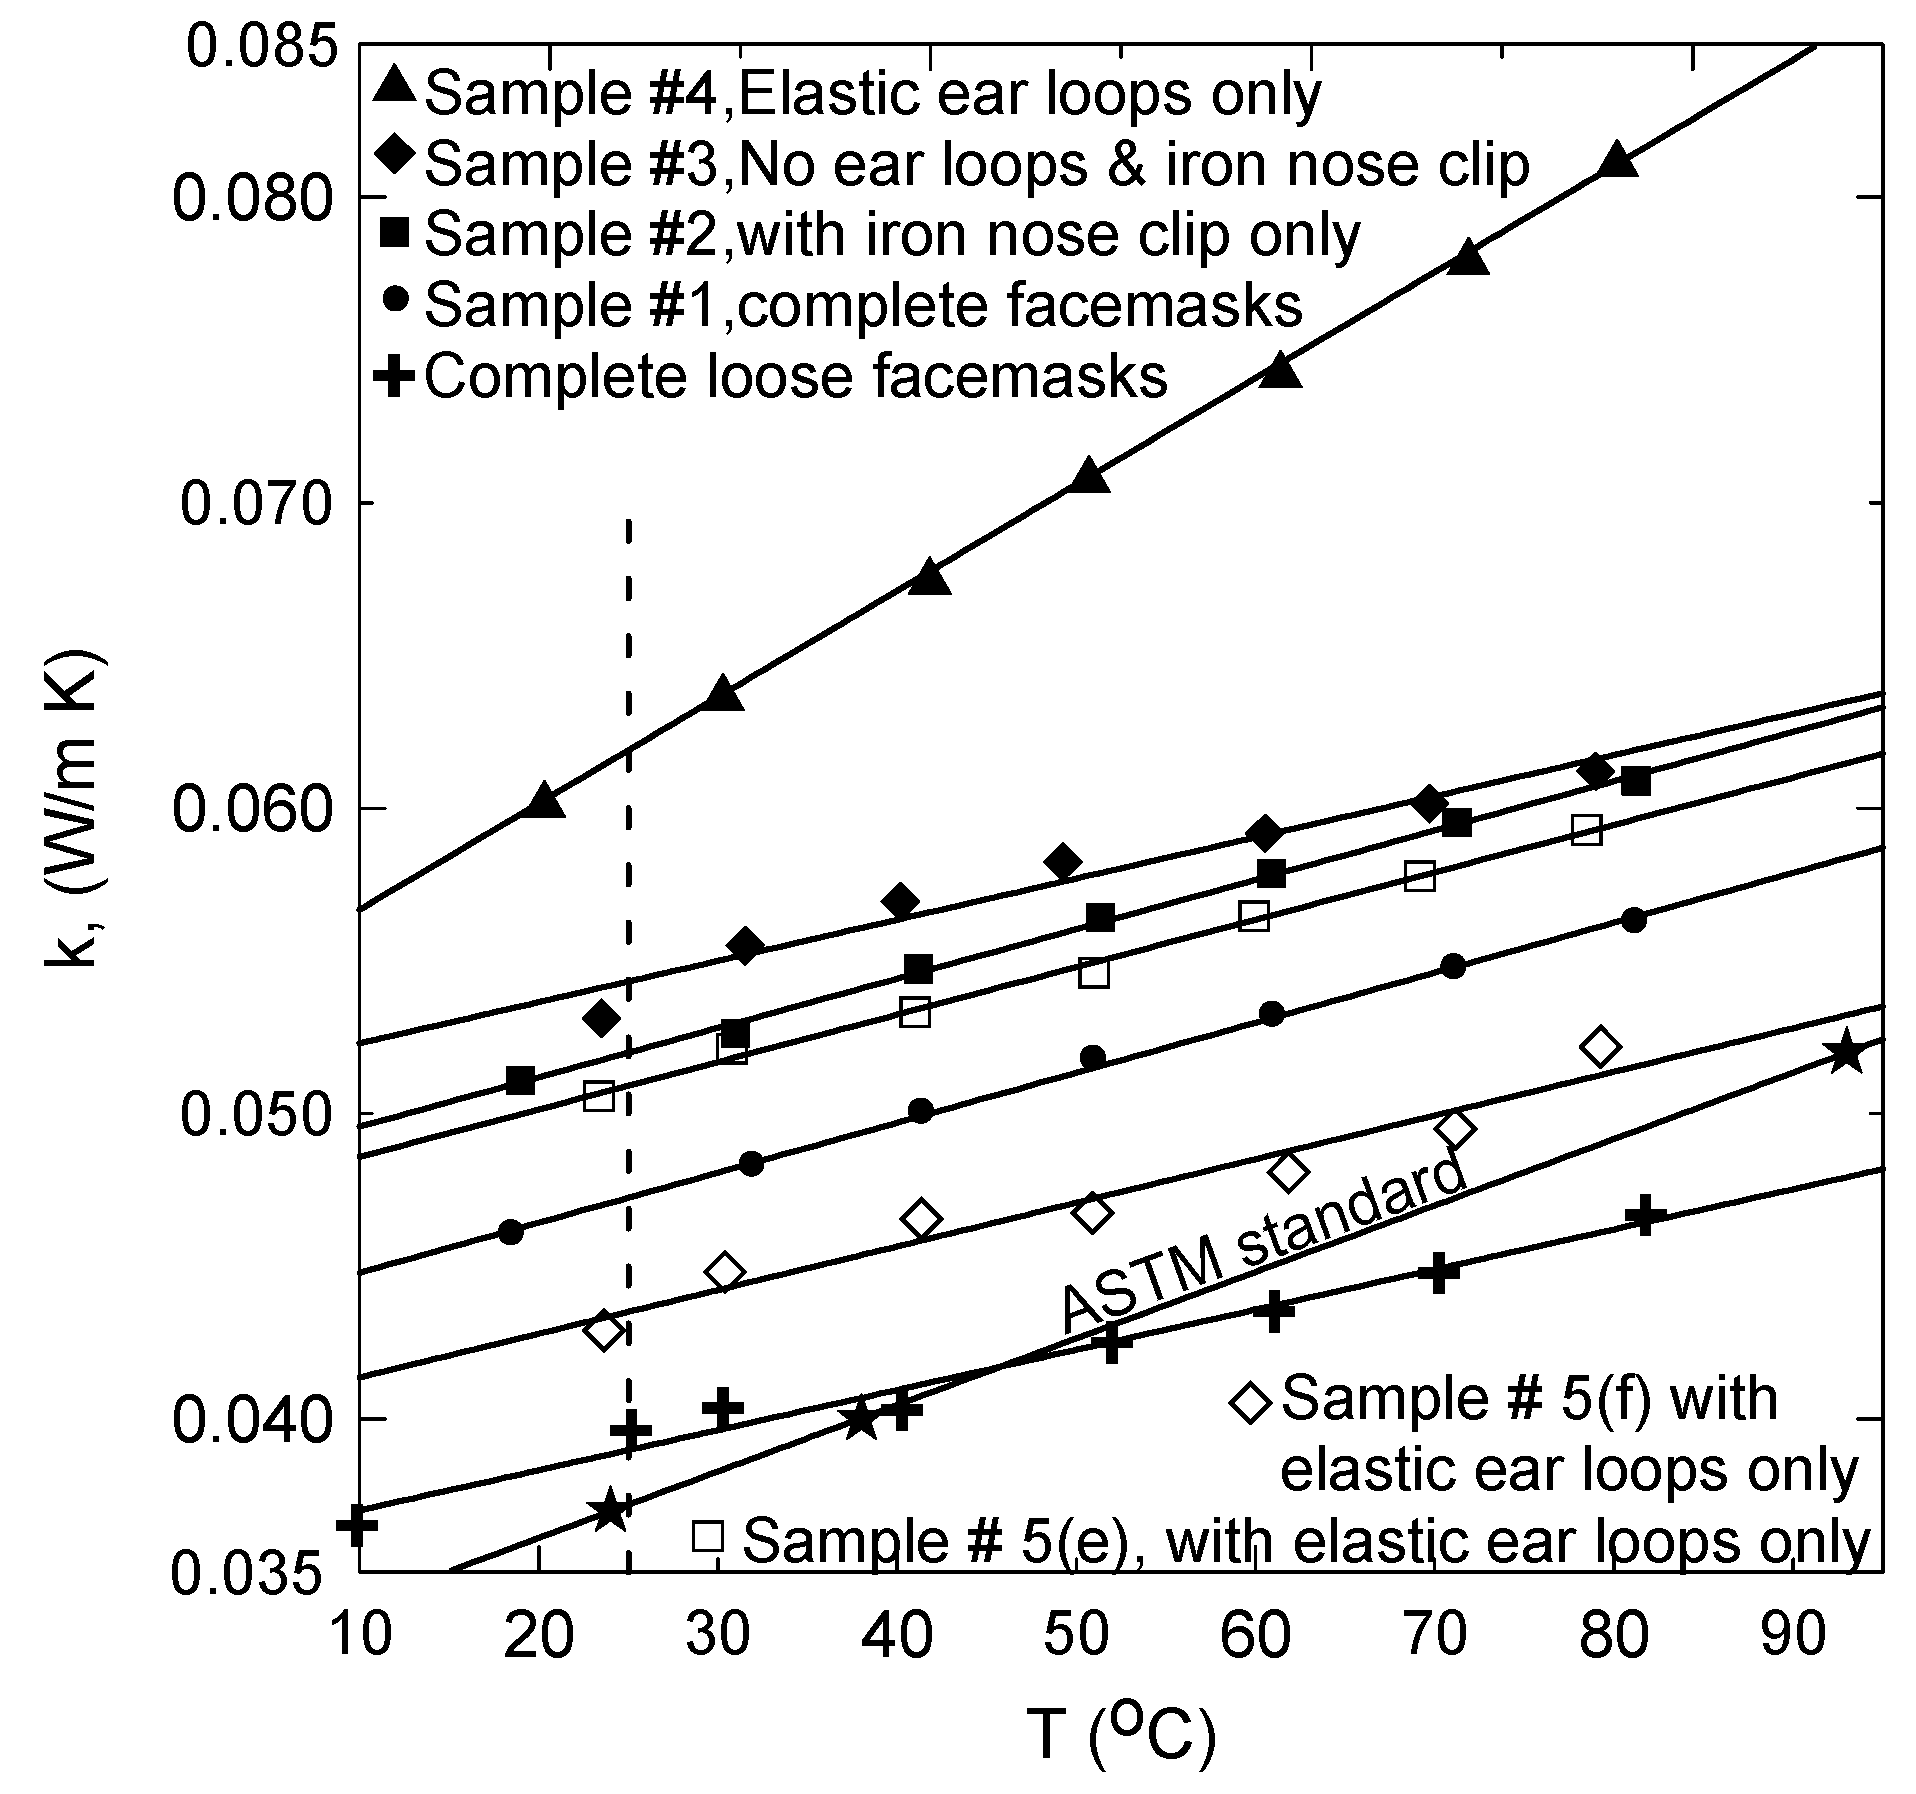
| Symbol | ● | ■ | ♦ | ▲ | □ | ◊ |
| Bound Samples | Thickness d (mm) | Width b (mm) | Span L (mm) | Slop S (N/mm) |
|---|---|---|---|---|
| 1 | 21.00 | 54.40 | 150.00 | 2.8 |
| 2 | 24.00 | 53.30 | 150.00 | 9.4 |
| 3 | 22.00 | 52.82 | 150.00 | 12.6 |
| 5(e) | 24.00 | 51.00 | 150.00 | 6.8 |
| 5(f) | 25.00 | 49.00 | 150.00 | 0.26 |
| A | B | R2, % | k at 25 °C | |
|---|---|---|---|---|
| Sample 1, ● | 0.0432 | 0.00016 | 99.8 | 0.0472 |
| Sample 2, ■ | 0.0479 | 0.00016 | 99.7 | 0.0519 |
| Sample 3, ♦ | 0.0509 | 0.000135 | 95.7 | 0.05423 |
| Sample 4, ▲ | 0.0532 | 0.000348 | 99.9 | 0.0619 |
| Sample 5(e), □ | 0.0470 | 0.000155 | 99.6 | 0.0509 |
| Sample 5(f), ◊ | 0.0399 | 0.000143 | 94.8 | 0.04347 |
| Loose sample, + | 0.0357 | 0.0001314 | 97.7 | 0.03898 |
| Materials | Thermal Conductivity (W/m K) | References |
|---|---|---|
| Sample 1, ● | 0.0472 | Present study |
| Sample 2, ■ | 0.0519 | Present study |
| Sample 3,♦ | 0.05423 | Present study |
| Sample 4, ▲ | 0.0619 | Present study |
| Sample 5(e), □ | 0.0509 | Present study |
| Sample 5(f), ◊ | 0.04347 | Present study |
| Loose sample, + | 0.03898 | Present study |
| Rock wool | 0.033–0.040 | [29] |
| Expanded Polystyrene | 0.031–0.038 | [29] |
| Polyurethane foam | 0.025–0.035 | [30] |
| Phenol formaldehyde foam | 0.035 | [30] |
| Polypropylene (PP) | 0.17 | [31] |
| Polyethylene (PE) | 0.17 | [31] |
| Sample Number | S (N/mm) | Ef (MPa) | σf (MPa) | ϵf | Density (kg/m3) |
|---|---|---|---|---|---|
| 1 | 2.8 | 4.54 | 0.35143 | 0.15423 | 243.4 |
| 2 | 9.4 | 9.57 | 0.58117 | 0.10504 | 260.2 |
| 3 | 12.6 | 20.02 | 1.28741 | 0.12200 | 273.7 |
| 5(e) | 6.8 | 8.08 | 0.56315 | 0.15455 | 257.9 |
| 5(f) | 0.26 | 0.286 | 0.07627 | 0.31133 | 177.8 |
Disclaimer/Publisher’s Note: The statements, opinions and data contained in all publications are solely those of the individual author(s) and contributor(s) and not of MDPI and/or the editor(s). MDPI and/or the editor(s) disclaim responsibility for any injury to people or property resulting from any ideas, methods, instructions or products referred to in the content. |
© 2023 by the authors. Licensee MDPI, Basel, Switzerland. This article is an open access article distributed under the terms and conditions of the Creative Commons Attribution (CC BY) license (https://creativecommons.org/licenses/by/4.0/).
Share and Cite
Al-Salem, K.; Ali, M.; Almuzaiqer, R.; Al-Suhaibani, Z.; Nuhait, A. Recycling Discarded Facemasks of COVID-19 Pandemic to New Novel Composite Thermal Insulation and Sound-Absorbing Materials. Sustainability 2023, 15, 1475. https://doi.org/10.3390/su15021475
Al-Salem K, Ali M, Almuzaiqer R, Al-Suhaibani Z, Nuhait A. Recycling Discarded Facemasks of COVID-19 Pandemic to New Novel Composite Thermal Insulation and Sound-Absorbing Materials. Sustainability. 2023; 15(2):1475. https://doi.org/10.3390/su15021475
Chicago/Turabian StyleAl-Salem, Khaled, Mohamed Ali, Redhwan Almuzaiqer, Zeyad Al-Suhaibani, and Abdullah Nuhait. 2023. "Recycling Discarded Facemasks of COVID-19 Pandemic to New Novel Composite Thermal Insulation and Sound-Absorbing Materials" Sustainability 15, no. 2: 1475. https://doi.org/10.3390/su15021475
APA StyleAl-Salem, K., Ali, M., Almuzaiqer, R., Al-Suhaibani, Z., & Nuhait, A. (2023). Recycling Discarded Facemasks of COVID-19 Pandemic to New Novel Composite Thermal Insulation and Sound-Absorbing Materials. Sustainability, 15(2), 1475. https://doi.org/10.3390/su15021475