Article

Different Contribution of Olive Groves and Citrus Orchards to Soil Organic Carbon Sequestration: A Field Study in Four Sites in Crete, Greece

by
Eleni Sofoulaki
1,2,
Vasileios A. Tzanakakis
2,*,
Georgios Giannopoulos
3,
Iosif Kapellakis
4,
Emmanouil Kabourakis
2,
Theocharis Chatzistathis
5 and
Nikolaos Monokrousos
1
1
Department of Humanities Social Sciences and Economics, International Hellenic University, 57001 Thessaloniki, Greece
2
Department of Agriculture, School of Agricultural Sciences, Hellenic Mediterranean University, 71410 Heraklion, Greece
3
School of Agriculture, Aristotle University of Thessaloniki, 54124 Thessaloniki, Greece
4
Department of Civil Engineering, School of Architecture, Engineering, Land and Environmental Sciences, Neapolis University, 2 Danais Av., 8042 Pafos, Cyprus
5
Institute of Soil and Water Resources, Hellenic Agricultural Organization (ELGO-Dimitra), 57001 Thessaloniki, Greece
*
Author to whom correspondence should be addressed.
Sustainability 2023, 15(2), 1477; https://doi.org/10.3390/su15021477
Submission received: 2 November 2022 / Revised: 7 January 2023 / Accepted: 10 January 2023 / Published: 12 January 2023
(This article belongs to the Special Issue Plant Nutrition, Plant-Soil Relationships and Sustainable Agriculture)

Abstract

:
In this work, we evaluated the effects of cultivation practices and sites (representing four locations in Crete, Greece) on soil organic carbon sequestration in established citrus orchards, olive groves, and uncultivated fields (used as a control). Soil pH, soil texture, soil organic matter (SOM), Permanganate Oxidizable Carbon (POXC), Total Kjeldahl Nitrogen (TKN), Carbon and Nitrogen ratio (C:N), as well as soil CO2 respiration rates, and specific enzymes’ activity (i.e., N-Acetyl Glutamate (NAG), Beta Glucosidase (BG), Dehydrogenase) were determined in the upper soil layer (0–20 cm). It was shown that citrus and olive orchards under the South Mediterranean conditions could substantially increase C storage in the soil. However, soils planted with orange trees showed lower capacity than olive trees, which was related to litter chemistry (i.e., leaf C:N ratio). Sites had no significant impact on SOM. In our study, SOM had a positive relationship with TKN (and less with POXC) and the C:N ratio of the tree crop species litter. Our findings have implications for designing soil conservation practices in Mediterranean conditions and developing initiatives describing achievable targets of SOM restoration depending on soil properties and cropping systems.

1. Introduction

Protection and enhancement of stored carbon (C) in the soil is an important goal for sustainable natural resource management to preserve the quality and health of soils and to sustain ecosystem services [1]. This target is essential for arid or semi-arid areas, such as the Mediterranean basin, due to environmental and climate conditions (e.g., high temperature and evapotranspiration, low precipitation rates, and drought events) and intensive management practices and constraints on litter inputs to the soil (e.g., tillage, high inorganic fertilization, and residue burning) [2]. To date, several studies have provided evidence for a low potential of Mediterranean agroecosystems, especially in its southern part, to store C, even under soil conservation practices (e.g., non-tillage), questioning the capacity of commonly applied practices to restore soil health, mitigate climate change, and improve the resilience of agroecosystems to climate extremes. Therefore, more efforts should be made to adapt crops and agricultural practices and to respond to current economic, environmental and climate challenges [3,4].
Plant species are essential to agriculture and food production, determining crop production, cropping systems’ environmental and climate footprints, and total C sequestration [5]. They balance the direct or indirect (via plant-regulated soil microorganisms activity) CO2 emissions with the C stored in plant biomass and the soil (C sequestration) [6]. Tree plantations are featured by their capability to absorb CO2 from the atmosphere and temporarily store it over long periods within tree counterparts, such as branches, roots, trunks, fruits, leaves, and in the soil, and via litter decomposition and rhizodeposition [6,7,8,9]. The soil C sequestration is heavily regulated by critical factors and their interaction, such as crop-tree and soil characteristics, the farming system (e.g., conventional/organic), environmental conditions, and the applied agricultural practices (e.g., crop rotation, fertilization management, irrigation, tillage system, and residue management) [10,11,12,13,14].
Olive (Olea europaea L.) is the most economically and ecologically important tree crop in the Mediterranean area [15]. Related works in olive tree plantations provide information concerning the net C concentration [16,17], C exchange, and water use productiveness in irrigated olive fields [18]. Furthermore, models are suggested for calculating the growth potential of an olive tree’s aboveground parts to measure C seizure [19]. Examining olive groves in Southern Italy, Sofo et al. [17] determined the average volume of stored CO2 estimated as a function of belowground and aboveground structure differences, olive tree density, and age, and the results demonstrated values of 9.54 and 2.74 Mg ha−1 year−1 in mature and young groves, respectively. Lopez et al. [20] claimed that olive trees could stably store carbon, especially in intensive plantations, so olive groves decrease greenhouse gas emissions of greenhouse gases, highlighting their role as CO2 sinks. They also reported that a reduced percentage of soil organic matter in intensive plantations was due to the inadequate management of the soil. Differences in soil C sequestration have been shown between olive orchards and avocado trees planted in a semi-arid region of Mediterranean, in Crete, which was attributed to crop litter characteristics [7].
Orange tree orchards are widespread worldwide, with the countries around the Mediterranean basin constituting important producers [21]. Unfortunately, the Mediterranean climate exhibits scarce water resources that confine orange crop sustainability [21]. In regions exhibiting a semi-arid climate, such as Crete, limiting water availability is the aspect that mainly contributes to the degradation of crop production [22]. Therefore, it becomes significant to settle the timing and amount of water to be irrigated [23]. Despite the sufficient number of studies conducted with orange trees, most focused on irrigation’s impacts on physiology and productivity [24,25].
The island of Crete, due to its geographical location, is considered vulnerable to climatic conditions; it will be challenged in the upcoming years by climate change and/or variability [2,26] and water scarcity phenomena, particularly in the eastern-south part of the island [27]. Olive tree crop species occupy the largest part of the island’s agricultural land. Other tree cultivations, such as orange orchards or avocados, and vegetables are cultivated and co-exist with the olives. Allen et al. [28], examining fields in Crete, observed fields of both intensive and traditional types of olive cultivation. In more upland and marginal areas, they observed traditional terraced olive fields, some of which have been abandoned. Today we are noticing intensive and conventional types of olive cultivation in both categories’ areas, revealing the progress in the agriculture sector that was recorded during the elapsed years (2006–2022). The same observations are made for orange cultivation. Both crops studied here are considered as important cropping systems for the economy of Crete [27].
Despite those mentioned above and the available knowledge on olive and orange orchards’ crop productivity and economy, there is limited knowledge regarding their potential to preserve and store C in soil. Therefore, more research must be conducted to estimate the CO2 removal capacity concerning plant biomass sequestered C for an examined tree system and the C concentration in the soil. Several studies have evaluated the production and net C budget in forests. Still, limited research has targeted crops, partly due to the raised uncertainties and difficulties in calculating farmlands’ C volume [29,30,31,32].
Based on the above four different sites of Crete (characterized by different soil-climatic conditions), non-cultivated or planted Olive and Orange trees were investigated with the objectives: (a) to study the effect of different tree crop species (olives vs. citrus) and sites on soil organic C sequestration (C storage as soil organic matter (SOM)); (b) to identify the critical soil and plant-specific properties driving soil organic C sequestration; and (c) to provide additional information for the development of necessary adaptation measures in agriculture due to climate change and/or variability in semi-arid and climate vulnerable areas of the planet (e.g., the Mediterranean basin). The underlying hypotheses of the present study are the followings:
  • Farming land use either with olive or citrus trees will increase the soil organic C potential due to litter fall and rhizodeposition (will be indicated as a difference between tree crop species cultivations and non-cultivated fields in four different sites).
  • Different tree crop species will have different soil organic C sequestration potentials due to their distinct physiological and morphological characteristics (e.g., litter quantity and quality and root distribution and rhizodeposition) and expected crop-specific soil microbiota communities and activities involved in C and nutrient cycling in the soil.
  • Sites will affect the storage of soil organic C due to site-specific adjustment of crops due to existing soil-climatic conditions and site-specific soil microorganisms and their responses to environmental conditions.
  • Soil organic C concentration could be correlated with specific soil properties and plant species characteristics (i.e., litter C:N ratio). Both the latter factors could affect organic C retention and availability and shape soil microbiota, consequently impacting the SOM storage in the soil.

2. Materials and Methods

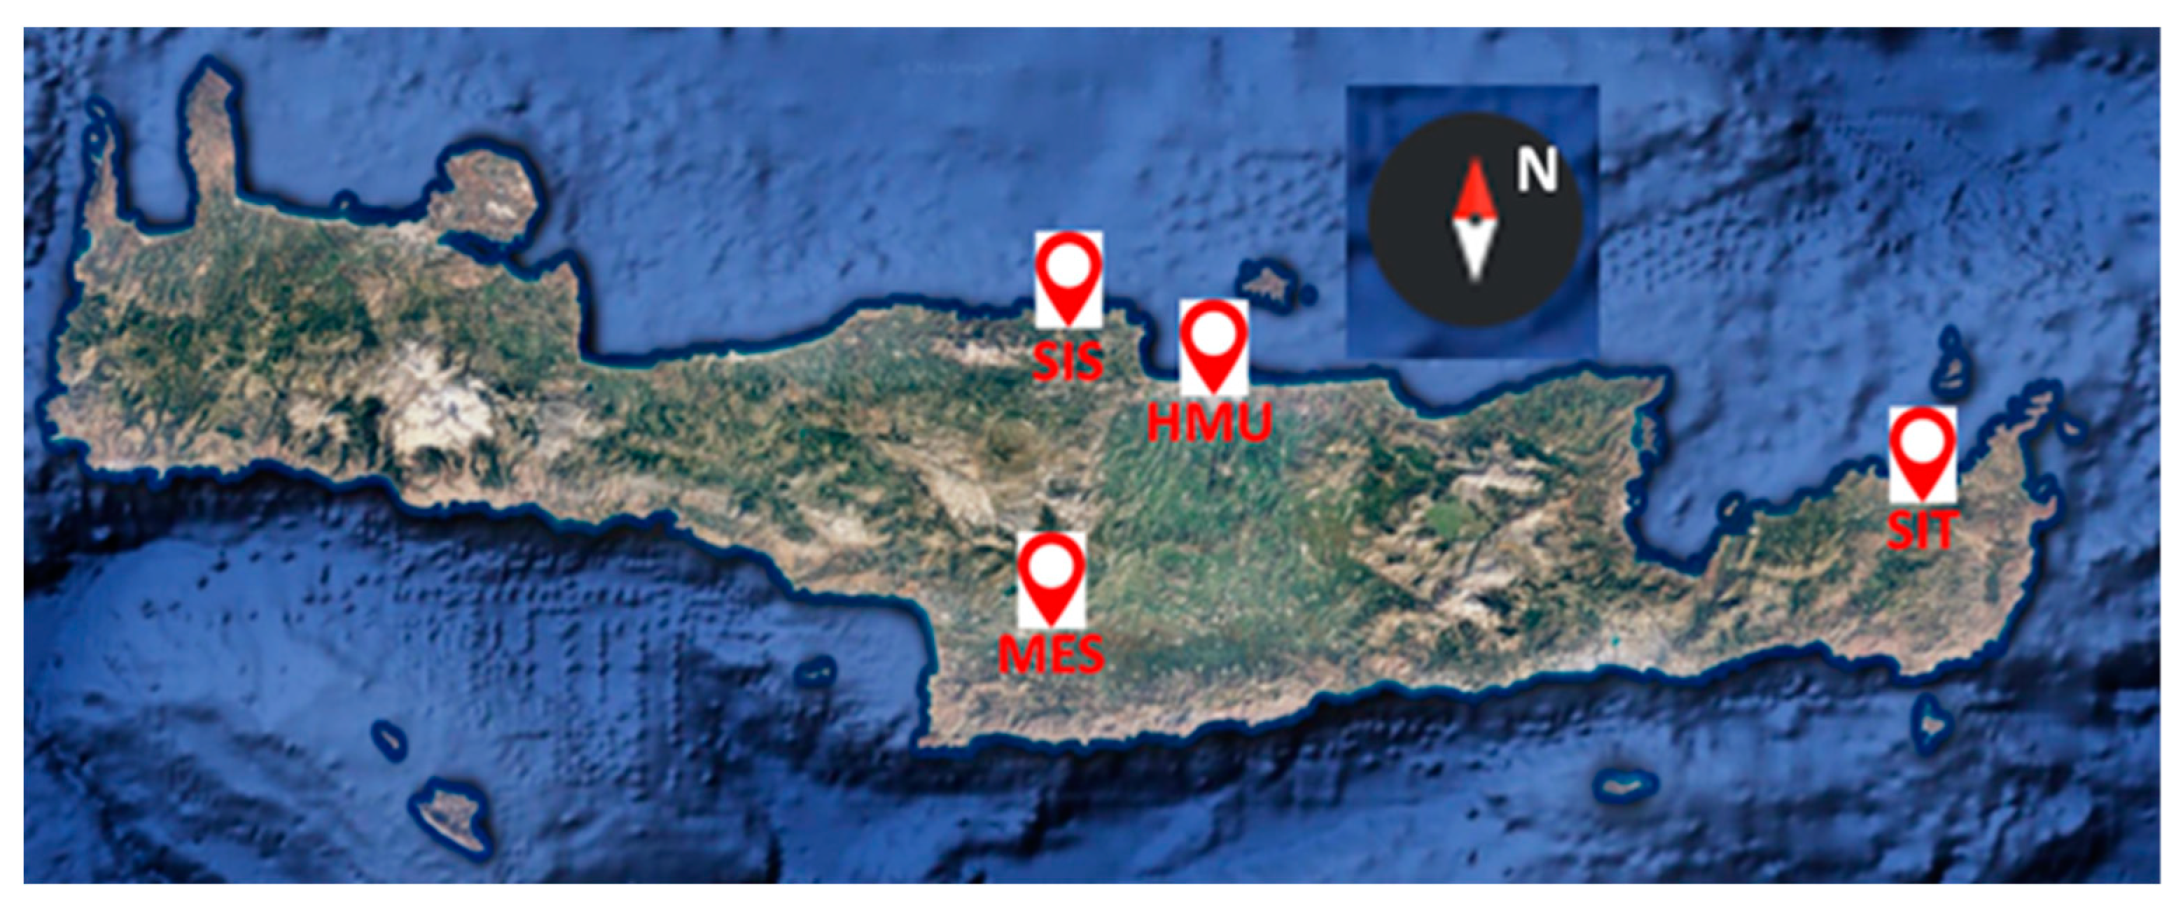
2.1. Site Descriptions

The selected sampling sites are located a) in the north and central part of Crete: Sisses (SIS), 35°24′04″ N, 24°52′15″ E (Altitude: 40 m) and Heraklion [Hellenic Mediterranean University (HMU), 35°19′02″ N (Altitude: 11 m), 25°06′26″ E and b) in the south and eastern part of Crete: Messara/(MES), 35°04′39″ N, 24°54′37″ E (Altitude: 294 m) and Sitia (SIT), 35°12′12″ N, 26°02′11″ E (Altitude: 252 m) (Figure 1). The average maximum and minimum month temperature for the different site areas are from 7 to 22 °C and from 20 to 31 °C for the winter and summer periods, respectively. The MES and SIT sites are among the areas with the highest maximum temperatures and lowest precipitation rates on the island, exhibiting an increased risk regarding drought vulnerability, climate change impacts, and desertification potential [33]. Rainfall is varied from ~650 mm in Heraklion (HMU and SIS) to a lower level of ~500 (MES) and 450 (SIT) mm [34]. The soils in SIT and MES are threatened with chemical and physical deterioration due to the intensive agricultural practices, overgrazing, and erosion.
In each sampling site, three paired fields, an uncultivated one, a second one planted with olive trees, and a third planted with citrus trees of the same age, were surveyed to examine the variability of SOM in the soil of different cropping systems. The size of the fields was the average size in Crete, 0.5–1.0 ha. Olives and citrus trees were 25–30 years old, grown with mild-conventional management practices, applying either low quantity of synthetic chemical fertilizers (i.e., <80 NPK kg ha−1 yearly) or low organic additions (HMU), both combined with minimum irrigation and tillage practices. The soil texture of the sites is depicted in Table 1.

2.2. Field Samplings and Analyses

From each of the above experimental fields, we selected three representative trees, from where three respective composite soil core samples were collected. Each of the latter composite samples contained four cross samples (four samples per tree). Thus, three replicates were used. In total, thirty-six soil samples were collected from four different productive and diverse areas in Crete, SIT, HMU, MES, and SIS [4 sites × 3 fields (olive, orange, uncultivated) × 3 (Replicates-Stations) = 36 soil samples]. Samples were taken from the first 20 cm of the soil in November 2021. The selection of single sampling was considered adequate given the reasonably long time since the establishment of the crops that ensure adequate cumulative impact on soil organic C sequestration. Soil samples were transferred to the Soil laboratory at HMU. They were sieved through a 2 mm mesh, placed separately in transparent bags, and stored in the refrigerator at 4 °C for chemical and physical analyses.
Besides collecting soil samples, twenty-four leaves were collected randomly from each of the above trees in the olive and citrus orchards. The leaf samples were transferred to the soil laboratory, washed gently, and placed on filter paper. After drying, each sample was milled separately to create a soft powder. Next, each sample was put in paper bags and then placed in a dryer until the day of the analyses.
Particle size analysis for soil samples was carried out by the Bouyoucos soil physical-chemical analyses method [35]. The SOM was determined by the Walkley–Black method [36]. Total Kjeldahl Nitrogen (TKN) contents were measured according to the Kjeldahl method [37]. For each sample, 1 gr of soil and leaf tissue was digested with 20 mL sulfuric concentrated acid (H2SO4). After that, nitrogen content was determined by alkaline reduction with sodium hydroxide (NaOH) and following titration with sulfuric acid (0.01 and 0.1 N for soil and leaf tissue, respectively). Active carbon was determined by Permanganate Oxidizable Carbon (POXC) method [38]. In 2.5 g. of each soil sample, added 2 mL KMnO4 and 18 mL of deionized water. After 2 min shaking and 10 min incubation in a dark room, samples were diluted in 49.5 mL deionized water, and the absorbance was determined by using Shimadzu Spectrophotometer. Free CaCO3 was determined by using using Bernard Calcimeter. The activity of N-acetyl-glucosaminidase (NAG) was measured colorimetrically by 96-well microplates modified method [39]. Specifically, fresh soil, equivalent to 0.5 g dry weight, was added with substrate solution p-nitrophenyl-β-N acetylglucosaminide in acetate buffer (pH 5) and incubated for three h at 21 °C. After the p-nitrophenol reaction, the final product was measured colorimetrically at 405 nm, and the NAG activity was determined as μmol pNP g−1 dry soil h−1. Dehydrogenase activity and b-glucosidase (BG) were determined by soil analysis methods [40,41]. Dehydrogenase activity was determined via soil incubation supplemented with an aqueous 2,3,5-triphenyltetrazolium chloride solution and CaCO3. The incubation lasted 24 h at 37 °C, and the product (triphenyl formazan (TPF)) was measured colorimetrically (formazan release method). In addition, the activity of BG was determined according to Kapagianni et al. [41], expressed as μmol pNP g−1 soil h−1.
To determine respiration rates, soil subsamples from the above treatments equivalent to 50 g were placed into pint-size glass canning jars (10 cm × 1.5 cm), sealed by a gas-tight screw lid. The CO2 emitted from the pots was trapped in a plastic vial containing 10 mL of 1 M NaOH, placed inside the jar. CO2 was determined by adding 1 mL of 1 M BaC2 into CO2 traps and titrating to neutral pH with 1 M HCl. Sampling was carried out in triplicate at each time interval (2 to 7-day sampling was carried out) for all treatments, lasting 39 days. Soil incubations were performed under controlled conditions at 25 °C in the dark.
Total organic carbon was determined by weighted 0.01 g of leaf tissue and using a TOC analyzer, solid sample module. First, total Kjeldahl Nitrogen (TKN) contents were measured according to the Kjeldahl method assay. Next, 1 g of plant tissue was weighed, placed in a capsule, and transferred to the desiccator for measuring total organic carbon with a SHIMADZU Total Organic Carbon Analyzer using the solid sample module (SSM-5000A).

2.3. Statistical Analysis

To determine the effect of sampling site, management type (cultivation) (independent variables), and their interaction on the soil and leaf physical, chemical, and biological variables (dependent variables), a two-way analysis of variance (ANOVA) was used followed by a Fischer’s LSD at p < 0.05. Furthermore, a Pearson correlation analysis was performed to examine the relationships between soil and leaf variables. To further explore whether sampling site or cultivation type is more important for the variability shown by the data, a principal component analysis (PCA) was conducted based on soil physicochemical and biological variables. Before analyses, the data were transformed appropriately when necessary to meet the assumptions of the ANOVA. Statistical analyses were performed by STATISTICA 9 software (Ver. 9).

3. Results

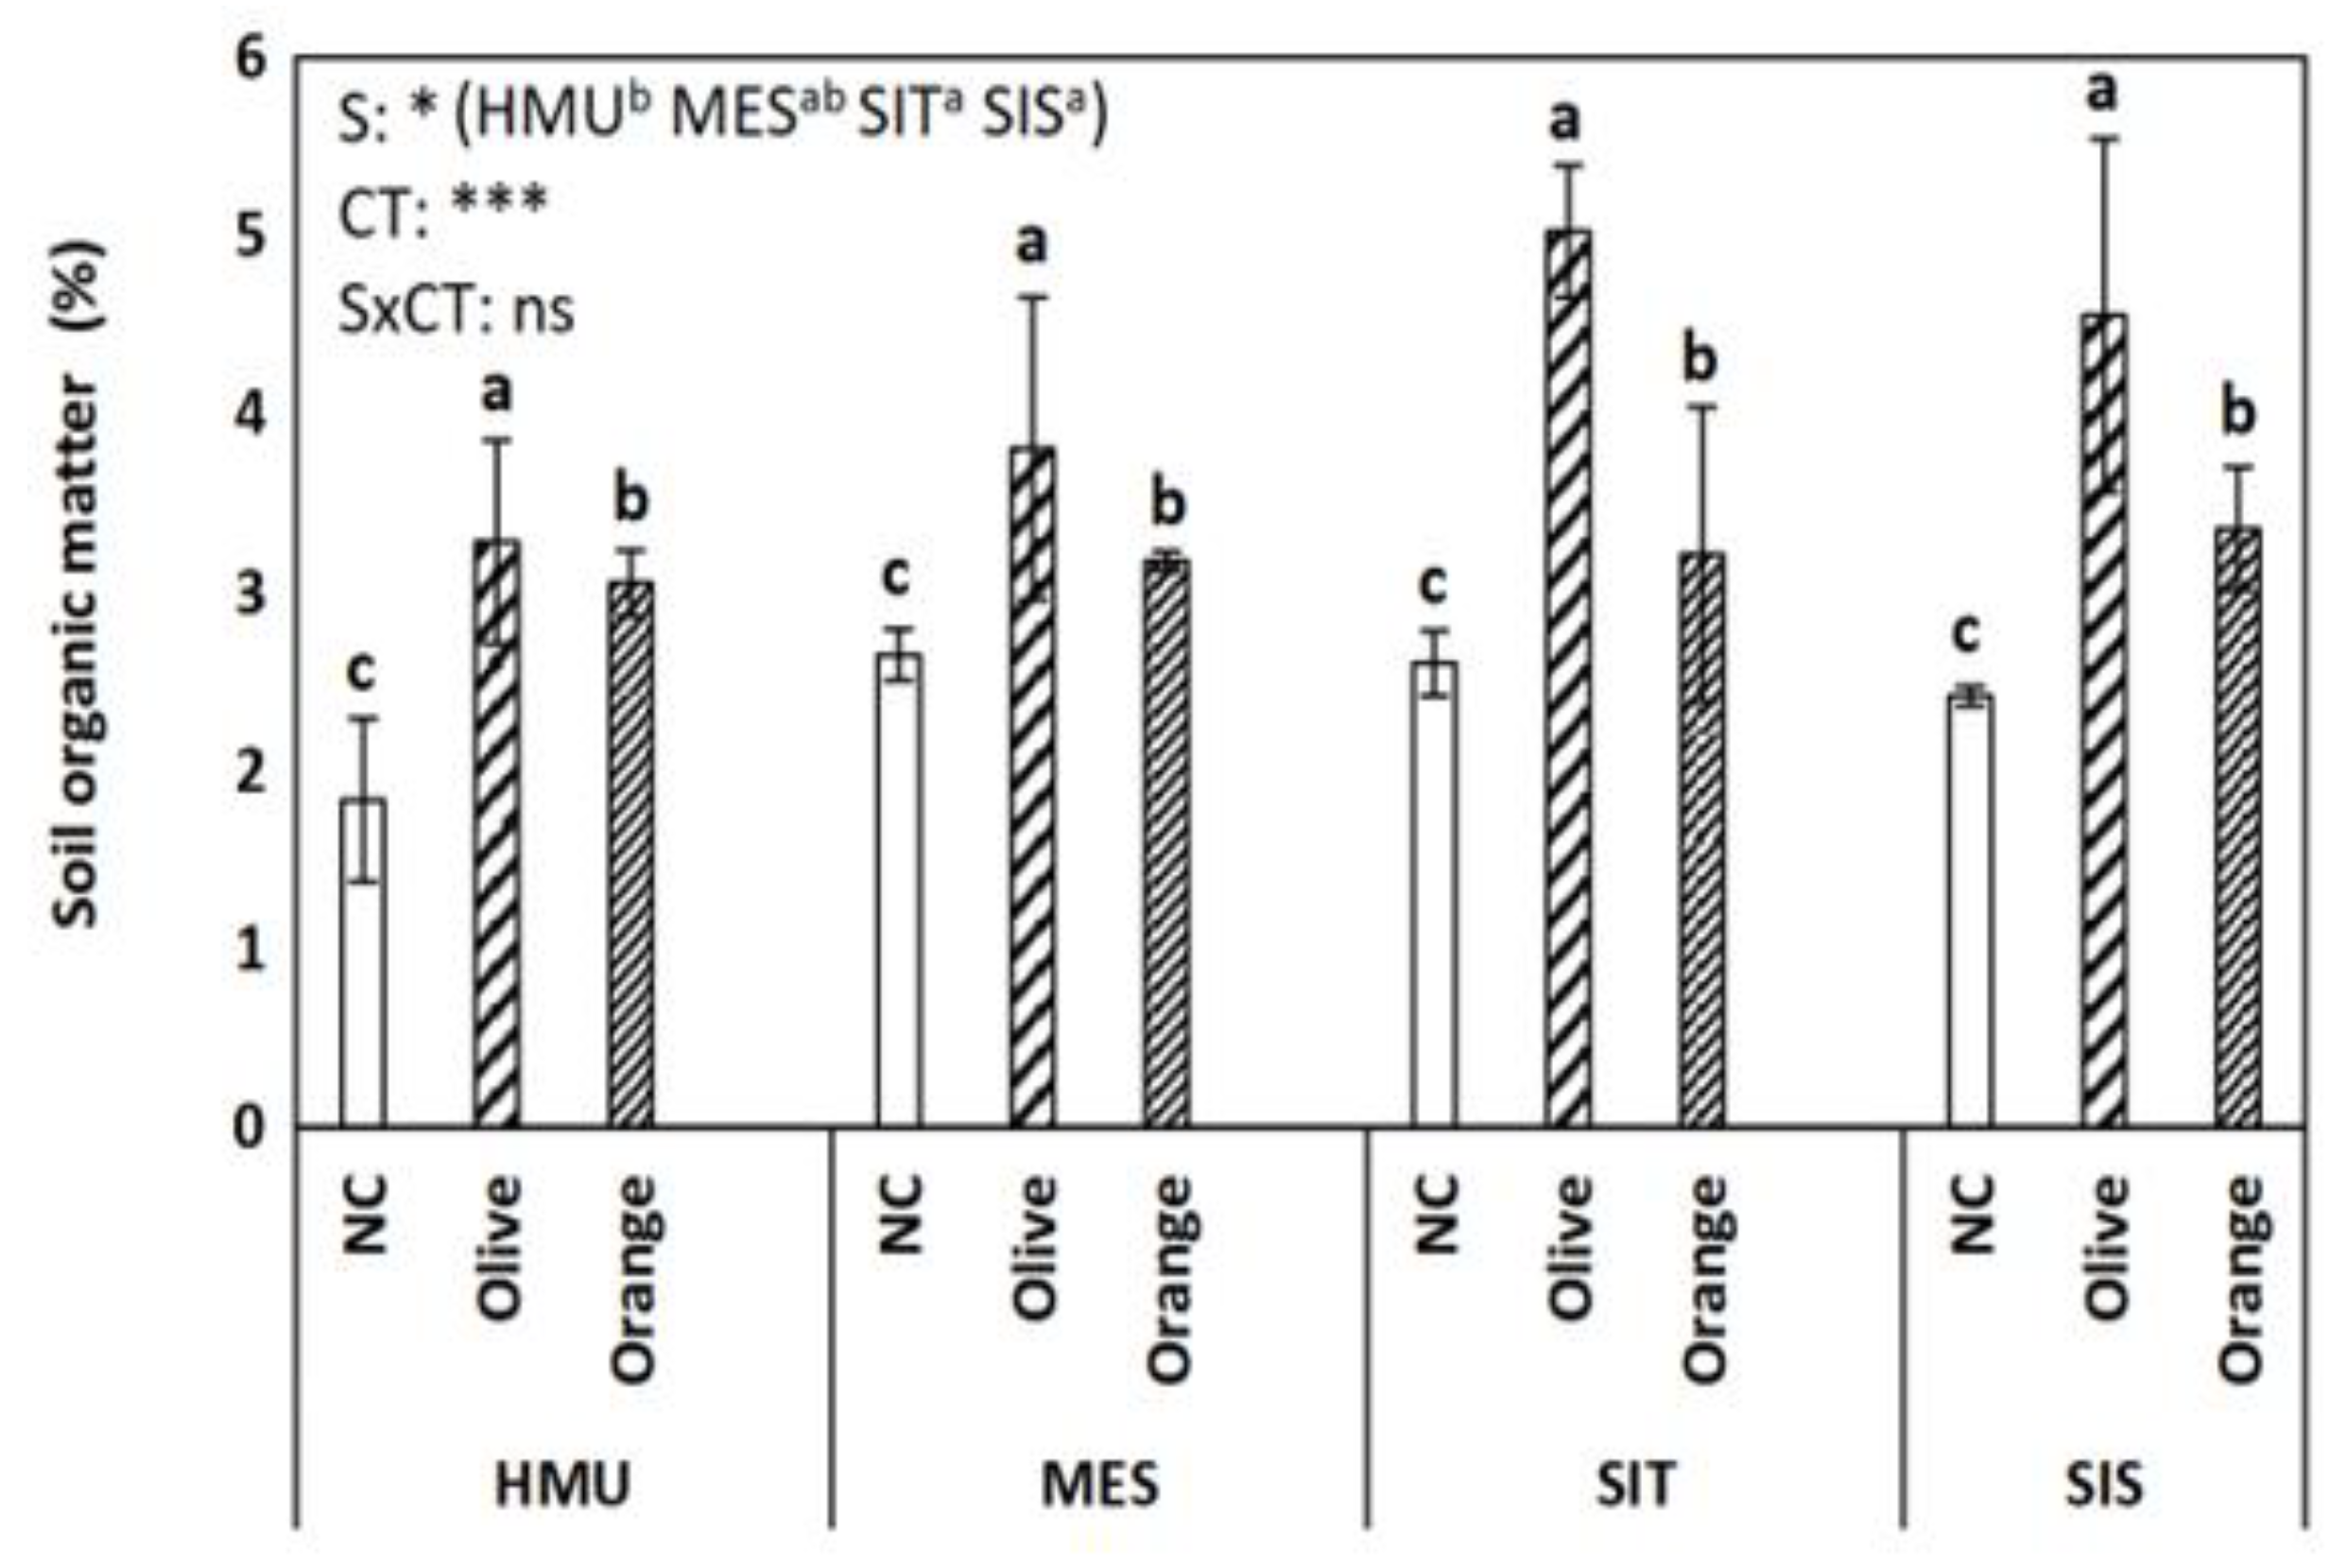
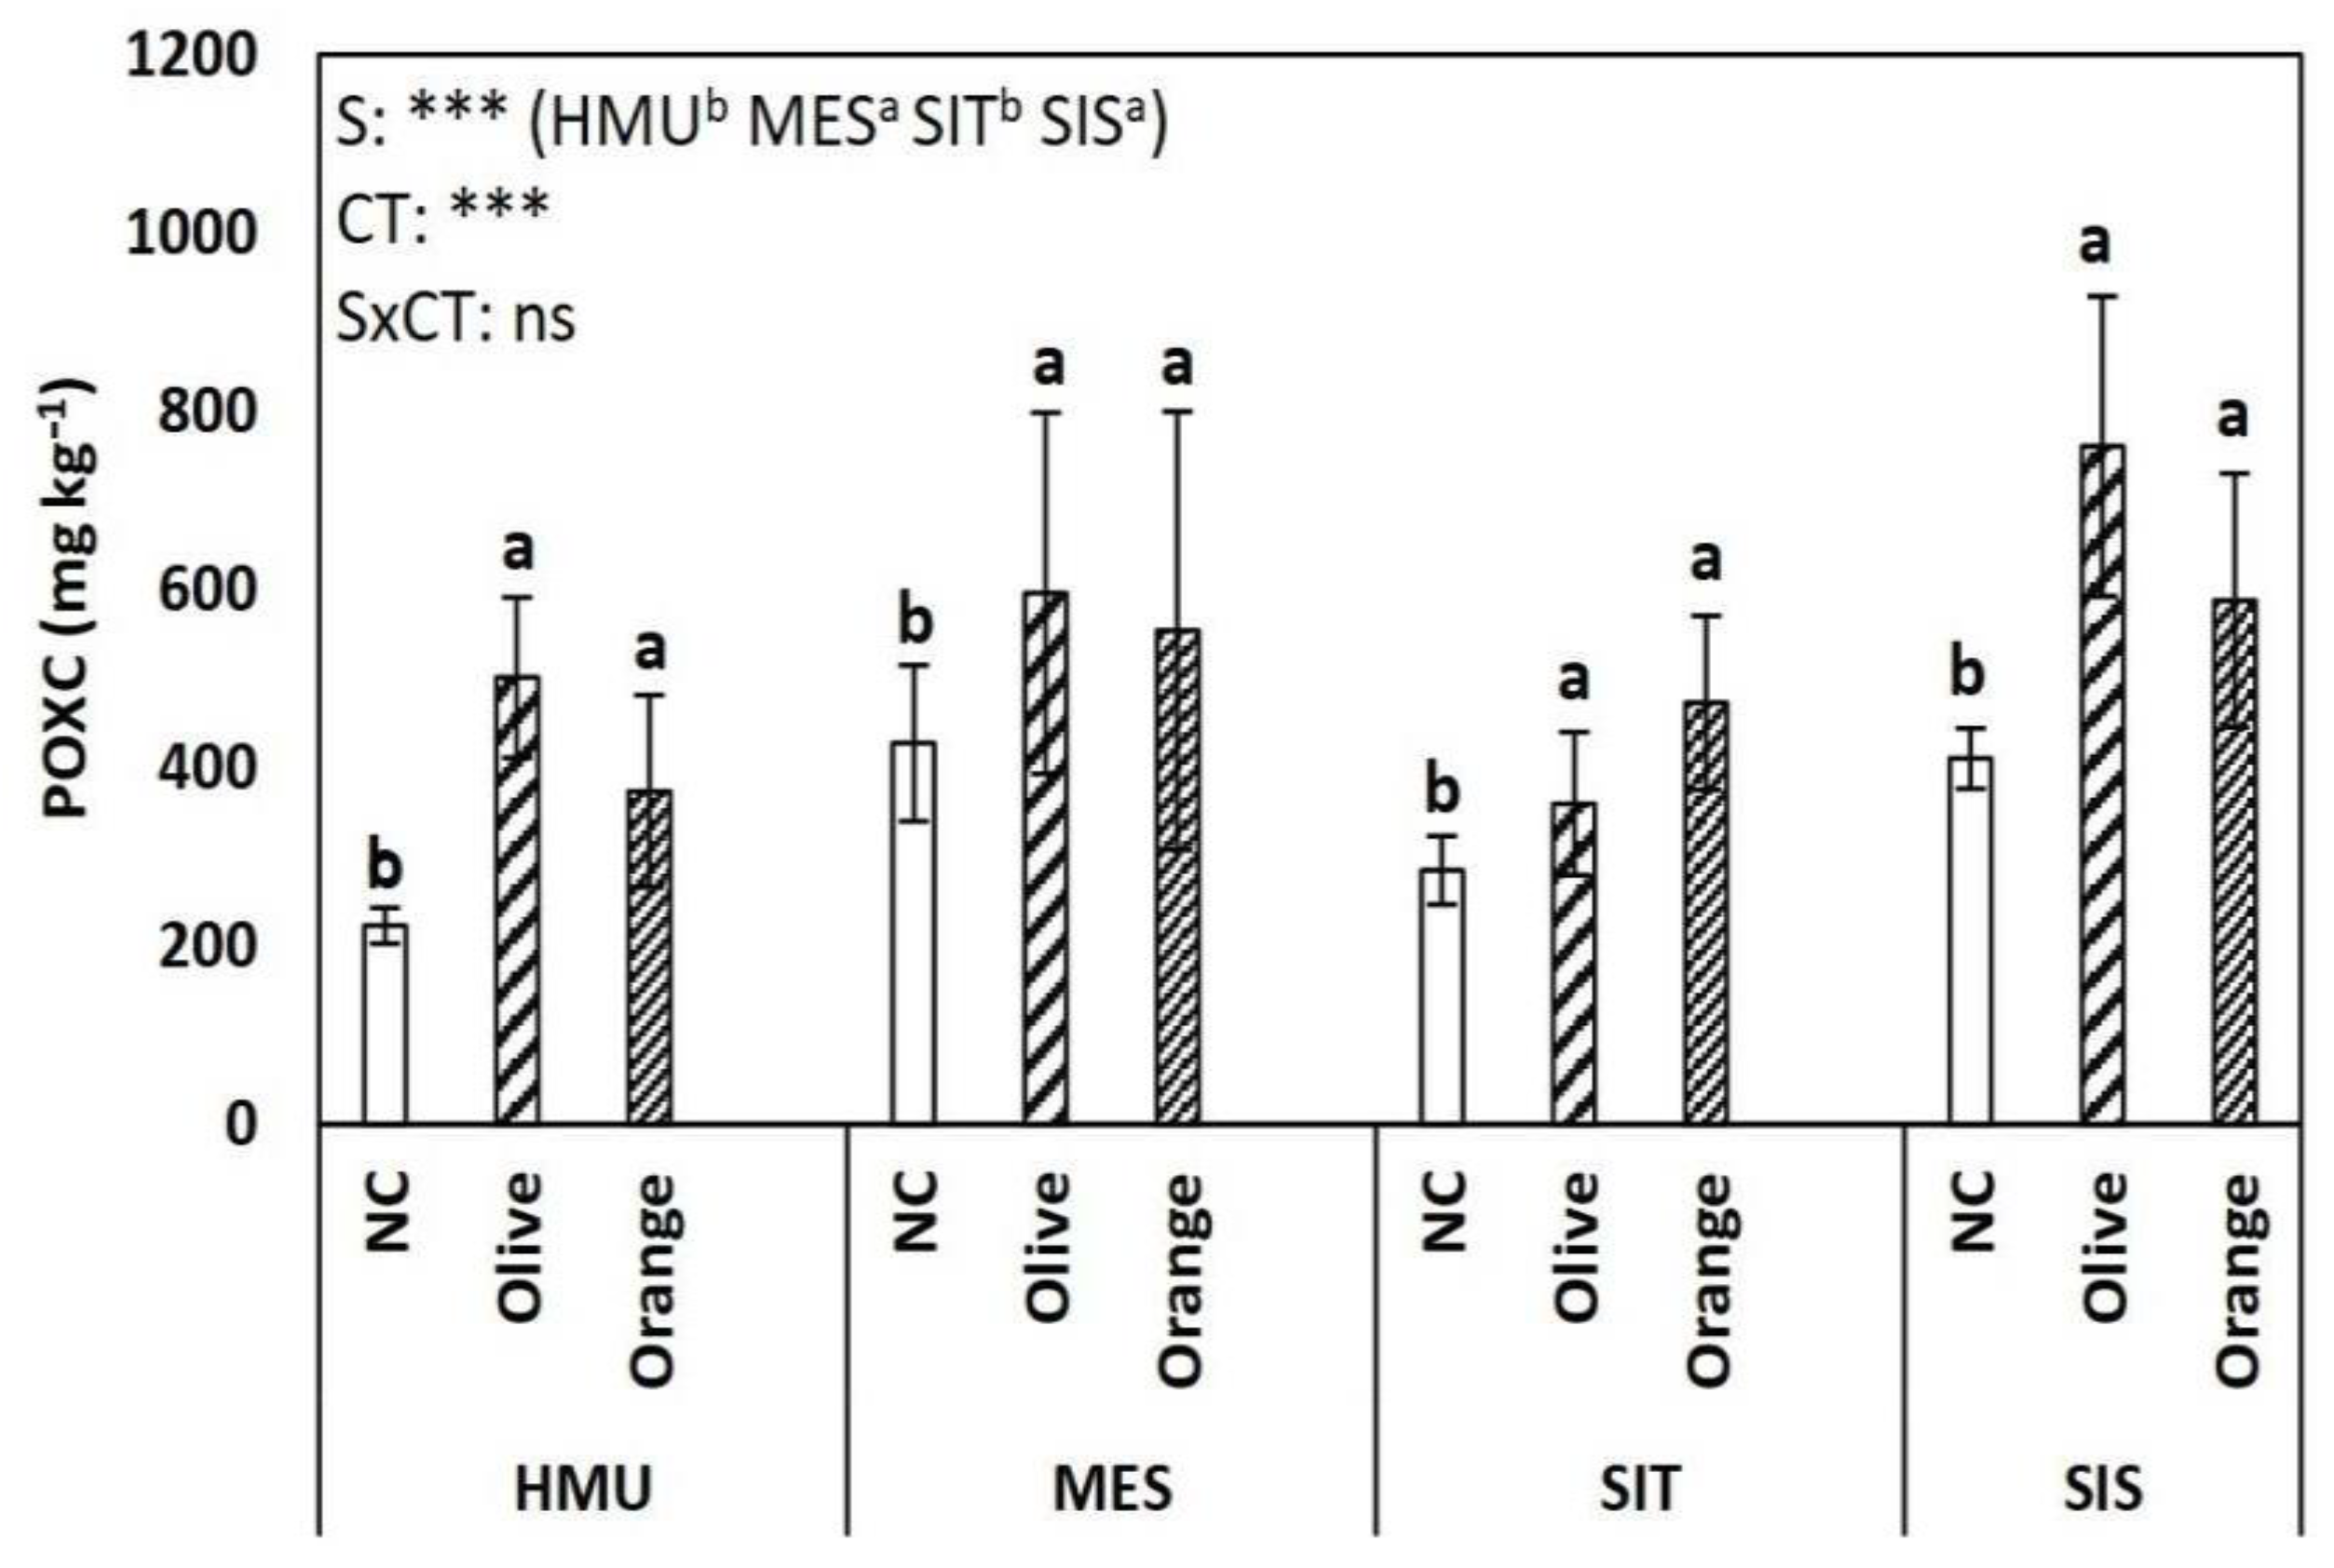
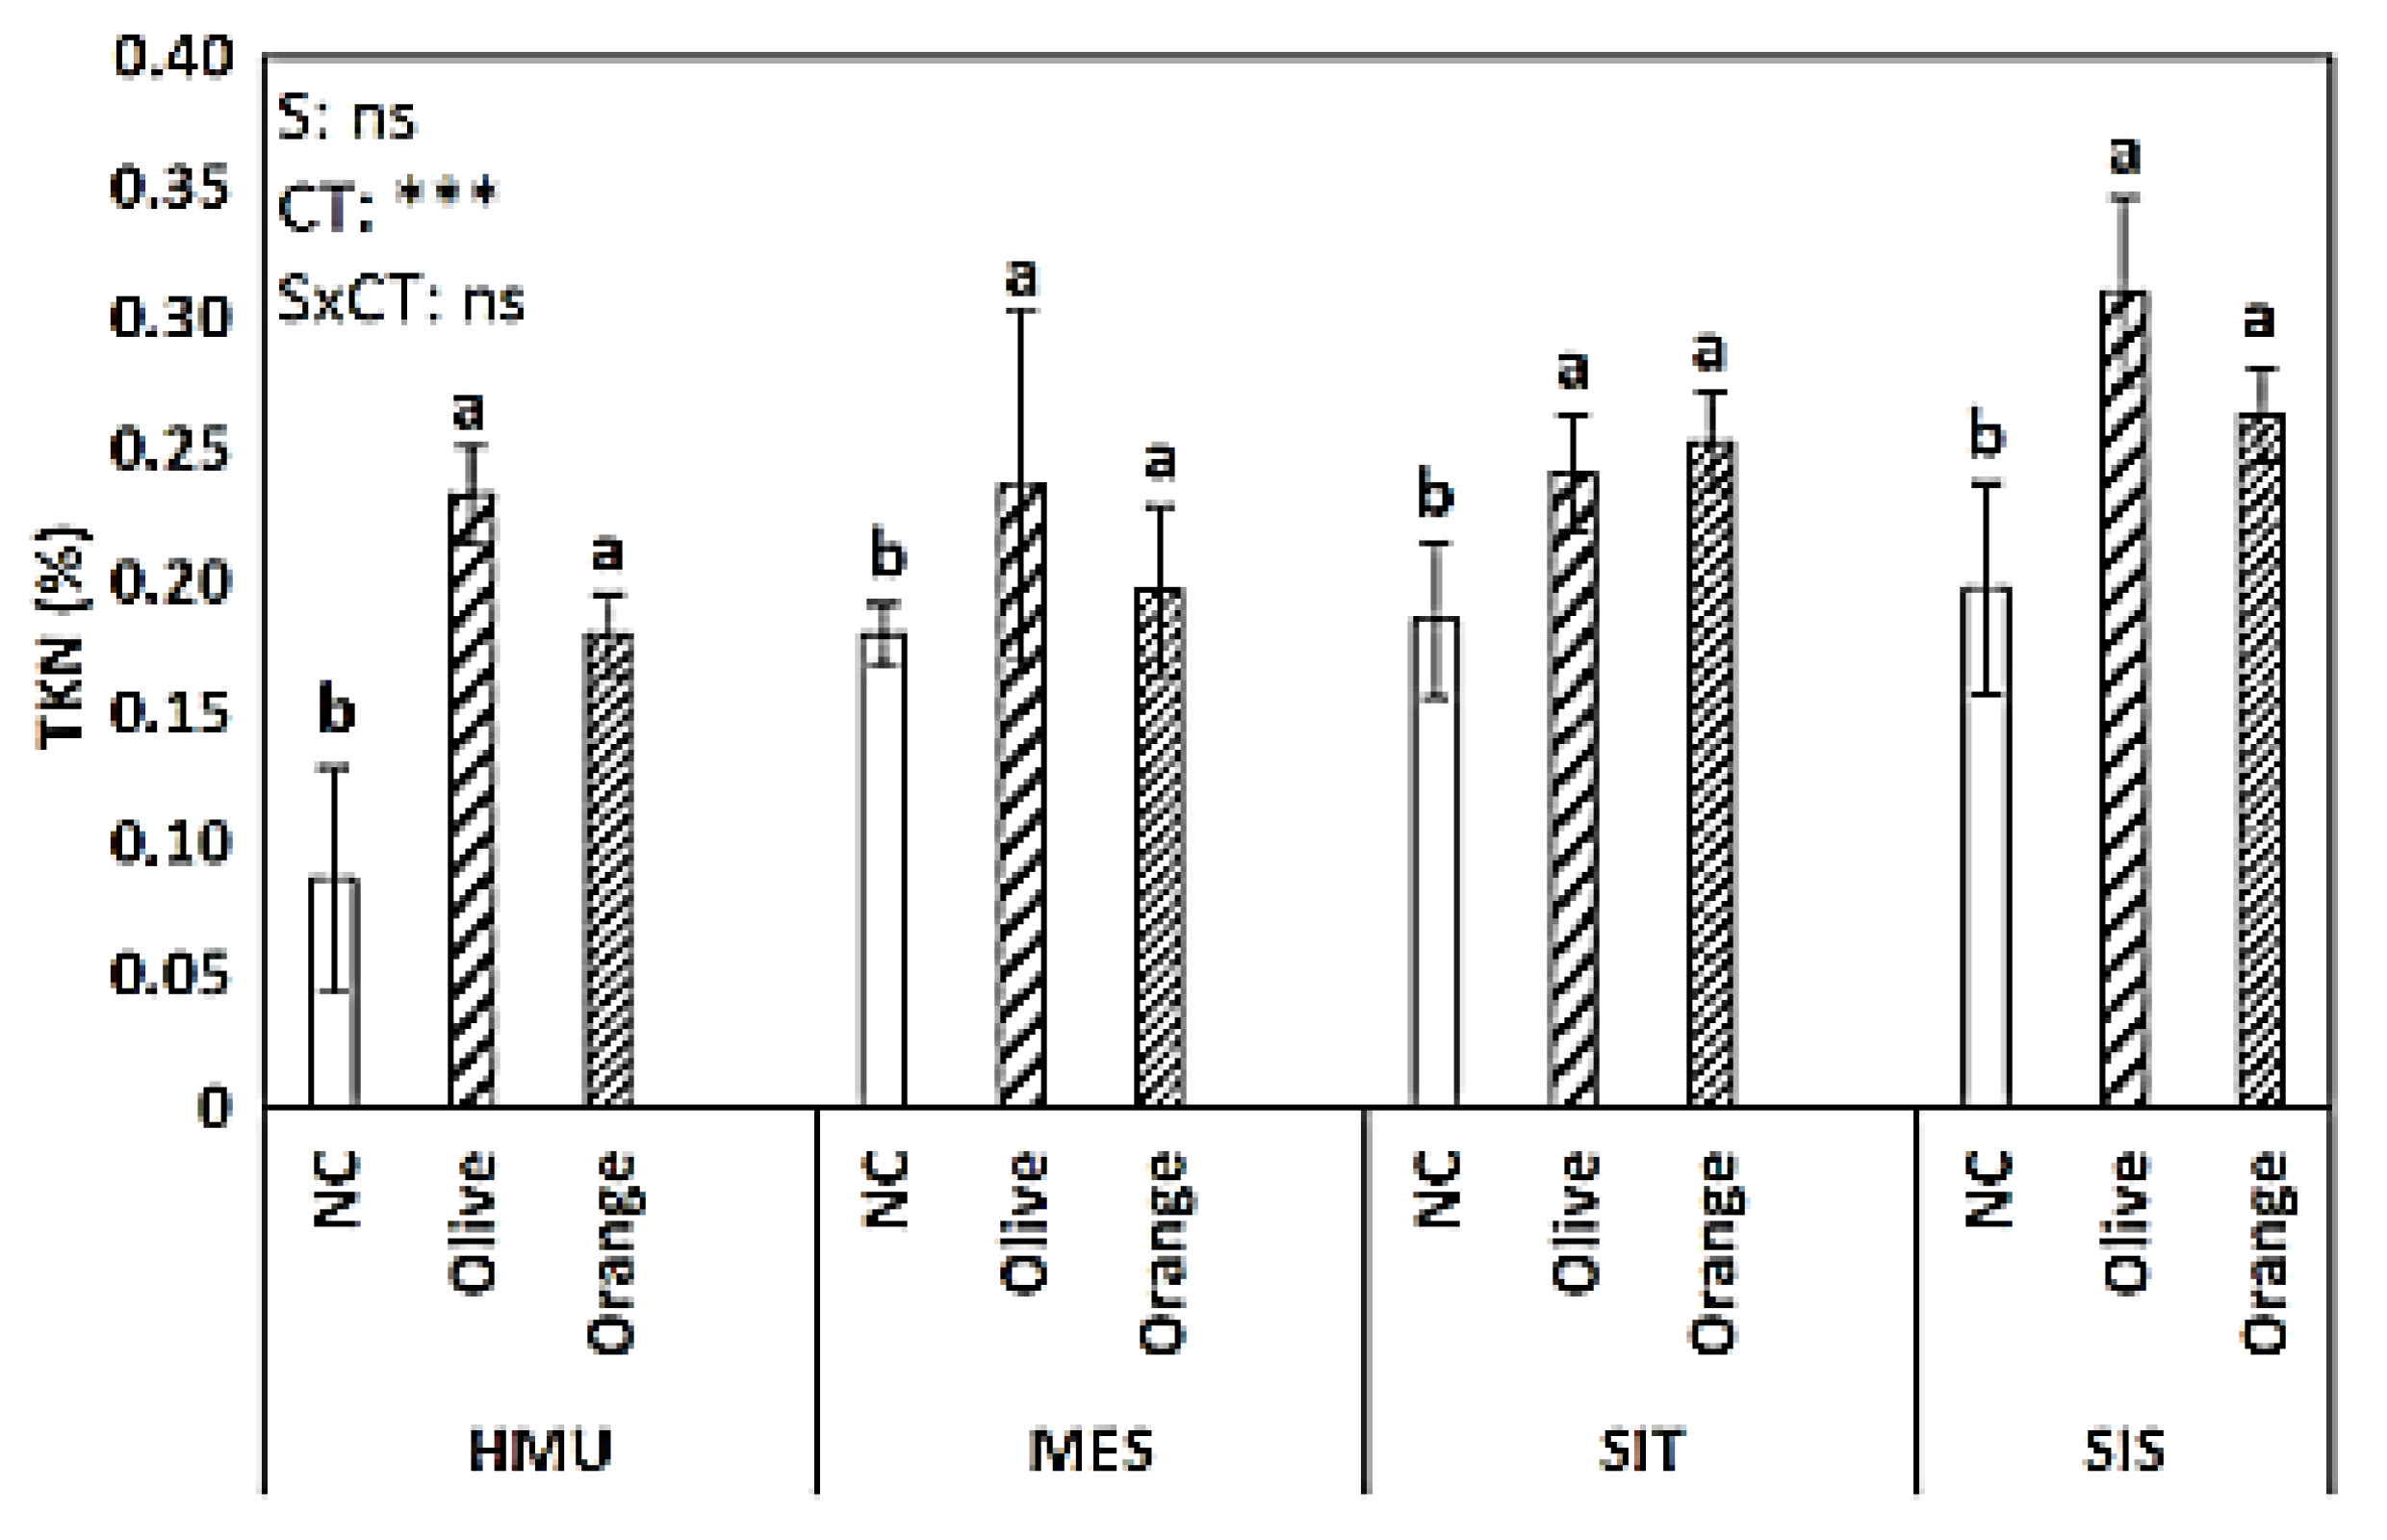
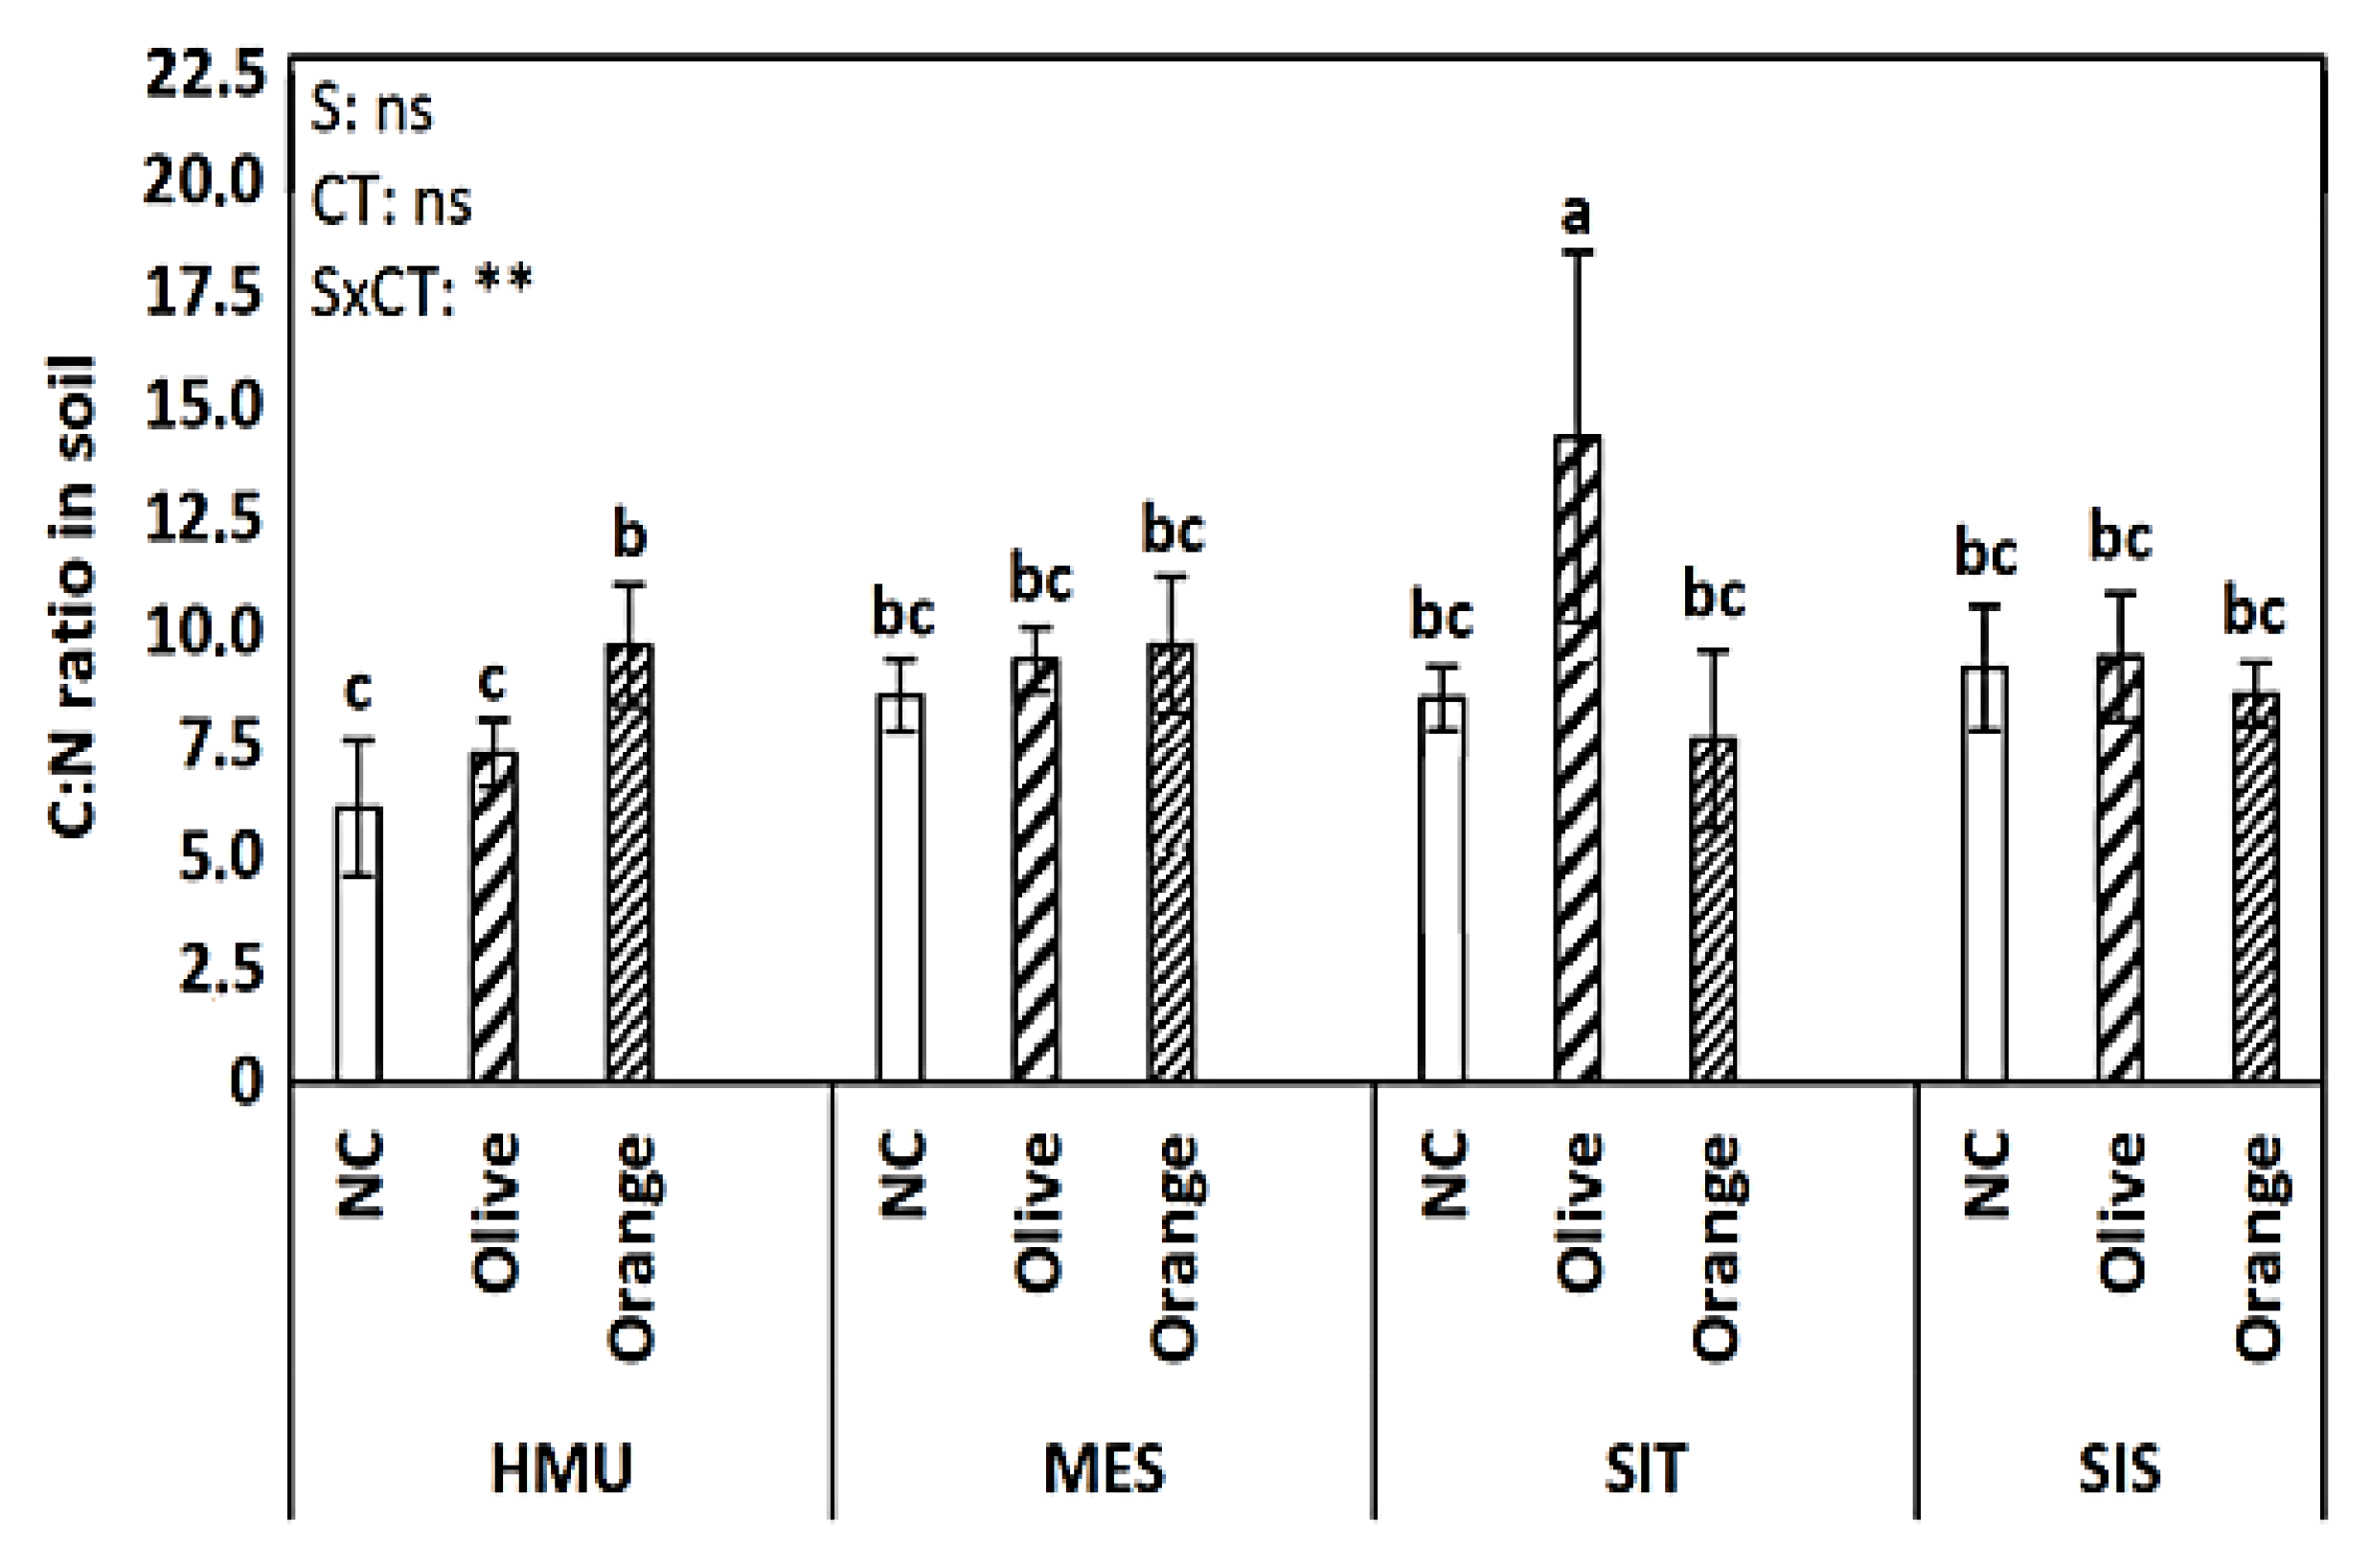
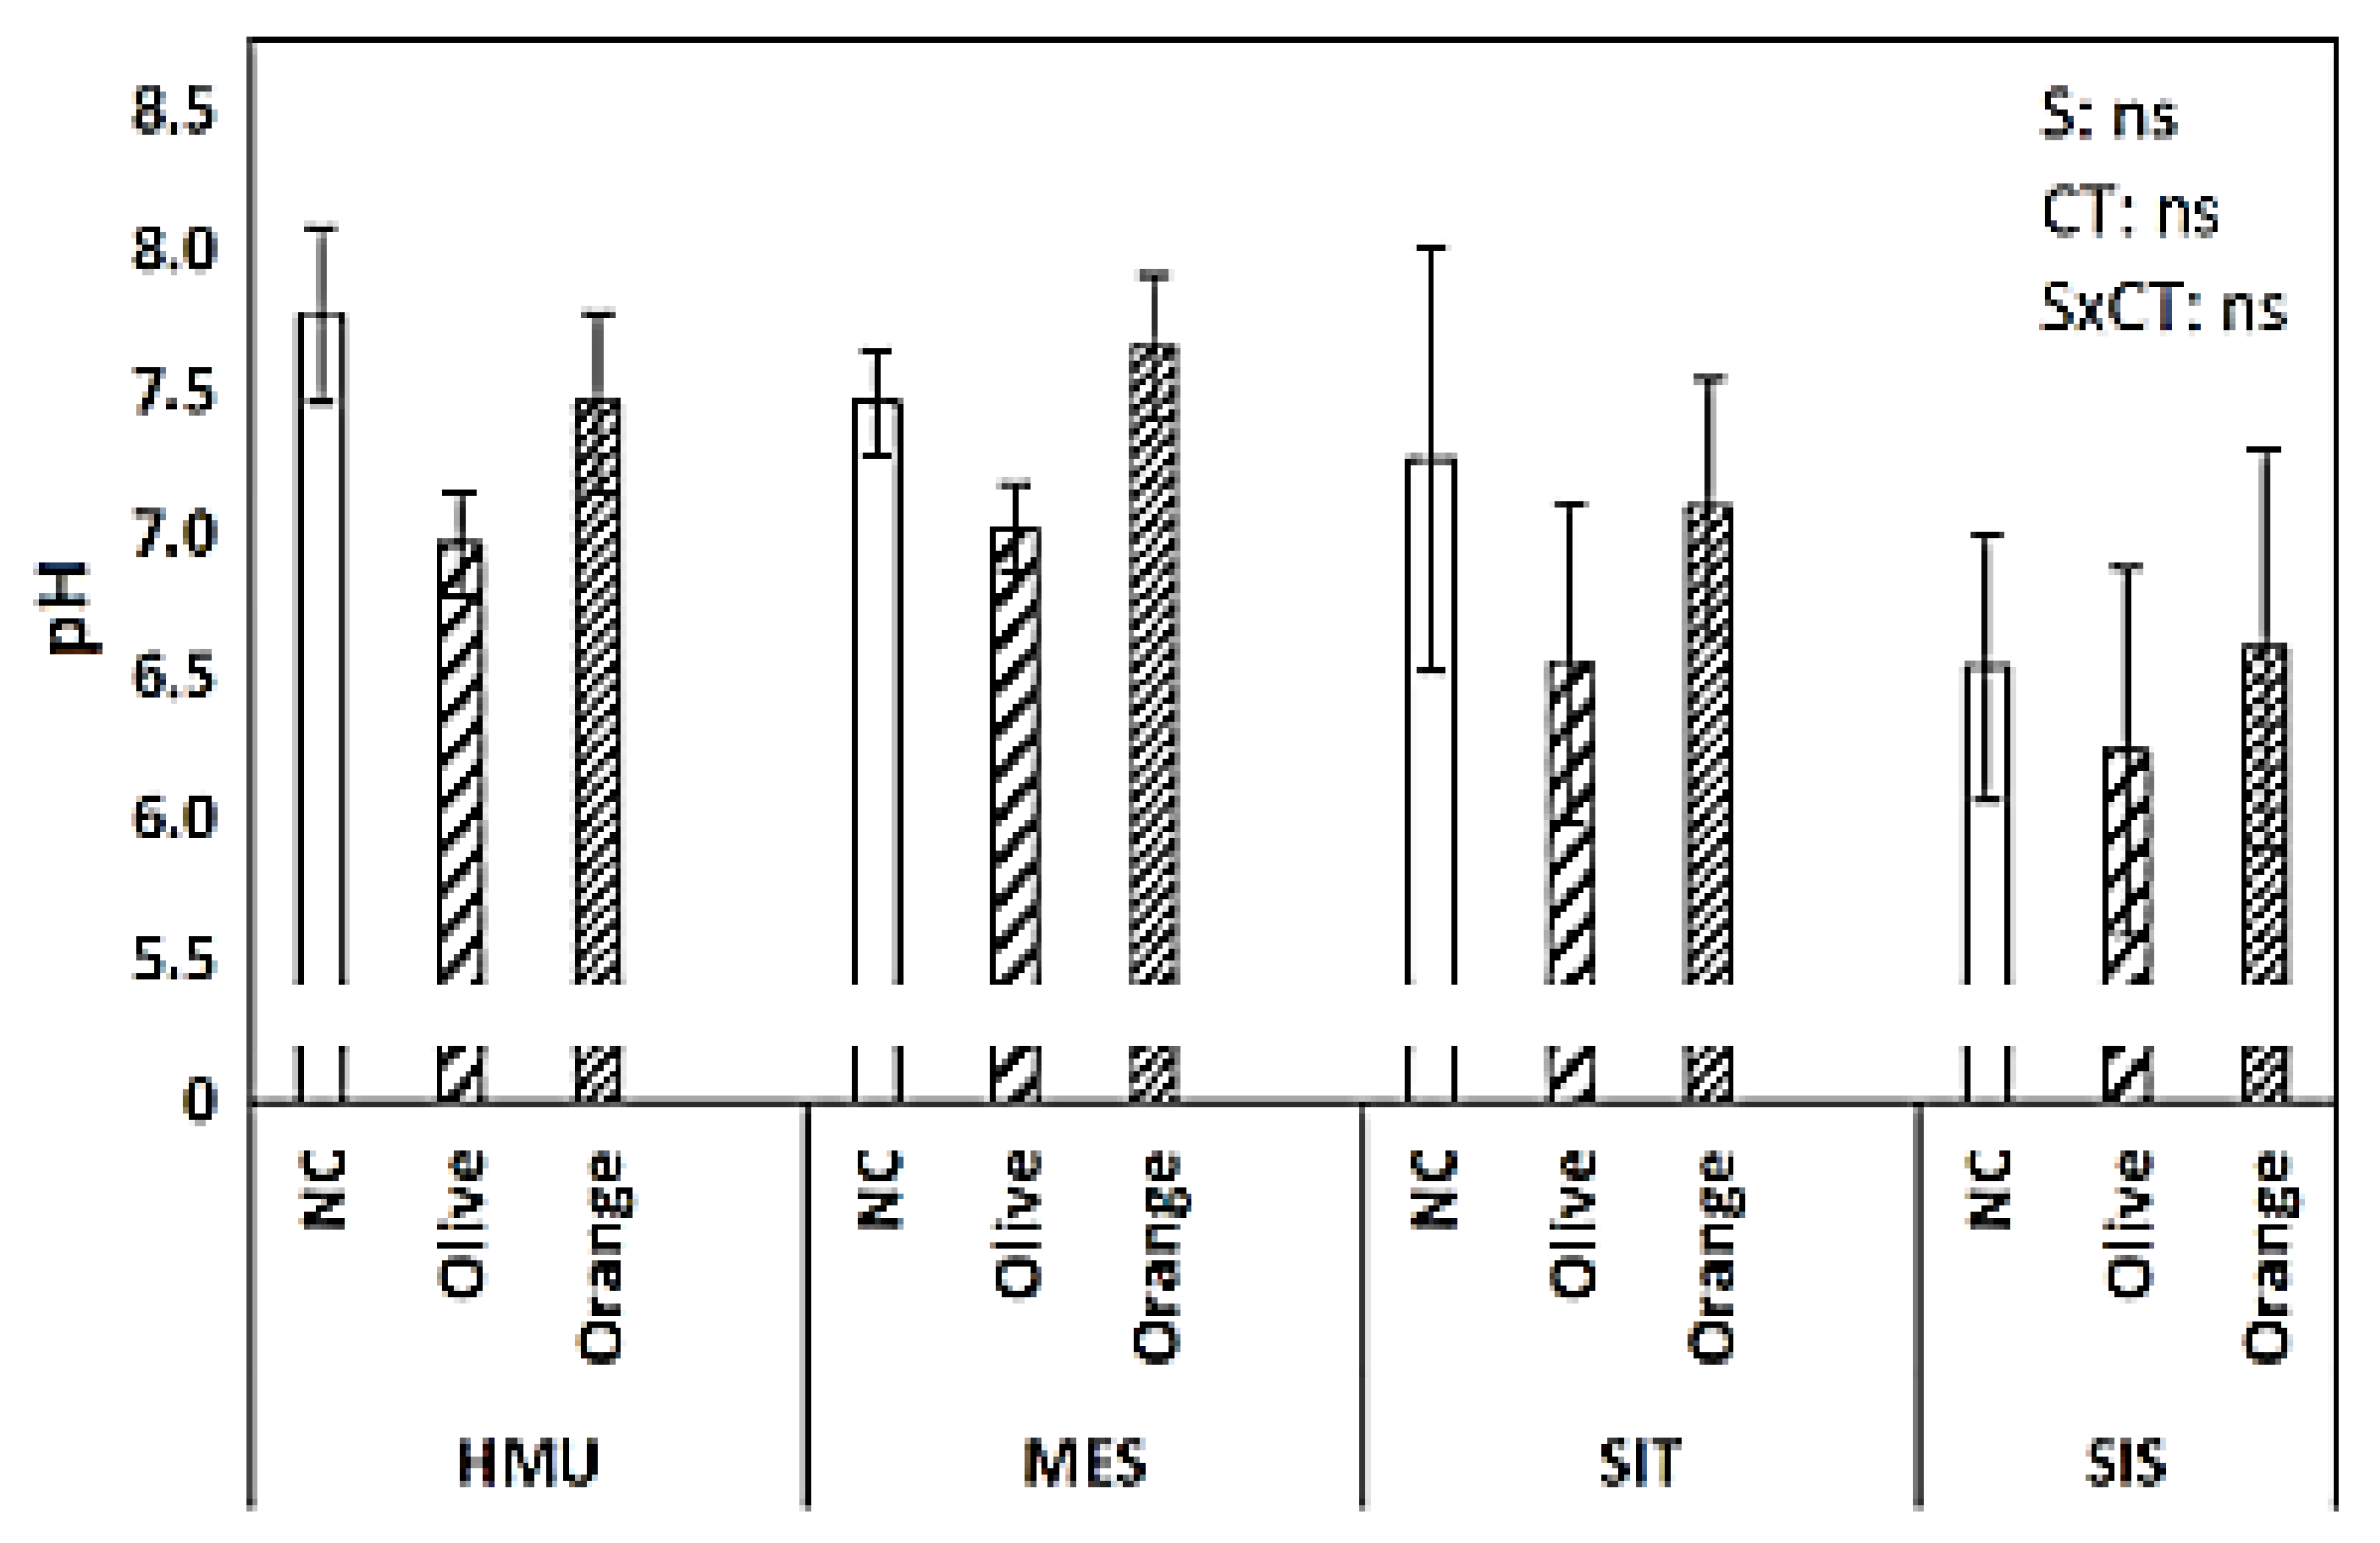
3.1. Soil Organic Matter (SOM), Permanganate Oxidizable Carbon (POXC), Total Kjeldahl Nitrogen (TKN), C:N Ratio, and pH

Soil organic matter (SOM) showed variation across different sites (p < 0.05) and cultivation (p < 0.001) (Figure 2). Olive orchards tended to have higher SOM compared with the orange orchards in all sites (HMU, MES, SIT, SIS) (Figure 2). Lower SOM values were found in uncultivated fields suggesting plant species’ critical contribution to SOM enhancement. Different impacts on POXC were detected among sites (p < 0.001) and tree crop species (p < 0.001) without a clear trend (Figure 3). Similar to SOM, uncultivated fields showed lower POXC values than tree cultivations (Figure 3).
Similar trend contrasts were also recorded for the parameters of the Total Nitrogen (TKN) (Figure 4) and C:N ratio (Figure 5), revealing an influence of site on olive and orange crops. Concerning the TKN, significant differences were observed only among crops (p < 0.001). Higher TKN values are recorded for fields planted with olive and orange compared with uncultivated areas (Figure 4).
The C:N ratio varied between sites and crops (Figure 5) and was influenced by site and tree crop species. The C:N ratio values in the cultivated and uncultivated fields in MES and SIS sites did not differentiate; on the contrary, in HMU, the highest C:N values were higher in the citrus orchard, whereas in the SIT site, the olive orchard was the one exhibiting the highest values.
The mean pH value in the uncultivated fields ranged from 6.5 to 7.8 (Figure 6). Furthermore, the pH factor was unaffected by the site or tree crop species. The olive groves always exhibited lower pH than the uncultivated fields (5–12% lower pH values). On the other hand, the citrus orchard pH values were always slightly higher than in olive groves, around 6–9%.

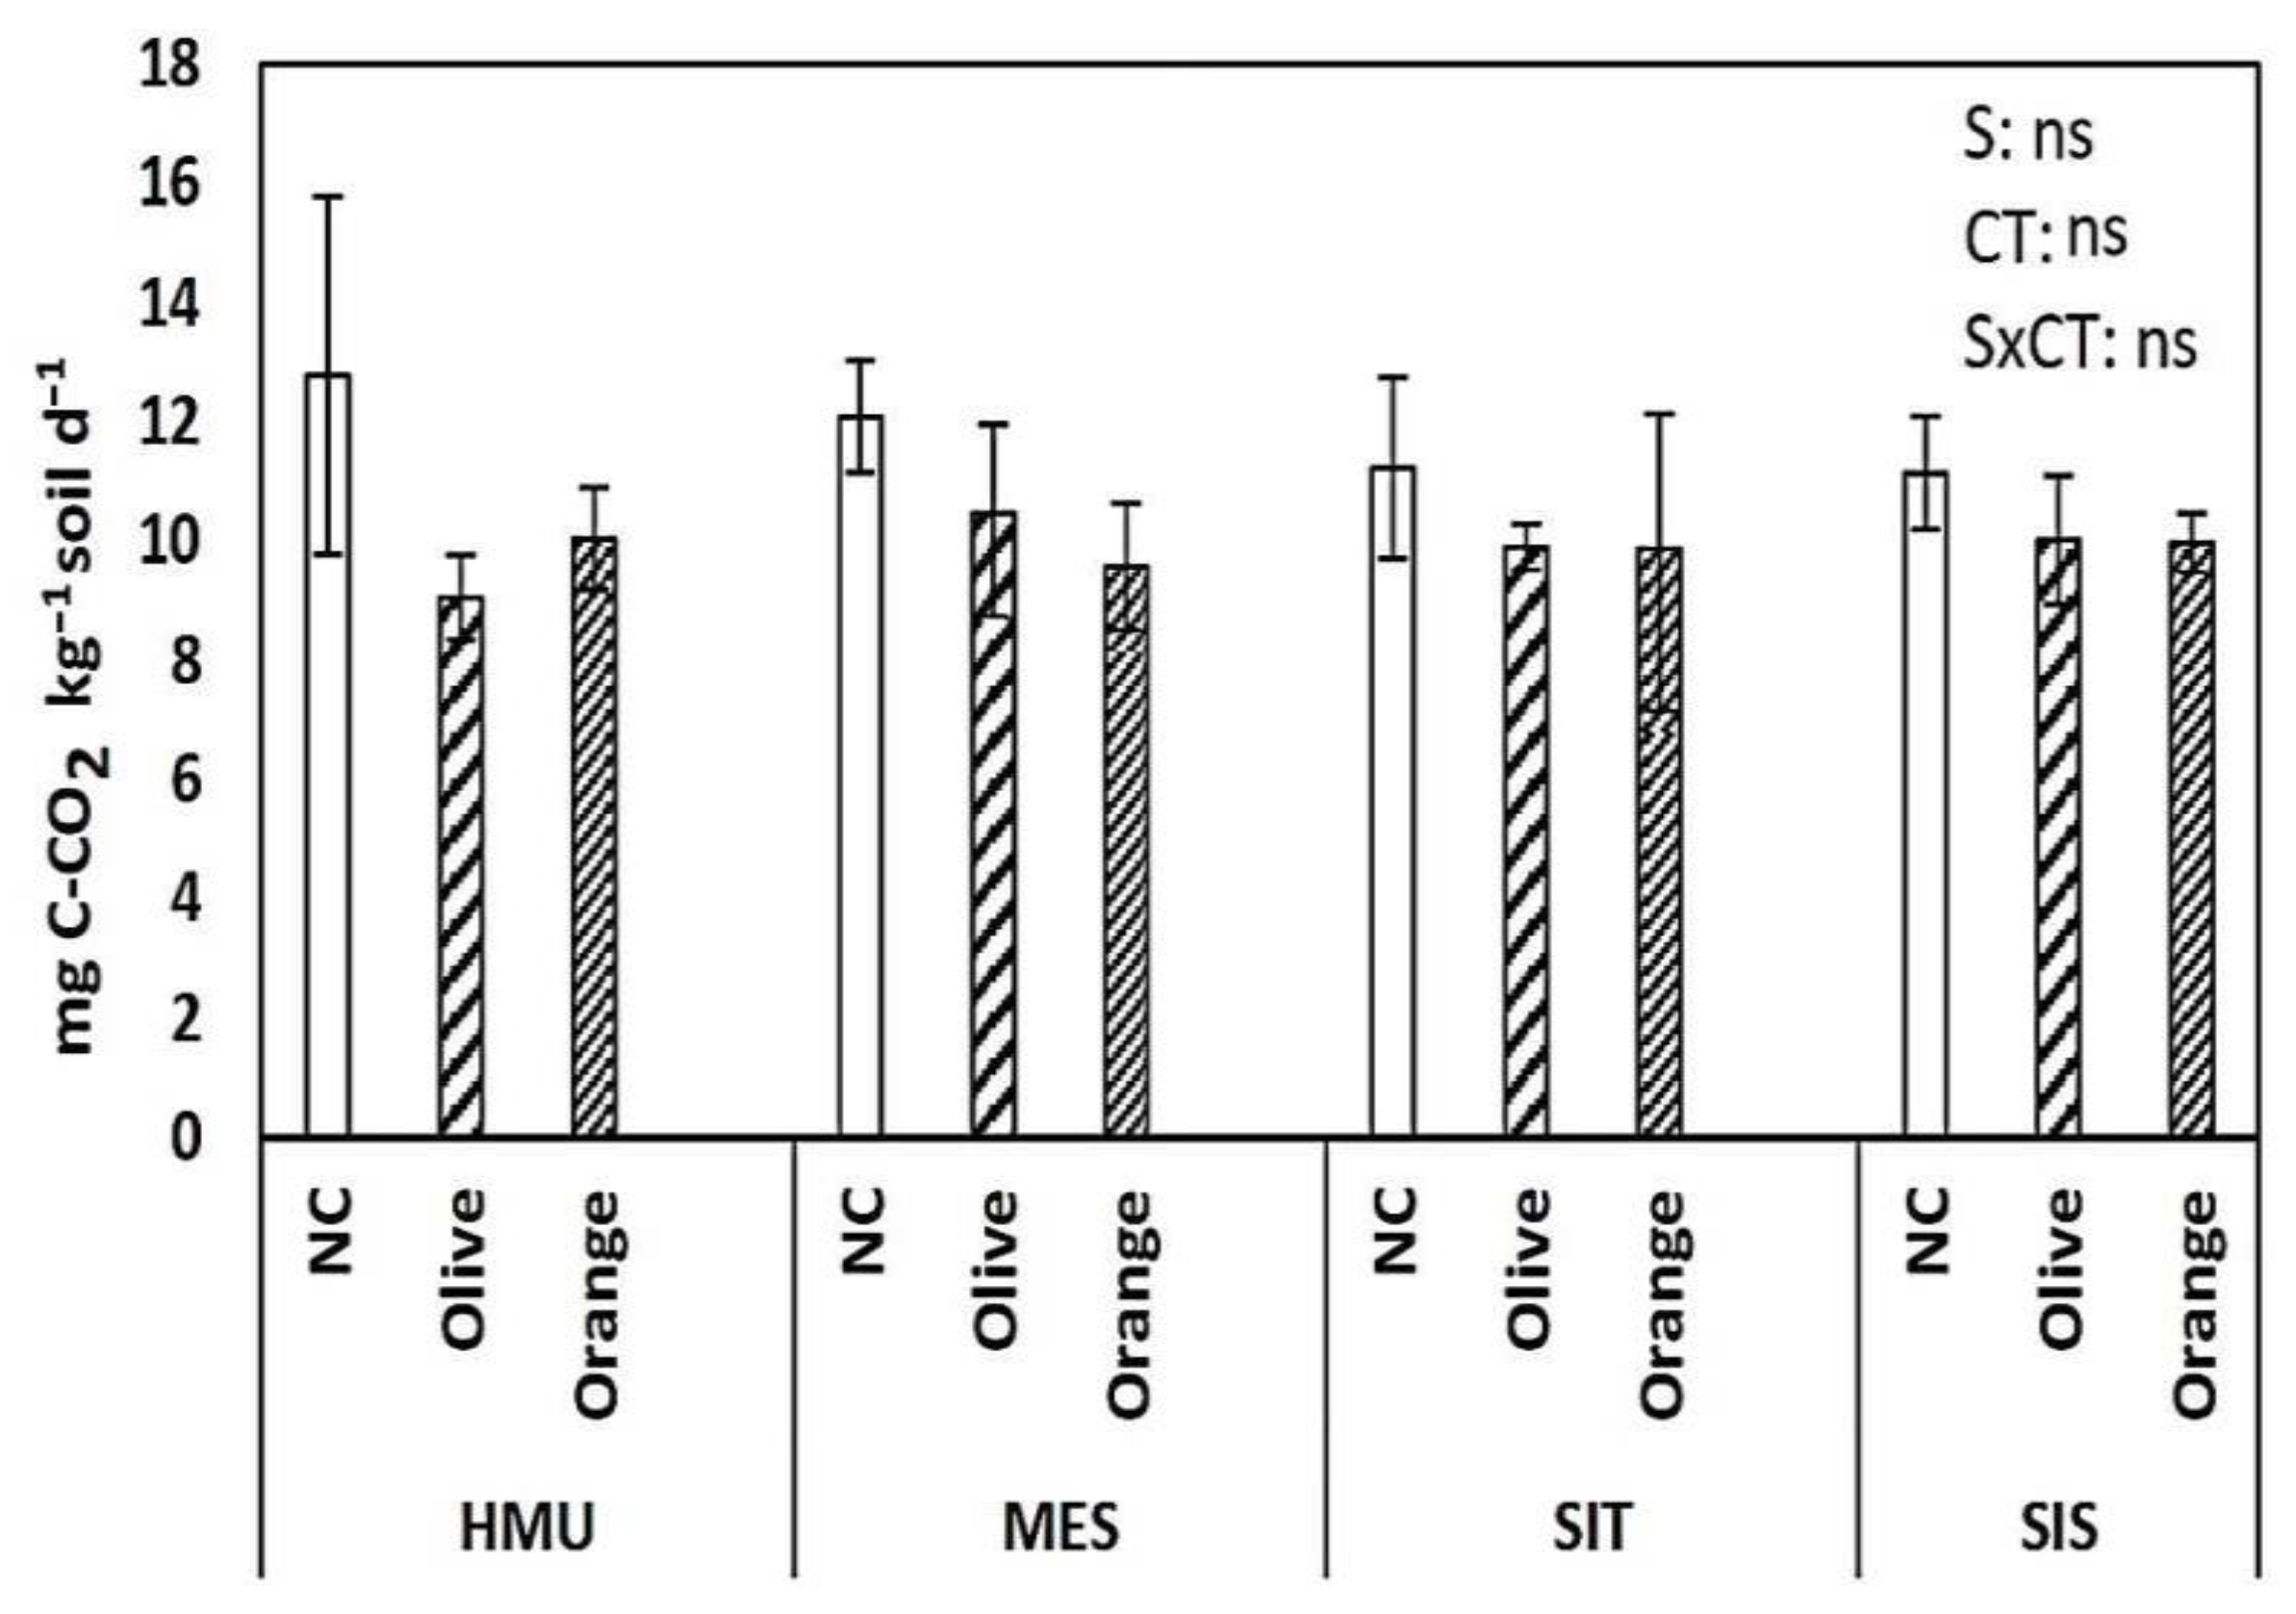
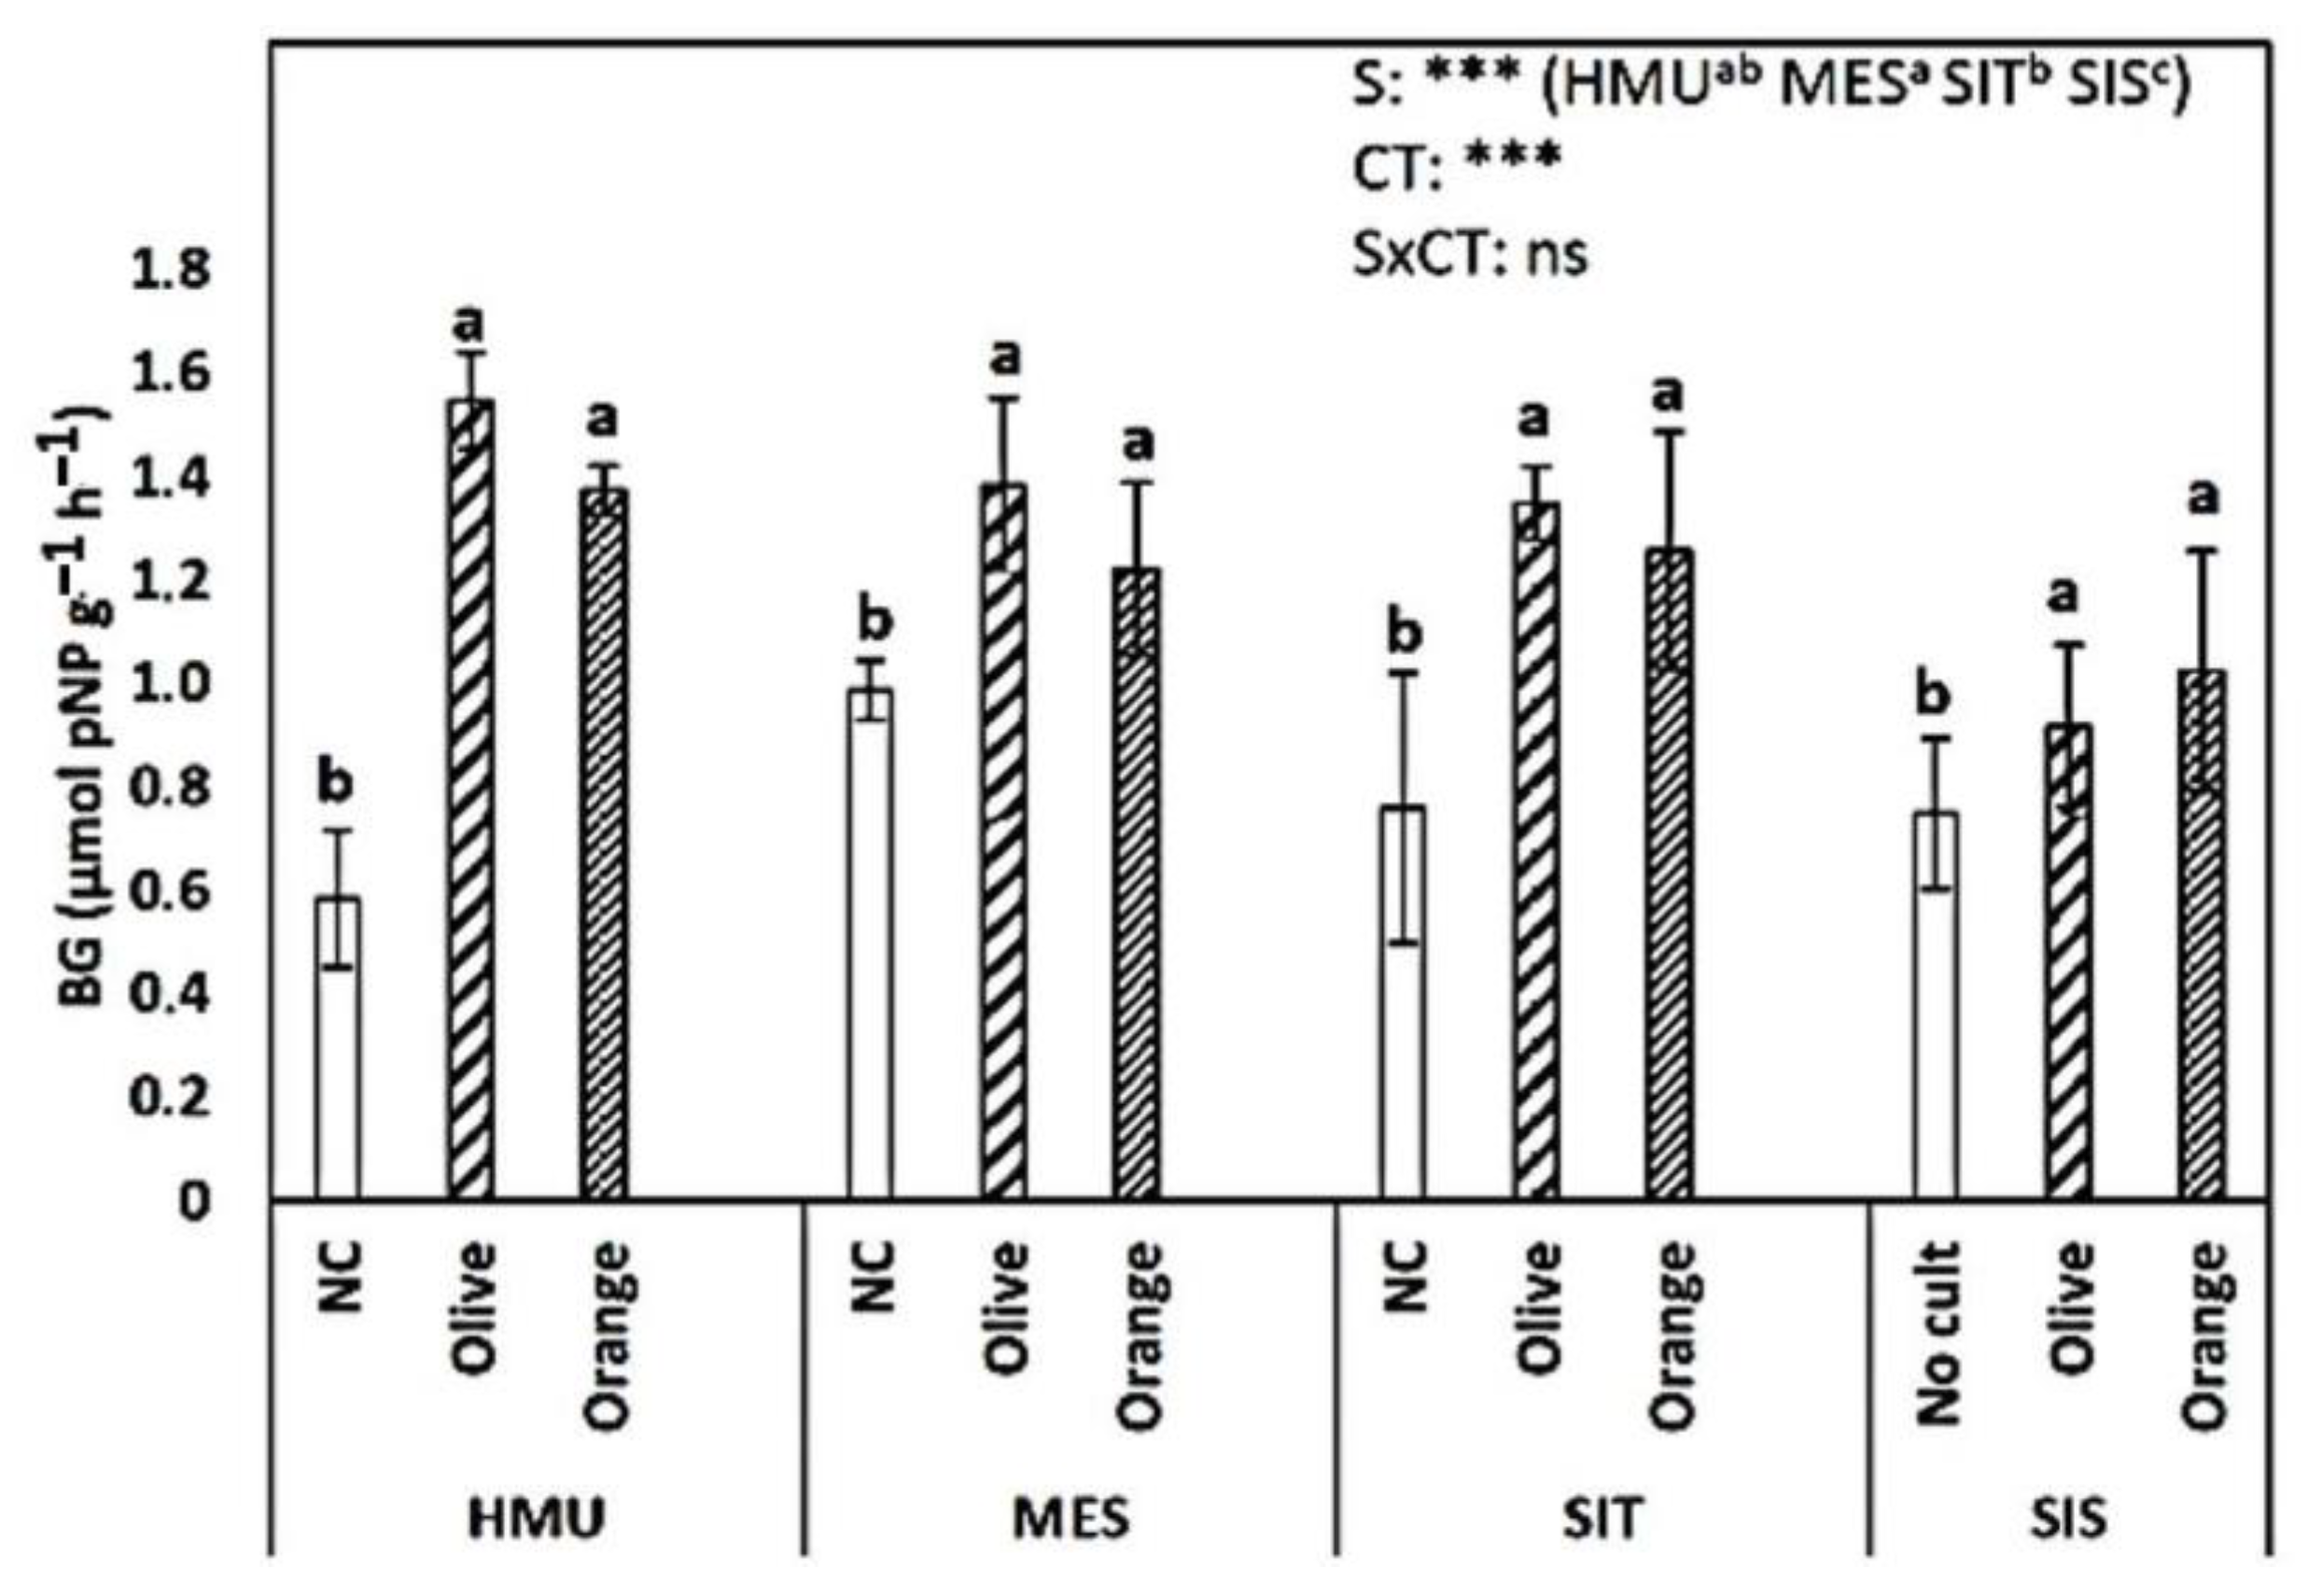
3.2. Respiration rates

The mean respiration rate ranged between 9.7 and 12.7 mg CO2 kg−1 soil d−1 in the uncultivated fields, 9.0 and 11.9 mg CO2 kg−1 soil d−1 in the olive groves, and 10.0 and 12.0 mg CO2 kg−1 soil d−1 in the citrus orchards (Figure 7). Therefore, there was no clear trend for this individual parameter.

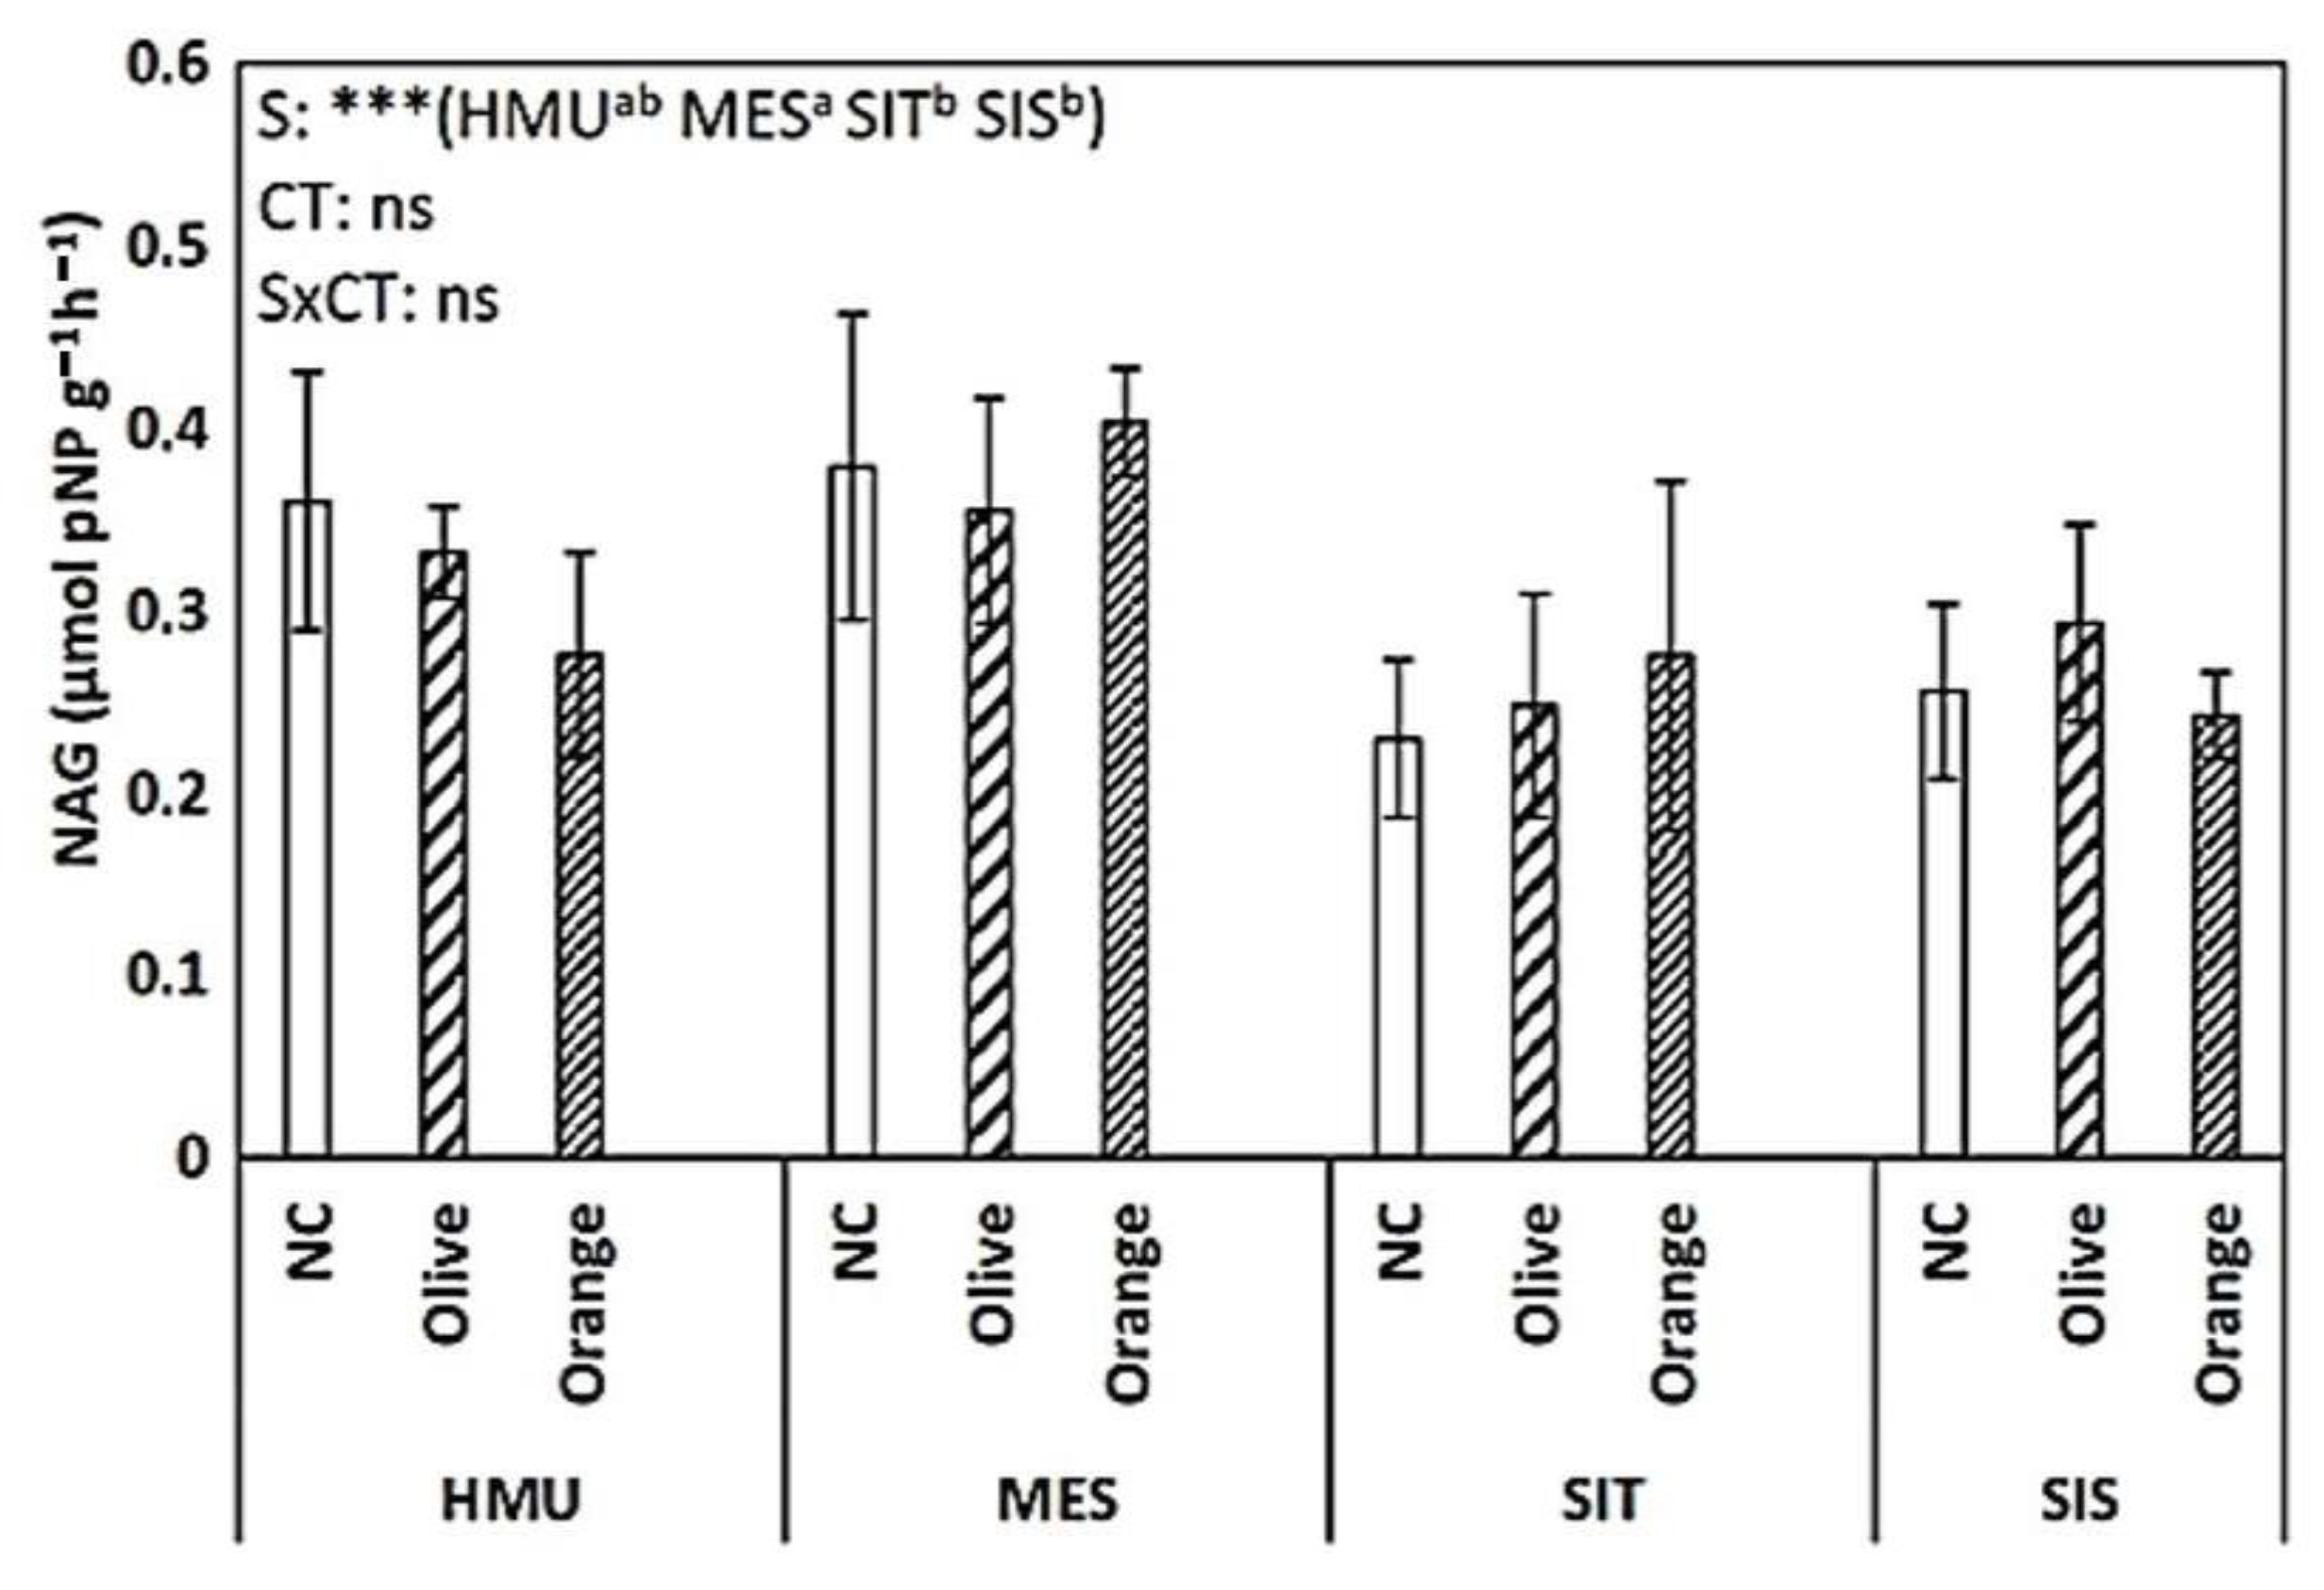
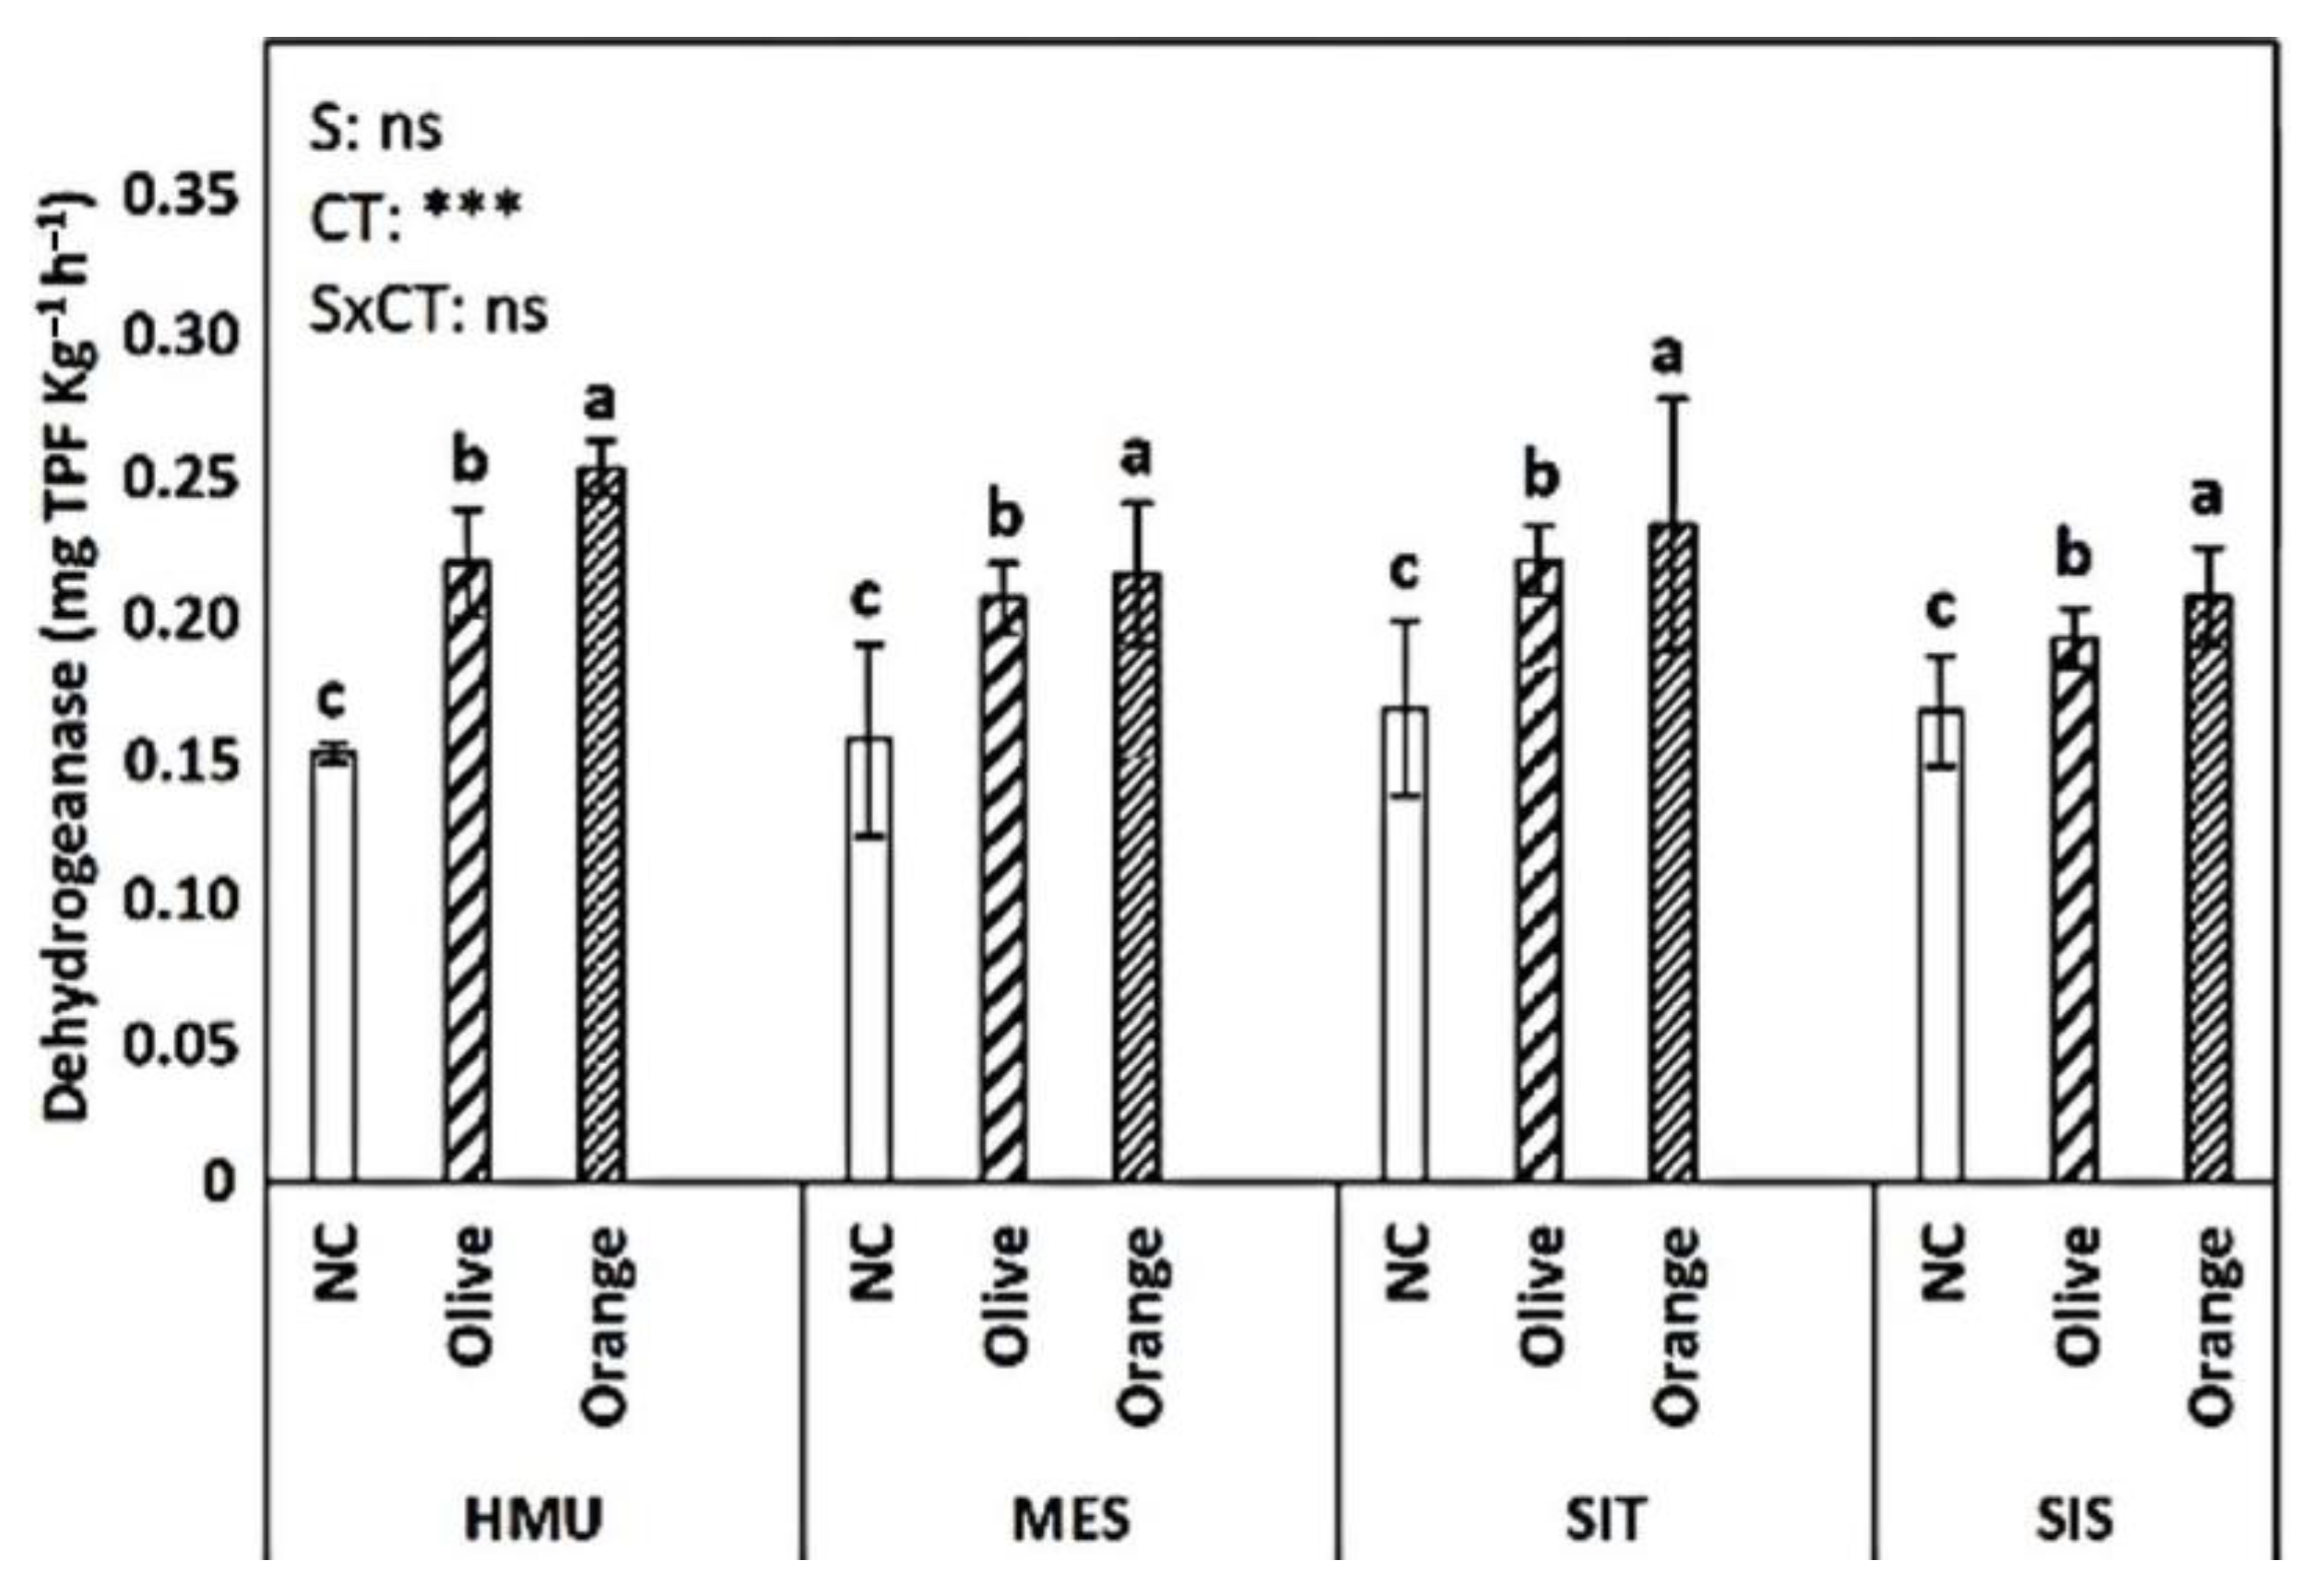
3.3. Enzyme Activities

NAG activity did not exhibit a clear trend (Figure 8). In HMU, the uncultivated field had the highest values; in MES and SIT, the orange orchards showed the highest values, while in SIS, they were higher in olive cultivation. BG activity was significantly affected by the cropping system (p < 0.001) and site (p < 0.001) (Figure 9). The uncultivated fields had relatively low values. Similar values were recorded in olive and orange orchards (of around 1.2–1.3 μmolpNP g−1 h−1). Dehydrogenase activity was significantly affected by tree crop species (p < 0.001). The higher values were observed in the orange orchards, followed by the olive orchards and the uncultivated fields. Sites did not significantly affect the dehydrogenase activity (Figure 10).

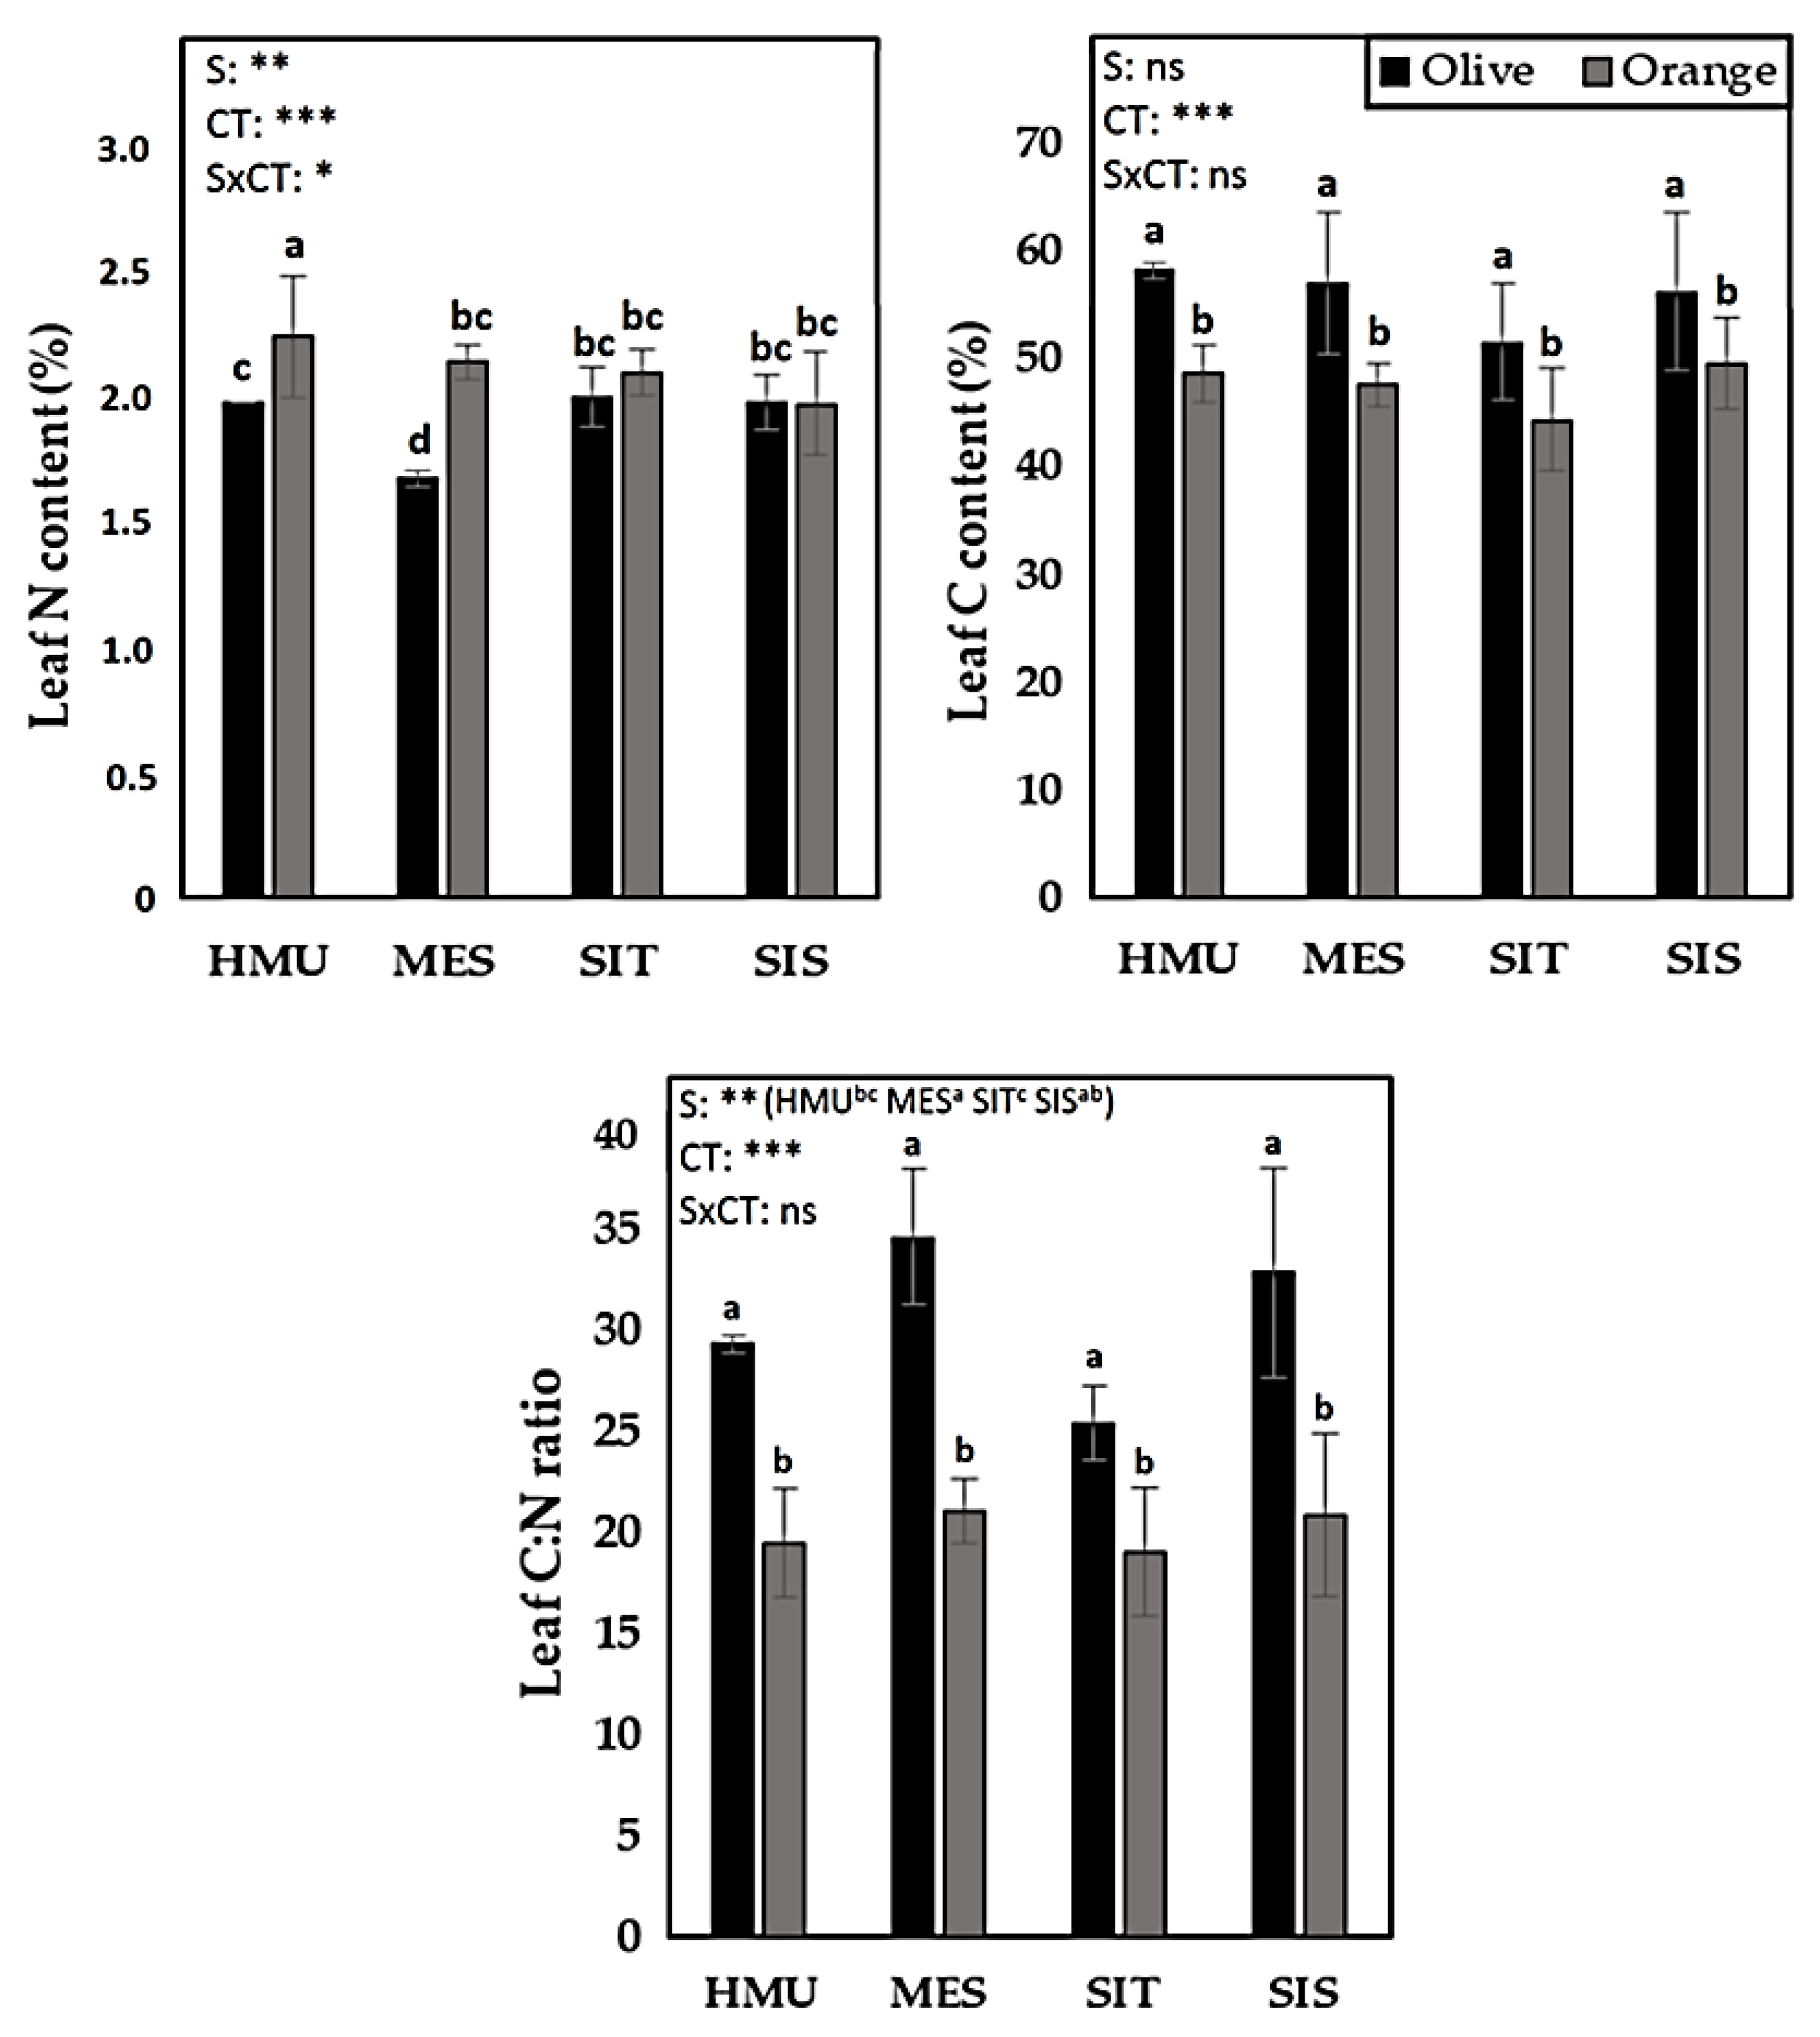
3.4. Carbon, Nitrogen, and C:N Content in Leaves

Orange tree leaves tended to have higher leaf N content than olive trees, particularly in HMU and MES sites (Figure 11). However, the opposite trend was observed for these sites’ leaf C content, resulting in a significantly higher C:N ratio in olive than orange trees (Figure 11).

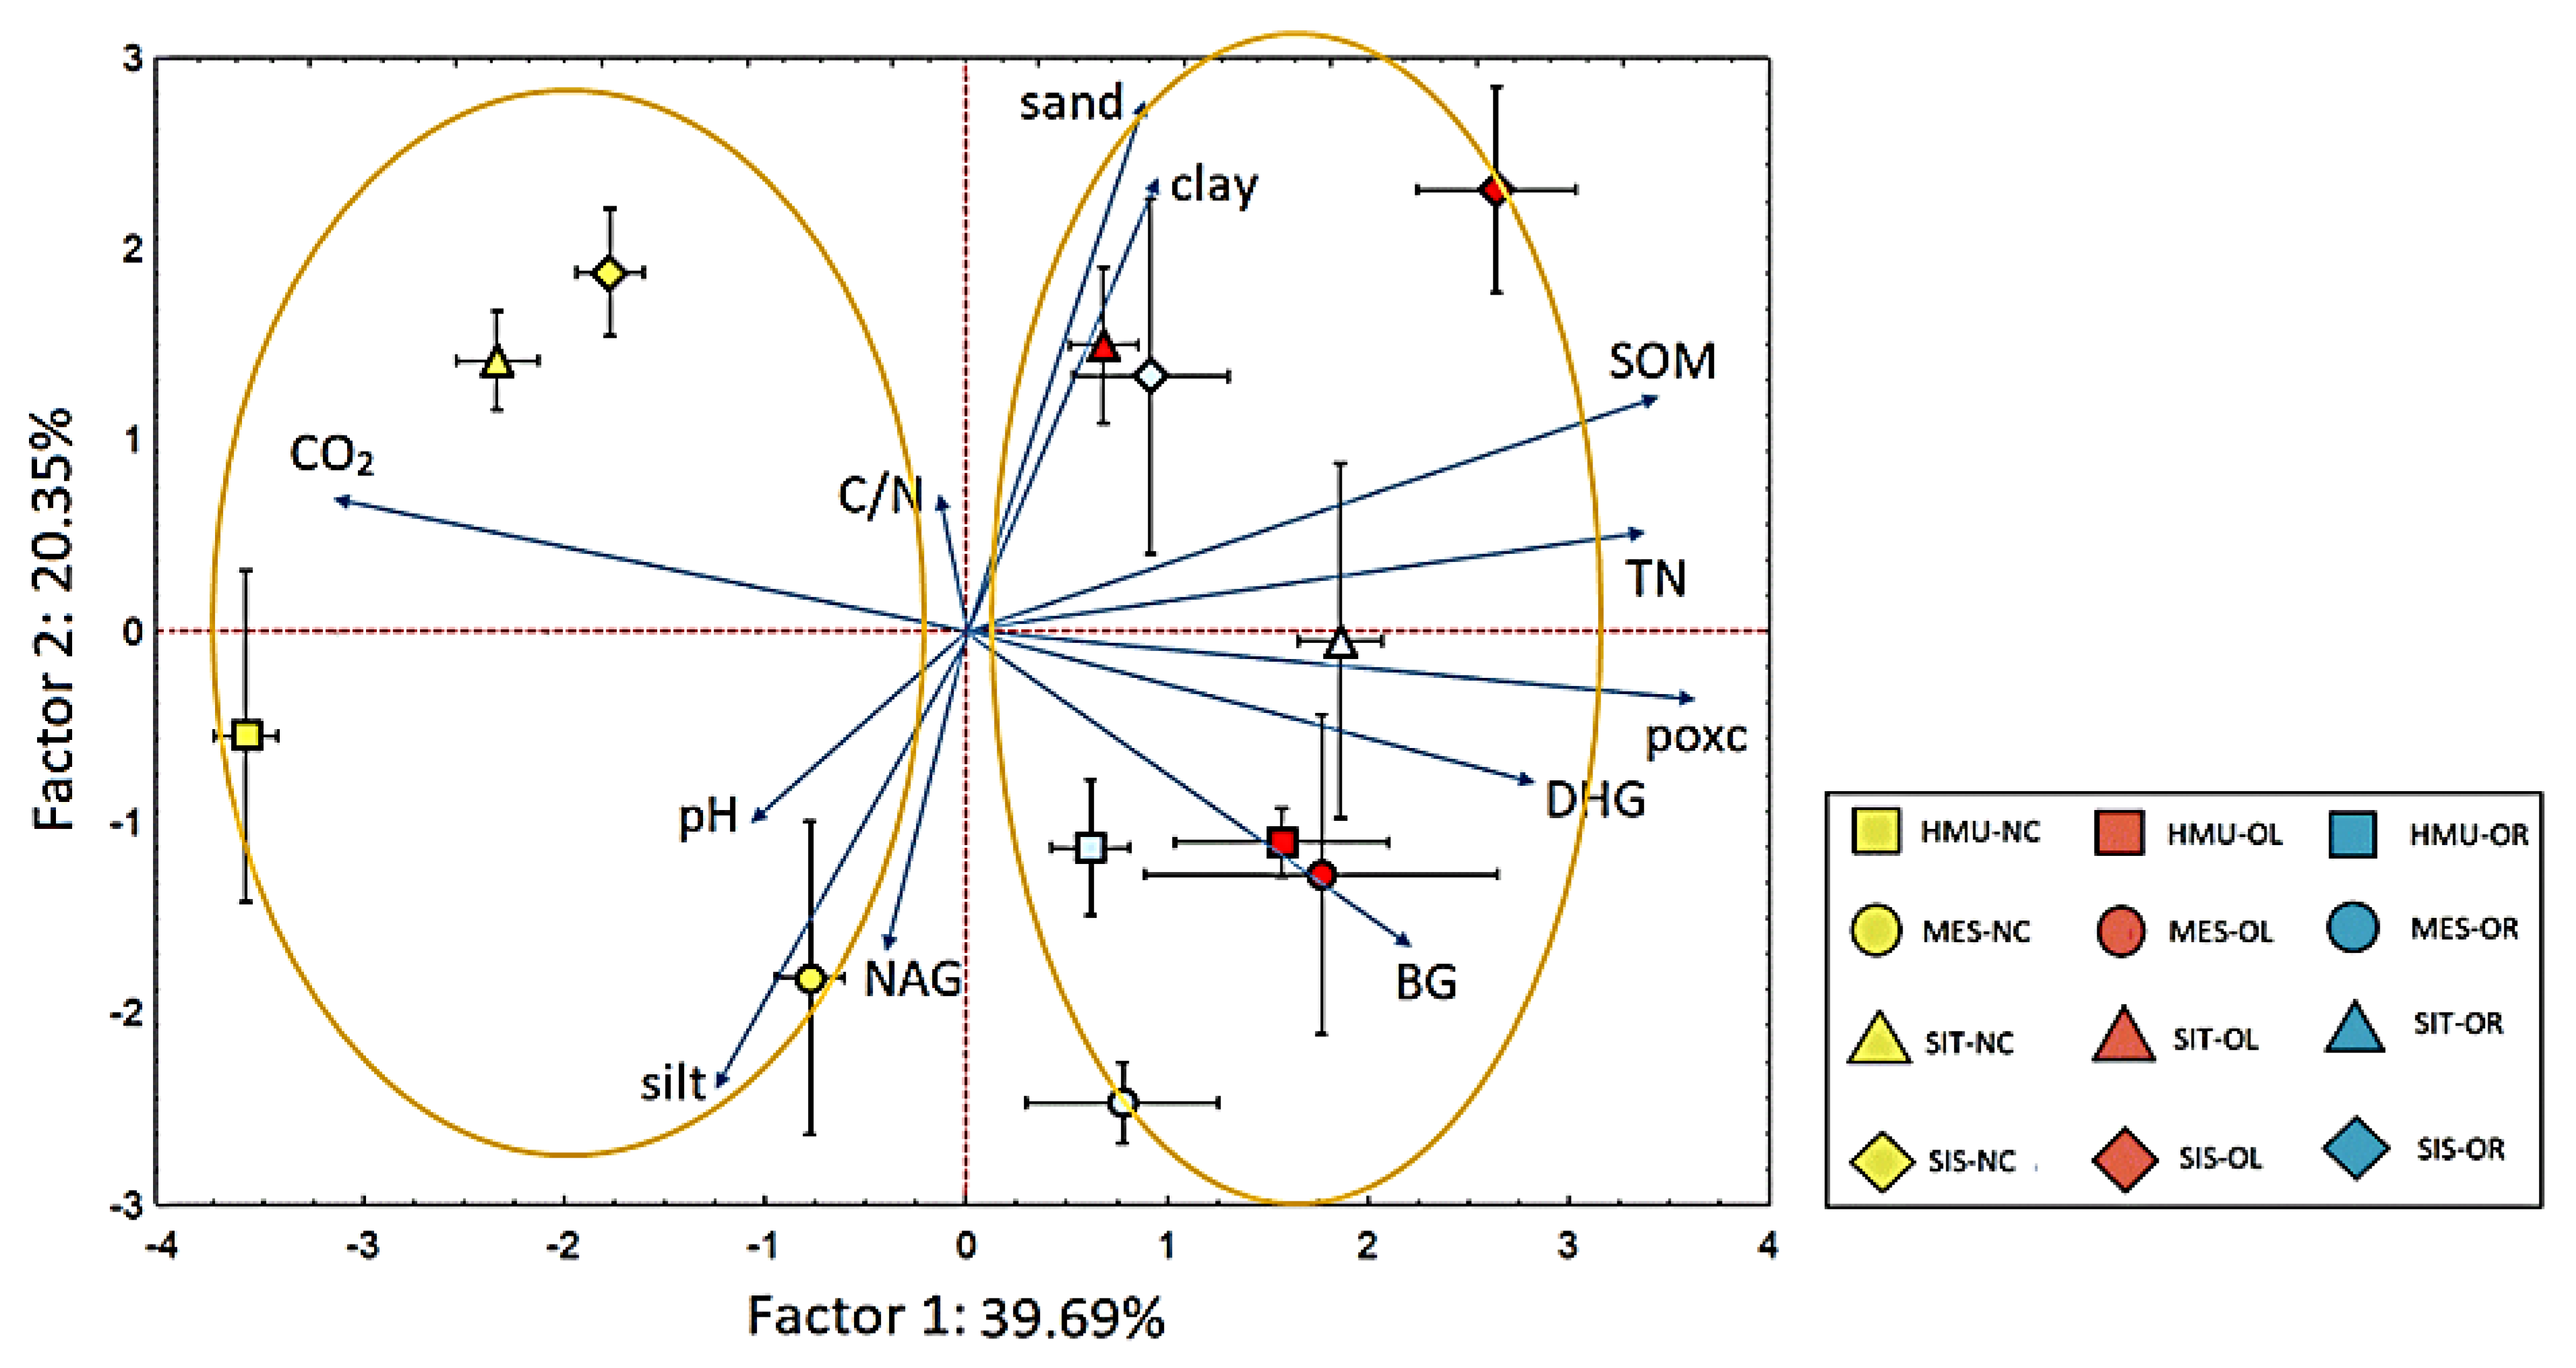
3.5. PCA and Correlation Analyses

The ordination of soil samples and variables on the PCA biplot is depicted in Figure 12. The first two PCA axes accounted for 60.04% of the data variability. The differentiation of samples due to the type of cultivation is shown along the first axis, which explained 39.69% of data variability. Samples from the uncultivated fields were ordinated within the left side of the biplot, no matter the sampling site, showing a positive correlation with CO2; the right side was occupied by samples from the olive and orange cultivations (and SOM, TN, POXC, and DHG determined their distribution. The ordination of samples along the second axis reflected the site effect since the samples from HMU and MES occupied the lower part of the biplot and were characterized by increased values of silt, NAG, BG, and pH, while those of SIT and SIS were ordinated towards the upper side. The fact that the second axis explained only 20.35% of total data variability indicates that the cultivation effect is much stronger than that of the site on alterations of the soil’s C-related properties.
Table 2 summarizes the main correlations between the various soil parameters examined. SOM showed a significant positive correlation with sand content and the TKN, soil, and leaf C:N ratio and a weak positive relationship with POΧC; it negatively correlated with silt content BG. The latter enzyme activity showed a significant positive correlation (p < 0.05) with NAG and silt content. The CO2 rate did not show any significant correlation.

4. Discussion

4.1. Tree Crop Species Contributed to Organic C Sequestration as Compared to Uncultivated Fields

The overall (above that found in uncultivated fields) contribution to SOC by tree crop species was estimated and the results varied between 2.4 and 15.7 t C ha−1. We assume that organic C addition in the soil is mainly attributed to litter incorporation into the soil and subsequent SOM formation mechanisms and processes [42] involving rhizodeposition and soil microbiota assembly and activity [43,44,45]. Litter characteristics are important factors for C sequestration, including mainly the recalcitrant fraction of leaves and the C/N ratio [46,47,48]. The dominance of recalcitrant compounds in plant residues (i.e., lignin) may induce C stabilization in the soil via resistance to microbial decomposition and/or via interaction with the soil minerals, organic and inorganic compounds, environmental conditions, and soil microbiota [49,50,51].
Model-based simulations provide different estimates regarding the required amounts of C additions to restore or increase soil organic C in olive groves and citrus orchards. For example, there are CAST model-based simulations of SOM under different organic C rates, showing long-time C application to restore SOM, up to 12 t C ha−1 year−1 [52]. In a previous simulation study, organic inputs up 25 t C ha−1 year−1 led to increases of SOC up to 14 t C ha−1 year−1 caused by changes in soil management from conventional tillage to mulching with residues from pruning debris and olive-fruit cleaning [53]. These values are higher than those of our study and are probably due to constraints from climatic conditions and the applied agronomic practices in the olive orchards of our research such as the low organic inputs and the pruning residues burning, a practice often used in olive orchards in Crete. Regarding citrus trees, a 7-year field study showed that SOC stocks increased by 38.6% under the combination of no-tillage and pruning residue (branches and leaves) incorporation or by 82.3% under reduced tillage, pruning residues incorporation plus drip-irrigation system compared with fields with intensive tillage and flood irrigation system, at 0–5 cm soil depth [42].

4.2. Different Contributions to SOM Enhancement between Different Tree Crop Species

The tree cropping system strongly affected SOM; olive groves achieved higher SOM values than the orange orchards. This finding may reflect the different litter loading, as well as the differentiations in litter quality (physical and chemical characteristics) between species. This hypothesis was confirmed by correlation statistics showing a strong positive relationship between SOM and leaf C, N, and the C:N ratio (Table 2) implying that the higher the C:N content in leaves the higher the potential for the soil C sequestration. Thus, the higher C:N ratio in olive than orange leaves may explain the higher SOM values in the former.
Earlier studies also highlighted the role of litter chemistry (e.g., cellulose, hemicellulose, and lignin content, as well as C and N content or the C:N ratio) on C mineralization and sequestration [46,47,48]. The C:N ratio increases have been related to increased microbial N immobilization and lower rates of C mineralization [54]. A recent study in Crete dealing with soil C sequestration in olive and avocado orchards reported different performances between olive groves and avocado plantations, mainly attributed to different litter inputs and litter chemistry [7].

4.3. Limited Effect of Site Position on Soil Organic C Sequestration

According to our findings, sites had a limited weaker impact on SOM. We speculate that tree crop species, through their strong impact on SOM, have masked or mediated the influence of other biotic and abiotic parameters driven by field sites, such as site-specific soil biological and physicochemical properties, environmental conditions (e.g., precipitation and temperature), and their interactions [55,56,57]. Another explanation may include the synergetic influence of various biotic and abiotic factors on SOM impeding the extraction of clear results. It is well documented that the role of soil properties on microbial accessibility to organic substrates influences organic matter decomposition and interaction with other parameters [58]. Moreover, different environmental conditions and soil properties (mainly soil pH) shape different soil microbial communities [59], thus influencing the potential of soil C sequestration; the niche specialization and differentiation of soil microorganisms have been discussed in previous studies [60,61]. Except for the role of soil microorganisms, different sites may exhibit different interactions between SOM and the soil minerals, also involving the role of positively charged cations, such as Ca2+, which acts as a bridge between negatively charged soil particles and/or organic molecules inducing SOM stabilization [62].

4.4. Identifying Soil and Plant Parameters Representing Best Soil Organic C Sequestration

In our study, POXC was used as an indicator of C sequestration following the general pattern of SOM; we found no significant yet positive relationship between POXC and SOM (Table 2). However, the latter agrees with previous findings showing a relation between POXC and SOM stabilization [63,64], suggesting that POXC could be a valid candidate indicator of soil C sequestration in semi-arid agroecosystems, such as those of the Mediterranean region. Furthermore, the SOM showed a positive relationship with TKN, as shown previously [7,65,66], revealing a solid coupling between C and N cycles in agroecosystems. By contrast, the CO2 rate showed was not correlated to SOM, POCX, TKN, or another parameter (Table 2 and Figure 11) and did not vary significantly between tree cropping systems and sites, suggesting that a combination of factors may have been involved, such as the quality of SOM and the potential interactions with soil microorganisms, solid phase, and ions [62]. This interaction is perhaps the reason behind the relatively weak coupling between SOM and soil texture found in our study, which is opposite to previous studies [67,68]. Finally, in our study, the leaf C:N ratio had a positive relationship with the SOM, suggesting these tree parameters are relevant indicators of soil organic C sequestration, discussed above.

5. Conclusions

Based on the findings of the study, we conclude:
  • Tree cropping systems (olive groves and orange orchards) can enhance organic C stock in the soil under the semi-arid soil-climatic conditions of Crete, Greece.
  • Tree crops have different soil organic C sequestration potentials related to crop litter characteristics (e.g., leaf C:N ratio) and rhizosphere regulation. Olive trees showed higher soil organic C sequestration potential than orange trees.
  • SOM is challenging to be described by typical soil properties due to the synergetic effect of a plethora of abiotic and biotic parameters; in our study, SOM had a positive relationship with TKN (and less with POXC) in the soil as well as with the C:N ratio of the tree litter.
  • Further work should involve a more extensive survey and a more comprehensive range of plant and soil physicochemical (e.g., soil fractions) and microbial (e.g., microbial composition and structure) and biochemical soil parameters to identify the most critical ones to soil C sequestration. Another area of future research is the investigation of the coupling between the C and N cycles in semi-arid agroecosystems.

Author Contributions

Conceptualization, V.A.T.; methodology, V.A.T., E.K., N.M. and T.C.; software, N.M.; formal analysis, N.M.; investigation, E.S.; resources, E.K., V.A.T. and N.M.; data curation, N.M; writing—original draft preparation, E.S. and V.A.T.; writing—review and editing, N.M, I.K., G.G., T.C. and E.K. All authors have read and agreed to the published version of the manuscript.

Funding

This research was partially funded by the European Union LIFE+ Nature and Biodiversity project Improvement of green infrastructure (GI) in agroecosystems: reconnecting natural areas by countering habitat fragmentation—LIFE IGIC (Grant number LIFE16 NAT/GR/000575).

Institutional Review Board Statement

Not applicable.

Informed Consent Statement

Not applicable.

Data Availability Statement

The data presented in this study are available upon request from the corresponding author.

Conflicts of Interest

The authors declare no conflict of interest.

References

  1. Lal, R.; Negassa, W.; Lorenz, K. Carbon sequestration in soil. Curr. Opin. Environ. Sustain. 2015, 15, 79–86. [Google Scholar] [CrossRef]
  2. Cramer, W.; Guiot, J.; Fader, M.; Garrabou, J.; Gattuso, J.-P.; Iglesias, A.; Lange, M.A.; Lionello, P.; Llasat, M.C.; Paz, S. Climate change and interconnected risks to sustainable development in the Mediterranean. Nat. Clim. Change 2018, 8, 972–980. [Google Scholar] [CrossRef] [Green Version]
  3. Aguilera, E.; Diaz-Gaona, C.; Garcia-Laureano, R.; Reyes-Palomo, C.; Guzmán, G.I.; Ortolani, L.; Sanchez-Rodriguez, M.; Rodriguez-Estevez, V. Agroecology for adaptation to climate change and resource depletion in the Mediterranean region. A review. Agric. Syst. 2020, 181, 102809. [Google Scholar] [CrossRef]
  4. Fisher, J.B.; Melton, F.; Middleton, E.; Hain, C.; Anderson, M.; Allen, R.; McCabe, M.F.; Hook, S.; Baldocchi, D.; Townsend, P.A. The future of evapotranspiration: Global requirements for ecosystem functioning, carbon and climate feedbacks, agricultural management, and water resources. Water Resour. Res. 2017, 53, 2618–2626. [Google Scholar] [CrossRef] [Green Version]
  5. Banerjee, A.; Meena, R.S.; Jhariya, M.K.; Yadav, D.K. Agroecological Footprints Management for Sustainable Food System; Springer: Berlin, Germany, 2021. [Google Scholar]
  6. Meena, R.S.; Kumar, S.; Yadav, G.S. Soil carbon sequestration in crop production. In Nutrient Dynamics for Sustainable Crop Production; Springer: Berlin, Germany, 2020; pp. 1–39. [Google Scholar]
  7. Paranychianakis, N.V.; Giannakis, G.; Moraetis, D.; Tzanakakis, V.A.; Nikolaidis, N.P. Crop litter has a strong effect on soil organic matter sequestration in semi-arid environments. Sustainability 2021, 13, 13278. [Google Scholar] [CrossRef]
  8. Pausch, J.; Kuzyakov, Y. Carbon input by roots into the soil: Quantification of rhizodeposition from root to ecosystem scale. Glob. Change Biol. 2018, 24, 1–12. [Google Scholar] [CrossRef]
  9. De Deyn, G.B.; Cornelissen, J.H.; Bardgett, R.D. Plant functional traits and soil carbon sequestration in contrasting biomes. Ecol. Lett. 2008, 11, 516–531. [Google Scholar] [CrossRef]
  10. Kallenbach, C.M.; Rolston, D.E.; Horwath, W.R. Cover cropping affects soil N2O and CO2 emissions differently depending on type of irrigation. Agric. Ecosyst. Environ. 2010, 137, 251–260. [Google Scholar] [CrossRef]
  11. Badagliacca, G.; Ruisi, P.; Rees, R.M.; Saia, S. An assessment of factors controlling N2O and CO2 emissions from crop residues using different measurement approaches. Biol. Fertil. Soils 2017, 53, 547–561. [Google Scholar] [CrossRef] [Green Version]
  12. Wilson, H.; Al-Kaisi, M. Crop rotation and nitrogen fertilization effect on soil CO2 emissions in central Iowa. Appl. Soil Ecol. 2008, 39, 264–270. [Google Scholar] [CrossRef]
  13. Sun, W.; Canadell, J.G.; Yu, L.; Yu, L.; Zhang, W.; Smith, P.; Fischer, T.; Huang, Y. Climate drives global soil carbon sequestration and crop yield changes under conservation agriculture. Glob. Change Biol. 2020, 26, 3325–3335. [Google Scholar] [CrossRef]
  14. Jarecki, M.K.; Lal, R. Crop management for soil carbon sequestration. Crit. Rev. Plant Sci. 2003, 22, 471–502. [Google Scholar] [CrossRef]
  15. Langgut, D.; Cheddadi, R.; Carrión, J.S.; Cavanagh, M.; Colombaroli, D.; Eastwood, W.J.; Greenberg, R.; Litt, T.; Mercuri, A.M.; Miebach, A. The origin and spread of olive cultivation in the Mediterranean Basin: The fossil pollen evidence. Holocene 2019, 29, 902–922. [Google Scholar] [CrossRef]
  16. Proietti, S.; Sdringola, P.; Desideri, U.; Zepparelli, F.; Brunori, A.; Ilarioni, L.; Nasini, L.; Regni, L.; Proietti, P. Carbon footprint of an olive tree grove. Appl. Energy 2014, 127, 115–124. [Google Scholar] [CrossRef]
  17. Sofo, A.; Nuzzo, V.; Palese, A.M.; Xiloyannis, C.; Celano, G.; Zukowskyj, P.; Dichio, B. Net CO2 storage in Mediterranean olive and peach orchards. Sci. Hortic. 2005, 107, 17–24. [Google Scholar] [CrossRef]
  18. Testi, L.; Orgaz, F.; Villalobos, F. Carbon exchange and water use efficiency of a growing, irrigated olive orchard. Environ. Exp. Bot. 2008, 63, 168–177. [Google Scholar] [CrossRef]
  19. Villalobos, F.; Testi, L.; Hidalgo, J.; Pastor, M.; Orgaz, F. Modelling potential growth and yield of olive (Olea europaea L.) canopies. Eur. J. Agron. 2006, 24, 296–303. [Google Scholar] [CrossRef]
  20. López-Bellido, R.J.; Fontán, J.M.; López-Bellido, F.J.; López-Bellido, L. Carbon sequestration by tillage, rotation, and nitrogen fertilization in a Mediterranean Vertisol. Agron. J. 2010, 102, 310–318. [Google Scholar] [CrossRef]
  21. Zapata-Sierra, A.J.; Manzano-Agugliaro, F. Controlled deficit irrigation for orange trees in Mediterranean countries. J. Clean. Prod. 2017, 162, 130–140. [Google Scholar] [CrossRef]
  22. Yang, S.; Aydin, M.; Kitamura, Y.; Yano, T. The impact of irrigation water quality on water uptake by orange trees. Afr. J. Agric. Res. 2010, 5, 2661–2667. [Google Scholar]
  23. Germana, C.; Sardo, V. Determining when to initiate irrigation of orange trees. In Proceedings of the IV International Symposium on Irrigation of Horticultural Crops 664, Davis, CA, USA, 1–6 September 2003; pp. 591–597. [Google Scholar]
  24. Consoli, S.; Stagno, F.; Roccuzzo, G.; Cirelli, G.; Intrigliolo, F. Sustainable management of limited water resources in a young orange orchard. Agric. Water Manag. 2014, 132, 60–68. [Google Scholar] [CrossRef]
  25. Consoli, S.; Stagno, F.; Vanella, D.; Boaga, J.; Cassiani, G.; Roccuzzo, G. Partial root-zone drying irrigation in orange orchards: Effects on water use and crop production characteristics. Eur. J. Agron. 2017, 82, 190–202. [Google Scholar] [CrossRef]
  26. Tsanis, I.K.; Koutroulis, A.G.; Daliakopoulos, I.N.; Jacob, D. Severe climate-induced water shortage and extremes in Crete. Clim. Chang. 2011, 106, 667–677. [Google Scholar] [CrossRef]
  27. Tzanakakis, V.; Angelakis, A.; Paranychianakis, N.; Dialynas, Y.; Tchobanoglous, G. Challenges and Opportunities for Sustainable Management of Water Resources in the Island of Crete, Greece. Water 2020, 12, 1538. [Google Scholar] [CrossRef]
  28. Allen, H.; Randall, R.; Amable, G.; Devereux, B. The impact of changing olive cultivation practices on the ground flora of olive groves in the Messara and Psiloritis regions, Crete, Greece. Land Degrad. Dev. 2006, 17, 249–273. [Google Scholar] [CrossRef]
  29. Goward, J.; Whitty, M.; Ch, R. Estimating and predicting carbon sequestrated in a vineyard with soil surveys, spatial date and G.I.S. management. Bachelor’s Thesis, Engineering University of New South Wales, Kensington, Australia, 2012. [Google Scholar]
  30. Lal, R. Soil carbon stocks under present and future climate with specific reference to European ecoregions. Nutr. Cycl. Agroecosystems 2008, 81, 113–127. [Google Scholar] [CrossRef]
  31. Proietti, P.; Sdringola, P.; Brunori, A.; Ilarioni, L.; Nasini, L.; Regni, L.; Pelleri, F.; Desideri, U.; Proietti, S. Assessment of carbon balance in intensive and extensive tree cultivation systems for oak, olive, poplar and walnut plantation. J. Clean. Prod. 2016, 112, 2613–2624. [Google Scholar] [CrossRef]
  32. Nair, P.R.; Nair, V.D.; Kumar, B.M.; Showalter, J.M. Carbon sequestration in agroforestry systems. Adv. Agron. 2010, 108, 237–307. [Google Scholar]
  33. Kourgialas, N.N.; Anyfanti, I.; Karatzas, G.P.; Dokou, Z. An integrated method for assessing drought prone areas—Water efficiency practices for a climate resilient Mediterranean agriculture. Sci. Total Environ. 2018, 625, 1290–1300. [Google Scholar] [CrossRef]
  34. Tzoraki, O.; Kritsotakis, M.; Baltas, E. Spatial Water Use efficiency Index towards resource sustainability: Application in the island of Crete, Greece. Int. J. Water Resour. Dev. 2015, 31, 669–681. [Google Scholar] [CrossRef]
  35. Bouyoucos, G.J. Hydrometer method improved for making particle size analyses of soils 1. Agron. J. 1962, 54, 464–465. [Google Scholar] [CrossRef]
  36. Nelson, D.a.; Sommers, L.E. Total carbon, organic carbon, and organic matter. Methods Soil Anal. Part 2 Chem. Microbiol. Prop. 1983, 9, 539–579. [Google Scholar]
  37. Bremner, J.M. Nitrogen-total. Methods Soil Anal. Part 3 Chem. Methods 1996, 5, 1085–1121. [Google Scholar]
  38. Weil, R.R.; Islam, K.R.; Stine, M.A.; Gruver, J.B.; Samson-Liebig, S.E. Estimating active carbon for soil quality assessment: A simplified method for laboratory and field use. Am. J. Altern. Agric. 2003, 18, 3–17. [Google Scholar]
  39. Allison, S.D.; Jastrow, J.D. Activities of extracellular enzymes in physically isolated fractions of restored grassland soils. Soil Biol. Biochem. 2006, 38, 3245–3256. [Google Scholar] [CrossRef]
  40. Bottomley, P.J.; Angle, J.S.; Weaver, R. Methods of Soil Analysis, Part 2: Microbiological and Biochemical Properties; John Wiley & Sons: New York, NY, USA, 2020; Volume 12. [Google Scholar]
  41. Kapagianni, P.D.; Topalis, I.; Gwynn-Jones, D.; Menkissoglu-Spiroudi, U.; Stamou, G.P.; Papatheodorou, E.M. Effects of plant invaders on rhizosphere microbial attributes depend on plant identity and growth stage. Soil Res. 2020, 59, 225–238. [Google Scholar] [CrossRef]
  42. Garcia-Franco, N.; Wiesmeier, M.; Colocho Hurtarte, L.C.; Fella, F.; Martínez-Mena, M.; Almagro, M.; Martínez, E.G.; Kögel-Knabner, I. Pruning residues incorporation and reduced tillage improve soil organic matter stabilization and structure of salt-affected soils in a semi-arid Citrus tree orchard. Soil Tillage Res. 2021, 213, 105129. [Google Scholar] [CrossRef]
  43. Paterson, E.; Gebbing, T.; Abel, C.; Sim, A.; Telfer, G. Rhizodeposition shapes rhizosphere microbial community structure in organic soil. New Phytol. 2007, 173, 600–610. [Google Scholar] [CrossRef]
  44. Benizri, E.; Dedourge, O.; Dibattista-Leboeuf, C.; Piutti, S.; Nguyen, C.; Guckert, A. Effect of maize rhizodeposits on soil microbial community structure. Appl. Soil Ecol. 2002, 21, 261–265. [Google Scholar] [CrossRef]
  45. Semchenko, M.; Xue, P.; Leigh, T. Functional diversity and identity of plant genotypes regulate rhizodeposition and soil microbial activity. New Phytol. 2021, 232, 776–787. [Google Scholar] [CrossRef]
  46. Tamura, M.; Suseela, V.; Simpson, M.; Powell, B.; Tharayil, N. Plant litter chemistry alters the content and composition of organic carbon associated with soil mineral and aggregate fractions in invaded ecosystems. Glob. Chang. Biol. 2017, 23, 4002–4018. [Google Scholar] [CrossRef]
  47. Castellano, M.J.; Mueller, K.E.; Olk, D.C.; Sawyer, J.E.; Six, J. Integrating plant litter quality, soil organic matter stabilization, and the carbon saturation concept. Glob. Chang. Biol. 2015, 21, 3200–3209. [Google Scholar] [CrossRef] [Green Version]
  48. Redin, M.; Guénon, R.; Recous, S.; Schmatz, R.; de Freitas, L.L.; Aita, C.; Giacomini, S.J. Carbon mineralization in soil of roots from twenty crop species, as affected by their chemical composition and botanical family. Plant Soil 2014, 378, 205–214. [Google Scholar] [CrossRef]
  49. Talbot, J.M.; Yelle, D.J.; Nowick, J.; Treseder, K.K. Litter decay rates are determined by lignin chemistry. Biogeochemistry 2012, 108, 279–295. [Google Scholar] [CrossRef]
  50. Forney, D.C.; Rothman, D.H. Common structure in the heterogeneity of plant-matter decay. J. R. Soc. Interface 2012, 9, 2255–2267. [Google Scholar] [CrossRef]
  51. Rahman, M.M.; Tsukamoto, J.; Rahman, M.M.; Yoneyama, A.; Mostafa, K.M. Lignin and its effects on litter decomposition in forest ecosystems. Chem. Ecol. 2013, 29, 540–553. [Google Scholar] [CrossRef]
  52. Giannakis, G.V.; Panakoulia, S.K.; Nikolaidis, N.P.; Paranychianakis, N.V. Simulating Soil Fertility Restoration Using the CAST Model. Procedia Earth Planet. Sci. 2014, 10, 325–329. [Google Scholar] [CrossRef] [Green Version]
  53. Nieto, O.M.; Castro, J.; Fernández, E.; Smith, P. Simulation of soil organic carbon stocks in a Mediterranean olive grove under different soil-management systems using the RothC model. Soil Use Manag. 2010, 26, 118–125. [Google Scholar] [CrossRef]
  54. Tzanakakis, V.A.; Paranychianakis, N.V. Divergent response of ammonia oxidizers to various amino acids. Appl. Soil Ecol. 2017, 114, 45–51. [Google Scholar] [CrossRef]
  55. Qiu, H.; Ge, T.; Liu, J.; Chen, X.; Hu, Y.; Wu, J.; Su, Y.; Kuzyakov, Y. Effects of biotic and abiotic factors on soil organic matter mineralization: Experiments and structural modeling analysis. Eur. J. Soil Biol. 2018, 84, 27–34. [Google Scholar] [CrossRef]
  56. Cai, A.; Feng, W.; Zhang, W.; Xu, M. Climate, soil texture, and soil types affect the contributions of fine-fraction-stabilized carbon to total soil organic carbon in different land uses across China. J. Environ. Manag. 2016, 172, 2–9. [Google Scholar] [CrossRef] [PubMed]
  57. Angst, G.; Messinger, J.; Greiner, M.; Häusler, W.; Hertel, D.; Kirfel, K.; Kögel-Knabner, I.; Leuschner, C.; Rethemeyer, J.; Mueller, C.W. Soil organic carbon stocks in topsoil and subsoil controlled by parent material, carbon input in the rhizosphere, and microbial-derived compounds. Soil Biol. Biochem. 2018, 122, 19–30. [Google Scholar] [CrossRef]
  58. Moinet, G.Y.; Hunt, J.E.; Kirschbaum, M.U.; Morcom, C.P.; Midwood, A.J.; Millard, P. The temperature sensitivity of soil organic matter decomposition is constrained by microbial access to substrates. Soil Biol. Biochem. 2018, 116, 333–339. [Google Scholar] [CrossRef]
  59. Goss-Souza, D.; Mendes, L.W.; Borges, C.D.; Baretta, D.; Tsai, S.M.; Rodrigues, J.L. Soil microbial community dynamics and assembly under long-term land use change. FEMS Microbiol. Ecol. 2017, 93, fix109. [Google Scholar] [CrossRef] [PubMed] [Green Version]
  60. Lennon, J.T.; Aanderud, Z.T.; Lehmkuhl, B.K.; Schoolmaster, D.R., Jr. Mapping the niche space of soil microorganisms using taxonomy and traits. Ecology 2012, 93, 1867–1879. [Google Scholar] [CrossRef]
  61. Prosser, J.I.; Nicol, G.W. Archaeal and bacterial ammonia-oxidisers in soil: The quest for niche specialisation and differentiation. Trends Microbiol. 2012, 20, 523–531. [Google Scholar] [CrossRef] [Green Version]
  62. Mikutta, R.; Kleber, M.; Torn, M.S.; Jahn, R. Stabilization of soil organic matter: Association with minerals or chemical recalcitrance? Biogeochemistry 2006, 77, 25–56. [Google Scholar] [CrossRef]
  63. Hurisso, T.T.; Culman, S.W.; Horwath, W.R.; Wade, J.; Cass, D.; Beniston, J.W.; Bowles, T.M.; Grandy, A.S.; Franzluebbers, A.J.; Schipanski, M.E.; et al. Comparison of Permanganate-Oxidizable Carbon and Mineralizable Carbon for Assessment of Organic Matter Stabilization and Mineralization. Soil Sci. Soc. Am. J. 2016, 80, 1352–1364. [Google Scholar] [CrossRef]
  64. Sprunger, C.D.; Martin, T.; Mann, M. Systems with greater perenniality and crop diversity enhance soil biological health. Agric. Environ. Lett. 2020, 5, e20030. [Google Scholar] [CrossRef]
  65. Yao, Z.; Zhang, D.; Liu, N.; Yao, P.; Zhao, N.; Li, Y.; Zhang, S.; Zhai, B.; Huang, D.; Wang, Z.; et al. Dynamics and Sequestration Potential of Soil Organic Carbon and Total Nitrogen Stocks of Leguminous Green Manure-Based Cropping Systems on the Loess Plateau of China. Soil Tillage Res. 2019, 191, 108–116. [Google Scholar] [CrossRef]
  66. Tong, C.; Xiao, H.; Tang, G.; Wang, H.; Huang, T.; Xia, H.; Keith, S.J.; Li, Y.; Liu, S.; Wu, J. Long-term fertilizer effects on organic carbon and total nitrogen and coupling relationships of C and N in paddy soils in subtropical China. Soil Tillage Res. 2009, 106, 8–14. [Google Scholar] [CrossRef]
  67. Hamarashid, N.H.; Othman, M.A.; Hussain, M.-A.H. Effects of soil texture on chemical compositions, microbial populations and carbon mineralization in soil. Egypt. J. Exp. Biol.(Bot.) 2010, 6, 59–64. [Google Scholar]
  68. Augustin, C.; Cihacek, L.J. Relationships between soil carbon and soil texture in the Northern Great Plains. Soil Sci. 2016, 181, 386–392. [Google Scholar] [CrossRef]
Figure 1. The locations of four sites included in the study in Crete island, Greece (Source: Google Earth).
Sustainability 15 01477 g001
Figure 2. Mean values (±SE) of Soil organic matter (SOM) concentration in different sites and crops (Non-cultivated (NC) vs. Olive vs. Orange tree), and results of ANOVA regarding “Site” (S), “Crop Type” (CT), and their interactive effect (SxCT). Different letters indicate significant differences based on Fisher’s LSD post hoc test (*: p < 0.05; ***: p < 0.001; ns: non-significant, for all cases n = 5). The letters “a,b,c” points to the highest value.
Sustainability 15 01477 g002
Figure 3. Mean values (±SE) of Permanganate oxidizable carbon (POXC) concentration in different sites and crops (Non-cultivated (NC) vs. Olive vs. Orange tree), and results of ANOVA regarding “Site” (S), “Crop Type” (CT), and their interactive effect (SxCT). Different letters indicate significant differences based on Fisher’s LSD post hoc test (***: p < 0.001; ns: non-significant, for all cases n = 5). The letters “a,b” points to the highest value.
Sustainability 15 01477 g003
Figure 4. Mean values (±SE) of Total Kjeldahl Nitrogen (TKN) concentration in different sites and crops (Non-cultivated (NC) vs. Olive vs. Orange tree), and results of ANOVA regarding “Site” (S), “Crop Type” (CT), and their interactive effect (SxCT). Different letters indicate significant differences based on Fisher’s LSD post hoc test (***: p < 0.001; ns: non-significant, for all cases n = 5). The letters “a,b” points to the highest value.
Sustainability 15 01477 g004
Figure 5. Mean values (±SE) of C:N ratio in the soil in different sites and crops (Non-cultivated (NC) vs. Olive vs. Orange tree), and results of ANOVA regarding “Site” (S), “Crop Type” (CT), and their interactive effect (SxCT). Different letters indicate significant differences based on Fisher’s LSD post hoc test (**: p < 0.01; ns: non-significant, for all cases n = 5). The letters “a,b,c” points to the highest value.
Sustainability 15 01477 g005
Figure 6. Mean values (±SE) of pH in different sites and crops (Non-cultivated (NC) vs. Olive vs. Orange tree), and results of ANOVA regarding “Site” (S), “Crop Type” (CT), and their interactive effect (SxCT). (ns: non-significant, for all cases n = 5).
Sustainability 15 01477 g006
Figure 7. Mean values (±SE) of respiration rates (CO2) in different sites and crops (Non-cultivated (NC) vs. Olive vs. Orange tree), and results of ANOVA regarding “Site” (S), “Crop Type” (CT), and their interactive effect (SxCT). (ns: non-significant, for all cases n = 5).
Sustainability 15 01477 g007
Figure 8. Mean values (±SE) of NAG activity in the soil in different sites and crops (Non-cultivated (NC) vs. Olive vs. Orange tree), and results of ANOVA regarding “Site” (S), “Crop Type” (CT), and their interactive effect (SxCT). Different letters indicate significant differences based on Fisher’s LSD post hoc test (***: p < 0.001; ns: non-significant, for all cases n = 5). The letters “a,b” points to the highest value.
Sustainability 15 01477 g008
Figure 9. Mean values (±SE) of b-glucosidase activity (BG) in the soil in different sites and crops (Non-cultivated (NC) vs. Olive vs. Orange tree), and results of ANOVA regarding “Site” (S), “Crop Type” (CT), and their interactive effect (SxCT). Different letters indicate significant differences based on Fisher’s LSD post hoc test (***: p < 0.001; ns: non-significant, for all cases n = 5). The letters “a,b,c” points to the highest value.
Sustainability 15 01477 g009
Figure 10. Mean values (±SE) of Dehydrogenase in the soil in different sites and crops (Non-cultivated (NC) vs. Olive vs. Orange tree), and results of ANOVA regarding “Site” (S), “Crop Type” (CT), and their interactive effect (SxCT). Different letters indicate significant differences based on Fisher’s LSD post hoc test (***: p < 0.001; ns: non-significant, for all cases n = 5). The letters “a,b,c” points to the highest value.
Sustainability 15 01477 g010
Figure 11. Mean values (±SE) of Leaf N, C, and C:N ratio contents in different sites and crops (Olive vs. Orange tree), and results of ANOVA regarding “Site” (S), “Crop Type” (CT), and their interactive effect (SxCT). Different letters indicate significant differences based on Fisher’s LSD post hoc test (*: p < 0.5; **: p < 0.01; ***: p < 0.001; ns: non-significant, for all cases n = 5). The letters “a,b,c” points to the highest value.
Sustainability 15 01477 g011
Figure 12. Ordination of soil samples based on soil physicochemical variables on a PCA biplot. Error bars indicate standard errors (n = 3). The first symbol indicates the sampling site, and the second is the crop type (NC: no cultivation; OL: olive; OR: orange).
Sustainability 15 01477 g012
Table 1. Soil texture analysis of the field sites of the study.
Silt
(%)
Clay
(%)
Sand
(%)
Soil TextureCaCO3
(%)
HMUNon-cultivated71326Silt Loam14
Olive trees75125Silt Loam14
Citrus trees74323Silt Loam13
MESNon-cultivated531335Silt Loam17
Olive trees55441Silt Loam18
Citrus trees471439Silt Loam14
SITNon-cultivated301457Sandy Loam<1
Olive trees232057Sandy Loam<1
Citrus trees381348Sandy Loam<1
SISNon-cultivated33859Sandy Loam<1
Olive trees41751Sandy Loam<1
Citrus trees36955Sandy Loam<1
Table 2. Correlation analysis for the soil and plant parameters examined in the present study.
SiltClaySandNAGBGDHGPOXCTKNpHSOMC:NLeaf NLeaf CLeaf C:N
Silt
Clay−0.82
Sand−0.940.58
NAG0.43−0.180.50
BG0.43−0.240.470.41
DHG0.39−0.170.46−0.090.31
POXC−0.150.010.210.16−0.35−0.37
TKN−0.07−0.230.24−0.20−0.37−0.280.49
pH0.30−0.11−0.360.390.280.100.18−0.11
SOM0.440.340.43−0.300.44−0.360.320.43−0.22
C:N0.410.550.26−0.19−0.03−0.11−0.14−0.360.120.52
Leaf N0.040.22−0.20−0.14−0.010.52−0.10−0.350.28−0.160.18
Leaf C0.15−0.31−0.030.110.080.470.120.23−0.220.37−0.020.65
Leaf C:N0.10−0.330.050.170.080.530.120.29−0.250.30−0.100.870.93
CO20.11−0.23−0.020.00−0.030.06−0.20−0.11−0.070.05−0.13−0.090.170.19
Bold numbers represent significant correlation (p < 0.05).
Disclaimer/Publisher’s Note: The statements, opinions and data contained in all publications are solely those of the individual author(s) and contributor(s) and not of MDPI and/or the editor(s). MDPI and/or the editor(s) disclaim responsibility for any injury to people or property resulting from any ideas, methods, instructions or products referred to in the content.

