1. Introduction
A sustainable ecosystem requires real-time monitoring and the management of aquatic resources that can sustain the state’s economy and attain the SDGs for the food industry [
1,
2,
3]. The deployment, distribution, quantity, and availability of fisheries resources are all impacted by environmental changes [
4]. The effective usage of scientific information for the creation of assessments and projections of aquaculture operations requires detailed comprehension of intricate relationships among aquatic, environmental, and other related processes [
5]. This accurate information is extremely important for the conservation of aquatic species, “Fishes”, particularly for the food security sustainable development goal (SDG) [
6]. Because of the biological problems and corresponding analysis methods, it is crucial to comprehend the phase of transition between the terrestrial and aquatic ecosystems. Significant external variables, such as population expansion and an increase in protein demand, are attributed to the current explosion in aquaculture development [
7]. Despite being a substantial source of protein-rich food for people, fish populations are under increasing pressure due to problems related to the increase in world population, such as exploitation, contamination, global warming, and habitat degradation. In addition to this, the requirement for hydropower and energy production affects the aquatic species and they are critically endangered and need to be monitored using advanced technology on a regular basis [
8,
9]. Knowing these aquatic species and keeping accurate records of them could help in building a thorough database for their conservation.
Aquafarming development with new cutting-edge technologies such as the IoT is highly concerned with sustainability and the compatibility of multiple advantages [
10,
11,
12,
13]. Like other endeavors involving the use of public lands or resources, aquaculture development has seen an increase in interest but is subject to a complicated and frequently perplexing system of laws at the municipal and state levels [
14,
15]. Geographic Information Systems (GIS) and Global Positioning Systems (GPS) have been used for terrestrial applications for the last 35 to 40 years and are now also functional for the aquatic environment [
16,
17]. GIS has been used to monitor several other aquatic species worldwide. Resource managers, representatives of the aquaculture business, and local community stakeholders can receive decision support from geospatial and IoT-enabled information [
18]. It is now a common tool used in many studies of aquatic environments. GIS has the potential to offer an easier, more effective technique to research how aquatic organisms utilize their habitat [
19]. The primary purpose of a GIS is to effectively gather, store, update, alter, analyze, and display all types of geographically related data.
GIS is an organized collection of computational methods that consists of software, hardware, and the ability to frame geographic data in an informative manner. Although GIS still has its limitations in an aquatic environment, integrating new advanced technologies such as the IoT, big data, ML, blockchain, etc., will be an effective tool in the characterization of agriculture as well as aquatic resources [
20,
21,
22,
23,
24,
25]. Fishery ecosystems are being studied more thoroughly, including the integration of the IoT, and GIS-based techniques. GIS has been a crucial tool for managing knowledge data and it aids in working with the IoT in a variety of ways while building the solution for aquatic databases in a specific environment [
26]. Through geo-tagging, researchers can track the movement and location, and monitor the foraging behaviors, of aquatic species. The IoT, ML, and satellite tagging have a lot of benefits above conventional sighting surveys. The first is that geo-tagging offers a neutral, non-intrusive method of tracking the species without causing any environmental disruption.
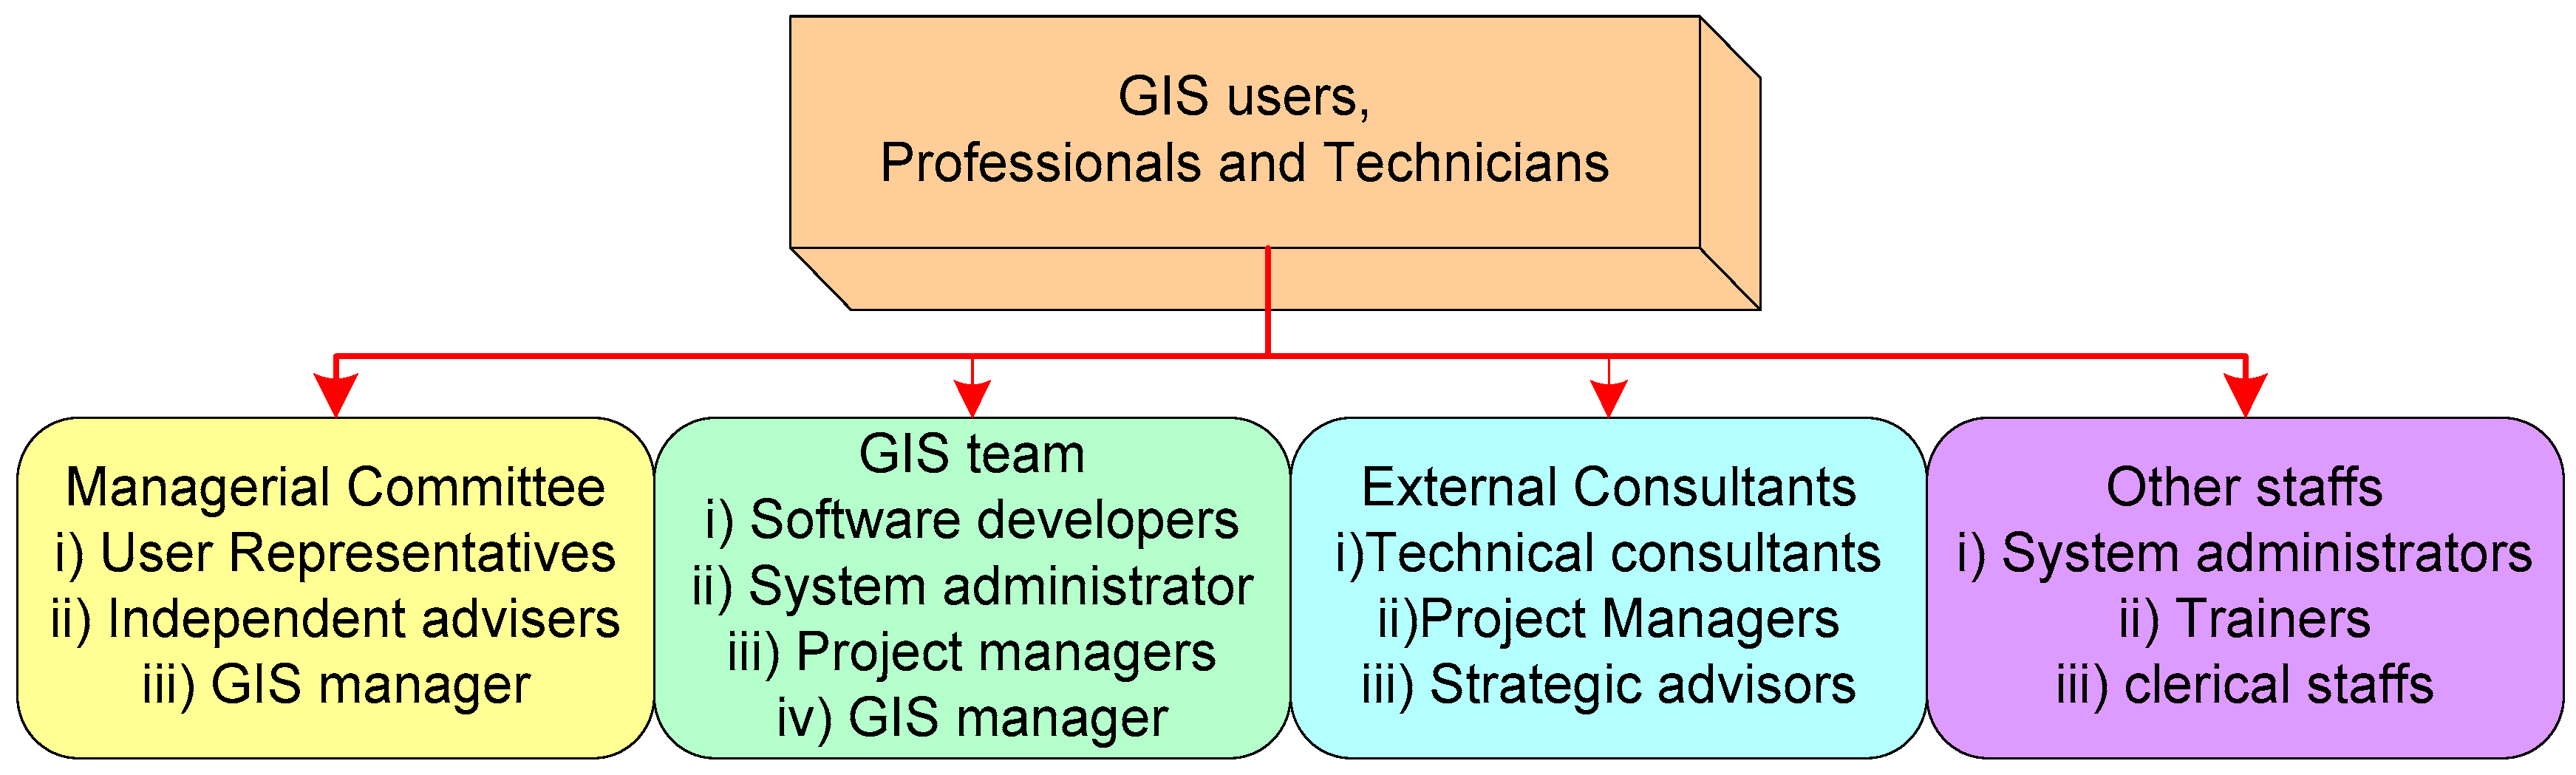
Figure 1 illustrates different entities involved in the implementation of GIS for an organization. It also describes the functions of the managerial committee, GIS team, external consultants, and other staff. The managerial committee comprises user representatives, independent advisers, and a GIS manager. The GIS team consists of software developers, system administrators, project managers, and GIS managers. The external consultants include technical consultants and strategic advisors.
In the current environment, climate change and other consequences related to water quality might affect the production of aqua species, thus it is necessary to improve, adjust, and plan for the adoption of current solutions. Aqua resource development and enrichment with cutting-edge technology is highly encouraged as it provides huge database storage and handling capability. The aqua resource database analysis strongly depends on the gathering of existent datasets as well as upgrading initiated by different schemes of information to stakeholders in the cloud. The interaction and integration of data from various datasets for the planners would be made available for strategic planning in promising investment and quality enhancement.
The comprehensive components related to the various phases of aqua farming are necessary to build an accessible database environment and must be dealt with more agreeably and effectively. The necessity for these new architectural considerations is driven by the rising energy demand and the sustainable growth of aqua farming. The main contribution of the study is as follows:
This study proposed an architecture with the IoT to manage the aqua resource for eco-sustainability with geospatial data;
This study also discussed the GIS- and GPS-based web-based framework for the fisheries sector and the creation of a database for aqua resource management;
This study presented the results of database generation for the aqua resource management and also the results of the fishpond in the cloud server. ML is integrated with the framework to analyze the sensor data and geo-spatial data for the identification of any degradation in the water quality.
The organization of the study is as follows:
Section 2 covers the overview of smart farming with the previous study literature;
Section 3 presents the proposed architecture;
Section 4 discusses the collation and generation of the aqua database; and
Section 5 presents the results and discussion.
2. Overview of Smart Aqua Farming
A key element of the IoT-based architecture and platform used in aquaculture includes the deployment of smart sensors for data collection, cloud-based analysis, and decision-based surveillance for feeding and species health. This intelligent aqua farming technique makes it feasible to apply automated methodological approaches to accurate and efficient data collection.
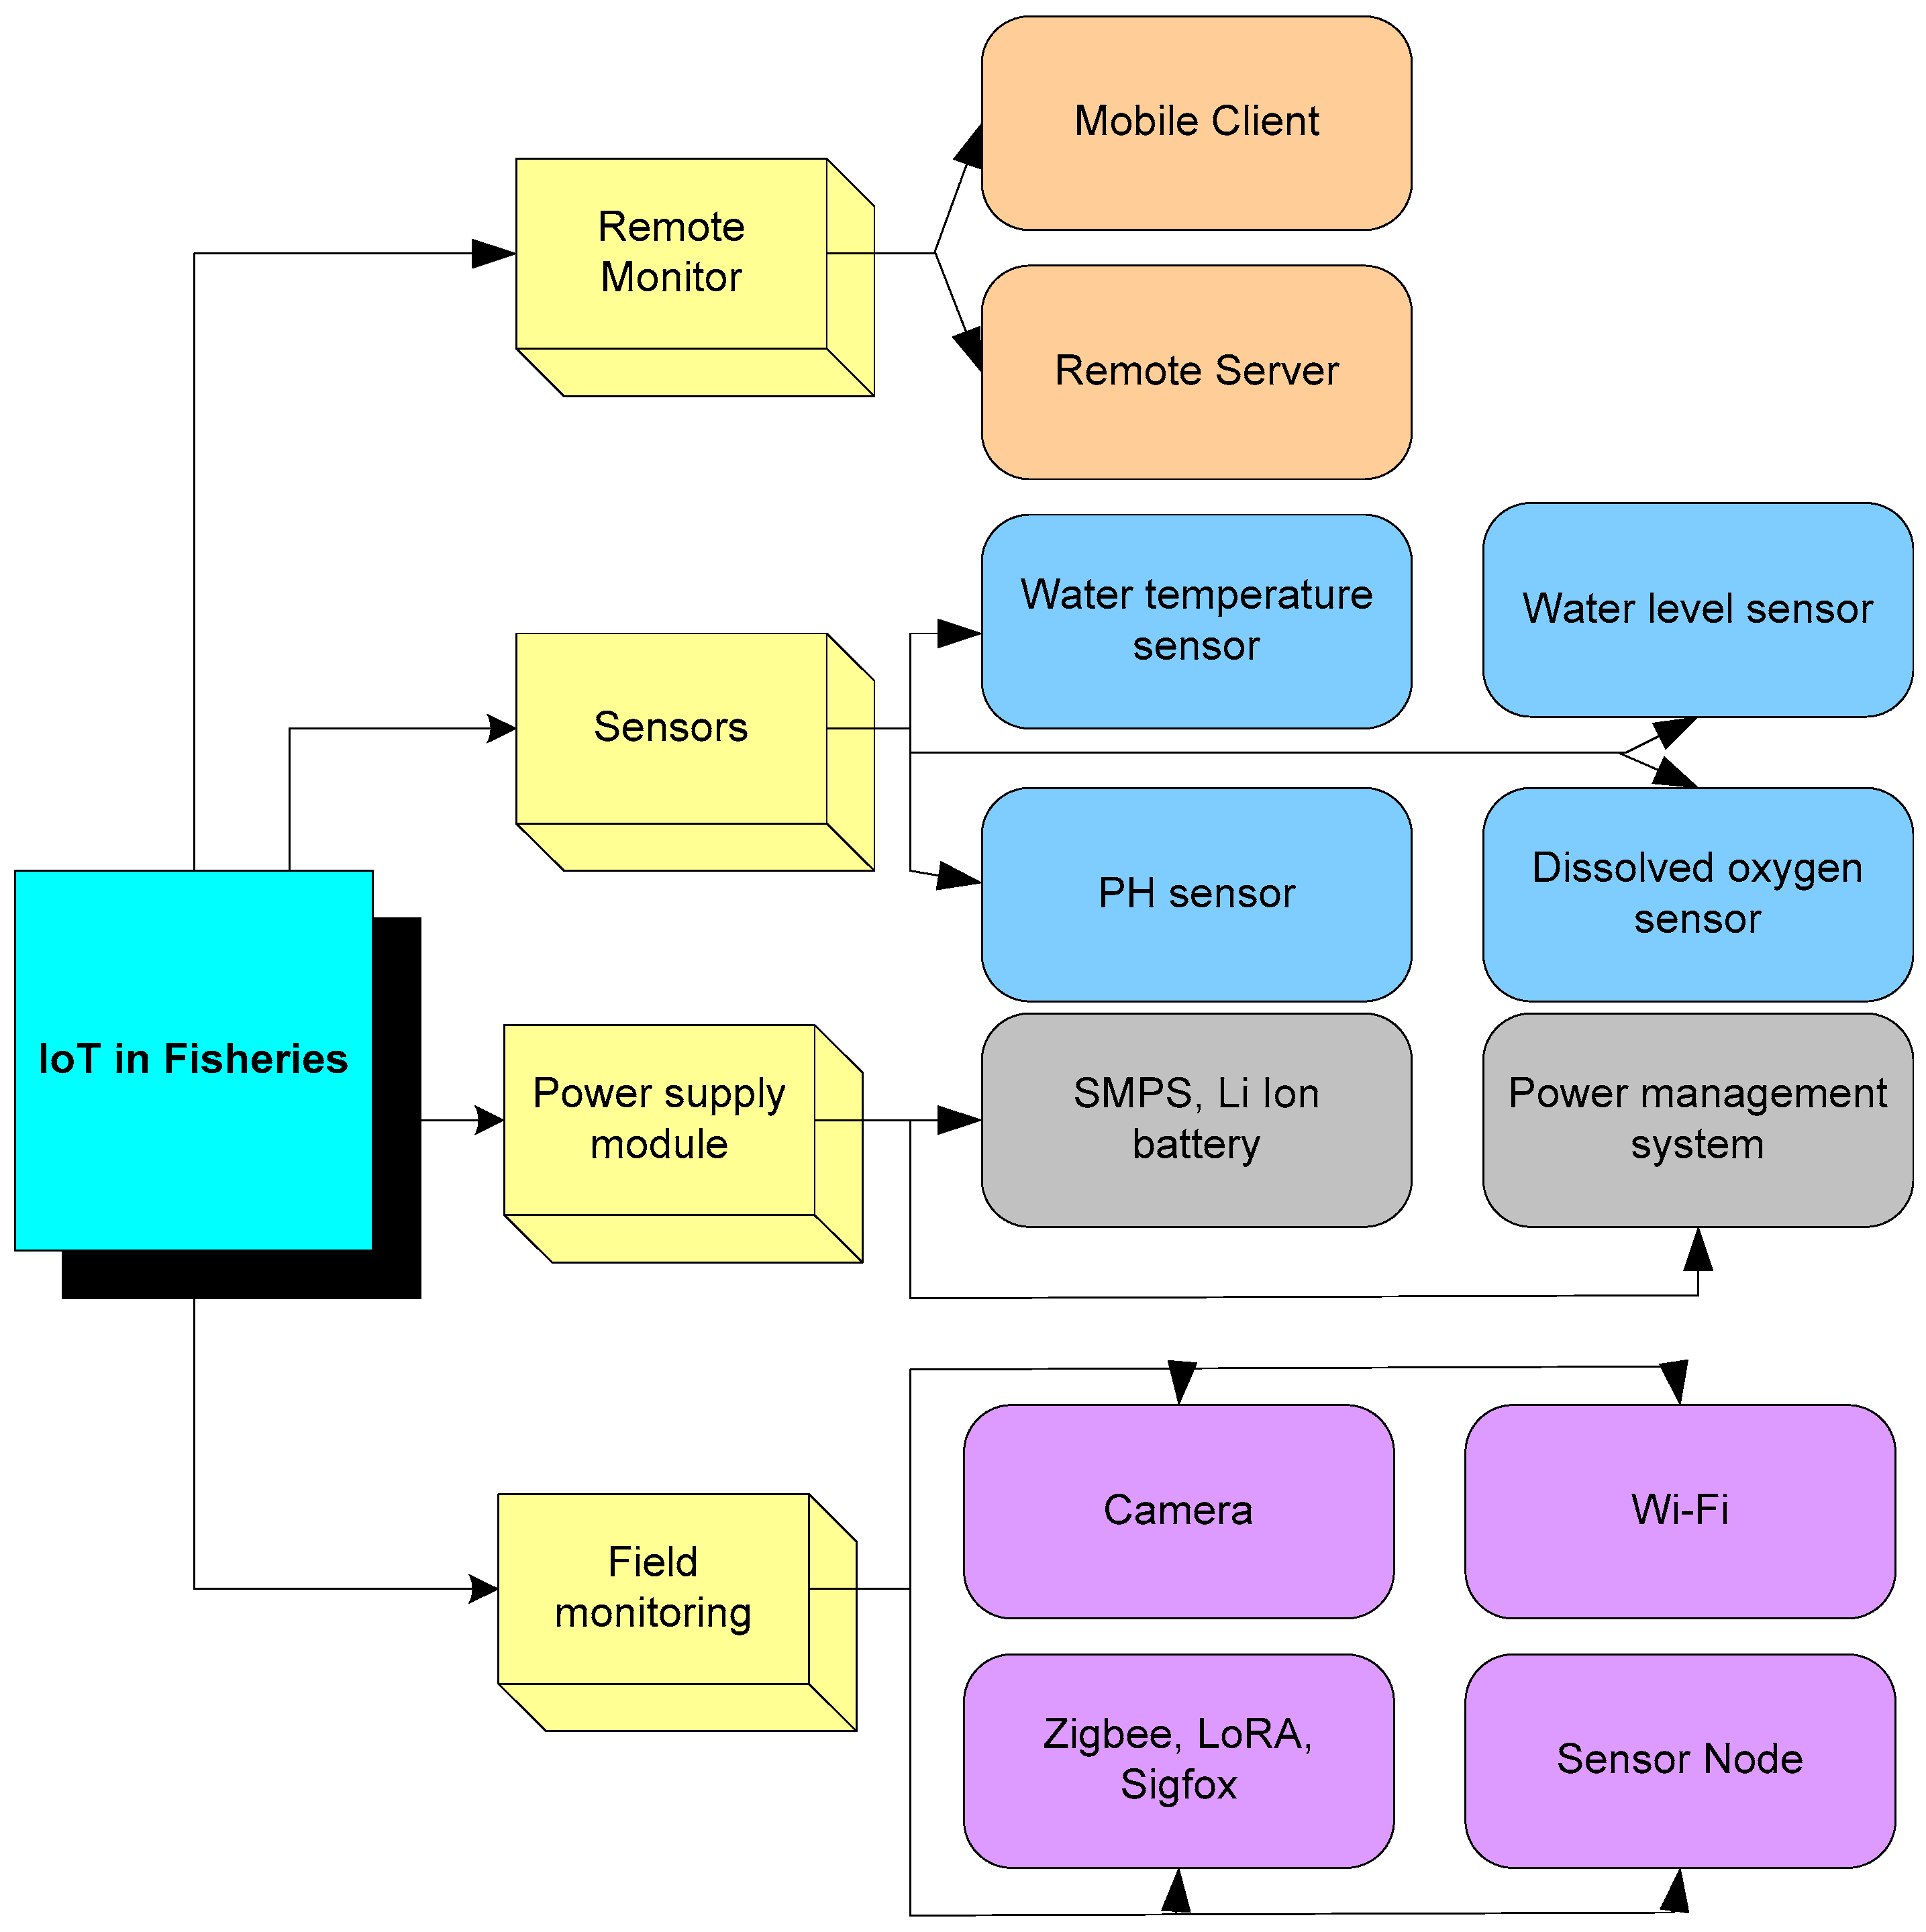
Figure 2 illustrates the components that are key in the IoT-based system for aqua farming, i.e., the sensors, remote monitor, field monitoring, and power supply module. Fundamentally, the IoT connects physical objects to the digital network via sensors embedded in the physical surroundings. The water temperature sensor, water level sensor, p sensor, and dissolved oxygen sensor are used to sense the temperature level, pH value, and oxygen rate in the pond. The sensors have been integrated into the fishpond. Now, to realize the remote monitoring, there is the requirement of integrating Zigbee, Wi-Fi, LoRa, and Sigfox communication protocols to transmit the sensor information in the form of analog and digital. However, a sensor node (hardware and software) must be integrated with sensors and communication protocols for it to be usable and functioning. A camera module will be integrated to realize the vision-based field monitoring. To realize field monitoring, remote servers and mobile clients are useful and this visualizes and logs the sensor and vision data from any remote location by connecting the sensor node through wireless connectivity. As the system is implemented in a remote location, the power management system plays a crucial role in the capacity of the battery.
Prior Art
IoT technologies have transformed almost everything to be smarter by embedding sensing and wireless communication technologies in smart farming. Researchers have suggested the advancements of IoT-based smart aqua farming with the assimilation of cutting-edge technologies. Increased yields, better budgeting of input costs, and more effective resource use can all be achieved with the use of big data analysis and IoT-based data-driven management strategies [
27,
28]. Smart aqua farming enables real-time parameter monitoring that directly impacts the maximizing of fish production and economic growth [
29]. The cyber and physical worlds are being connected by IoT arrangements, which are based on application-specific sensors, data measurements, and intelligent processing [
30]. Aquafarming is a field where farmers experience less income because of losses in production due to the spreading of fast diseases among the aqua species. In addition to these problems, aquaculture is also affected by a variety of diseases and environmental factors, including insufficient precipitation, river flooding, poor weather prediction by agricultural producers, a lack of technology adoption for the advantage of their product lines, a lack of device automated processes, and a lack of interconnection between the various procedure parts.
The most effective solution to this problem is to modernize the old aquaculture methods [
31]. All of these operations will be carried out by combining sensors, Wi-Fi or ZigBee modules, cameras, and actuators with the microcontroller, which will be used to control the Raspberry Pi as well as any other distant smart device or computer connected to the internet. With IoT-based solutions now being developed, aqua farms can be autonomously maintained and monitored [
32]. Additionally, the integration of cloud computing, big data storage, and analytics with IoT-based aqua farming systems has been demonstrated. IoT-based aqua farming has also been linked to security concerns. For various elements of farm management, the development of sensor applications based on smartphones is essential [
33,
34]. It has become possible to manage and distribute services efficiently using cloud computing and cloud servers. Aqua resource preservation is now largely owing to cloud computing, including the IoT, wireless mesh networking, and big data analytical tools [
35,
36,
37]. A system for delivering the aqua database in real-time using the IoT, cloud server, and assimilation of geospatial datasets is proposed and developed [
38,
39]. The use of unmanned aerial vehicles is implemented for aquaculture surveillance and other favorable applications such as optimizing farming yields and maintaining the database for the real-time monitoring of production as well as a real-time database [
37,
40].
3. Proposed Architecture
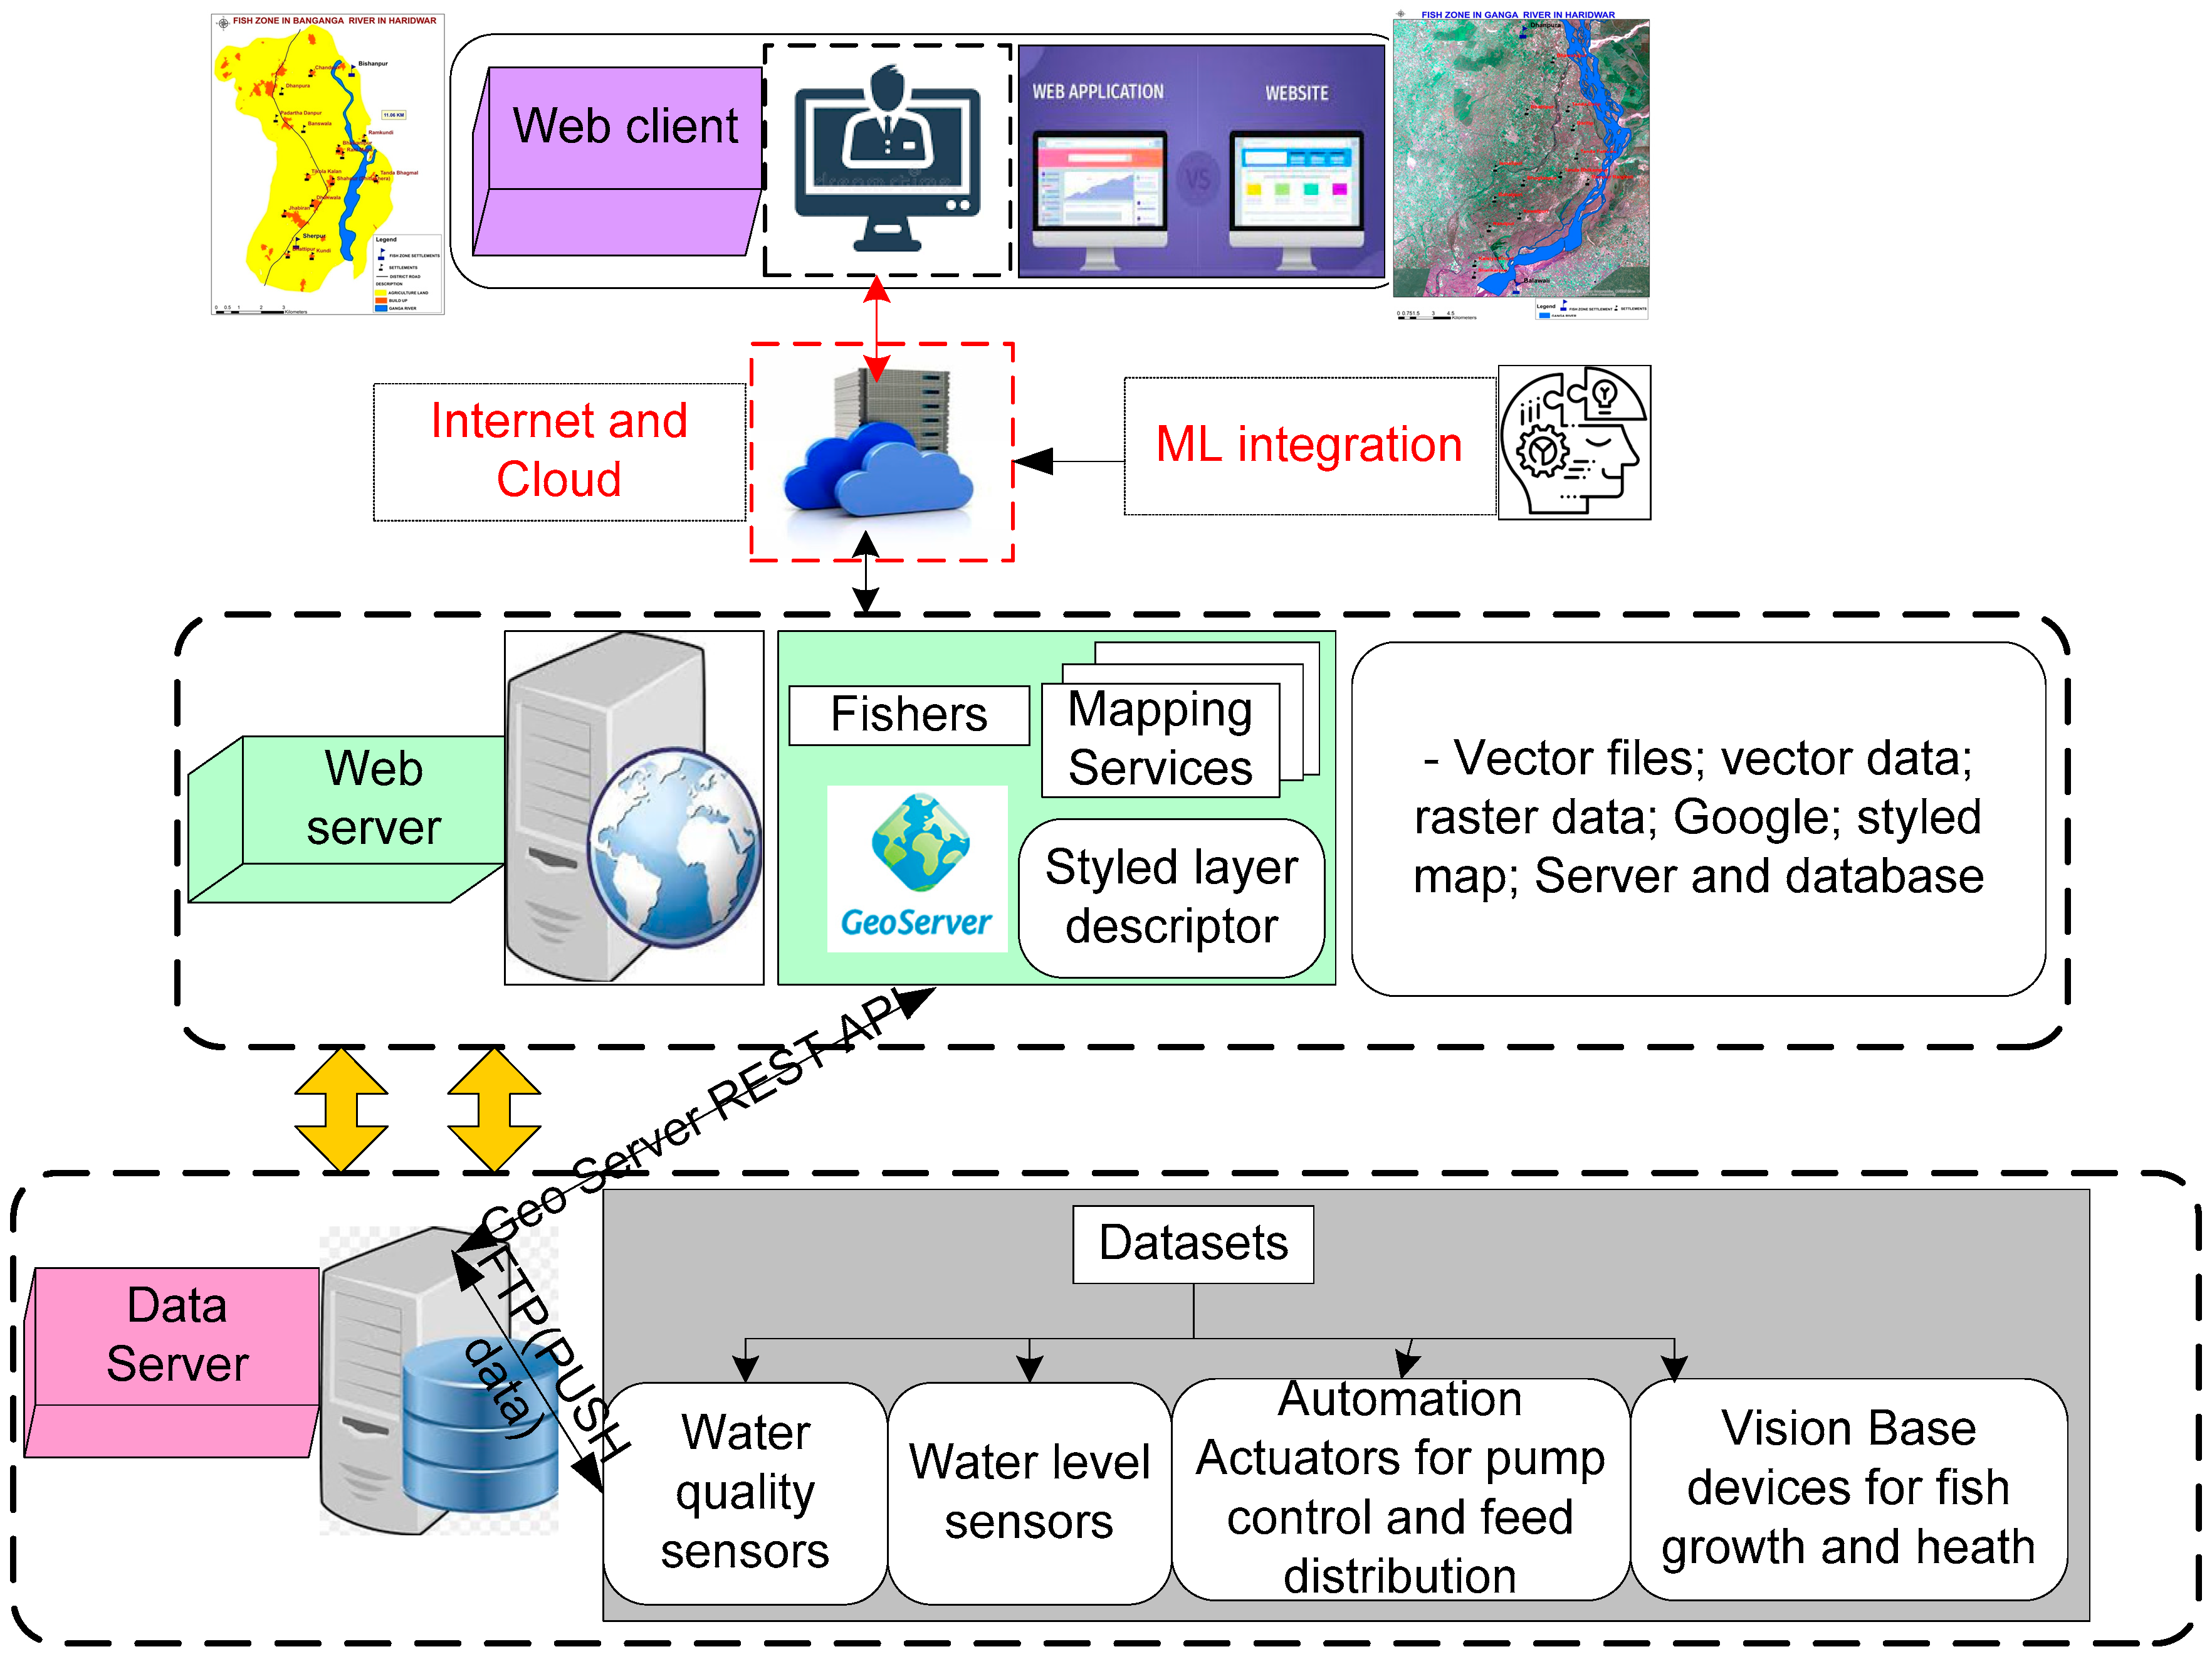
In this study, we have proposed an architecture that empowers the creation of a database and a web-based application of potential fish zones using the IoT through the assimilation of geospatial techniques in
Figure 3. The web application assists the authorities of the fishpond to visualize the real-time fishpond data from the IoT and geospatial data. Furthermore, the availability of data in the cloud enables the implementation of AI for predicting the health of the fishpond when compared with previous events. The availability of output from the AI model helps authorities to take suitable measures to preserve the fishpond’s health while also safeguarding its sustainability.
The data server is formed with an amalgamation of sensor data (water level and water quality), vision data of the fish’s growth and health, and data of automatic feeding through the actuators. Here the sensor node and vision-based node deployed in the fishpond enables a sense of all the necessary data such as sensors, vision, and actuators. File Transfer Protocol (FTP), a common communication protocol for the transfer of computer files from a server to a client on a computer network, is used to log this sensor data into the data server. The web server is the next element in the proposed architecture, and it contains real-time information about the fishpond’s geospatial data, including GIS and GPS. Geo-tagging and GPS data collection are followed by a field survey and information gathered by field officers in different blocks/districts of the state. The process of Geo-tagging involves the collection of geographical metadata in a variety of media, including images and videos, websites for a particular location, or latitude and longitude. Geo-tagging and mapping can help users to find and upload a wide variety of location-specific information from a device. Accurate and real-time information is advantageous in the authentication process in various ways, for example, current dispatched images with location (lat/long), time, and date will aid in delivering real data that will be able to eliminate potential duplicates.
The data server is connected to the web server through the geo server REST API. Clients can access information about an instance and make configuration changes using GeoServer’s RESTful interface. Clients can configure GeoServer without using the web management interface by using the REST interface’s simple HTTP requests. The cloud is connected to the web server, from which the user, such as the head, field officer, and regional officer of the fishpond department, performs the necessary actions. On the cloud server, ML techniques can be used to identify anomalies and deficiencies in ponds. If an anomaly is discovered, these technologies may alert automatically to the customers or authorities in a timely manner through wireless communication on the cloud server.
Anomalies in data detection provide essential insight into a broad spectrum of application realms. Real-time anomaly detection aids in the detection and correction of flaws before they lead to significant damage. Furthermore, it is used to supervise our devices smartly for possible concerns and to act immediately if problems are identified. Eventually, it can provide the client with near-real-time visibility into what is progressing in the client’s device, enabling the user to generate smarter decisions. Traditionally, anomaly detection was implemented with the assistance of traditional techniques, which were applied to static data, posing challenges in scaling out the number of scenarios as the number of scenarios continued to increase. In this case, the ML model generates large amounts of unstructured and semi-structured data from sensor and visual device sources. The generation of large amounts of time series data encourages the use of ML techniques for real-time anomaly detection. Fundamentally the ML method consists of training, cross-validation, and building phases. The ML model is trained after obtaining the input training dataset by specifying parameters of the model. The accuracy of the model is cross validated with an optimal model by alerting the hyperparameters through its execution on the dataset. Following the testing process, the model is built for the prediction of real-time series data. The prediction of real-time series data assists the researchers to forecast future trends in water quality using ML approaches.
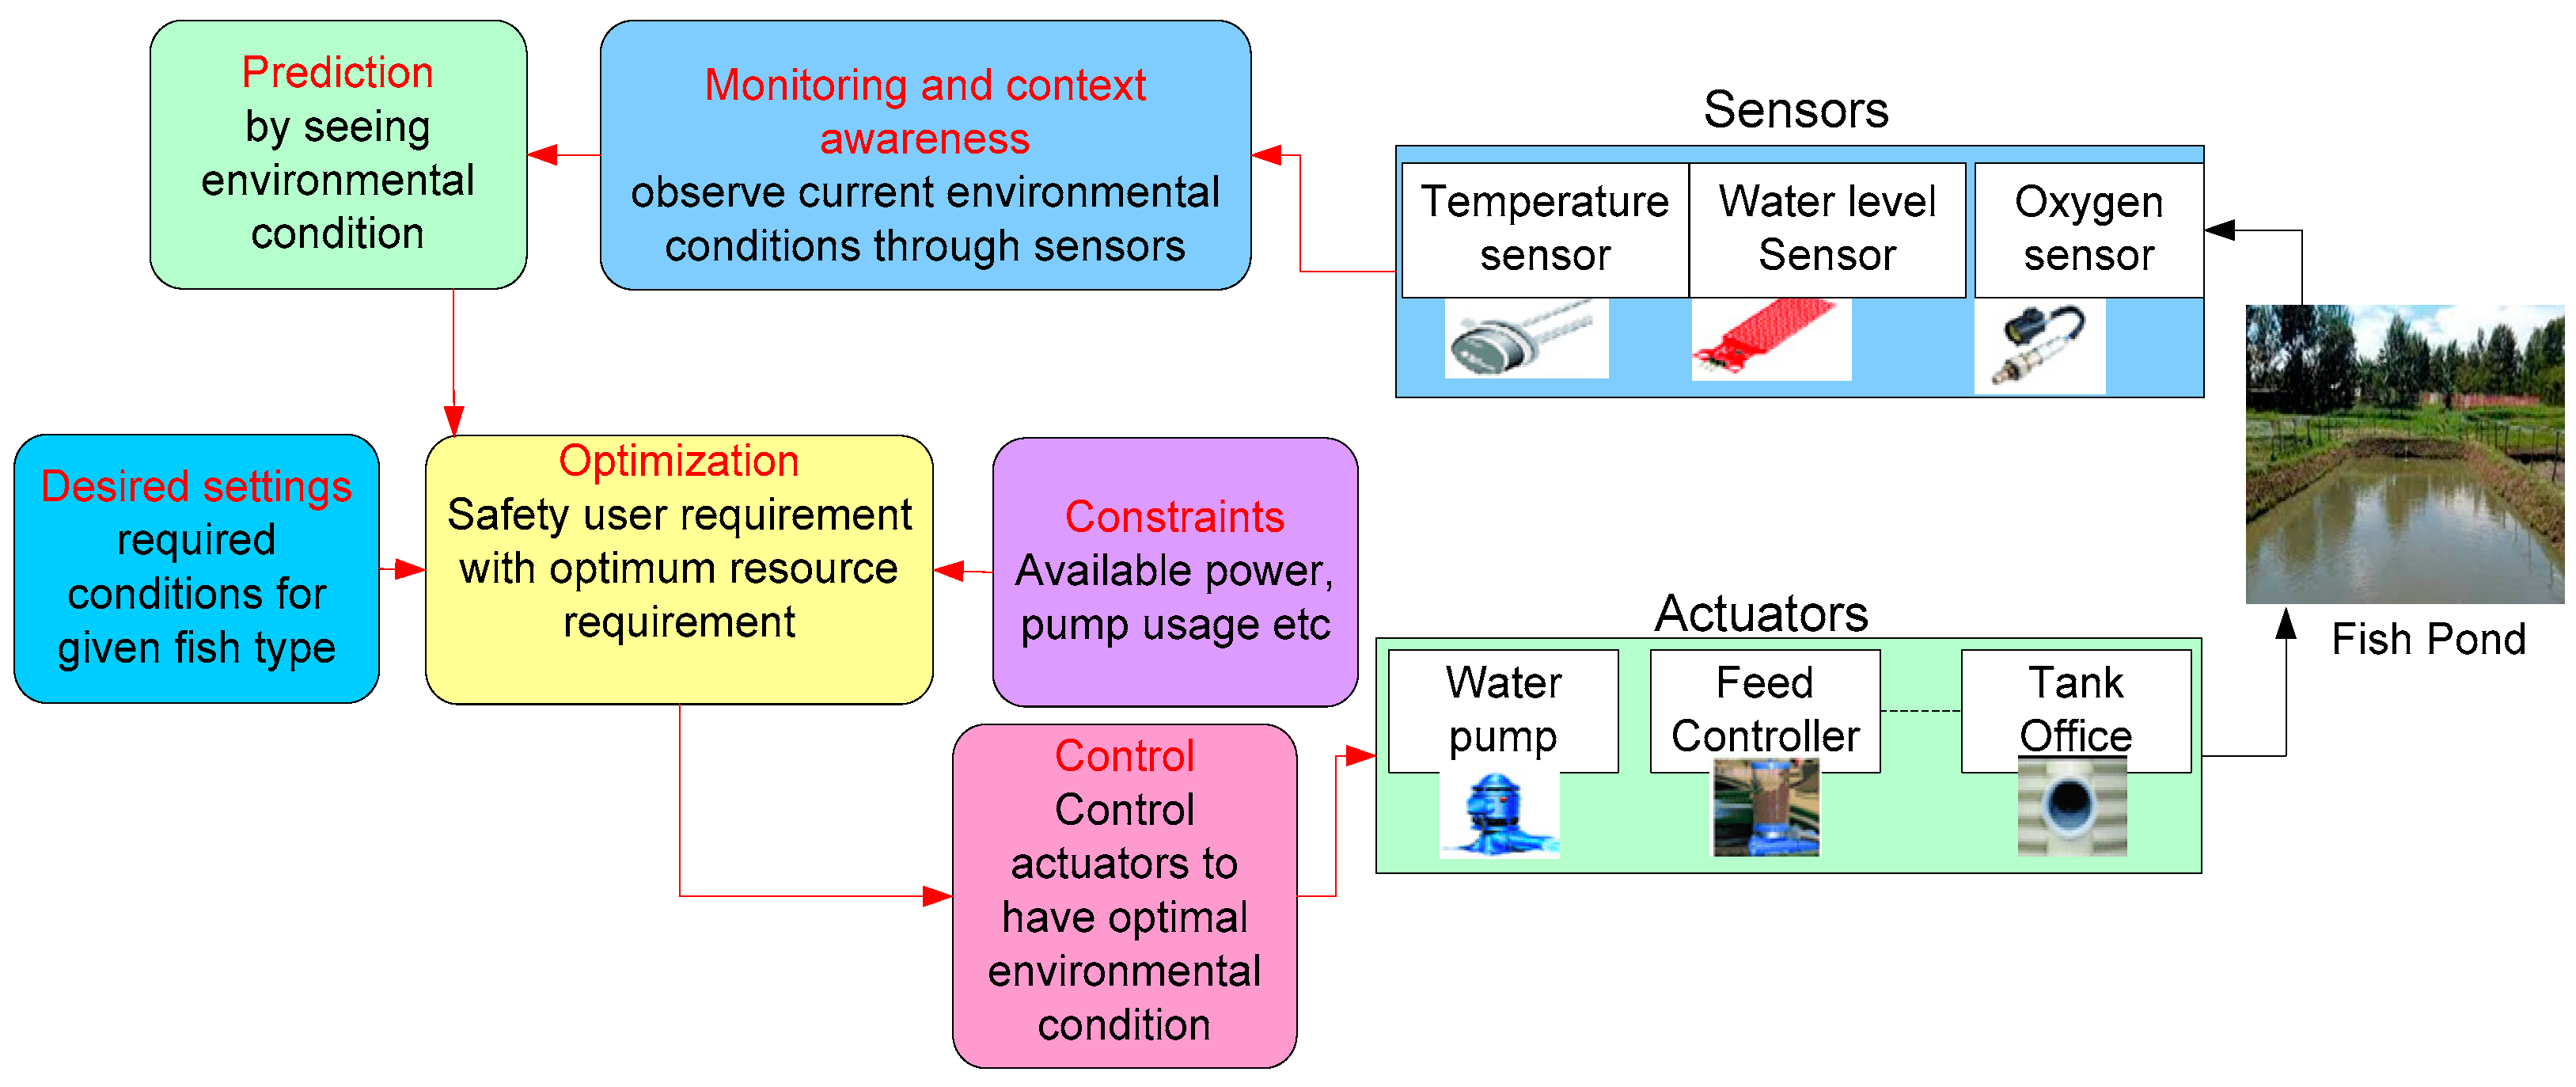
Figure 4 demonstrates the conceptual design for IoT-based aquafarming. The conceptual design discusses the application of sensors and actuators in the fishpond. Here the temperature sensor, water level sensor, and dissolved oxygen sensor enable the actuators to perform respective tasks based on environmental conditions such as feeding and replacing new water through the water tank and water pump. Sensors also assist in the optimization of resources concerning environmental conditions, as well as the adjustment of the desired environment that is suited for the fish. Moreover, the prediction can be applied to the sensing data, where we can identify the possible conditions to monitor the feeding and water pump.
4. Collation and Generation of Aqua Database
Database generation for fisheries’ resources and making them communicative is essential in the prospects of the socio-economy of hilly regions. In the era of the digital revolution, an attempt has been carried out to gather all resources related to the “harvesting and conservation of fish” on one platform. This article aims to develop the geo-tagging of the fisheries’ resources through the IoT and the cutting-edge technologies in the related area. The present work discusses the results of the work achieved in the development of an application for the fisheries department to maintain a large number of ponds with their details for maintaining the official records. The record covers each phase’s dataset including investment details up to the final cultivation of aqua farming. Hence, a tool is framed to maintain a record of various ponds in the state. In addition, it will provide details of registered ponds along with various other pond details. Policymakers and authorities may update their respective development phases and access all the information from anywhere for tracing the progress cycle.
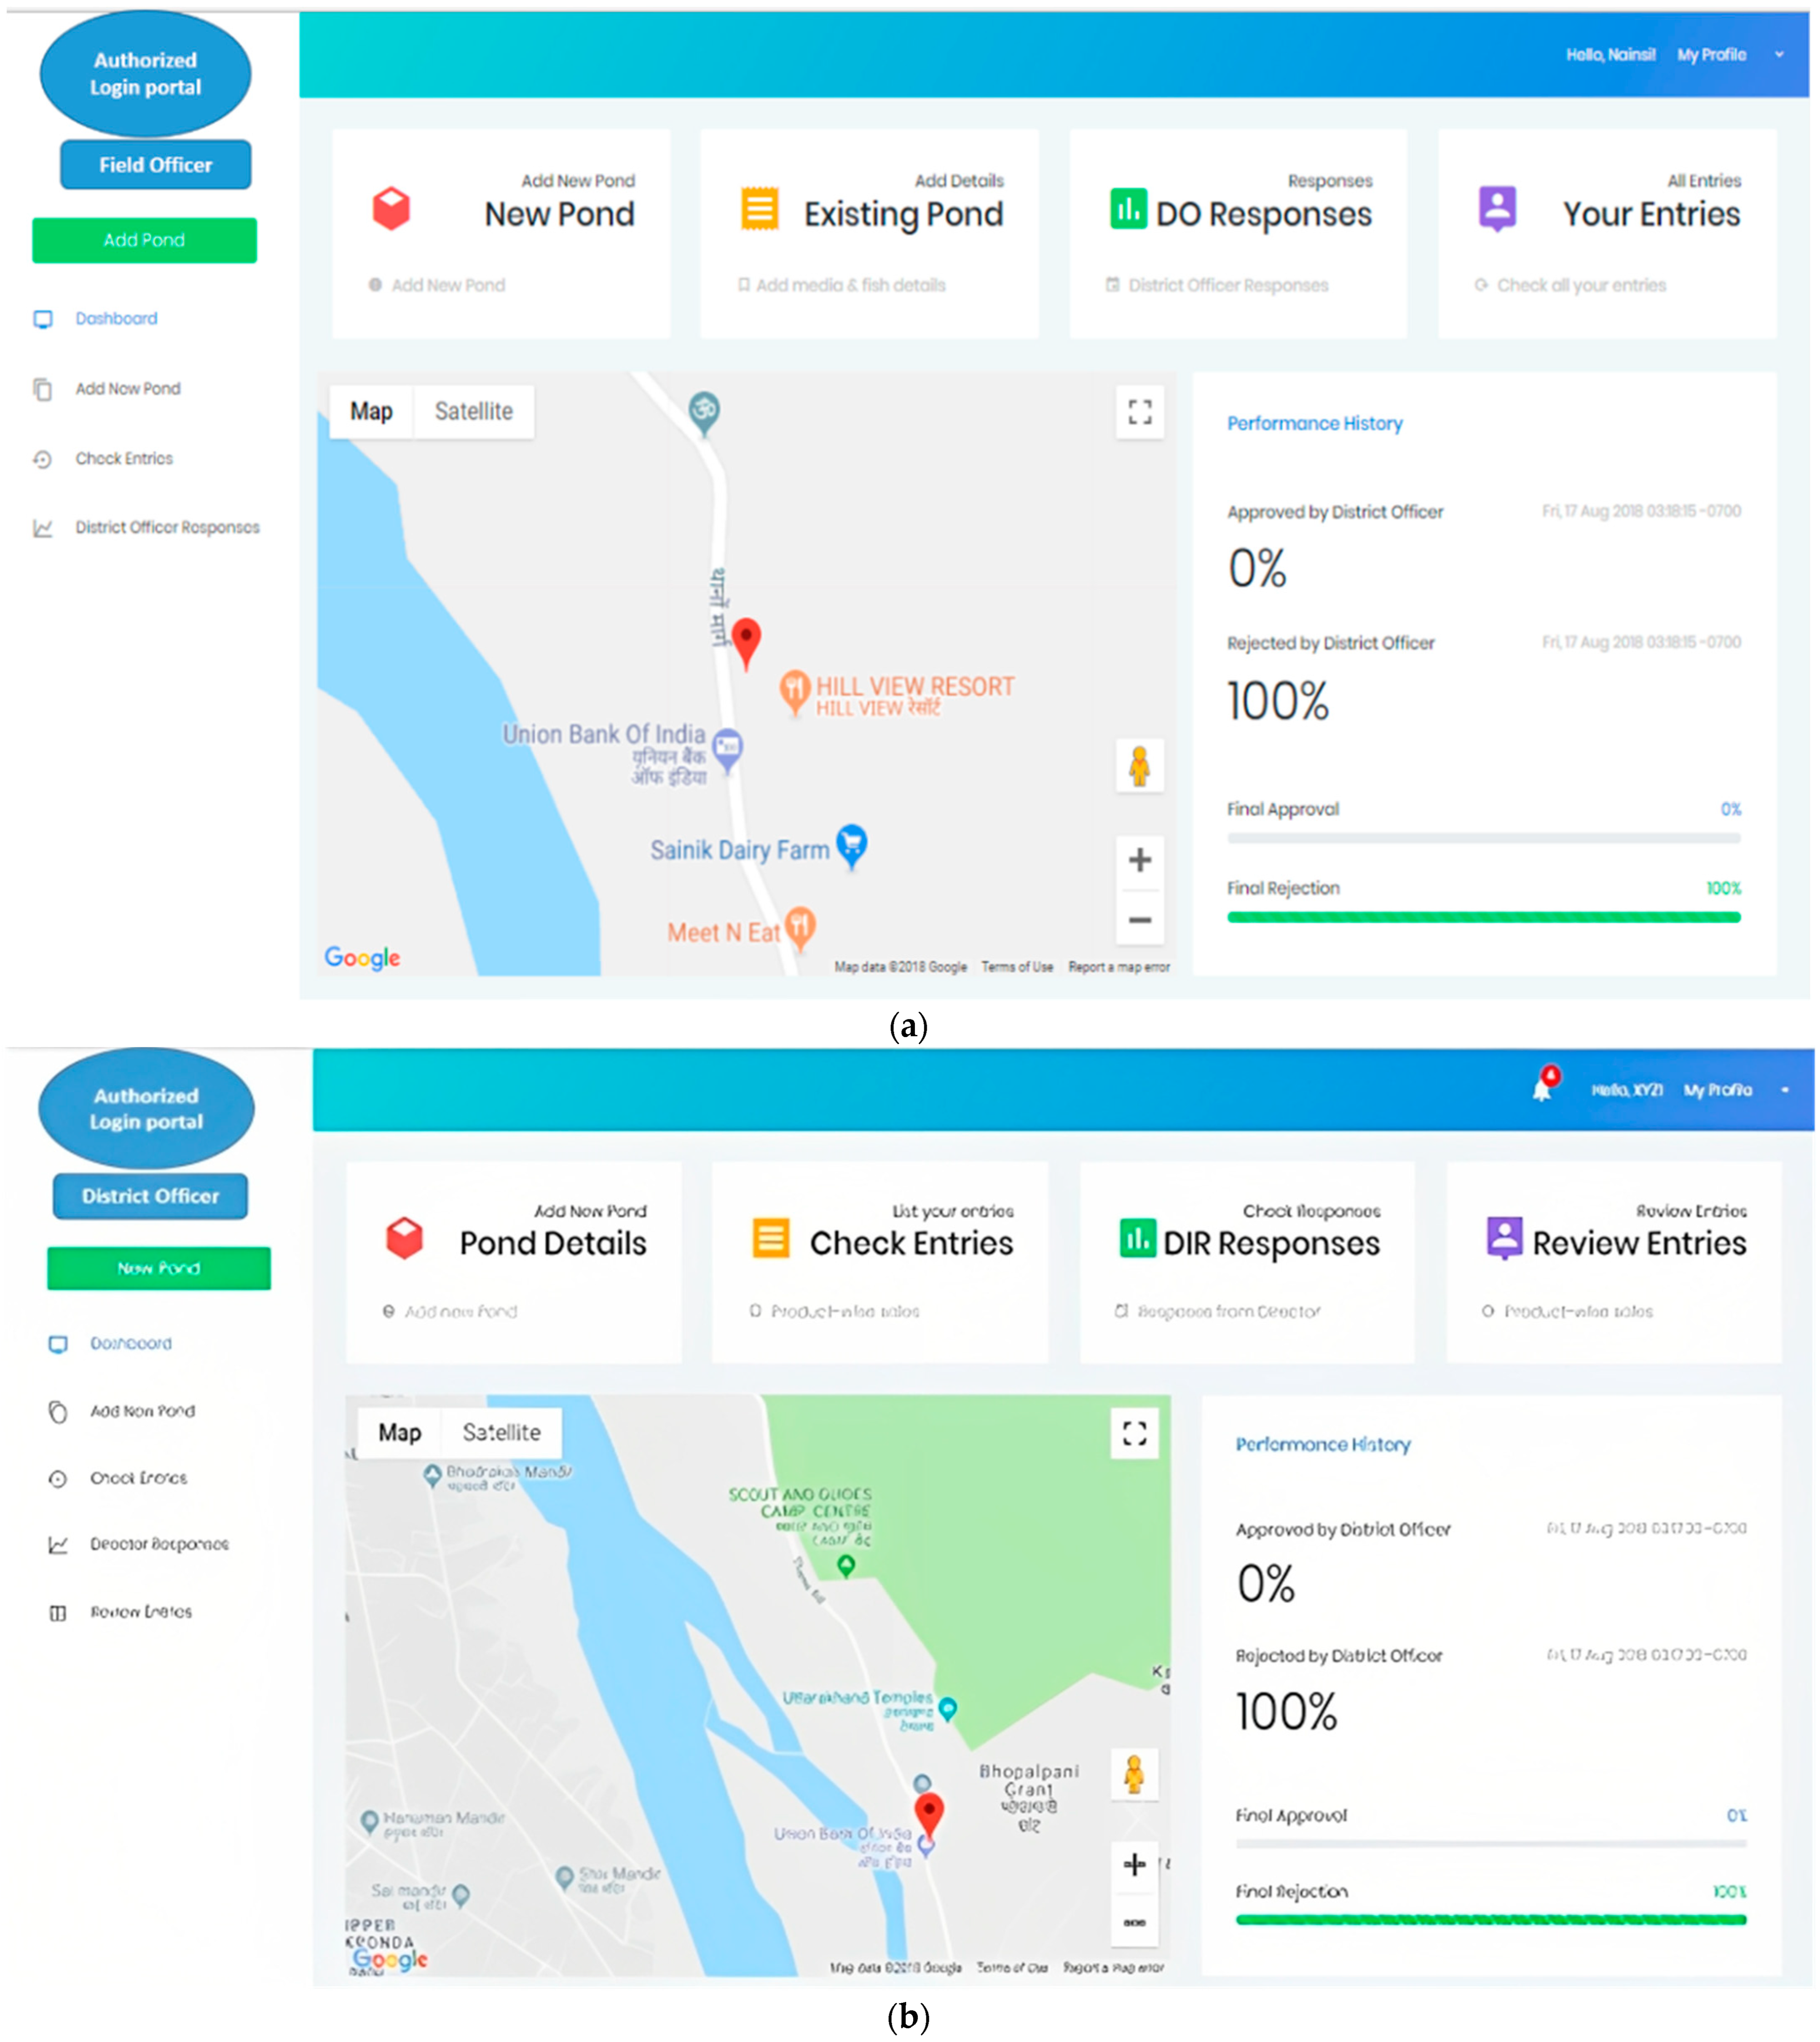
The web-based framework for aqua resource monitoring and uploading through various authentication phases is depicted in
Figure 5. This whole strategy will help manage the expenditure as well as the current status of the aqua resources. This application facilitates the data of existing ponds as well as newly sanctioned ponds in various locations or individuals of different districts. The broad objective of the proposed study is to develop a framework for the mobile application to address the aqua farming database. This requires the collection of filed data related to fisheries’ resources under various phases. The various phases of the mobile application are given below: An application is required for the smooth interaction between the various officers—the Field Officer, District Officer, and the Head/Director. The field officer has permission to add pond details and review his/her entries and generate a request to the district officer.
The district officer has permission to add pond details and, in addition, he/she could accept or reject the request made by the field officer. Besides adding pond details, the director’s office will respond to the request made by both the field officer and the district officer and monitor all the upgrades/entries. In addition, the officers could upload the pond construction photographs over the construction phase for monitoring which will authenticate the locations, existence, and current status of the pond, etc.
Figure 5a represents the dashboard of the field officer in the developed web framework. The field officer logins with authorized credentials, in which multiple parameters need to be uploaded by the field officer. Adding a new pond and adding details to the existing pond are two parameters in which the field officer can include the data. In the district officer’s (DO) responses, the field officer can check the number of approvals and rejections for the new pond registration processed by the DO. The entries parameter shows the number of entries that have been processed by the field officer.
Geo-tagging and geo-mapping provide a wide range of location-specific information in the mobile device for accurate and real-time information. Integrated information related to a location with data dispatched to the date and time provides the authentication of the datasets. This provides the upgradation of the pond status as well as notifications related to new government schemes, as well as verification and work progress monitoring in a real-time manner. An Android application development is required for various inputs under different phases as per the protocols and functional criteria of aqua farming. Apart from this, the other advantage of the mobile application is the smooth and transparent database inter-relation which is highly required in the prospect of socio-economic balancing as well as in the betterment of aqua farming.
The various phases of the mobile application procedure is specified as the application is required for the smooth interaction between the various officers—the field officer, district officer, and the head/director. The field officer needs permission to add pond details and review his entries and generate a request to the district officer; the district officer needs permission to add pond details and in addition, he/she could accept or reject the request made by field officer; and besides adding pond details, the director’s office will respond to the request made by both the field officer and the district officer and monitor all the upgradations/entries. In addition, the officers could upload the pond construction photographs over the construction phase for monitoring which will authenticate the locations, existence, and current status of the pond, etc.
The mobile application for the geo-tagging of fisheries’ resources/assets includes field-level information and usage in a real-time monitoring of the current status of fishponds and other related resources. The following points are to be addressed during the usage of mobile applications through the IoT. After the site selection, a GPS survey should be carried out for the generation of pond locations in the different blocks of districts. During the field survey the following information should be taken into consideration: the user interface development and the collection of inputs from authorities and stakeholders; the database architecture; the form structure development district-wise; the web portal-data entry-coding front-end as per the app frame; google map integration, latitude longitude, and flag listing, etc; the whole app integration with application and maps; web portal synchronization; query generation by various field parameters and testing; bug removal; and final testing.
Figure 5b represents the dashboard of the DO in the developed web framework. The DO logs in with authorized credentials, in which some parameters need to be processed by the DO. To add new pond details is a parameter in which the DO can include the data. In response to the DIR, the DO can check the number of approvals and rejections for the new pond. In the list of user entries and review entries parameters, it shows the number of entries that have been verified and reviewed by the DO.
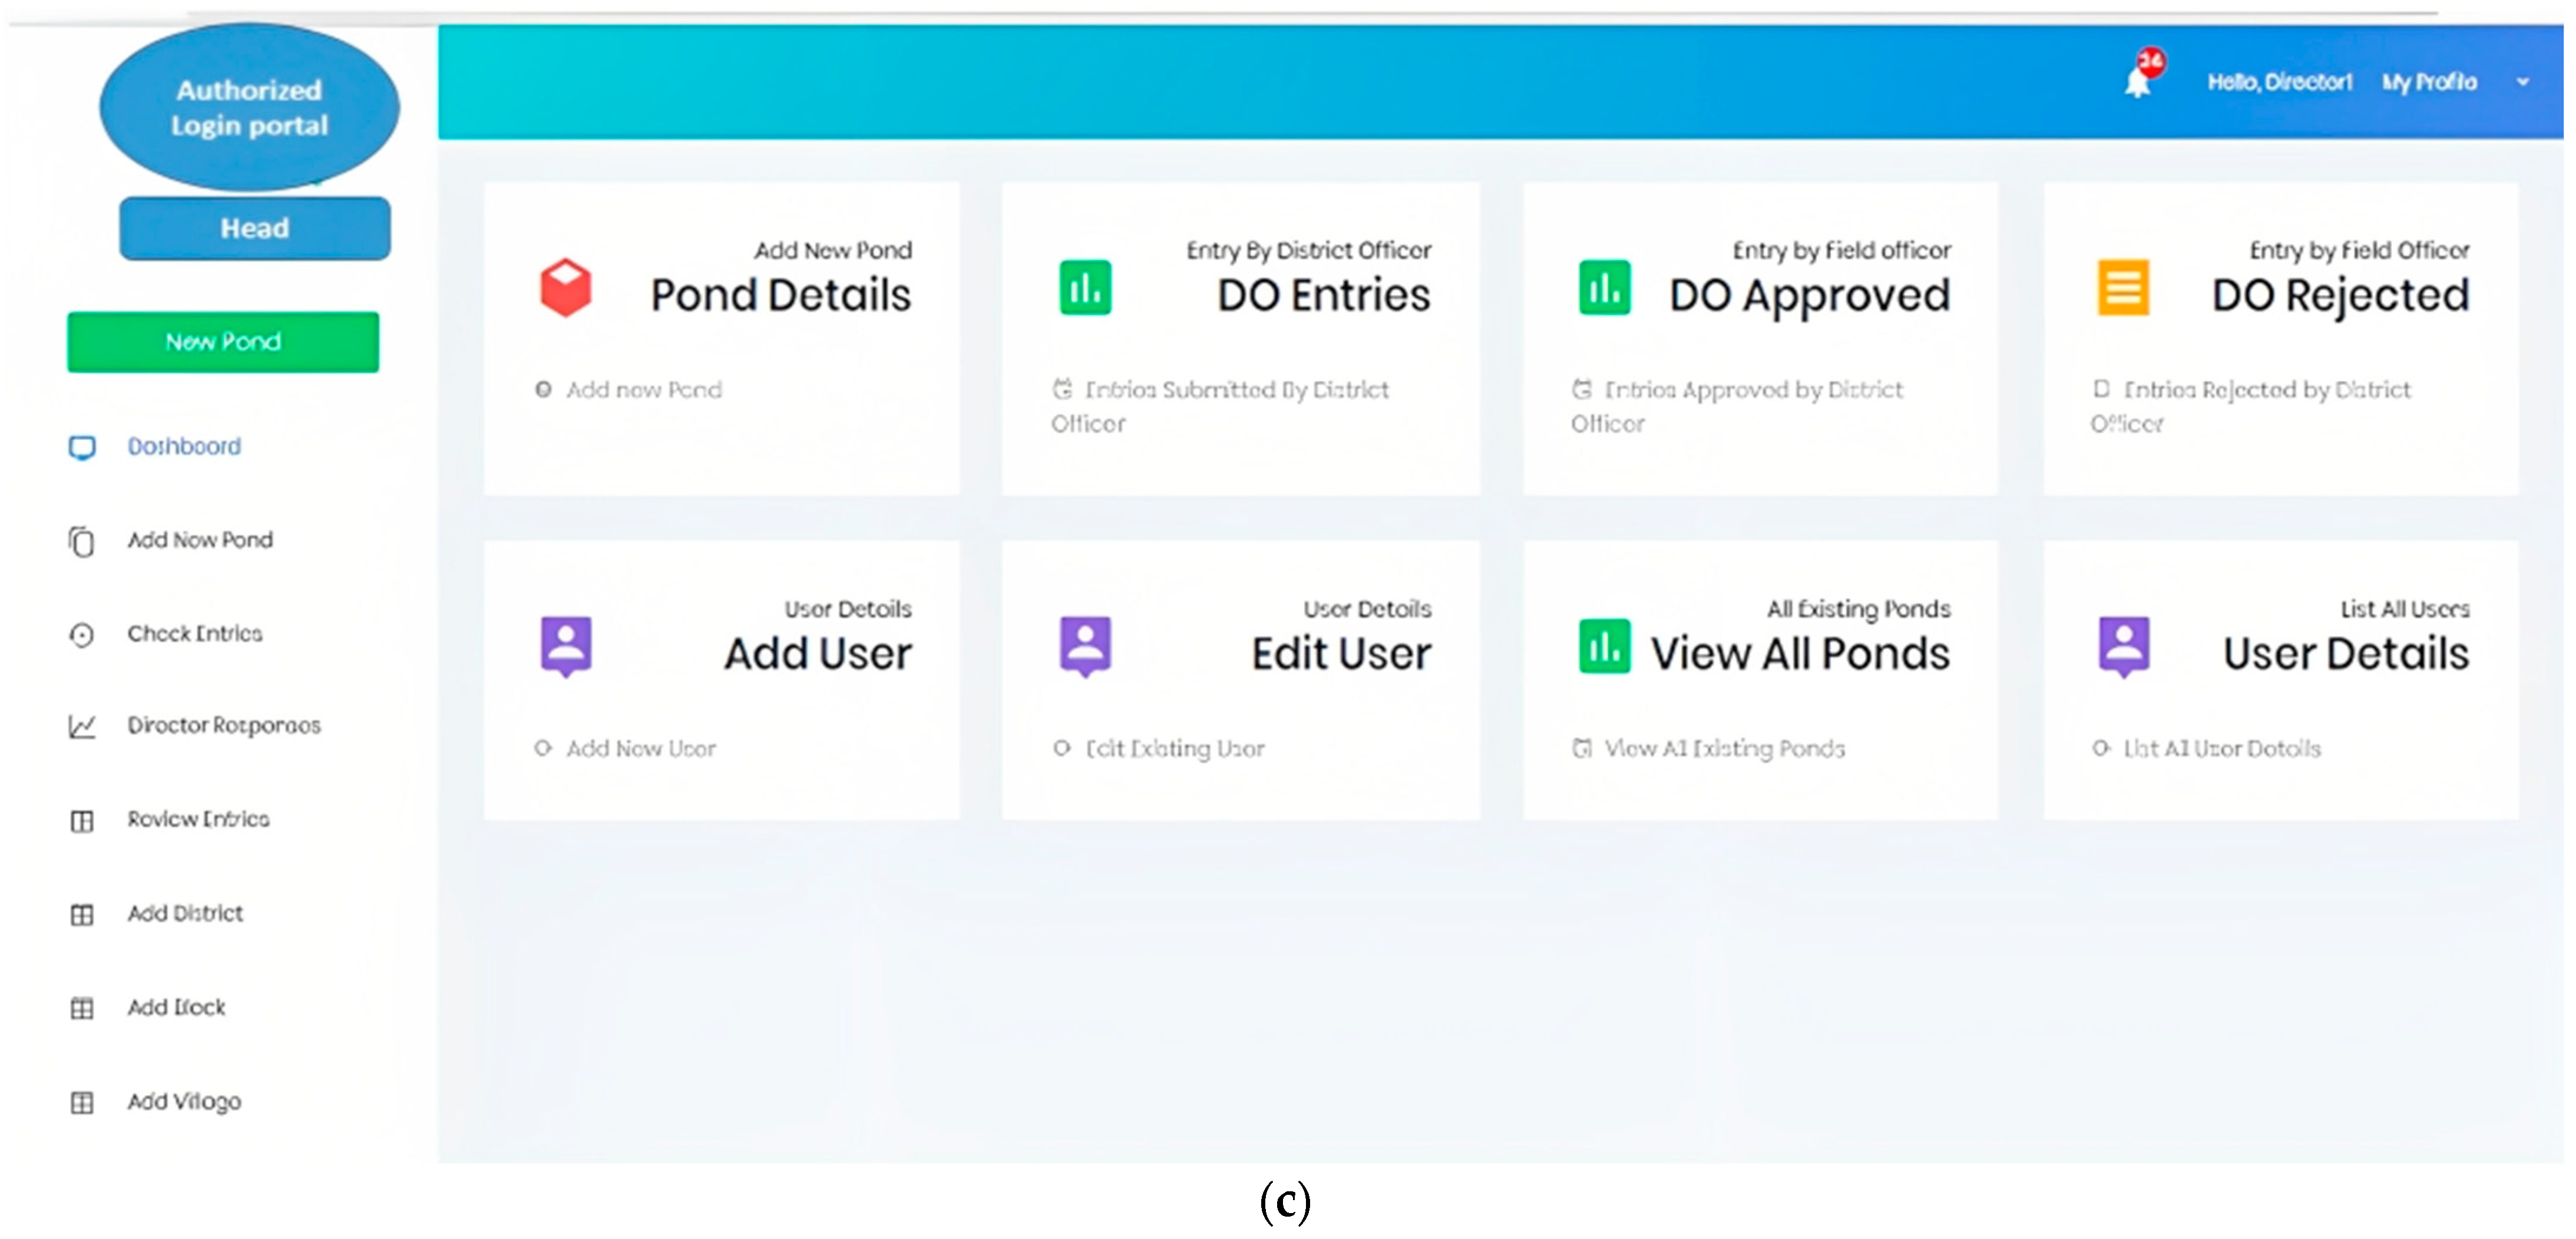
Figure 5c represents the dashboard of the head in the developed web framework. The function of the head in the web framework is used to add new pond details. In addition to this, the head can add new users, and edit the existing user details. In the dashboard, the head can monitor the number of entries processed by the district officer and field officer and also approve or reject the adding of new pond details. The information regarding the number of ponds and their user details which are approved by the district officer is visualized on the head dashboard and it enables the head to check the details.
5. Results and Discussion
In this section, results are discussed in detail with the figures and also the comparative analysis is presented.
- (a)
Results
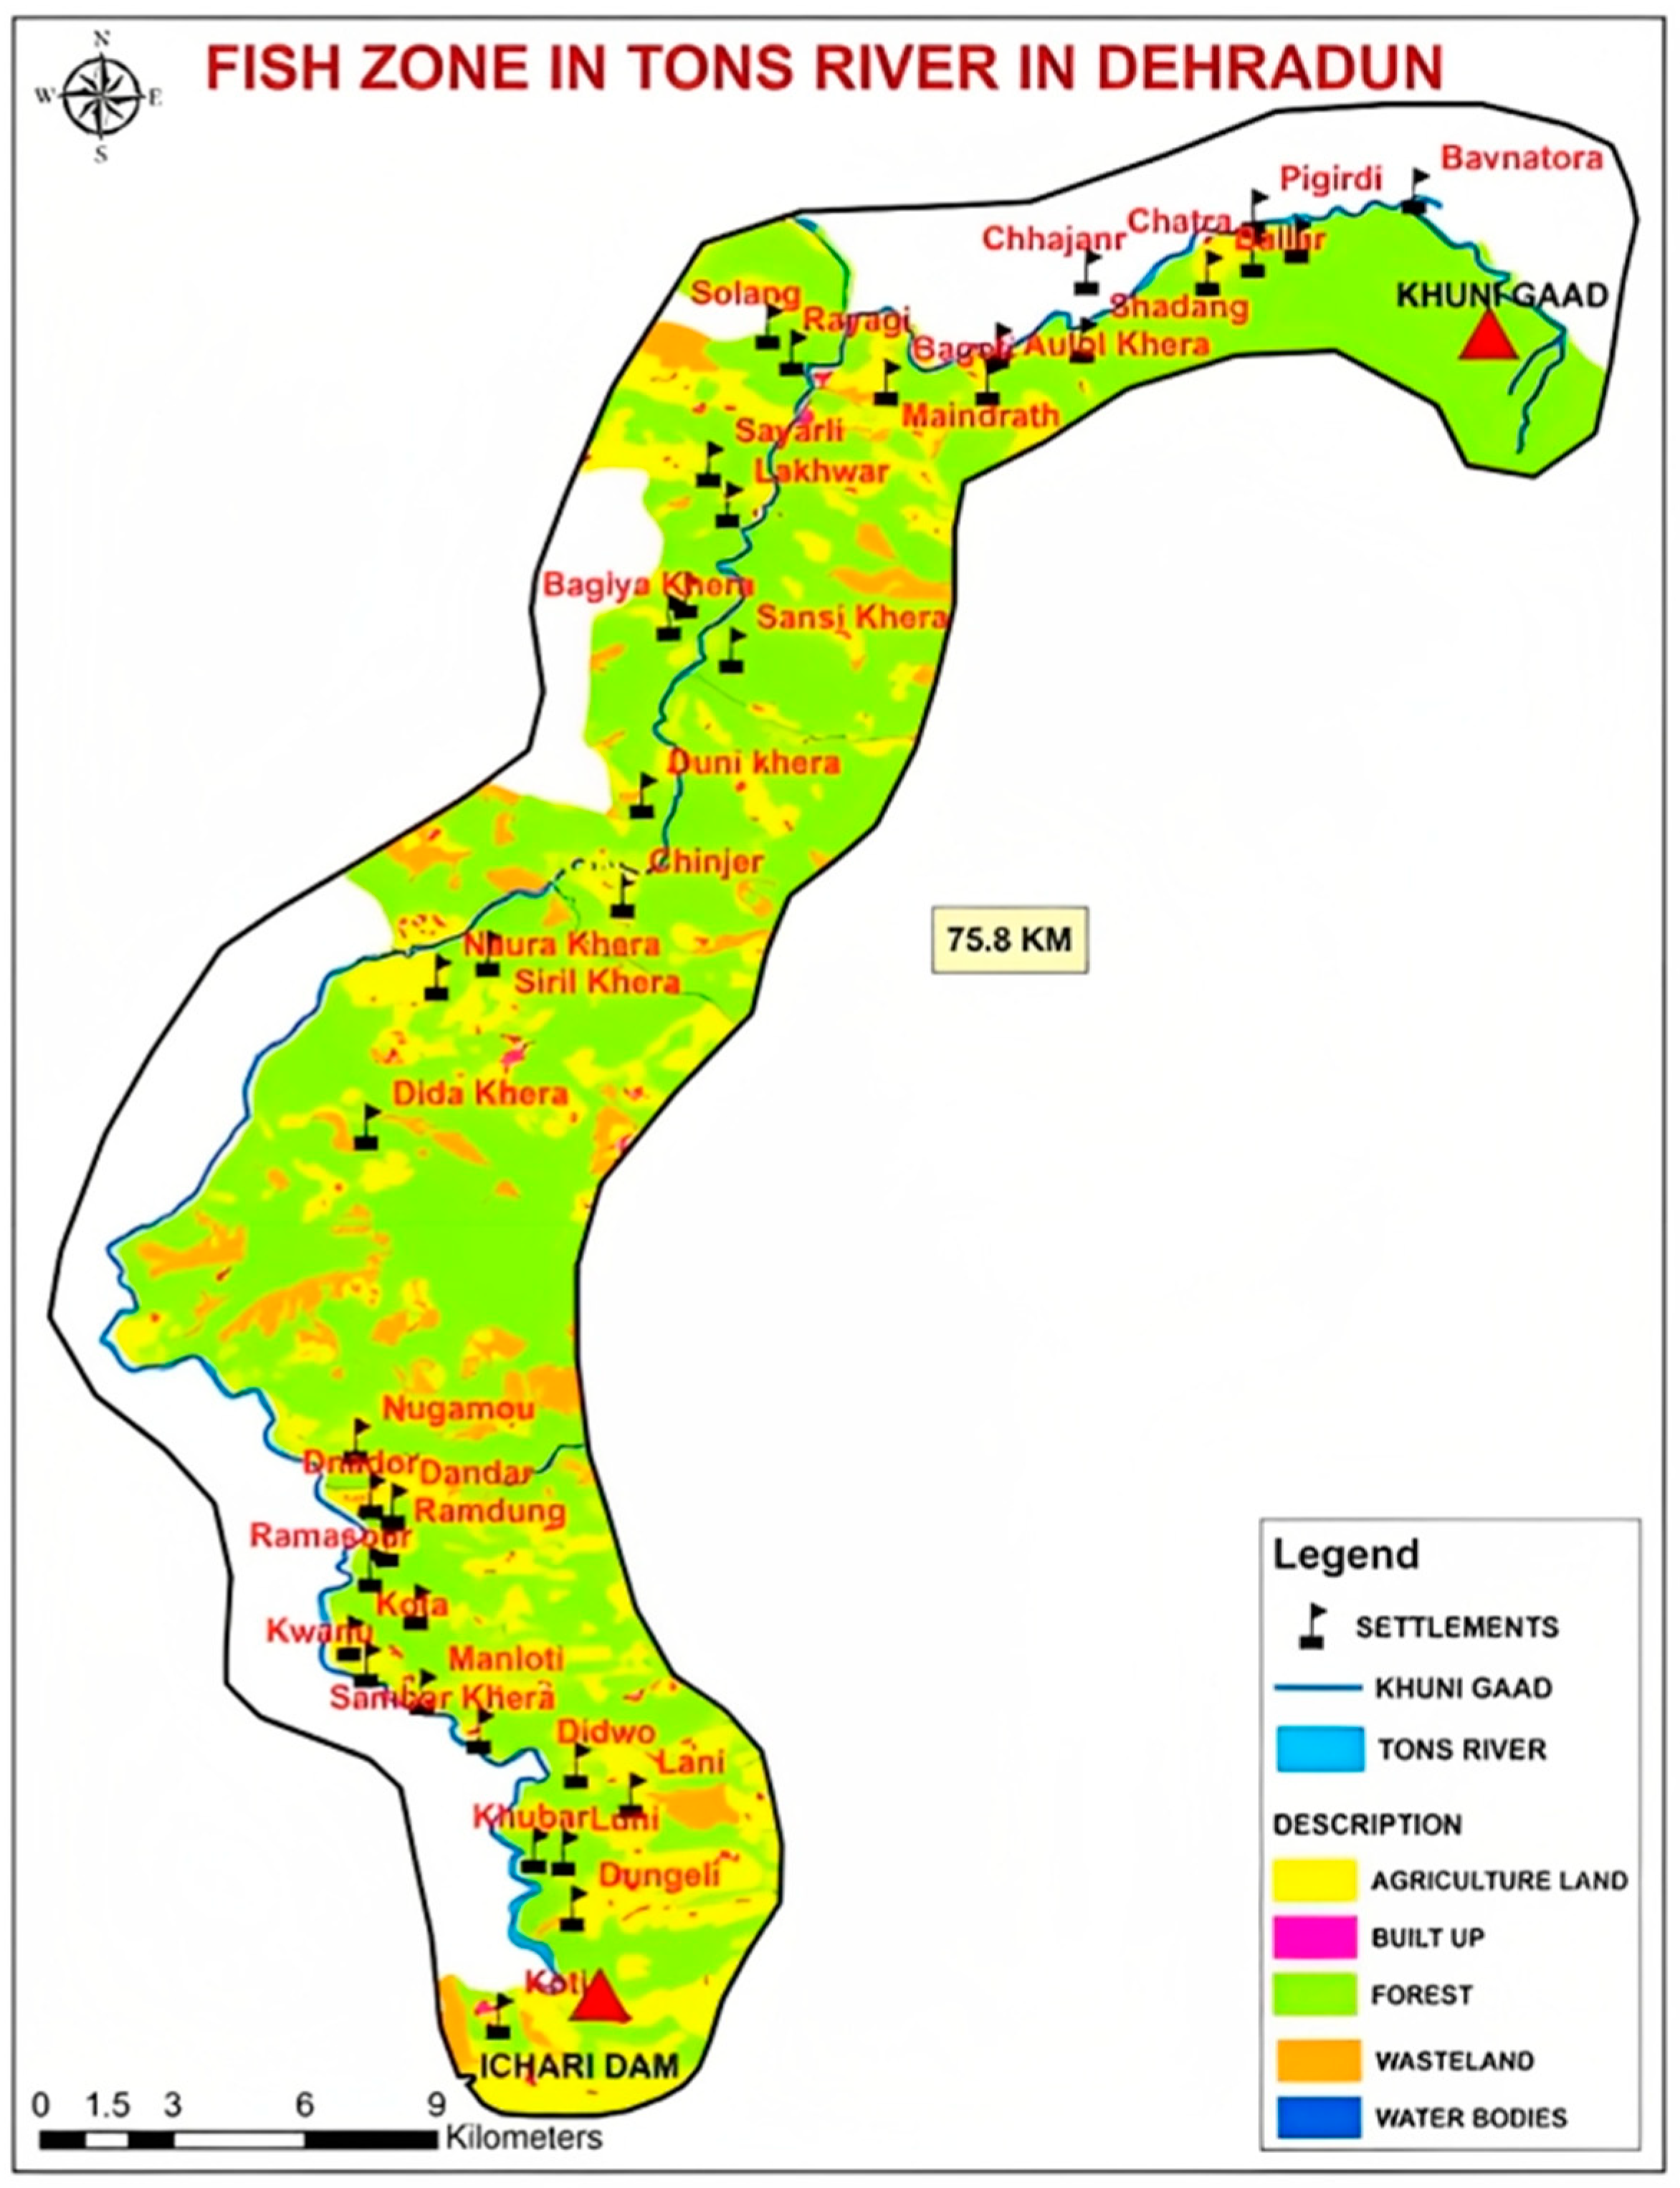
The proposed framework can detect aquatic species’ movements, locations, and foraging habits. Using the web-based framework and monitoring of aqua resources, the IoT and geo-tagging are highly advantageous in the monitoring of real-time databases. A case study for the geo-tagging and geo-mapping of the fisheries’ locations is carried out for validation of the proposed real-time monitoring framework for Potential Fish Zones in the Dehradun region of Uttarakhand, India. This surveyed information is processed in a GIS application that can be further used by policymakers through the mobile application.
Figure 6 demonstrates the geo-tagging and geo-mapping of Potential Fish Zones in the Tons River in the Dehradun region of Uttarakhand India.
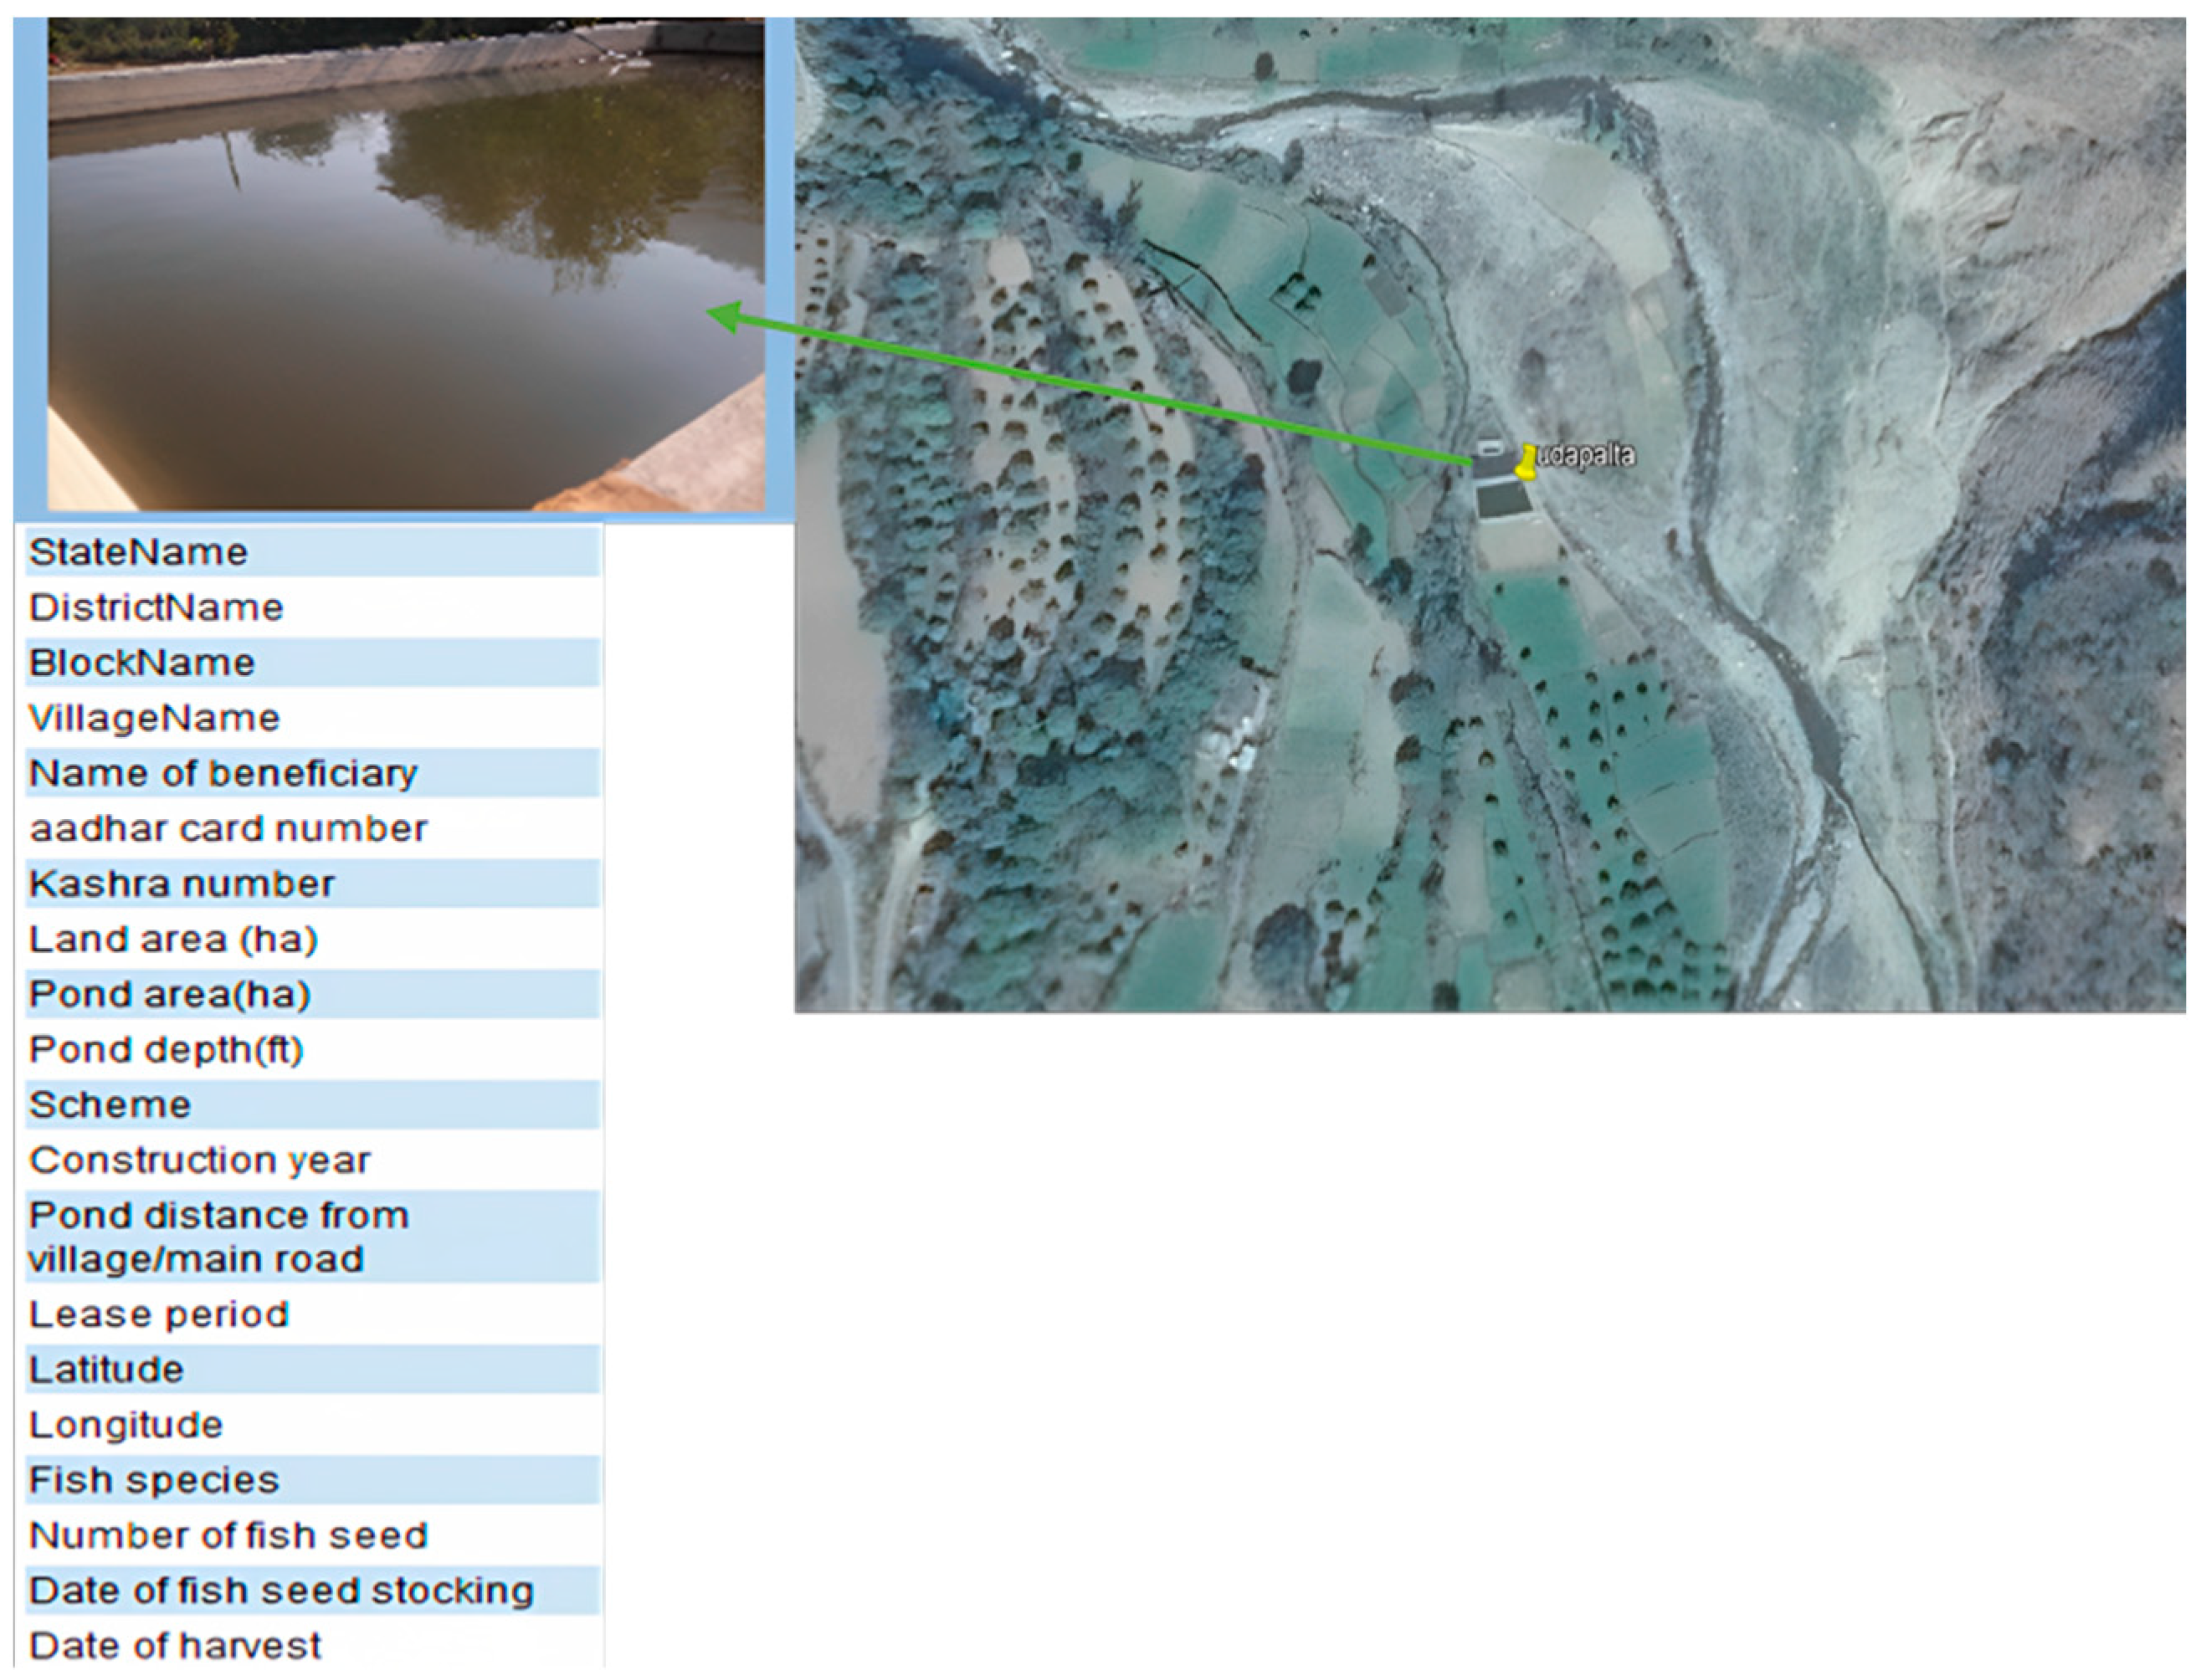
Figure 7 demonstrates the database generation during the field survey by the field officer for further usage in aqua resource management and real-time monitoring applications for stakeholders. These generated products are further used by policymakers through mobile applications as well as through login authentication webpages. The results are that geo-tagging offers a neutral, non-intrusive method of monitoring fishery resources, as well as other connected resources, such as their cultivation and the temporal status of the ponds. This will allow researchers to monitor the condition of the undersea sediment while also supplying crucial information about the fish without disrupting their natural habitat. The findings are discussed as follows: the suggested method for creating aqua farming data has a graphical user interface that makes it simple for different officers at their assigned locations to maintain the various pond details.
The process helps with the analysis and real-time monitoring of the expenditures made in support of various government initiatives. Future prediction of the yields is possible through a real-time monitoring system and resource management will be made easier with the framework and application. The suggested smartphone app will connect farmers with consumers and monitor the progress of their mass products, which will help improve the economic conditions of the farmer. The proposed framework for aqua resources enables database collection and suitable procedures for monitoring the work in different phases through a cloud server-based real-time monitoring system. The proposed aqua farming data creation procedure provides a graphical user interface that is easy to maintain the large numbers of pond details through various officers in their assigned regions. The process helps in the real-time monitoring and analysis of the economical disbursement through various schemes. The framework and application will be useful in the prospect of monitoring the expenditure utilization as well as the appropriate consumption of resources. The proposed mobile app will connect the farmers and buyers as well as monitor their product growth which will directly improve their economic conditions.
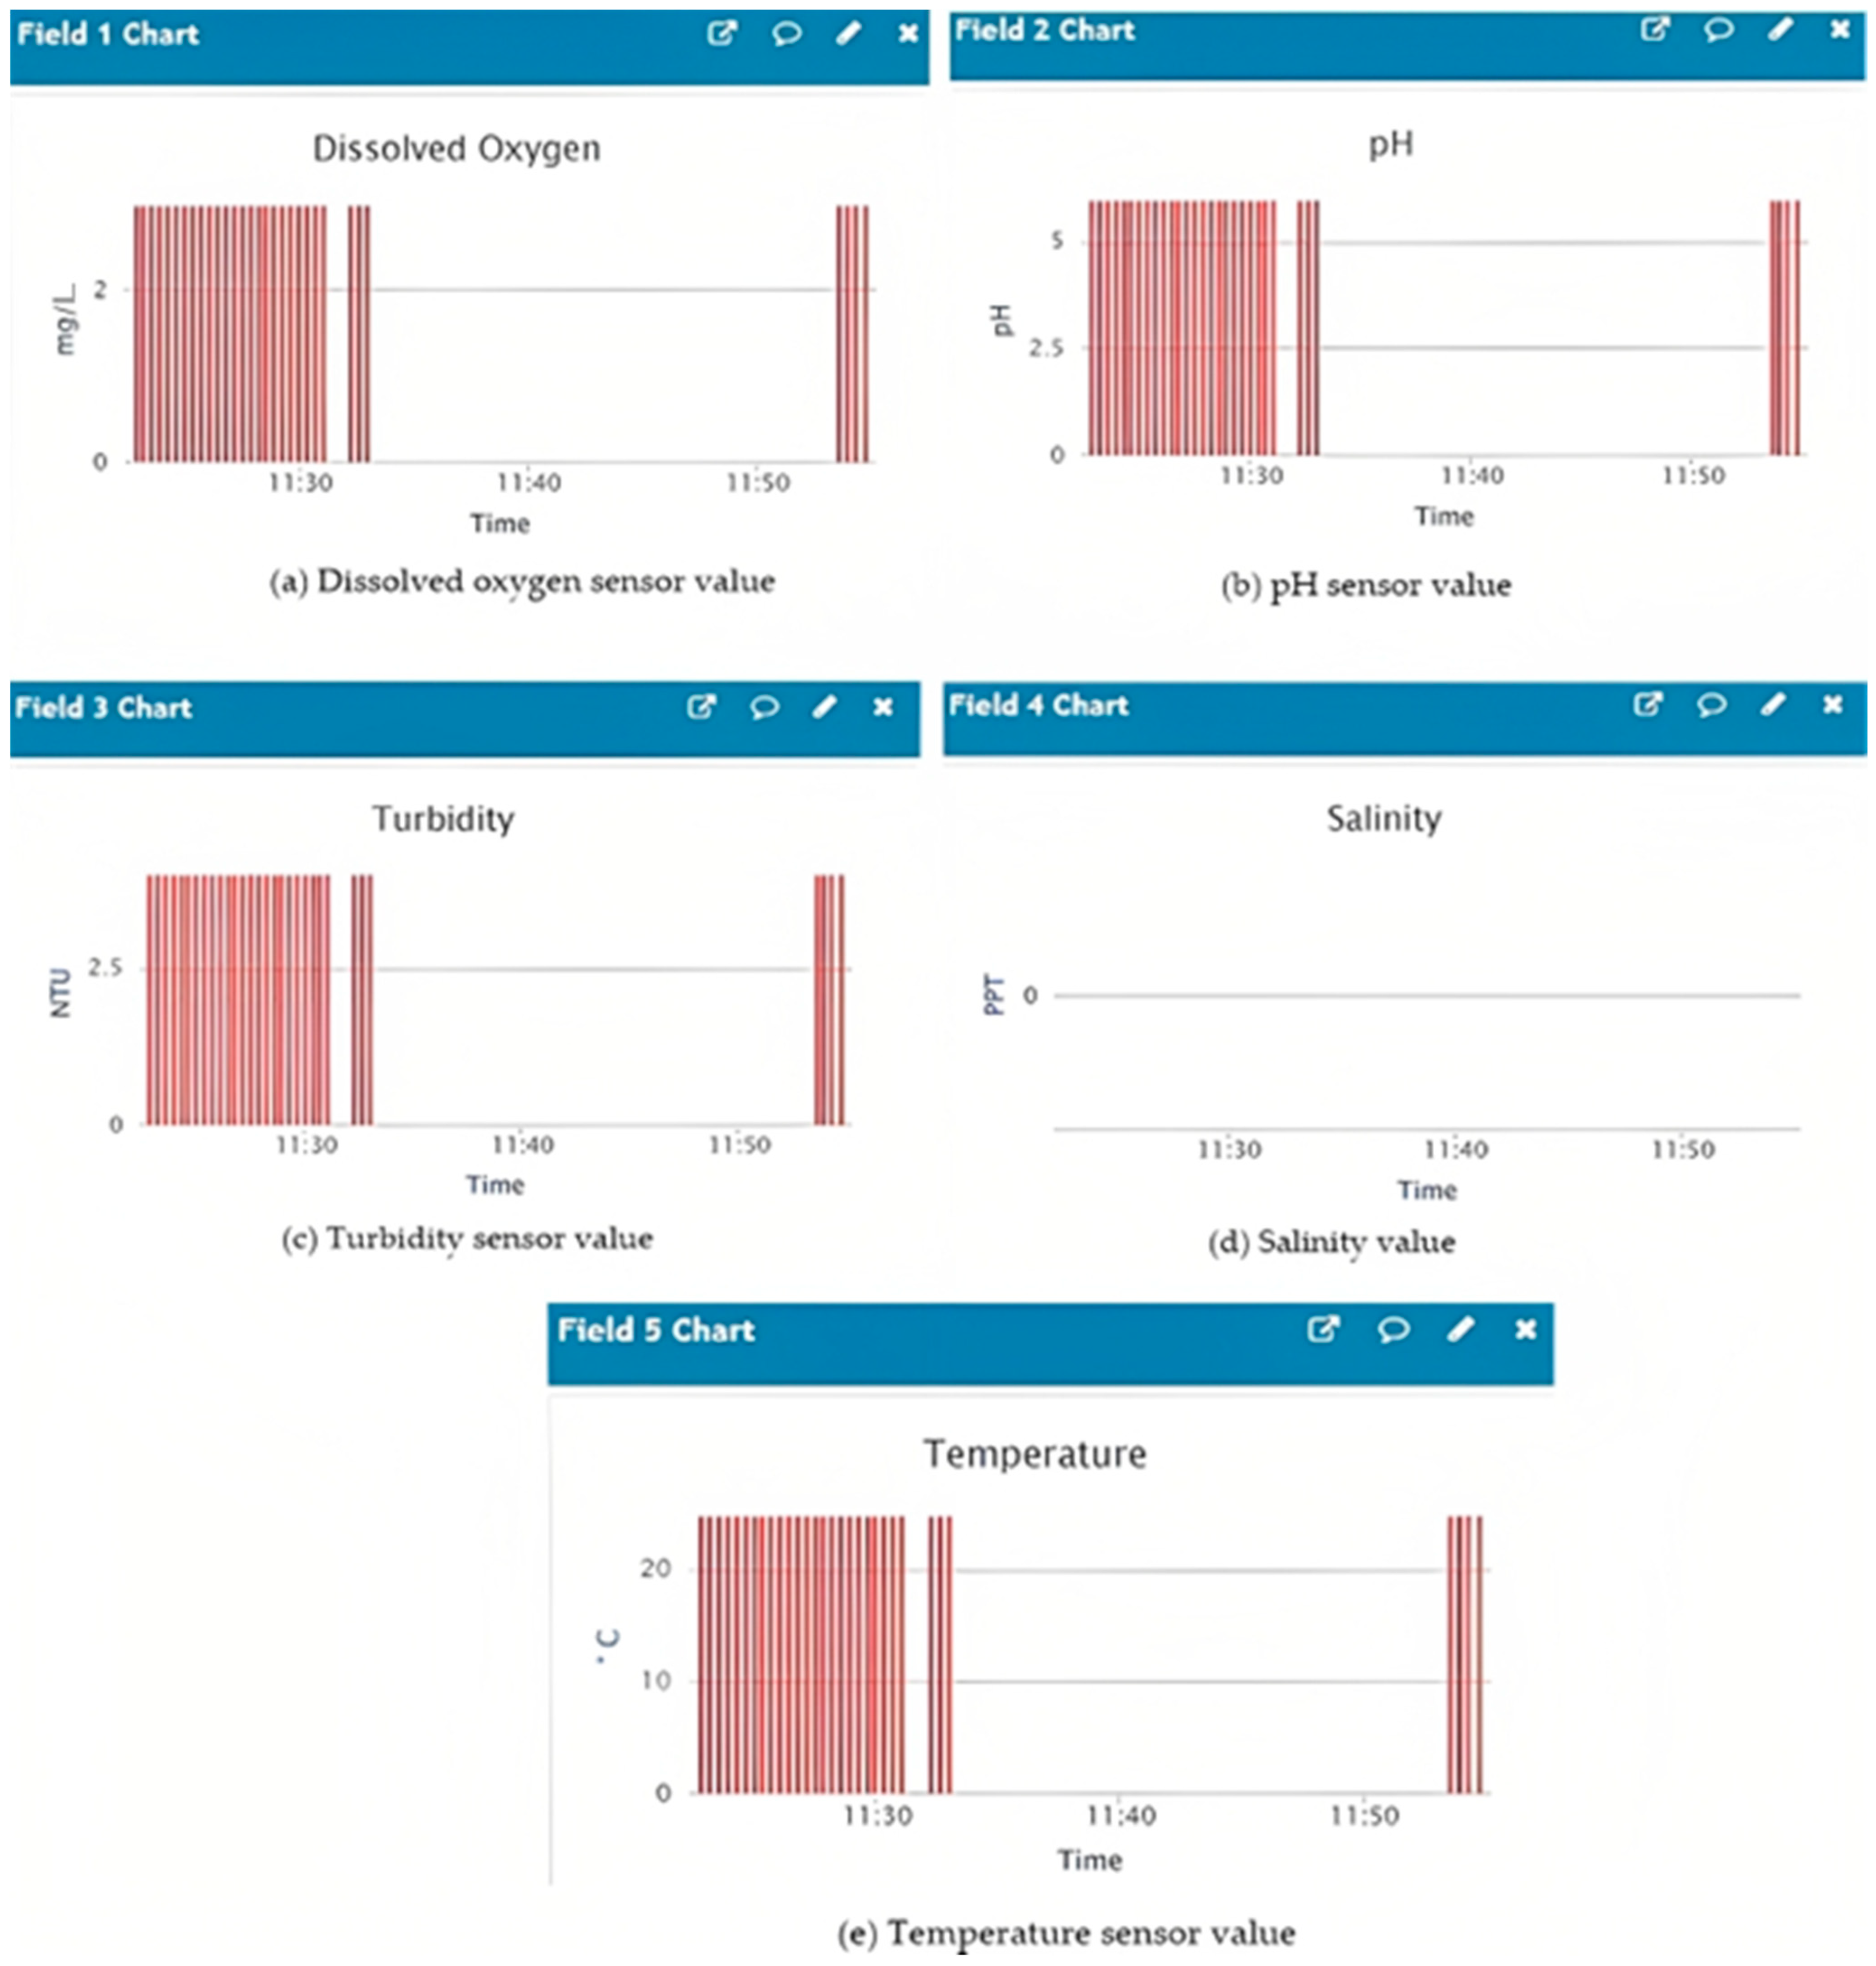
Figure 8 illustrates the sensor values of the IoT-based system deployed at the fispond, Dehradun with a latitude and longitude of 30.622180 N and 77.8683410 E. The IoT-based system comprises multiple sensors integrated into a customized board, and this customized board is connected to the cloud server (Thing Speak server) through wireless communication and internet connectivity. A customized board based on a wireless communication protocol is integrated with a DO sensor, pH sensor turbidity sensor, salinity sensor, and temperature sensor to measure the key parameters that conclude the health of the fishpond. The customized board is uploaded with firmware during open software, in which the threshold values of sensors are preset based on standard optimal values for the fishpond, and the credentials related to accessing the internet by the board are also uploaded to the board.
The customized IoT board is interfaced with the write application programming interfacing (API) key of the cloud server; this API key is also uploaded to the board.
Figure 8a illustrates the DO value of the fishpond, in which the value is recorded at 3 mg/L and, by verifying these values with the standard value (>4 mg/L), the health of the fishpond is good. The customized board stops communicating the data if the sensor values are unchanged for a time interval of 20 min and it starts communicating the data again after a time interval of 20 min as shown in
Figure 8a.
Figure 8b illustrates the pH value of the fishpond, in which the value is recorded at 5, and by verifying these values with the standard value (7.5–8.5), the pH value is normal. The values are visualized for 10 min and then the values stop visualizing on field label 2 for 20 min as per the discussion above.
Figure 8c illustrates the turbidity value of the fishpond, in which the value is recorded at 2.5 NTU, and by verifying these values with the standard value (<5 NTU), the turbidity value is normal.
Figure 8d illustrates the salinity value of the fishpond, in which the value is recorded at 0. 4 ppt, and by verifying these values with the standard value (<0.5 ppt), the salinity value is normal. As the value is in decimal form, it is not visualized on field label 4.
Figure 8e illustrates the temperature of the fishpond, in which the value is recorded at 25 °C and by verifying these values with the standard value, the temperature is normal.
Table 1 illustrates th4 current consumption of the customized IoT device. In the table, the current consumption of every component is included. The total current consumptions of customized IoT devices are 10.18982 A. The devices are powered with an external power supply and battery power supply. Battery power is used here when the external power is absent. The current will be consumed when the device is in a working state. The calculation of battery is loaded into the customized IoT hardware during firmware development. The customized IoT hardware will transfer information about the remaining battery life to the Android application via wireless connectivity and a cloud server. As the lifetime of the battery is displayed on the Android application, it alerts the authorities to replace the battery. In addition to this, as the devices are powered with an external power supply, the issue of battery replacement is minimal to the authorities.
- (b)
Comparative analysis
Nistah et al. have suggested the IoT-enabled framework using multivariate statistical analysis for spreading awareness among the aquaculture communities to build a relationship between the response variable and aid society in a way that could also aid aqua-farmers in their commercial endeavors [
41]. Chao, H. C., et al. have suggested a method to conserve the user’s time and energy by automatically monitoring the water level and fish fed controlling, as well as feeding times [
42]. With the aid of this technology, preventative steps in a timely manner can reduce accidents and boost production. Tseng, S. P., et al. have suggested an application of sensors and wireless-based IoT for sustainable aquaculture systems [
43]. The IoT-based water quality is provided additionally with aqua farming strategies by authors in [
44,
45]. An extremely profitable aquaculture system that is capable of surveillance, IoT control, abnormalities awareness, carbon emission reduction, and sustainable energy is suggested by authors in [
46,
47]. Mostly, these studies are carried out for marine environments. In contrast to these studies, our proposed framework provides the risk of unmanageable surroundings in conventional aqua-farming ponds in the hilly Himalayan region which can reduce human negligence, increasing the likelihood of resilience and fish farming production. In this study, ML is integrated with the framework to analyze the sensor data and geo-spatial data for the identification of any degradation in water quality. The proposed application provides an opportunity for higher officials for the real-time monitoring of the health status of the species.
6. Conclusions
Technology advancement has transformed traditional monitoring into real-time monitoring of the digital environment. Aquafarming is one of the most prominent areas that meets the goal of sustainability in producing healthy food for people all over the world with multiple benefits. However, monitoring aquafarming is crucial in hilly regions such as Uttarakhand state, where the ponds are in undulating areas. The proposed framework means the field officer does not need to travel to the fishpond to monitor the current status. The amalgamation of multiple technologies such as GIS and IoT enable real-time tracking and monitoring of the status of the fishpond in any location. Based on this motivation, this study proposed an architecture in which critical information about the fishes can be visualized in a digital environment without disturbing their environment as well as allowing researchers to track the underwater sediment status. A web-based framework is also developed, in which the field officer, district officer, and head of the fishery department can supervise the details and activities of the fishpond. This framework can assist the policymakers in decision-making by enhancing the facilities for the user of the fishpond. Moreover, the ML model will be applied in future work to predict the health of fishpond when compared with its previous health status and suggest necessary feed patterns for the healthy growth of fishes.


 ,
, 


