Article

Experimental Design and Breakthrough Curve Modeling of Fixed-Bed Columns Utilizing a Novel 3D Coconut-Based Polyurethane-Activated Carbon Composite Adsorbent for Lead Sequestration

by
Rubie Mae D. Fernandez
1,2,
Renz John R. Estrada
1,
Tomas Ralph B. Tomon
1,2,
Roger G. Dingcong, Jr.
1,
Ruben F. Amparado, Jr.
2,
Rey Y. Capangpangan
3,
Roberto M. Malaluan
1,4,
Gerard G. Dumancas
5,
Alona A. Lubguban
6,
Arnold C. Alguno
1,7,
Hernando P. Bacosa
1,2 and
Arnold A. Lubguban
1,4,*
1
Center for Sustainable Polymers, MSU-Iligan Institute of Technology, Iligan City 9200, Philippines
2
Environmental Science Graduate Program, Department of Biological Sciences, College of Science and Mathematics, MSU-Iligan Institute of Technology, Iligan City 9200, Philippines
3
Department of Physical Sciences and Mathematics, College of Marine and Allied Sciences, Mindanao State University at Naawan, Naawan 9023, Philippines
4
Department of Chemical Engineering and Technology, MSU-Iligan Institute of Technology, Iligan City 9200, Philippines
5
Department of Chemistry, The University of Scranton, Scranton, PA 18510, USA
6
Department of Mathematics, Statistics, and Computer Studies, Rural High School, University of the Philippines, Paciano Rizal, Bay 4033, Philippines
7
Department of Physics, College of Science and Mathematics, MSU-Iligan Institute of Technology, Iligan City 9200, Philippines
*
Author to whom correspondence should be addressed.
Sustainability 2023, 15(19), 14344; https://doi.org/10.3390/su151914344
Submission received: 2 September 2023 / Revised: 25 September 2023 / Accepted: 27 September 2023 / Published: 28 September 2023
(This article belongs to the Section Sustainable Chemical Engineering and Technology)

Abstract

:
This study presents a novel polyurethane-activated carbon composite (PACC) as an effective and sustainable adsorbent for treating lead-ion-contaminated waters. The PACC was characterized using Scanning Electron Microscopy with Energy Dispersive X-ray (SEM-EDX), Fourier Transform Infrared Spectroscopy (FTIR), Brunauer, Emmett, and Teller (BET) surface area analyzer, X-ray Diffraction (XRD), and Thermogravimetric Analyzer (TGA) to evaluate its physicochemical and thermal properties. Furthermore, the PACC was employed in an experimental column adsorption setup to investigate its adsorption performance and to develop a dynamic method suitable for industrial implementation. Parameters such as bed height (50, 100, 150 mm), flow rate (4, 6, 8 mL min−1), pH (2, 4, 6), and initial metal-ion concentrations (10, 50, 100 mg L−1) were examined. The experimental data exhibited strong agreement with the Thomas and Yoon–Nelson models (R2 ≥ 0.96), indicating efficient adsorption mechanisms. Remarkably, the used adsorbent has the potential for facile regeneration without substantial loss in capacity. The PACC demonstrated excellent adsorption performance for lead ions in aqueous solutions in a fixed-bed column system. Thus, the novel PACC material holds the potential for scalable application in industrial settings to address water pollution challenges, especially in regions with uncontrolled effluent discharge.

1. Introduction

Serious concerns have been raised regarding the environmental pollution caused by heavy metals and their detrimental effects on both human well-being and ecological systems. Multiple sources, including industrial waste, soil leaching, and petroleum products, contribute significantly to the presence of these heavy metals [1]. Lead (Pb) has garnered considerable interest, especially given its extensive application across multiple industrial domains [2]. Drinking water is a primary source of Pb2+ that enters the food web, and as a result, the World Health Organization has established a maximum allowable limit of 48 nmol/L for Pb2+ in drinking water [3]. Exceeding this limit can lead to severe health complications [4]
Various physical and chemical techniques are at our disposal to eliminate contaminants, such as filtration, electrocoagulation, reverse osmosis, precipitation, biosorption, and adsorption. The costs associated with implementing and operating these techniques vary significantly, as does their efficacy in removing contaminants. Adsorption-based methods, in particular, often offer cost advantages in terms of infrastructure and operation, although the efficiency of eliminating the contaminants relies on the properties inherent to the utilized sorbent. Despite the numerous industrial adsorbents available for heavy metal removal in wastewater, there is a growing interest in the advancement of sustainable biosorbents. This interest stems from their renewable abundance and potential for incorporation into composite materials [5].
The utilization of activated carbon (AC) has become popular due to its excellent adsorption performance. However, the effective reusability of AC poses challenges due to the complexity of recovery methods [6]. In many instances, modifications are necessary to enhance the affinity of conventional AC towards specific pollutants. This is because common AC may exhibit limitations in adsorption capacity due to its small specific surface area, elevated ash content, inadequate adsorption selectivity, restricted surface functional groups, and electrochemical properties [7,8]. Additionally, powdered AC tends to disperse in water, resulting in poor recyclability, potential secondary contamination, and cost-intensive operational procedures, rendering it unsuitable for treating high-flux effluents [9].
Alternative materials such as fly ash and biomass have a historical precedent as the foundation for composite adsorbents. Although this method effectively prevents aggregation and yields favorable adsorption outcomes, it is crucial to acknowledge that most of these composite materials exist in powdered form. The use of powdered adsorbents in water treatment encounters practical issues, notably bed cracking and column blockage, especially in column experiments [10]. These issues result in elevated back pressure and decreased operational efficiency. Such limitations diminish the applicability of powdered materials for large-scale water treatment processes [10]. To address these challenges and enhance the viability of wastewater treatment technology, the development of adsorbent structures with three-dimensional (3D) geometries has been proposed [11]. Additionally, the structural deterioration observed within adsorbent bodies after multiple adsorption cycles poses a substantial barrier to long-term operational success [12].
Recognizing these challenges, extensive research has been performed using polyurethane (PU) in heavy metal treatment [13]. PU foam is a promising and cost-effective material that exhibits favorable thermodynamics for sequestering and binding cations, therefore proving successful in the heavy metals and volatile compounds eradication from wastewater and aqueous systems [14]. The manufacturing and shaping of PU adsorbents are relatively straightforward, adding to their appeal [15]. The characteristics of the resulting foam are significantly influenced by the choice of polyol, the key starting material for PU [16]. Although petroleum-based polyols are commonly employed, their limited availability and environmental concerns have spurred investigations into alternative bio-based polyol sources.
In the present study, a novel coconut oil (CO)-based polyurethane foam-activated carbon composite (PACC) is formulated to address reusability, economic, environmental, and sustainability concerns. The process starts with the sequential glycerolysis and amidation of CO to produce bio-based polyol [17]. This polyol was then employed along with AC in a PU formulation to produce a PACC material. Moreover, the produced PACC is designed to exhibit excellent chemical and thermal stability, enhanced accessibility, and cost-effectiveness in production. To assess its performance, the dynamic adsorption behavior of these foams in relation was examined through experiments conducted in a fixed-bed column setup, particularly for Pb2+ sequestration.
In a controlled laboratory setting, a method involving a fixed-bed column was employed to systematically investigate the effects of various operational factors. These factors included bed height, pH levels, influent flow rate, and initial concentration. The aim of this study was to thoroughly evaluate the effectiveness of using PACC as a medium for the process of adsorption [18]. The patterns illustrating the breakthrough of Pb2+ adsorption were additionally evaluated using the Bohart–Adams, Thomas, and Yoon–Nelson models.
This present investigation stands as the initial documented study on the incorporation of AC, derived from coconut shells, into an innovative CO-based PU matrix that possesses a remarkable Pb2+ adsorption efficiency. The results of the adsorption experiments demonstrate that PACC effectively adsorbs Pb2+ ions in water solutions, suggesting its potential for treating lead-contaminated industrial wastewater. This could be particularly beneficial in regions or industries where unregulated wastewater discharge is a major issue and where water quality monitoring plays a vital role in promoting sustainability.

2. Materials and Methods

2.1. Materials

The activated carbon used in this research, sourced from Philippine Japan Active Carbon, was derived from coconut shells. To ensure uniform particle dimensions, the AC underwent comminution and passed through a 50-mesh sieve. The lead (II) nitrate (Pb(NO3)2) of analytical grade, surfactant (INV® 690), and catalyst (Polycat® 8) were acquired from Sigma-Aldrich Chemicals in Taguig, Philippines. The polyol part was created by blending a combination of polyol sourced from coconut oil and a portion of polyol derived from petroleum (namely Voranol® 4701, categorized as a polyether polyol). To this mixture, a stabilizing agent and a dispersant in the shape of silicon oil were added, along with methylene diphenyl diisocyanate (MDI, also known as PAPI 135 SH).

2.2. Polyol Synthesis

The polyol derived from coconut oil was synthesized through a sequential two-stage procedure. Initially, coconut triglycerides were disintegrated into individual acylglycerol constituents via glycerolysis (220 °C, 2 h) under constant stirring [17]. This was followed by an amidation step (140 °C, 3 h). Following the synthesis process, the resultant polyol was given time to cool down to ambient room temperature and then carefully placed and stored within a glass container that was securely sealed to prevent any external contamination.

2.3. Preparation of the Adsorbate Solution

A standard solution containing Pb2+ at 1000 ppm was formulated by dissolving 1.598 g of Pb(NO3)2 in 1000 mL of distilled water. The resulting solution was then transferred into a glass container to ensure safe storage. The necessary concentrations for this study were achieved through sequential dilution of the initial stock solution (ranging from 0 to 150 ppm). The adsorption experiments were conducted using the resulting solutions with varying Pb2+ concentrations.

2.4. Polyurethane Foam-Activated Carbon Composite Formulation

The laboratory procedure for PU foams entailed combining the A-side component (MDI) with the B-side components (polyol and formulation additives). To achieve this, the appropriate quantities of polyols, INV 690, silicon oil, Polycat 8 (B-side), as well as activated carbon and abaca fiber (fillers), were vigorously mixed using a mechanical stirrer in a paper cup. Following this, MDI (A-side) was added to the B-side with the fillers and agitated vigorously for 10 s. The obtained mixture was then left uninterrupted to allow the PU to expand in the open mold and rise vertically. After expansion, the foam was put in a preheated oven at 60 °C for a duration of two hours. The detailed formulation for the preparation of the PU foam samples is provided in Table 1. The quantities of each additive were determined based on a ratio of 100 parts by weight relative to the total polyol components. The isocyanate index for the foam is 100.
Following the curing procedure, the foam specimens were allowed to stand undisturbed overnight before being sectioned into cubes with 0.5 × 0.5 × 0.5 cm dimensions for subsequent testing.

2.5. Characterization

The analysis of surface morphology for both the untreated polyurethane (PU) and polyurethane with activated carbon (PACC) samples was conducted by utilizing a scanning electron microscope (SEM) (JSM-6510LA Analytical Scanning Electron Microscope, Tokyo, Japan). The determination of the open-cell content (OCC) was carried out utilizing a nitrogen pycnometer (ULTRAPYC 1200e Automatic Density Analyzer, Boynton Beach, FL, USA). The surface area and pore size of the composite material were measured with a surface area analyzer (Microtrac BELSORP MINI X, Osaka, Japan). To discern the functional groups present in the composite, Fourier Transform Infrared (FTIR) spectroscopy was employed (Shimadzu FTIR-ATR IR Tracer-100, Tokyo, Japan) across a spectral range of 4000–400 cm−1. Thermal degradation analysis was executed through Thermogravimetric Analysis (TGA) in a nitrogen atmosphere, employing a Shimadzu DTG 60H instrument (Tokyo, Japan), with a constant flow rate of 20 mL min−1 and a temperature increment of 10 °C per minute. The pH values were determined using a digital pH meter (KEM AT-710, Kyoto, Japan). X-ray Diffraction (XRD) patterns were captured using a Rigaku HR-XRD instrument (SMART Lab, 9 kW power type) equipped with a Cu K-α radiation source (40 kV and 30 mA). The measurements encompassed the range of 3–60 degrees 2θ, and the scanning speed was set at 0.02 degrees 2θ/0.60 s.

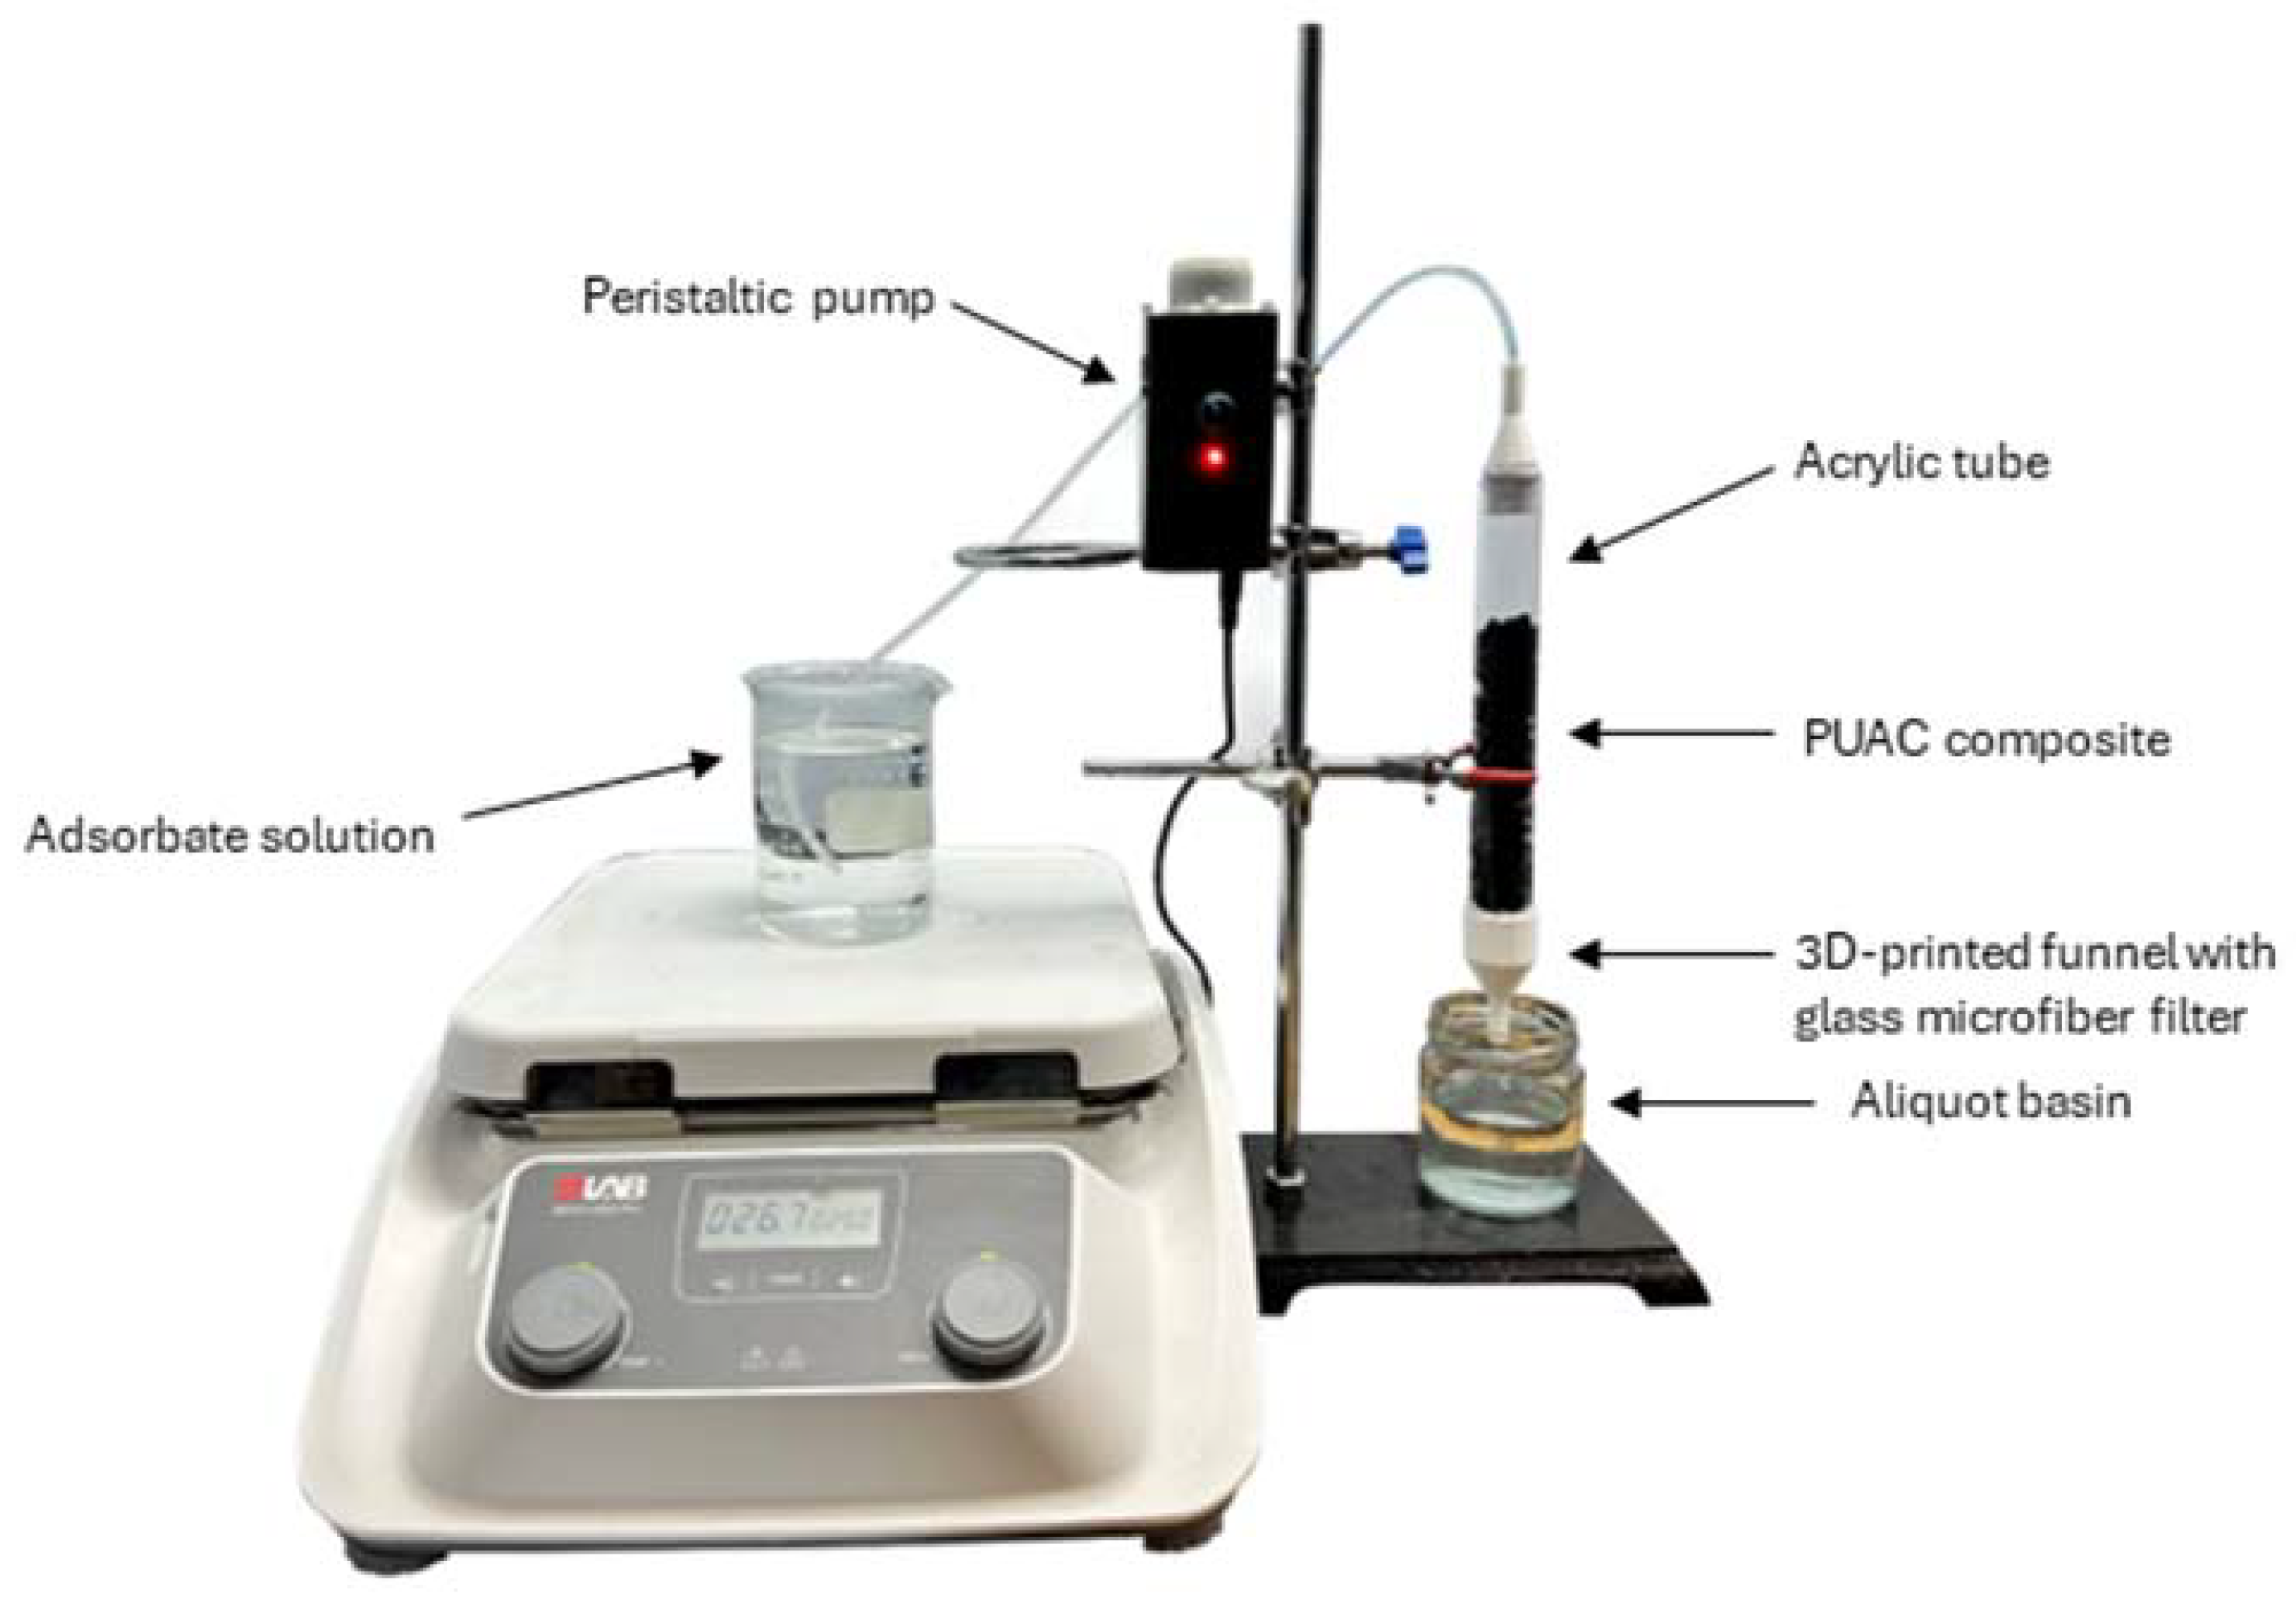
2.6. Column Adsorption Experiment

Figure 1 illustrates the actual fixed-bed column setup. The adsorption trial employed a laboratory-scale continuous experimental arrangement comprising a transparent column measuring 2 cm by 20 cm. The complete procedure was conducted under conditions of ambient temperature. A mass of 1 g of the PACC per centimeter of the column was measured and compacted in alignment with the preferred column height. To guarantee the even distribution of the inlet solution and avert any potential seepage, a specially designed 3D-printed funnel was utilized to provide support for the column on both terminations, as illustrated in Figure 1.
The solution, containing the intended concentration of Pb2+, underwent continuous stirring at a rate of 100 revolutions per minute (rpm) while being transported downward through the apparatus aided by a peristaltic pump. At various time intervals during this process, samples were methodically collected. After this protocol, the concentration of the resultant solution was ascertained using a UV-Vis spectrophotometer (Thermo Fisher Scientific Genesys 10s, Waltam, MA, USA), operating within the wavelength range spanning from 190 nm to 300 nm [19,20].
The main objective of this investigation was to evaluate how altering flow rates and bed heights affect the adsorption of Pb2+ ions. This was accomplished through a sequence of experimental procedures. The experimental configuration was systematically investigated using a range of flow rates (4, 6, and 8 mL min−1), pH values (2, 4, 6), and bed heights (50, 100, and 150 mm), with the other factors being held steady. After determining the most suitable combination of flow rate, pH, and bed height, the impact of varying Pb2+ concentrations on adsorption efficiency was assessed at levels of 10, 50, and 100 mg L−1.
The fixed-bed experiment was conducted until saturation was attained, signifying the cessation of further adsorption of Pb2+ ions. Generating breakthrough curves is a crucial aspect of assessing the efficiency of a fixed-bed column. These graphs are depicted by graphing the ratio of Ct/Co against the elapsed time, t [21].

2.7. Analysis of Data from the Column

In fixed-bed column setups, a breakthrough curve is typically used to measure its effectiveness. Breakthrough curves indicate the total mass adsorbed by the adsorbent, qtotal at specific conditions over time t, as determined by Equation (1):
q t o t a l = Q A 1000 = Q 1000   0 t t o t a l C a d d t
where Q represents the flow rate (expressed in mL min−1), A signifies the area under the curve, t denotes the total duration of the run (measured in minutes), and Cad represents the amount of adsorbed concentration of Pb2+ ions in milligrams per liter (mg L−1).
Equation (2) was employed for the calculation of the maximum metal uptake, denoted as qeq, within the continuous adsorption system. Additionally, Equation (3) was employed to calculate the total volume of effluent, Veff, expressed as follows:
q e q = q t o t a l m
V e f f = Q t t o t a l
where m represents the continuous system’s dry weight.

2.8. Breakthrough Curve Modeling

The behavior of the continuous sorption process can be assessed through breakthrough curves, which illustrate the variation in pollutant concentration in the effluent over time within a fixed-bed column. Mathematical models that rely on these curves are employed to depict and forecast experimental data, serving as valuable tools for optimizing fixed-bed column designs and scaling up the process [22].
The Thomas model is commonly utilized to ascertain the parameters linked with breakthrough curves, and assessing the efficiency of adsorption often serves as an initial stage in the design of a removal system for a fixed-bed column [23].
The determination of parameters, particularly the rate constant indicated as kTh and the maximum adsorption capacity known as qmax, can be accomplished through the utilization of the linear approximation of the Thomas equation, represented by the following equation [24]:
ln ( C 0 C t 1 ) = k T h q T h m Q k T h C 0 t
where kTh represents the Thomas rate constant (measured in L mg−1 min−1); qTh signifies the adsorption capacity (measured in mg g−1); t represents the total flow time (measured in minutes); m is the mass of the adsorbent (measured in grams); and Q indicates the flow rate (measured in mL min−1).
According to the Bohart–Adams model, the adsorption efficiency relies on the properties of both the sorbent and the substance undergoing adsorption [25]. This relationship is mathematically described by the following equation:
ln ( C t C 0 ) = k A B C 0 t k A B N 0 Z U 0
where kAB signifies the Bohart–Adams rate constant (measured in L mg−1 min−1); N0 represents the saturation concentration (measured in mg L−1); t signifies the flow time (measured in minutes); Z denotes the bed height (measured in centimeters); and U0 indicates the superficial velocity (measured in cm min−1).
Conversely, the Yoon–Nelson model is based on the concept of diminishing adsorption probability [21]. In prior research, the Yoon–Nelson model has been mathematically formulated in a linearized manner for the analysis of individual systems [26,27]:
ln ( C t C 0 C t ) = k Y N t τ k Y N
where kYN for the Yoon–Nelson rate constant (measured in min−1); τ represents the time required for 50% breakthrough of the adsorbate (measured in minutes); and t signifies the breakthrough time.

3. Results and Discussion

3.1. Adsorbent Characterization

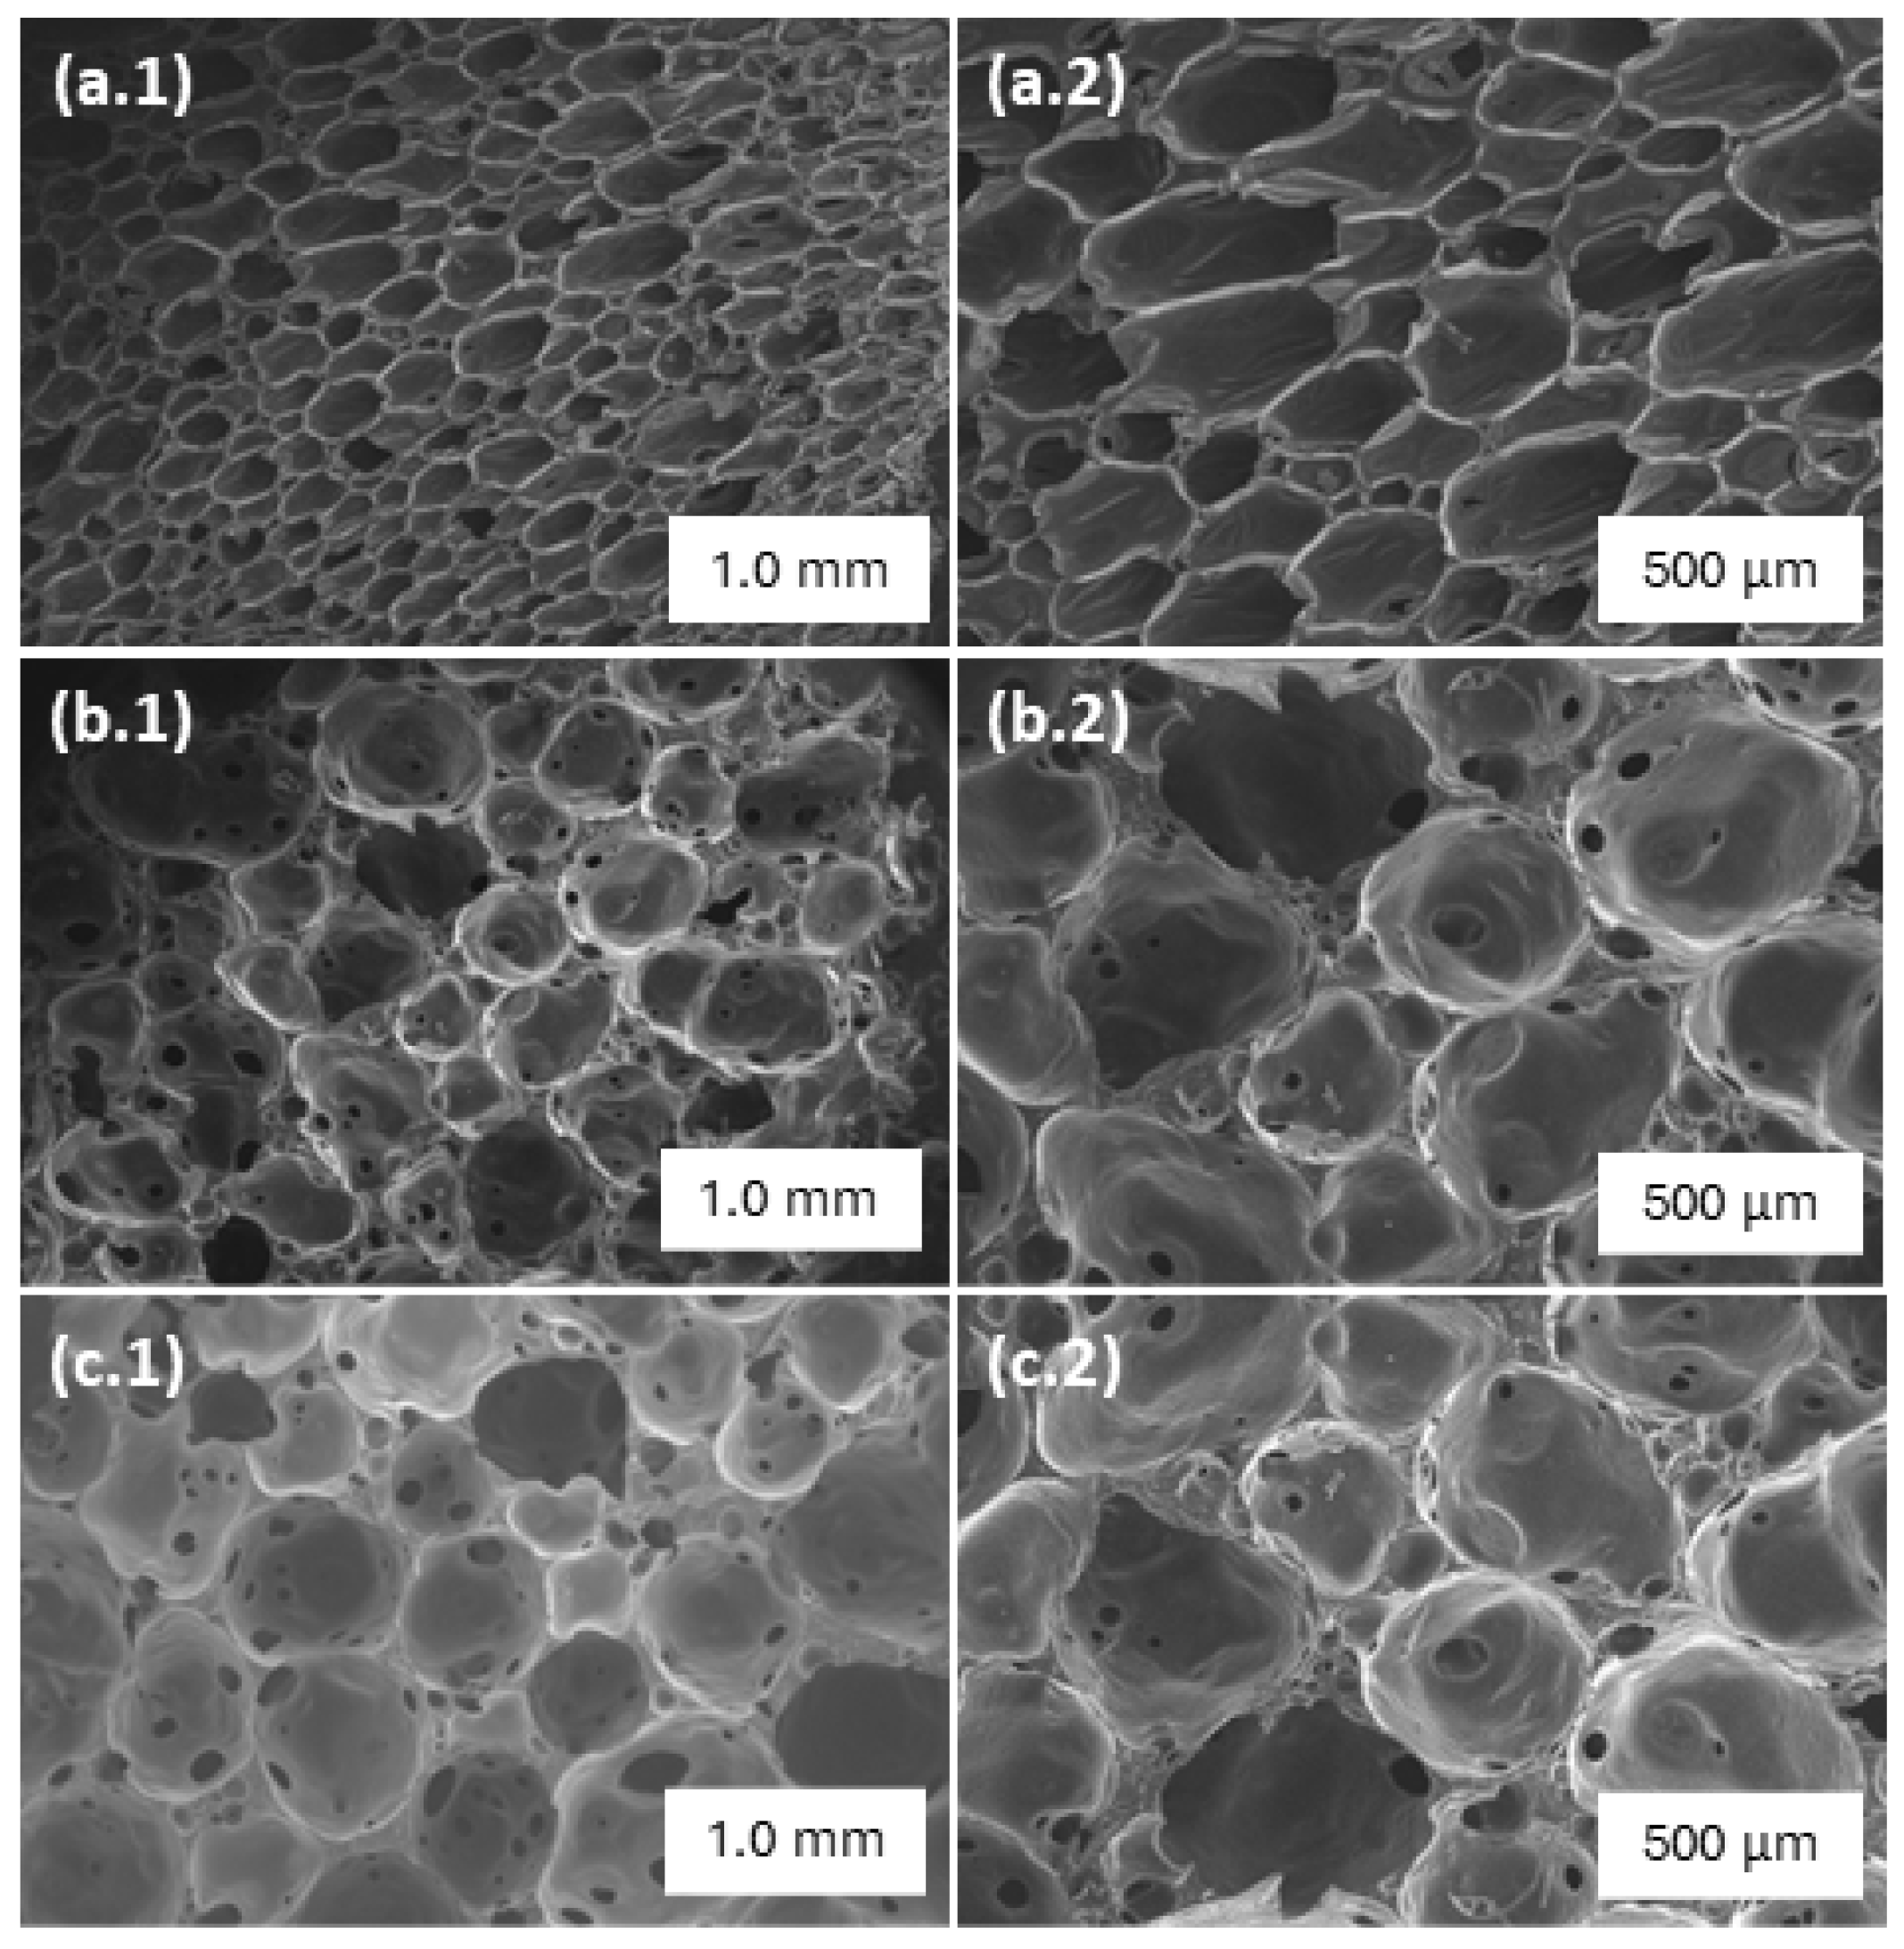
3.1.1. SEM-EDX Analysis

This study involved the examination of the surface structure and morphology of the PACC adsorbent by utilizing scanning electron microscopy (SEM). Figure 2 displays SEM images revealing the morphological structures of the blank PU foam and the PACC before and after subjecting to adsorption. It can be observed that the PACC exhibited a more distinct open-cell structure compared to the blank PU foam. This observation is verified with the pycnometric analysis that resulted in a higher PACC open-cell content of 88% compared to the 75% open-cell content of blank PU. Moreover, the microphotographs of PACC as shown in Figure 2(b.1,b.2) reveal larger cell sizes compared to the blank PU’s microphotographs in Figure 2(a.1,a.2). In the lens of PACC’s potential as Pb2+ adsorbent, these observations could further translate to the enhancement of PACC’s ability for Pb2+ sequestration [28]. The inclusion of larger open-cell matrices in the composite foam enhances the accessibility of Pb2+ to the PACC adsorbent [29]. Furthermore, the presence of numerous small channels in the open-cell design of the PACC foam is advantageous, as it facilitates the rapid dispersion of Pb2+ across the surface. Moreover, the substantial porosity of the material establishes an interconnected three-dimensional (3D) environment, providing accessibility and ample storage capacity for Pb2+ [29]. As shown in Figure 2(c.1,c.2), the microphotographs of PACC after subjecting to Pb2+ adsorption revealed no significant physical changes as compared to the microphotographs of unused PACC in Figure 2(b.1,b.2). These findings demonstrate the structural durability and stability of PACC during its employment for Pb2+ adsorption.
Table 2 presents the elemental composition analysis of blank PU and PACC using EDX. After the integration of activated carbon (AC) into the polyurethane (PU) matrix, there was an observed rise in carbon content by 1.85% and oxygen content by 9.87%. Conversely, the nitrogen content displayed a relative decrease of 2.00%. Enhanced levels of O/C and (O + N)/C values correspond to an increased degree of negative polarity in the material [30]. As presented in Table 2, PACC demonstrates notably elevated O/C ratio and (O + N)/C ratios of 35.55% and 17.65%, respectively, in comparison to the blank PU. This finding implies the creation of a higher number of sorption sites within PACC, which enhances its potential for the sequestration of Pb2+ ions. These observed variations in composition can be attributed to the intrinsic hydroxyl groups in AC, resulting in an enhanced oxygen concentration in the PACC. PACC exhibits a significant presence of oxygen-containing functional groups, which have been previously reported to facilitate the adsorption of Pb2+ [31]. After the adsorption process, the O/C ratio and (O + N)/C ratios experienced a reduction of 37.70% and 31.25%, respectively. This is ascribed to the depolarization of the participating amino and oxygen-containing groups during their interaction with Pb2+, therefore reducing the PACC’s negative polarity during the Pb2+ adsorption process [32]. Thus, this observation relates to the successful interaction of Pb2+ to the PACC’s active sorption sites.

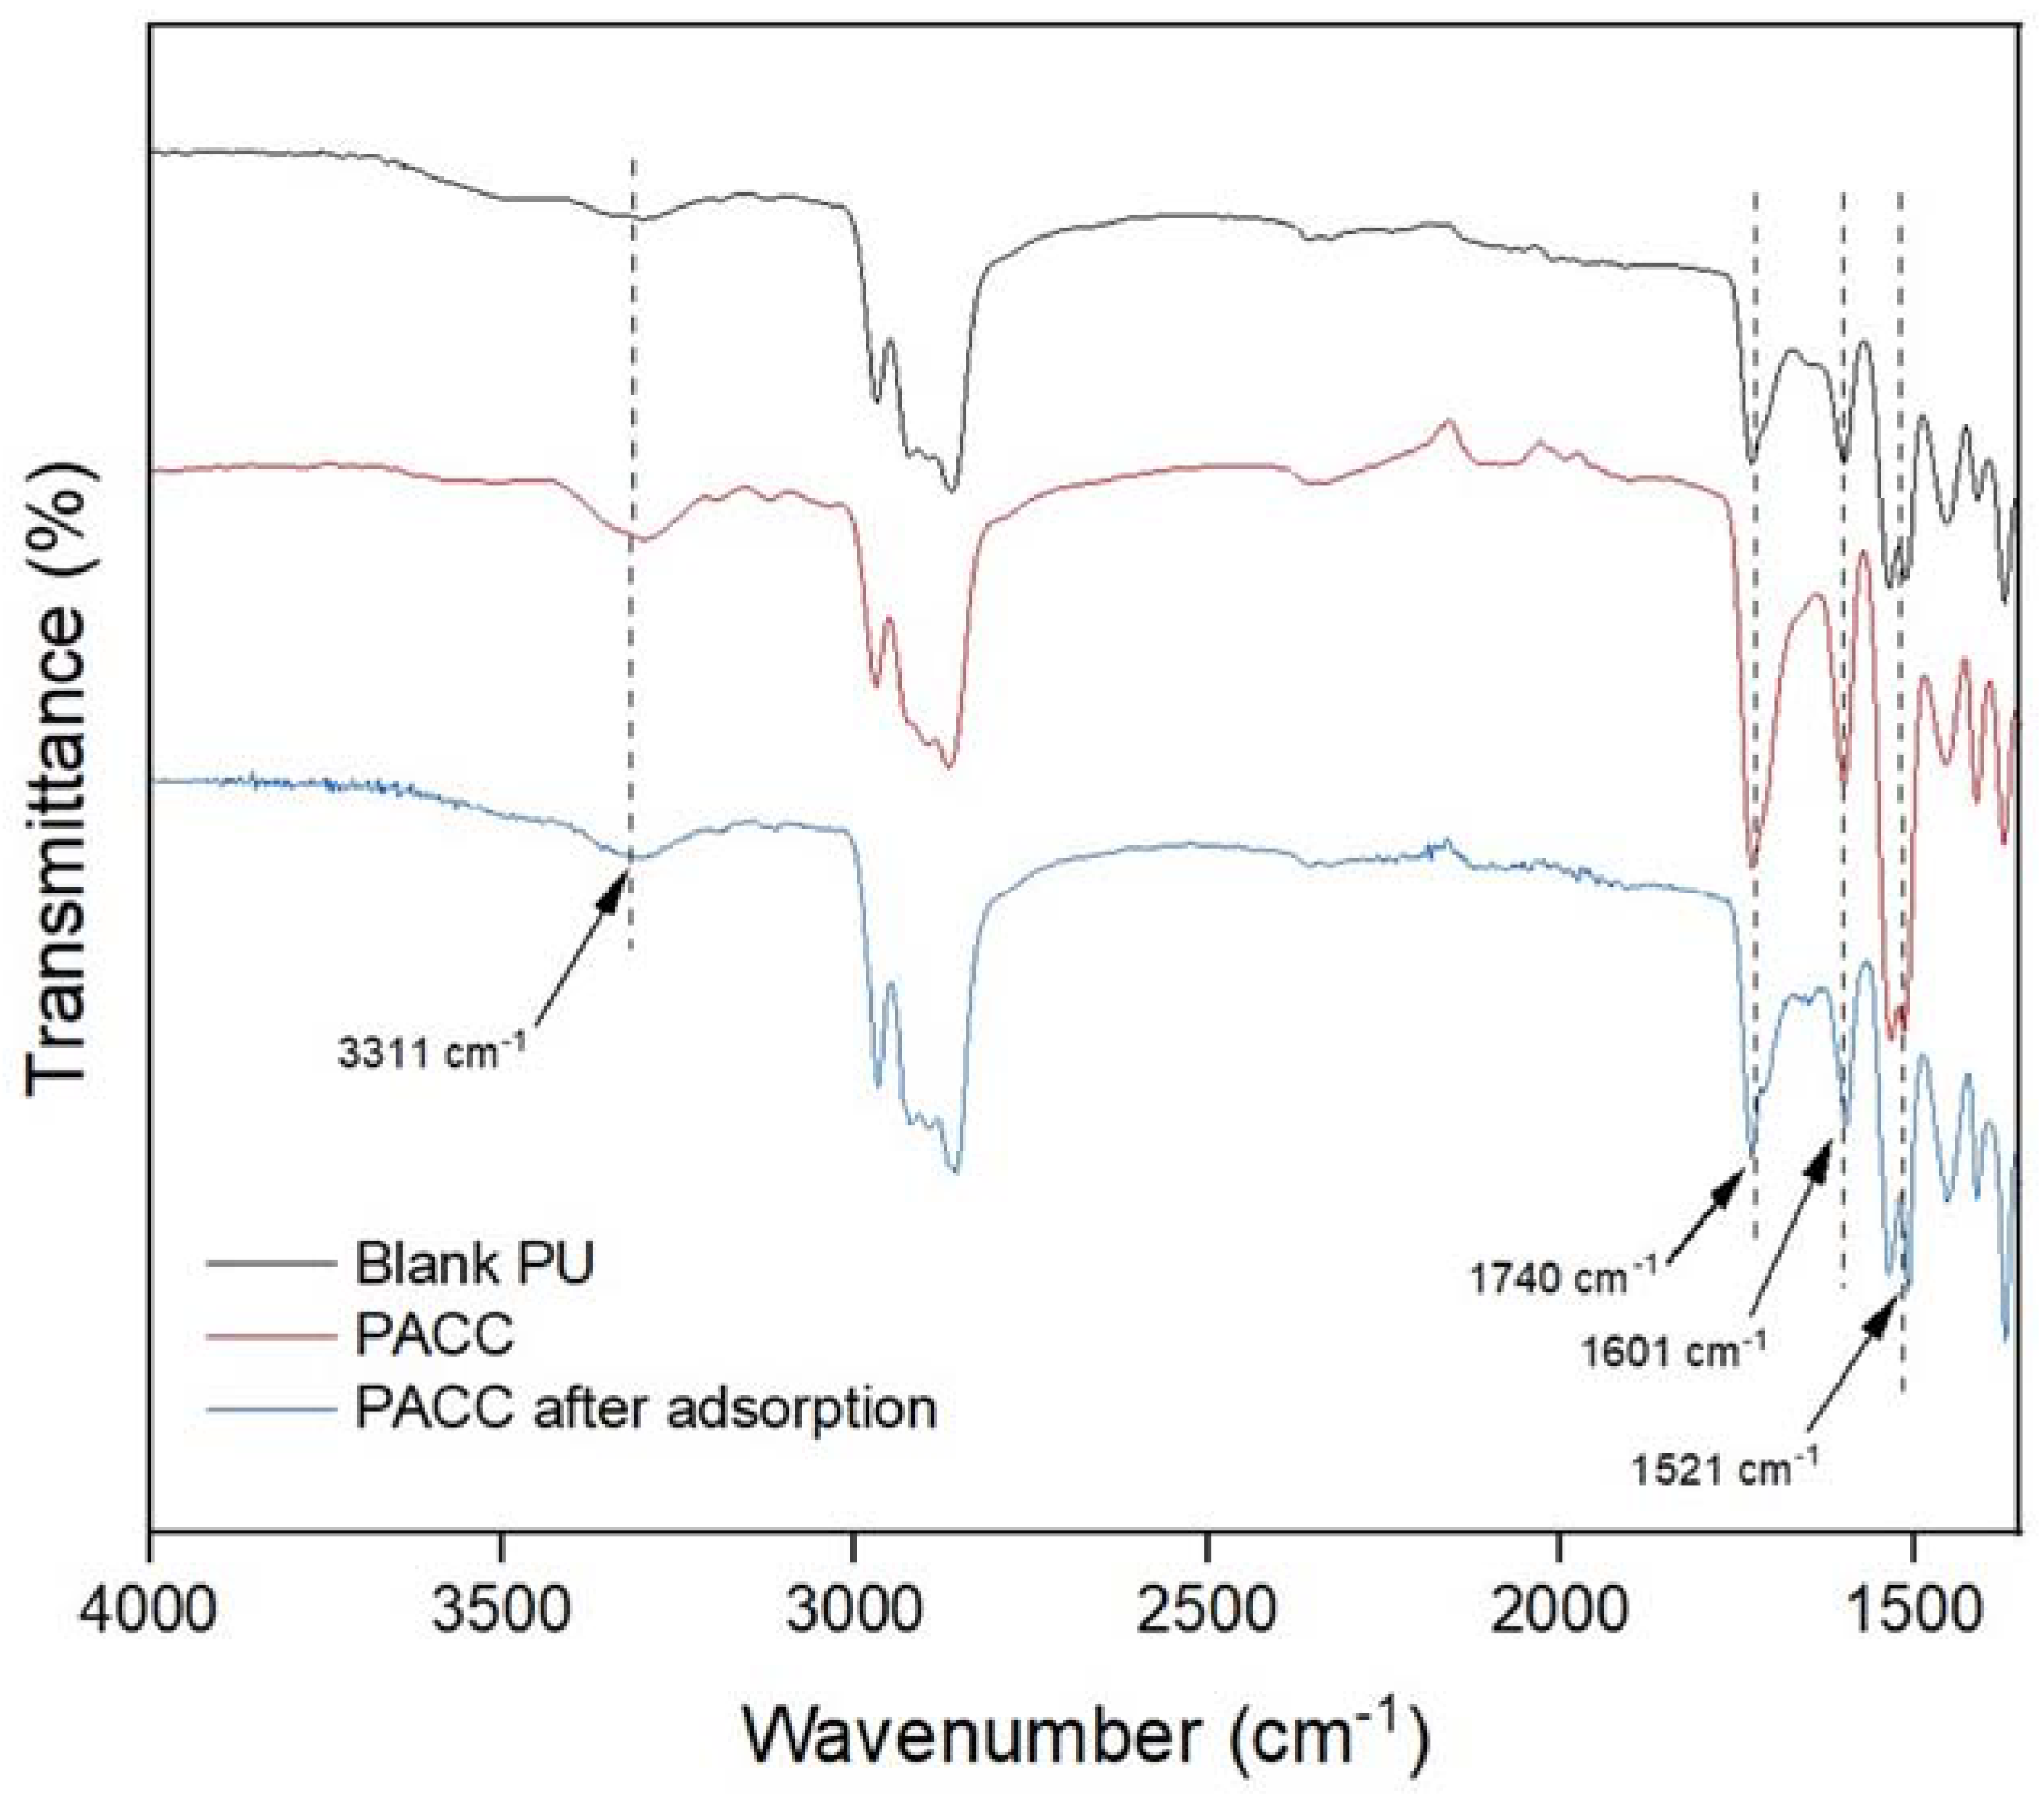
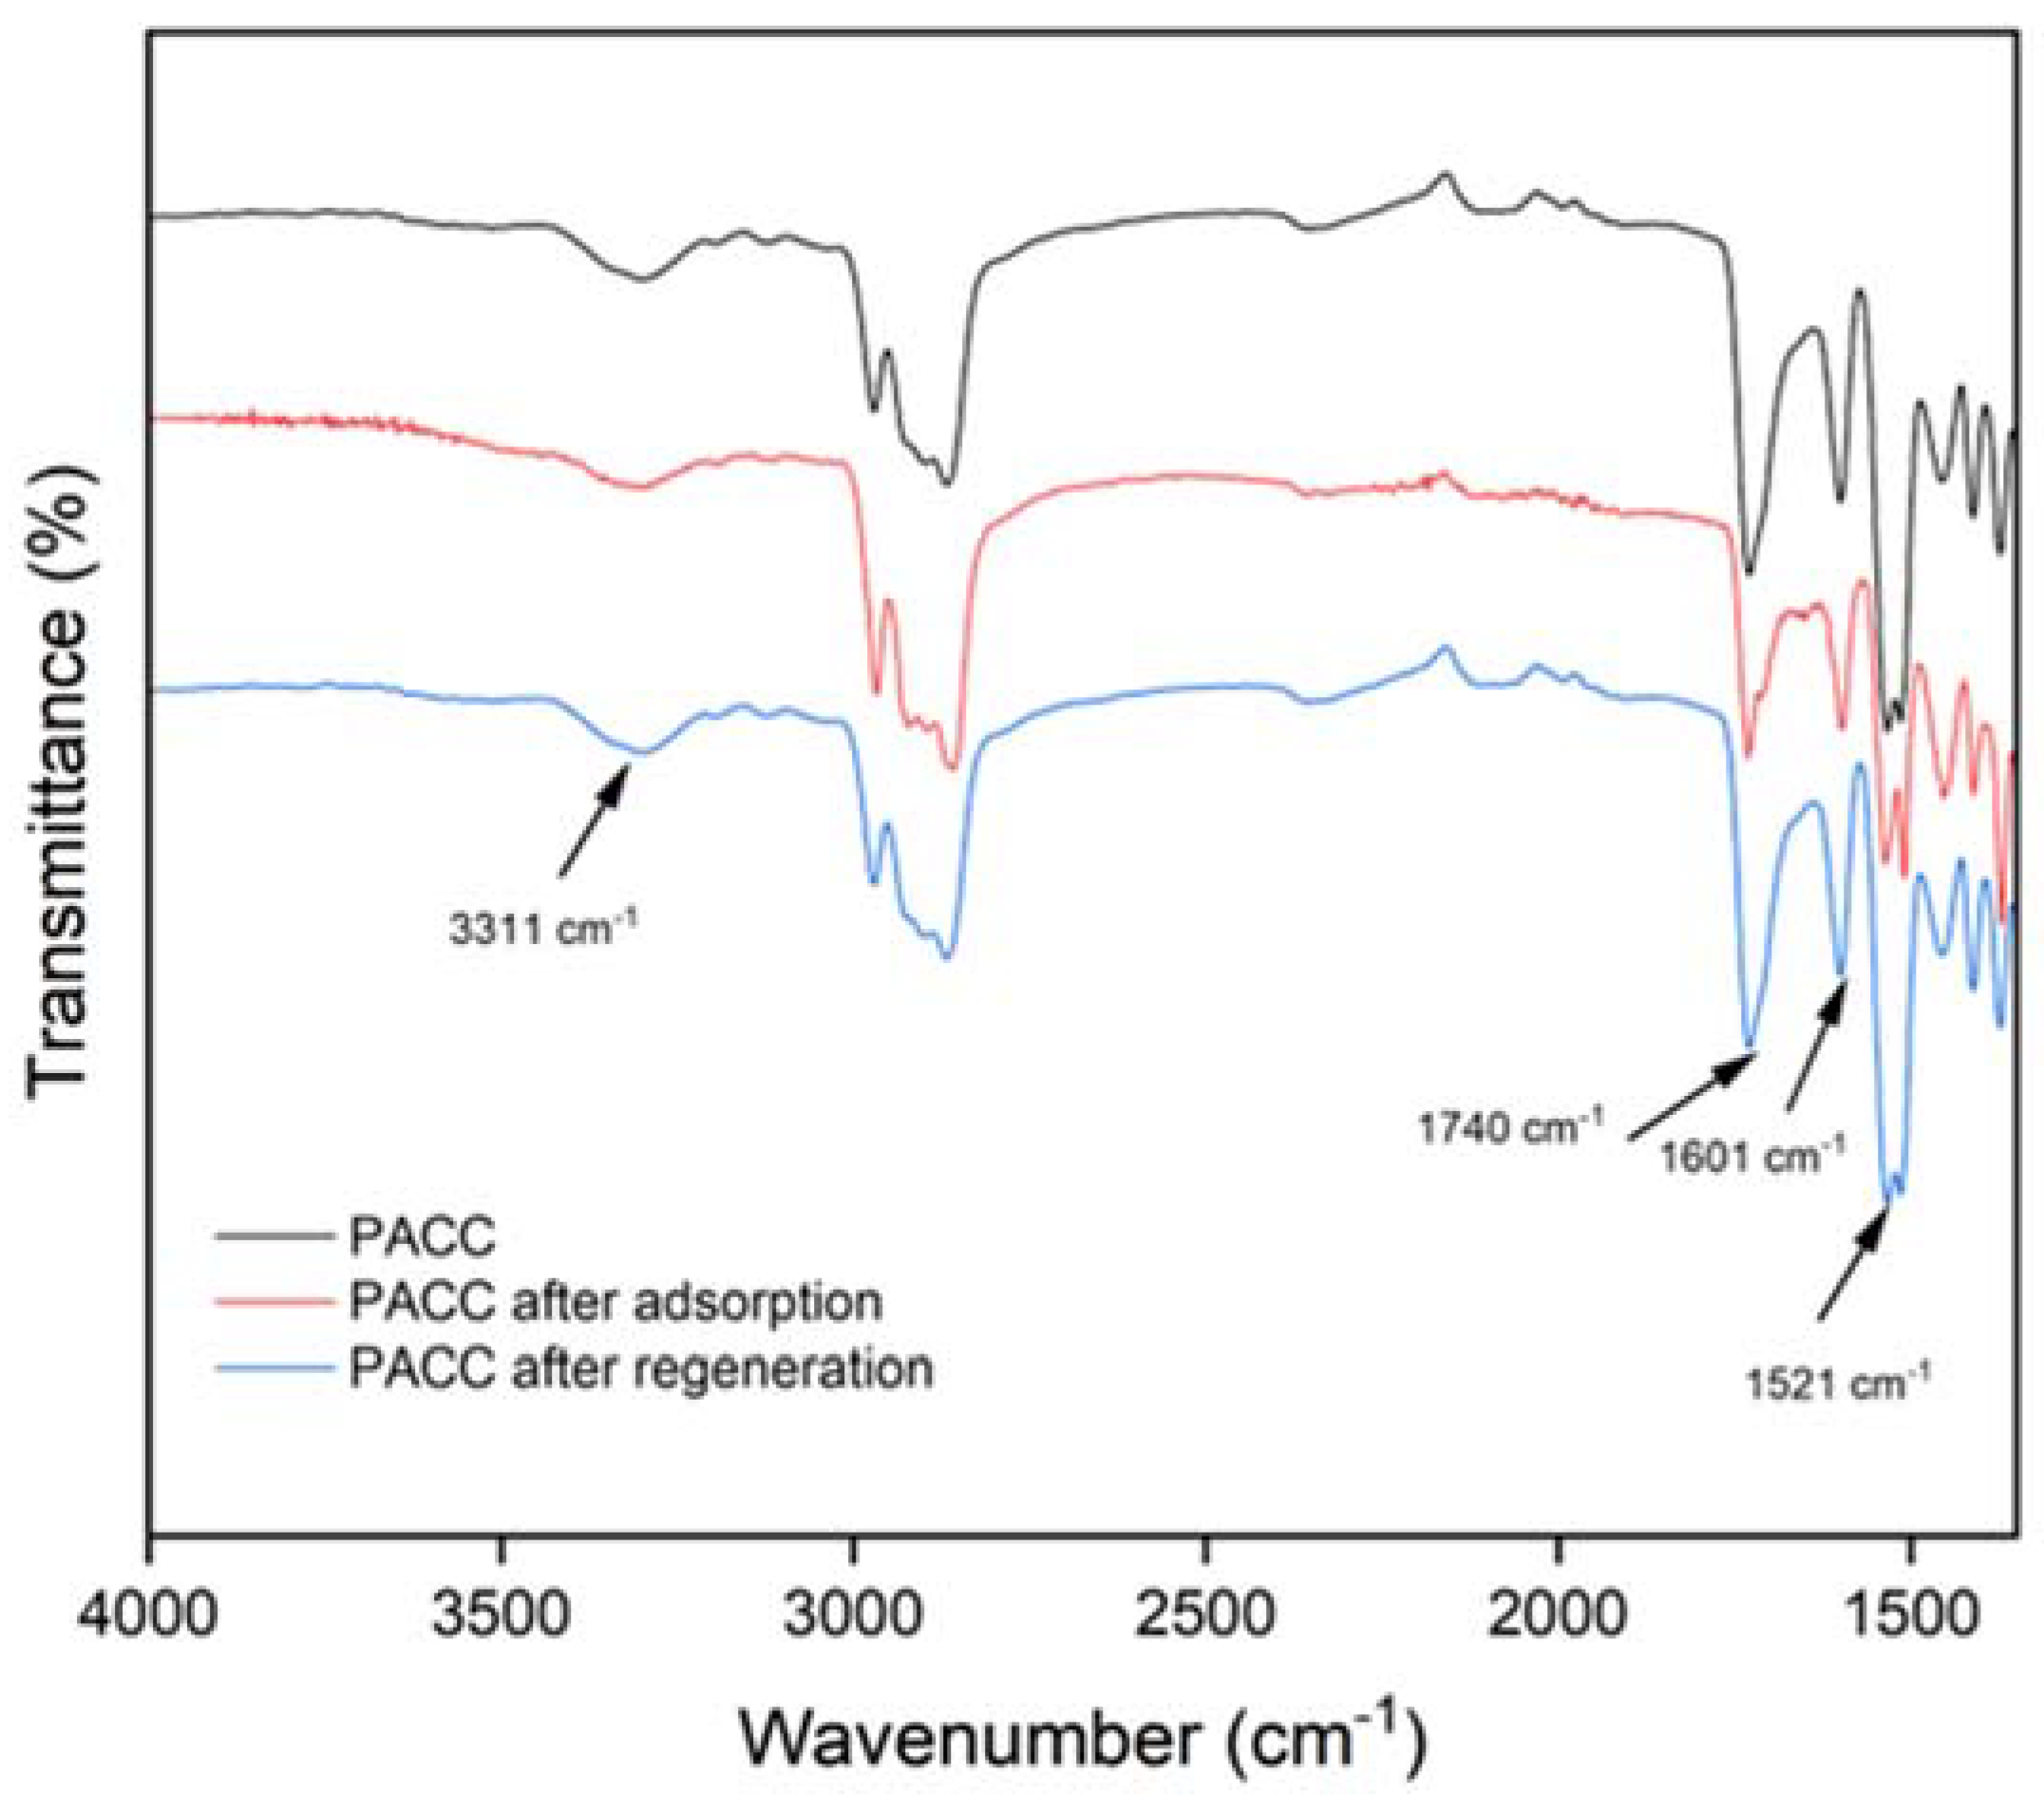
3.1.2. FTIR Analysis

In addition to their physical characteristics, the adsorption capacity of PU and AC can also be influenced by their chemical composition. Although the porous structure is important, the chemical structural attributes of these materials (i.e., their functional groups) can also have an impact on their adsorption capacities [32,33]. FTIR spectroscopy was used to analyze the chemical characteristics of PU and PACC adsorbent foams, as illustrated in Figure 3. The significant peak at 3311 cm−1 is associated with the O-H bonds present in the foam samples. Additionally, the heightened intensity of the peak at 3311 cm−1 in PACC is ascribed to the inherent OH (hydroxyl) groups existing in its AC constituent. This suggests that PACC harbors a greater abundance of OH groups compared to the blank PU, consequently manifesting a more negatively polar chemical structure. Furthermore, the identified peak at 1740 cm−1 is associated with the stretching vibrations of C=O, which are linked to the urethane component within the foam samples [34]. The peaks at 1601 cm−1 correspond to the bending vibrations of C=O, which can be linked to the urethane components, and the stretching vibrations of C-O in carboxylic acids present on the AC surfaces [35]. The peaks at 1521 cm−1 correspond to the bending of N-H and the stretching vibrations of C=O, which can be ascribed to the existence of urethane bonds and carboxyl groups within the PACC matrices. It is worth highlighting that the significant increase in the mentioned peaks found in PACC compared to the blank PU can be attributed to the presence of AC in the PACC matrix. Furthermore, the observed reduction of the oxygen- and nitrogen-related peaks on the FTIR spectrum of PACC after adsorption reveals the reduction of functional sites, as indicated by the peak intensity reductions found at 3311 cm−1, 1740 cm−1, 1601 cm−1, 1521 cm−1, due to the interaction of Pb2+ ions. These observations agree with other research on the role of these peaks in the reaction with Pb2+ [2,36].

3.1.3. Surface Area Analysis
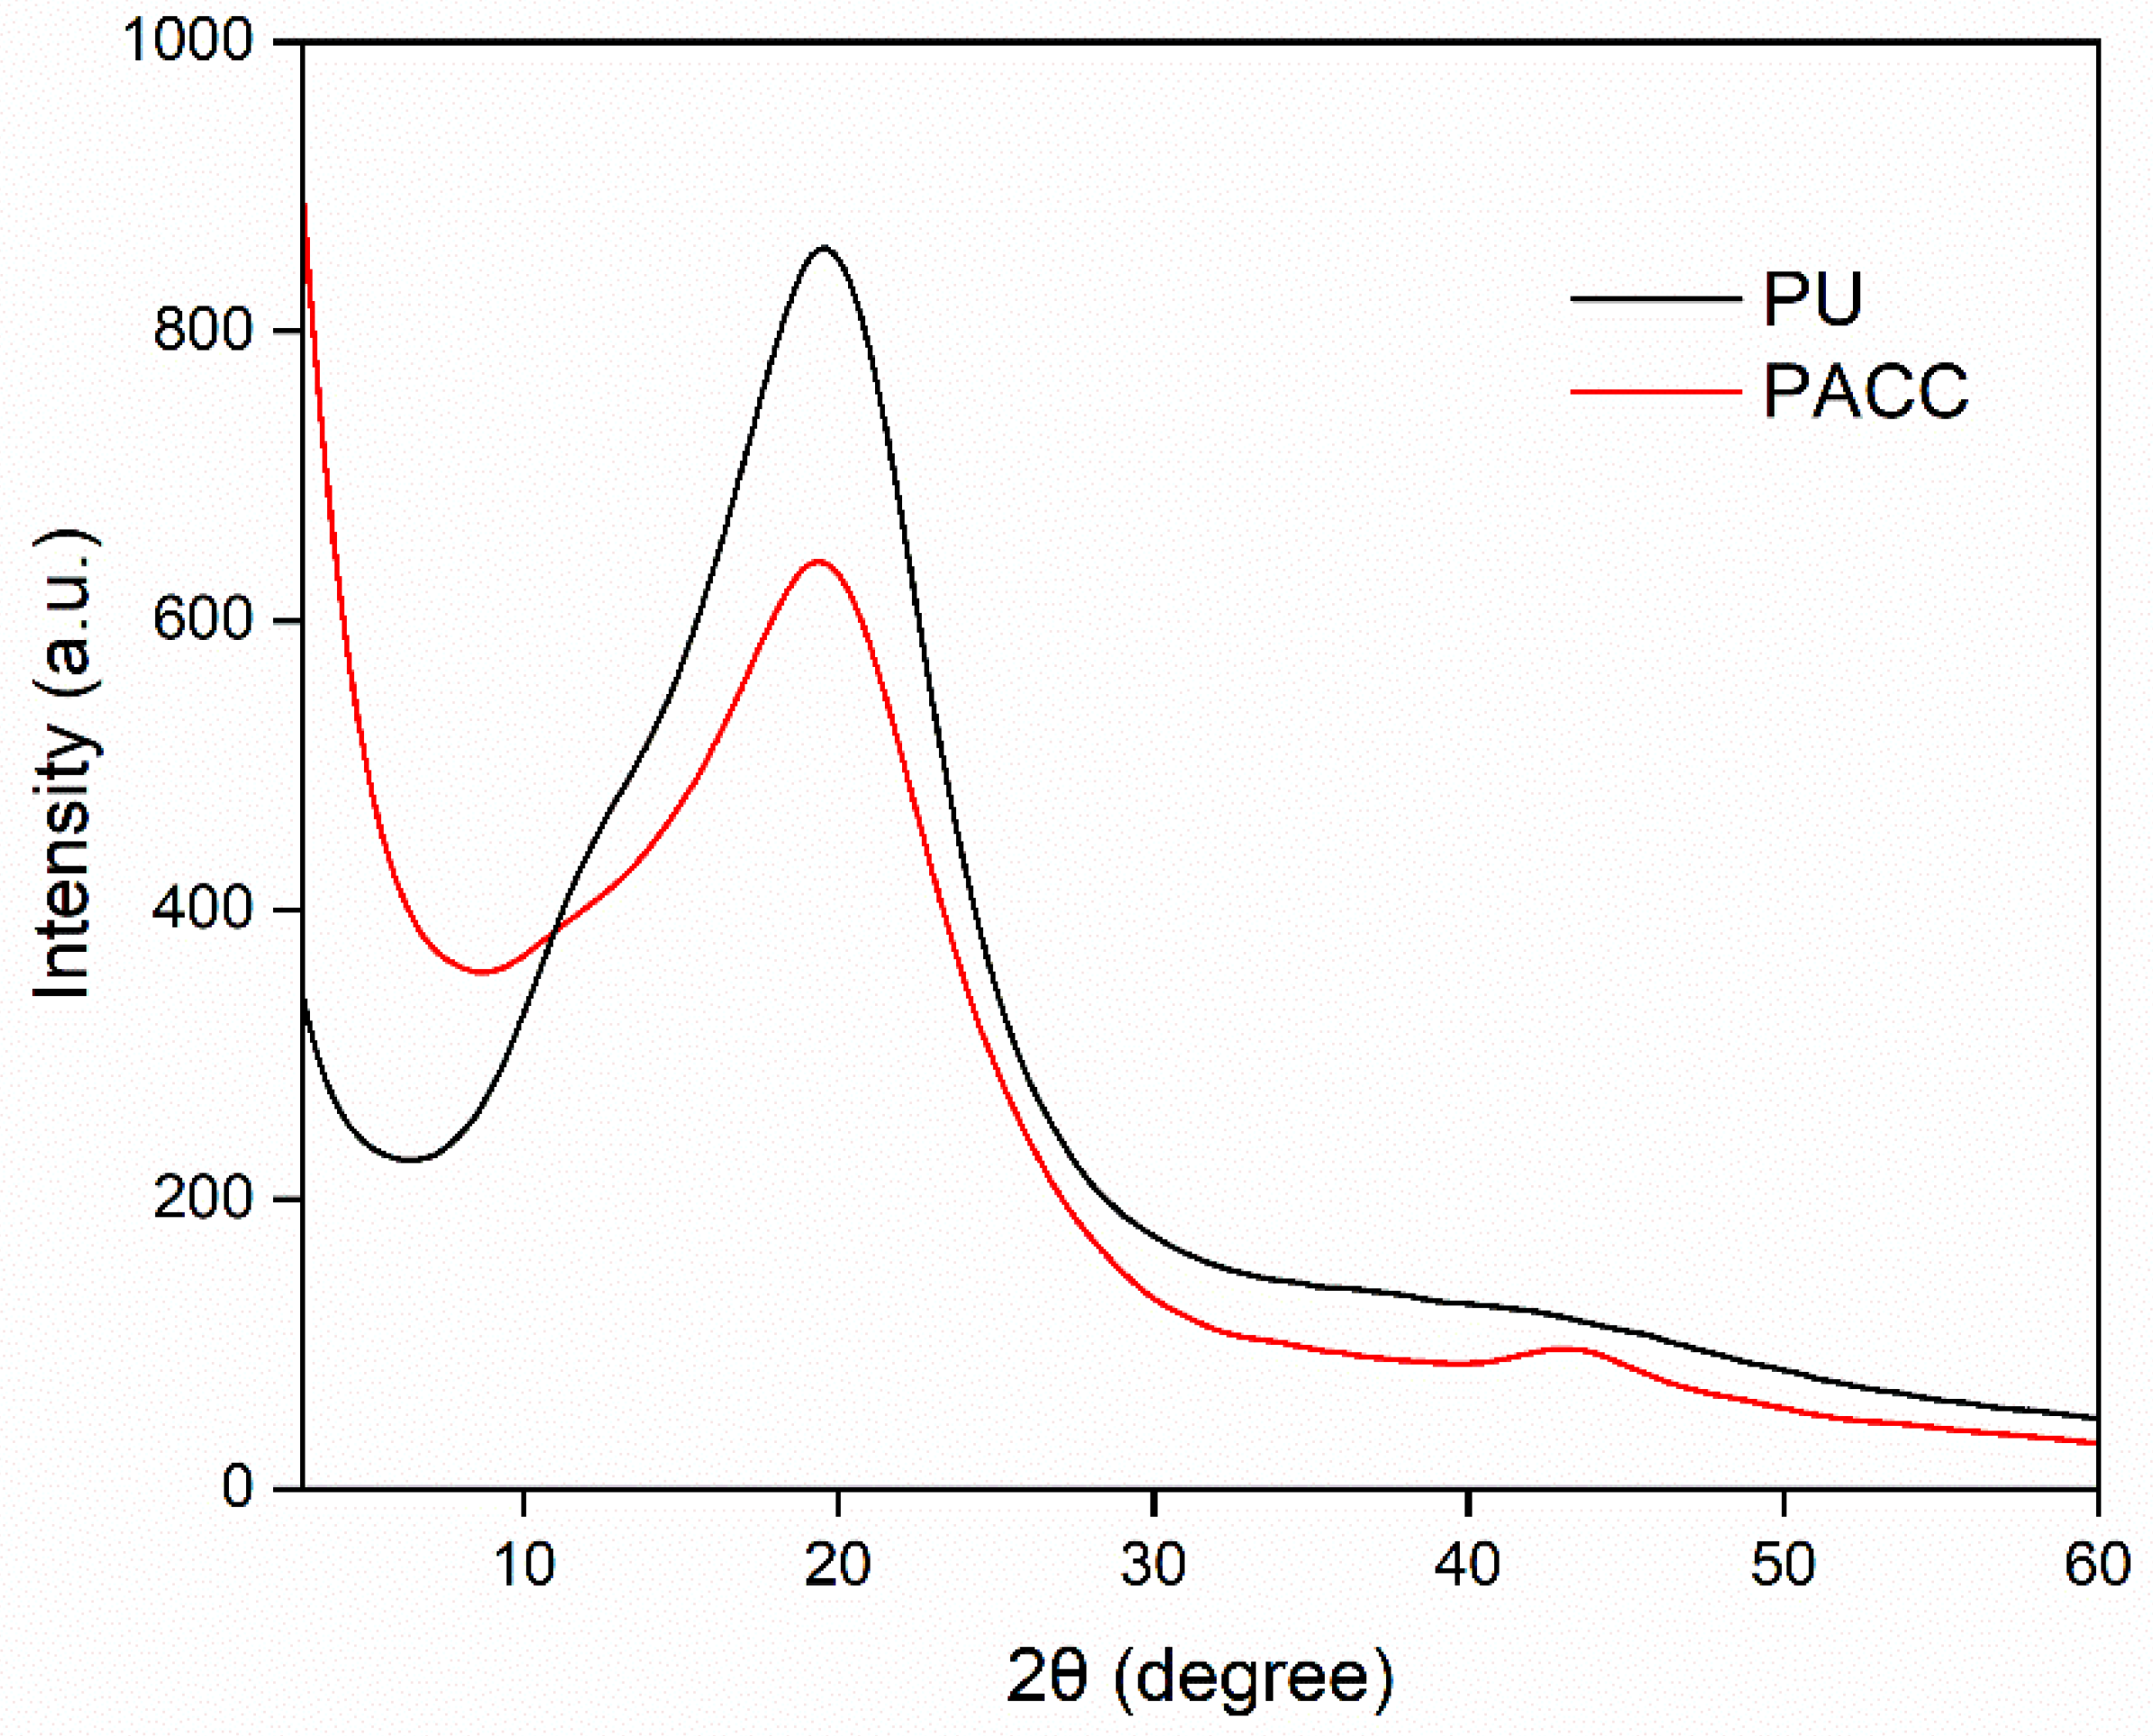
The textural characteristics of both blank PU and PACC, encompassing specific surface area and pore dimensions, were examined utilizing a surface area analyzer via nitrogen adsorption-desorption isotherms. The outcomes unveiled that the Brunauer–Emmett–Teller (BET) surface area of PU, quantified at 1.1817 m2 g−1, exhibited a notable disparity in comparison to PACC before adsorption, which demonstrated a measurement of 10.8949 m2 g−1. This discrepancy underscores that the integration of activated carbon into the PU matrix prompted a substantial upsurge In surface area, approximately ten-fold, therefore yielding a plethora of binding sites for effective sequestration of Pb2+. Furthermore, the average pore sizes for PU and PACC were determined as 2.3406 nm and 0.9825 nm, respectively. Reduced pore dimensions lead to an enlarged surface area and an increased surface-to-volume ratio. This phenomenon explains the observed augmentation in the PACC’s surface area [37].

3.1.4. XRD Analysis

Figure 4 portrays the X-ray diffraction (XRD) pattern of both the blank PU and PACC samples. The diffraction patterns exhibit a diffuse and subtle diffraction peak observed at approximately 19° and 43° 2θ angles. These angles correspond to the distinctive diffraction patterns associated with the amorphous carbon structure aligned with the (0 0 2) and (1 0 0) crystallographic planes, respectively [38]. Furthermore, the presence of these peaks at a subdued intensity implies a limited extent of graphitization, therefore implying the presence of a carbonaceous structure with relatively low crystallinity [39].

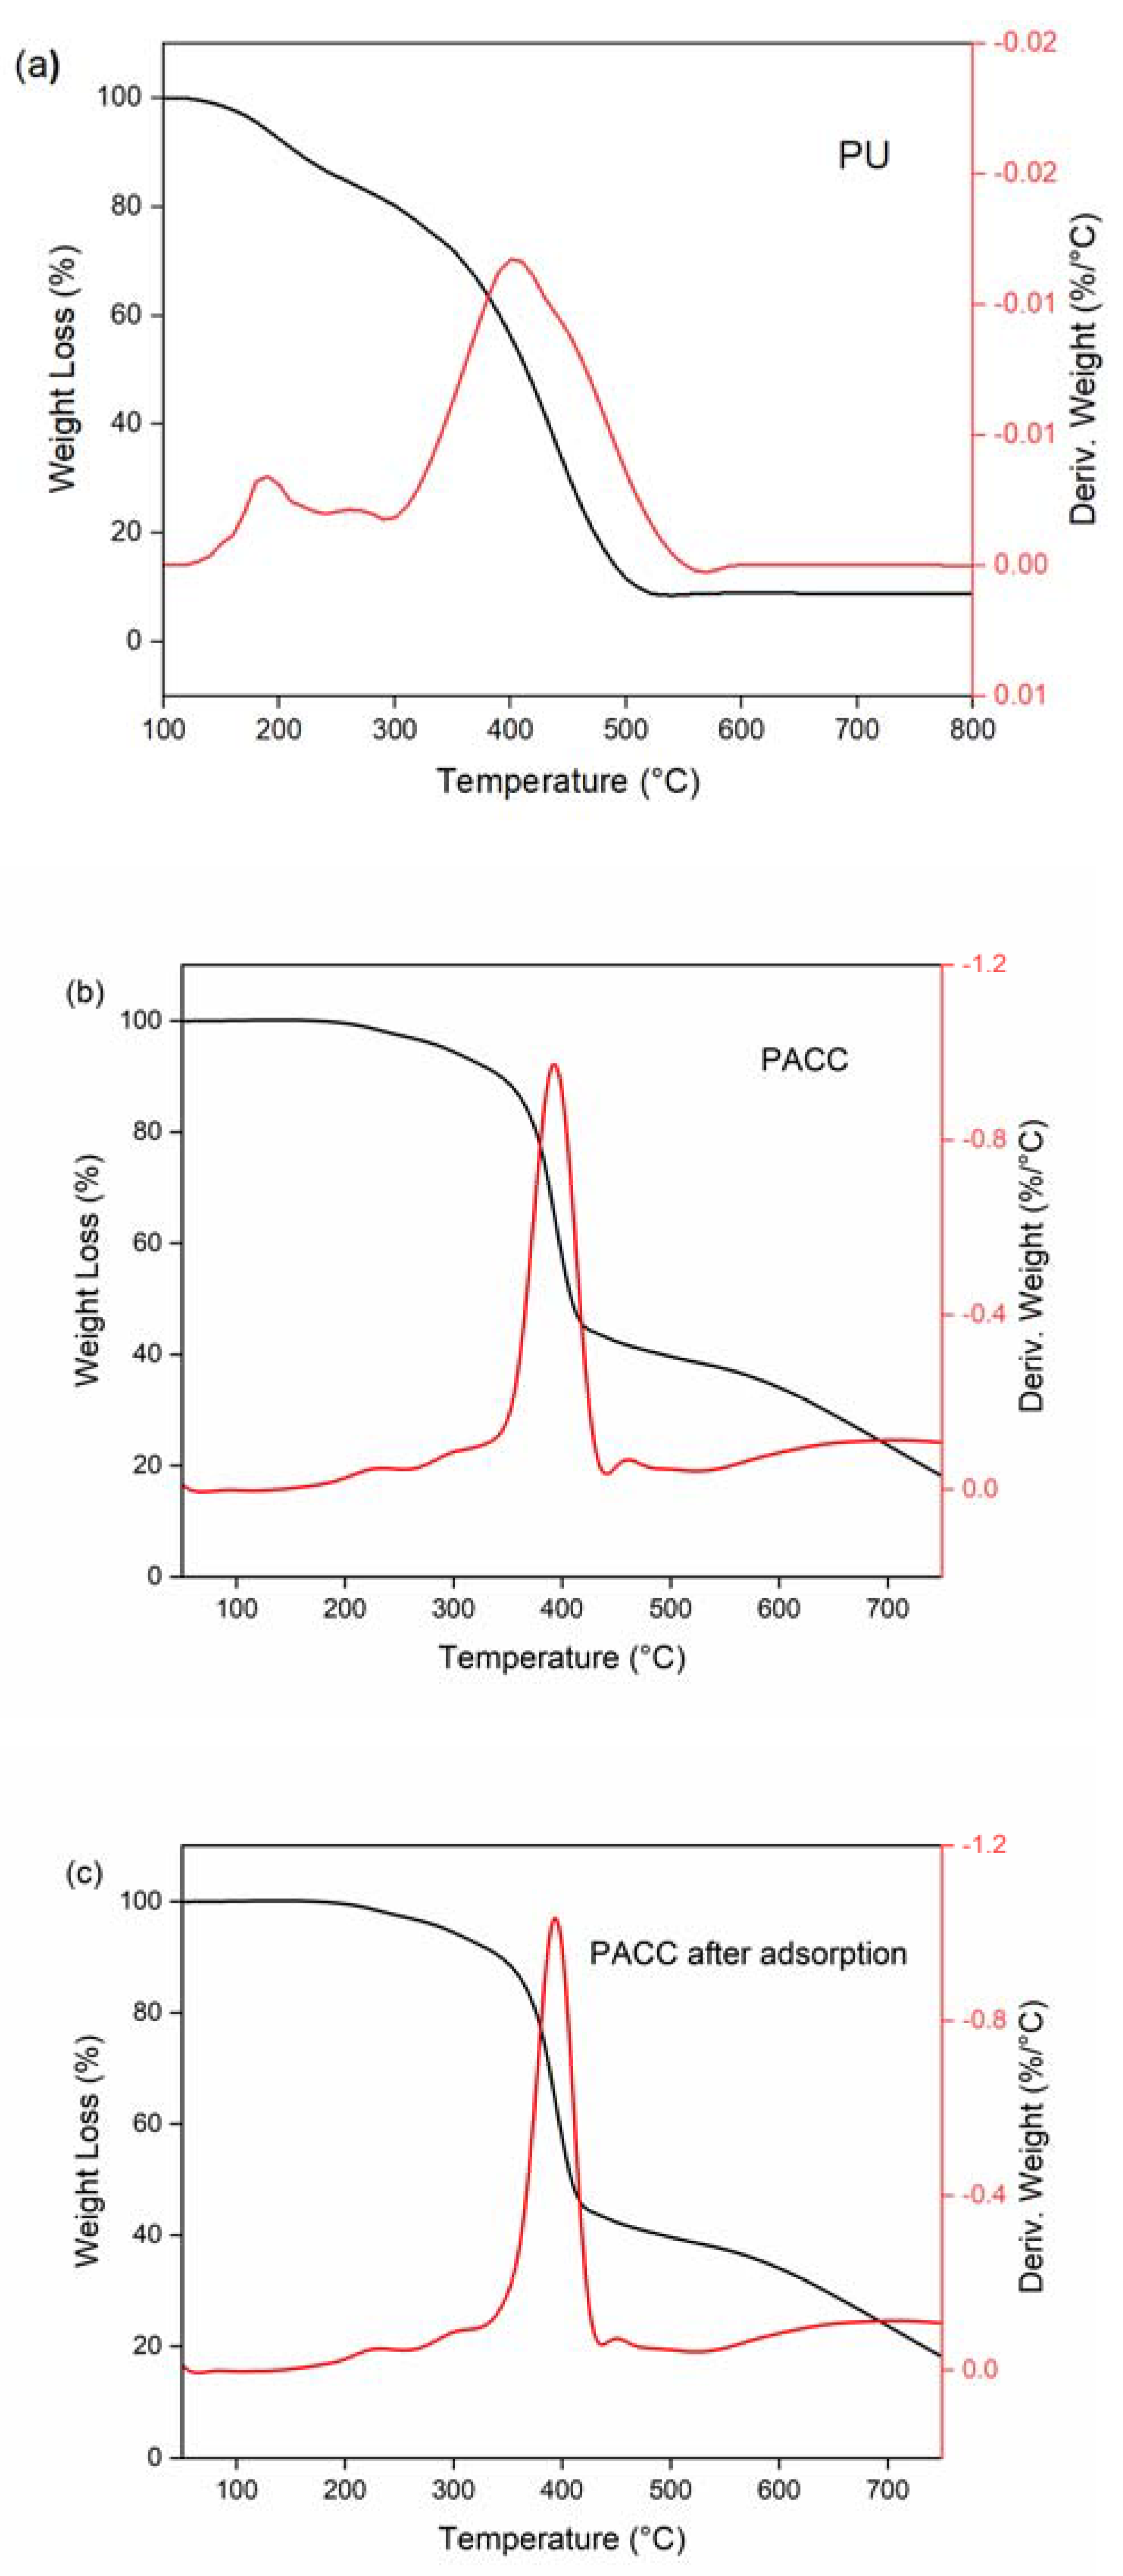
3.1.5. Thermogravimetric Analysis

Figure 5 illustrates the thermal properties of blank PU, PACC, and PACC after adsorption. The black lines represent the weight loss graph, whereas the red line corresponds to the derivative thermogravimetry graph. In Figure 5a, the DTG graph of PU displays two notable endothermic peaks located at approximately 184 °C and 406 °C. The mentioned peaks suggest the thermal degradation of the unique rigid and flexible segments of PU. The rigid segments can be linked to the presence of urethane bonds, whereas the introduction of fatty acid chains into the PU matrix affects the flexible segments [17]. In contrast, the DTG examination of PACC before and following adsorption discloses the presence of several peaks located at approximately 220 °C, 310 °C, 400 °C, and 440 °C, as displayed in Figure 5b,c. Similar to pure PU, the peaks identified at 220 °C and 400 °C correspond to the thermal breakdown of the urethane segments and the fatty acid components within the PACC. Furthermore, the extra peak can be ascribed to the thermal disintegration of the activated carbon constituents incorporated into the composite [40]. Additionally, the TGA-DTG curve of PACC following adsorption, as depicted in Figure 5c, displays comparable thermal degradation peaks to those of PACC in Figure 5b. This observation implies that the thermal stability of PACC was not compromised during the adsorption process.

3.2. Effect of Dynamic Adsorption Parameters

Table 3 displays the data parameters obtained from the column under varying Pb concentrations, bed heights, pH, and flow rates while maintaining a constant room temperature.

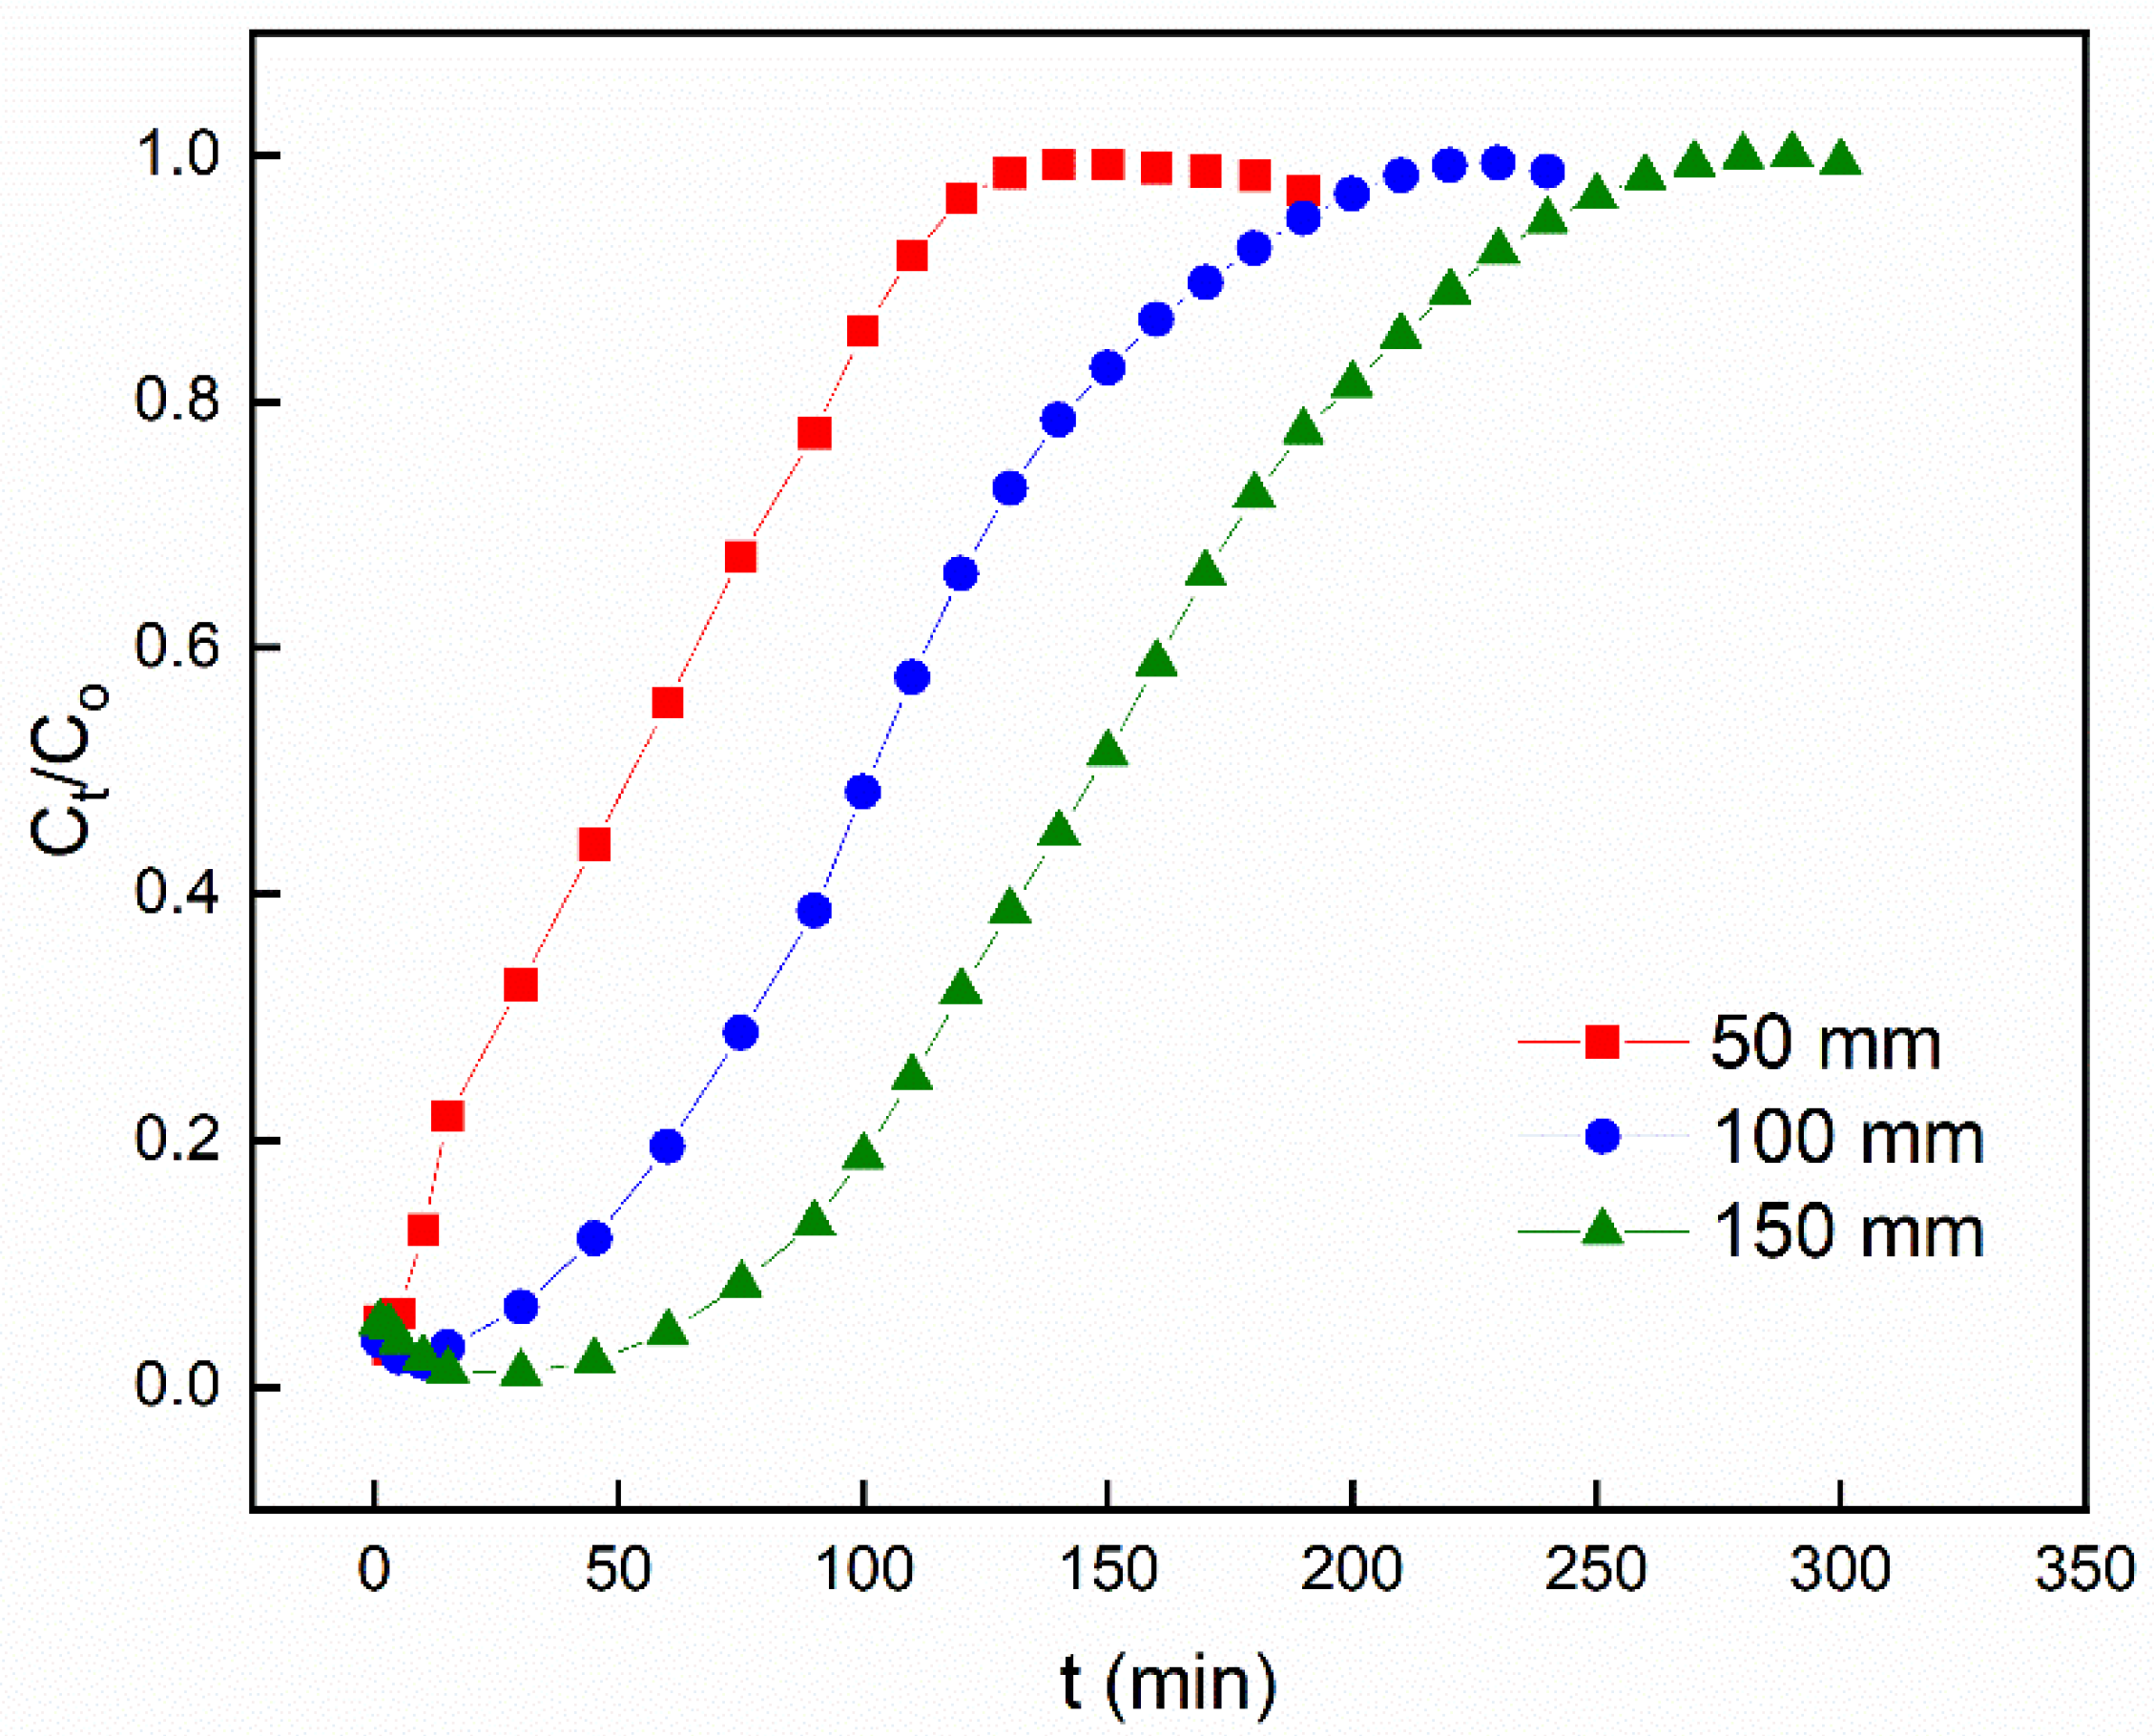
3.2.1. Effect of Bed Height

Figure 6 shows the breakthrough curve for Pb2+ adsorption on PACC at three distinct bed heights (50 mm, 100 mm, and 150 mm). The flow rate was held steady at 6 mL min−1, pH at 6, and the inlet concentration of Pb2+ was kept constant at 50 mg L−1. The experimental results show that elevating the bed height from 50 mm to 150 mm resulted in an extended time for the bed to achieve saturation. This observation implies a correlation between the breakthrough curve and the bed height, indicating an expansion in the zones of mass transfer [41]. Additionally, Figure 6 demonstrates that reducing the bed height resulted in a more rapid saturation. Meanwhile, increasing the bed height to 150 mm improved the removal efficiency. Similar studies have observed that these findings are influenced by the augmentation of active sorption sites and the prolongation of duration of contact between PACC and Pb2+ [42,43].

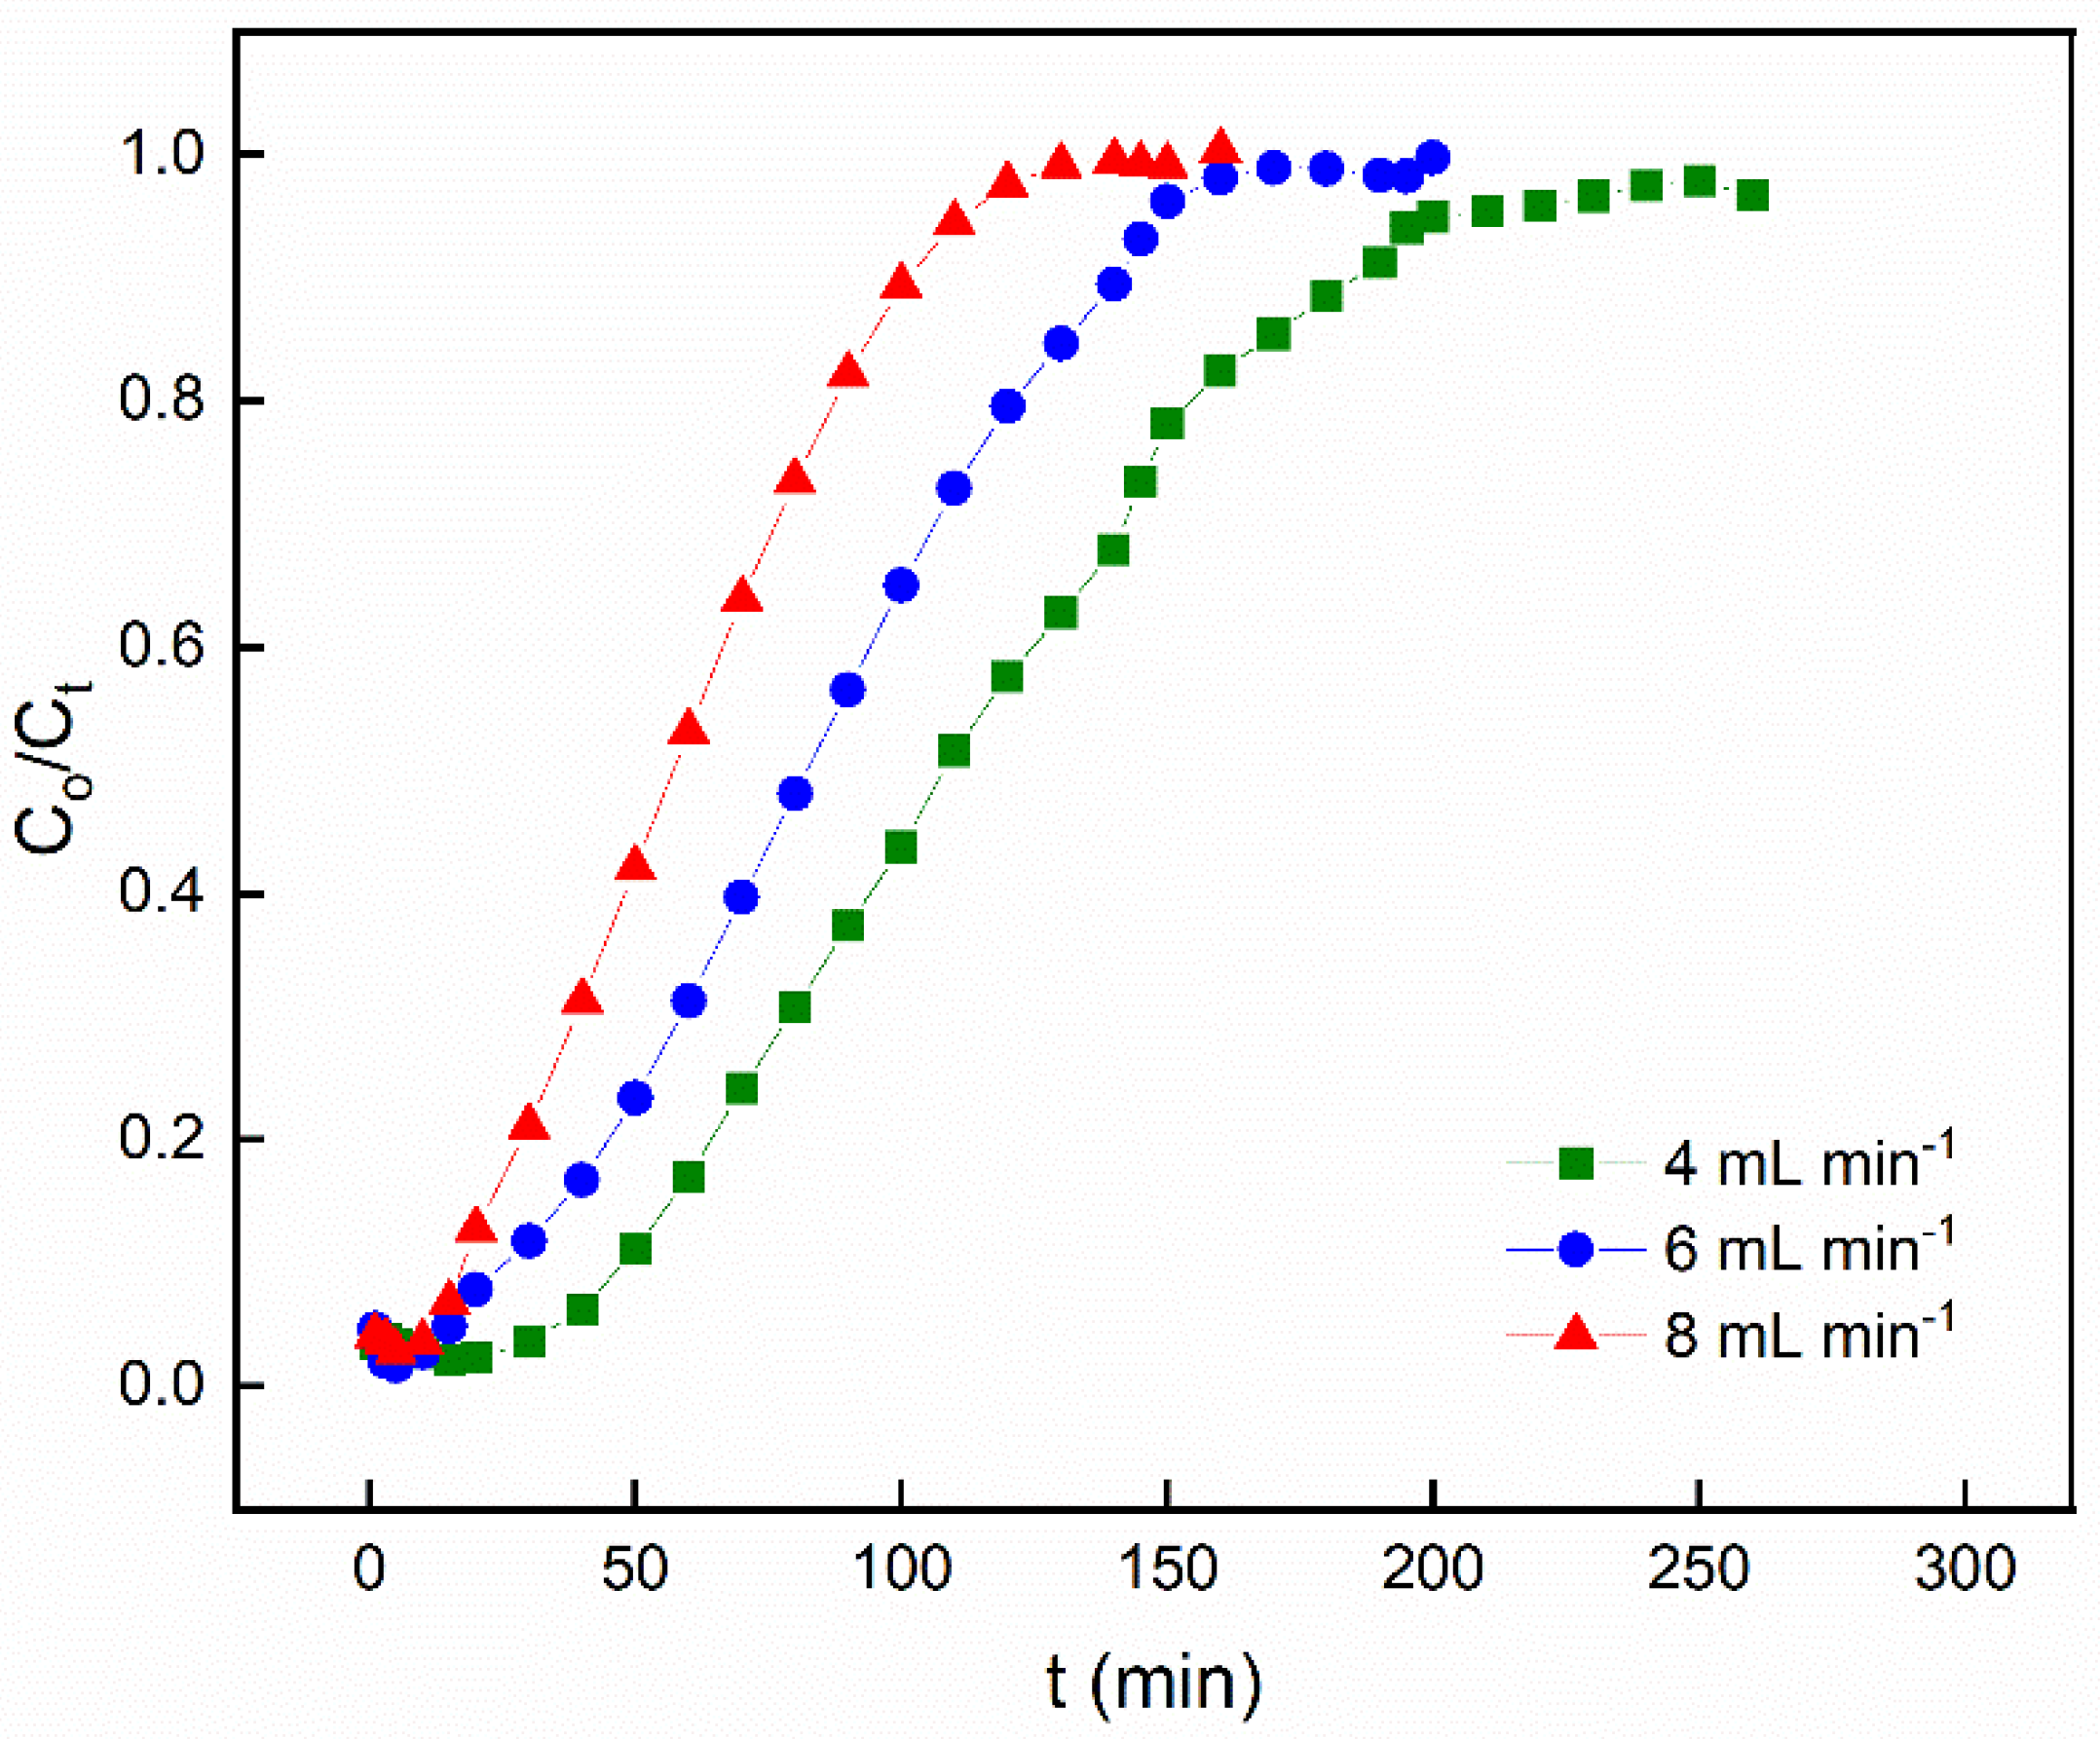
3.2.2. Effect of Flow Rate

To examine the influence of flow rate on Pb2+ adsorption using PACC, the flow rate was subjected to variation (4, 6, and 8 mL min−1), keeping a consistent adsorbent bed height of 100 mm, a pH level of 6, and a constant inlet concentration of Pb2+ at 50 mg L−1. The outcomes of this investigation are presented in Figure 7, where the breakthrough curve is depicted. The findings indicate a significant enhancement in breakthrough occurrence with the escalation of flow rate. Conversely, along with the decreasing flow rate, there is a significant extension of the duration required to reach saturation. At lower flow rates, there was more time for the interaction between Pb and PACC, resulting in an augmented removal of Pb2+ in the column.
The fundamental concepts of mass transfer clarify the variations noticed in the steepness of the breakthrough curve and the adsorption capacity. Increased flow rates induce a reduction in the hindrance to mass transfer posed by the external film at the surface of the adsorbent, leading to an escalated rate of mass transfer and a decreased residence time. Consequently, saturation is achieved more quickly, leading to decreased removal efficiency. This implies that the amount of heavy metal adsorbed per unit of bed height, known as the mass transfer zone, enlarges with higher flow rates, resulting in a more rapid attainment of saturation capacity [22,44]. In contrast, inadequate solute residence time in the column results in a decline in the adsorption capacity, as the solute exits the column before reaching equilibrium. Similar patterns have been noted by other investigators [45,46,47].

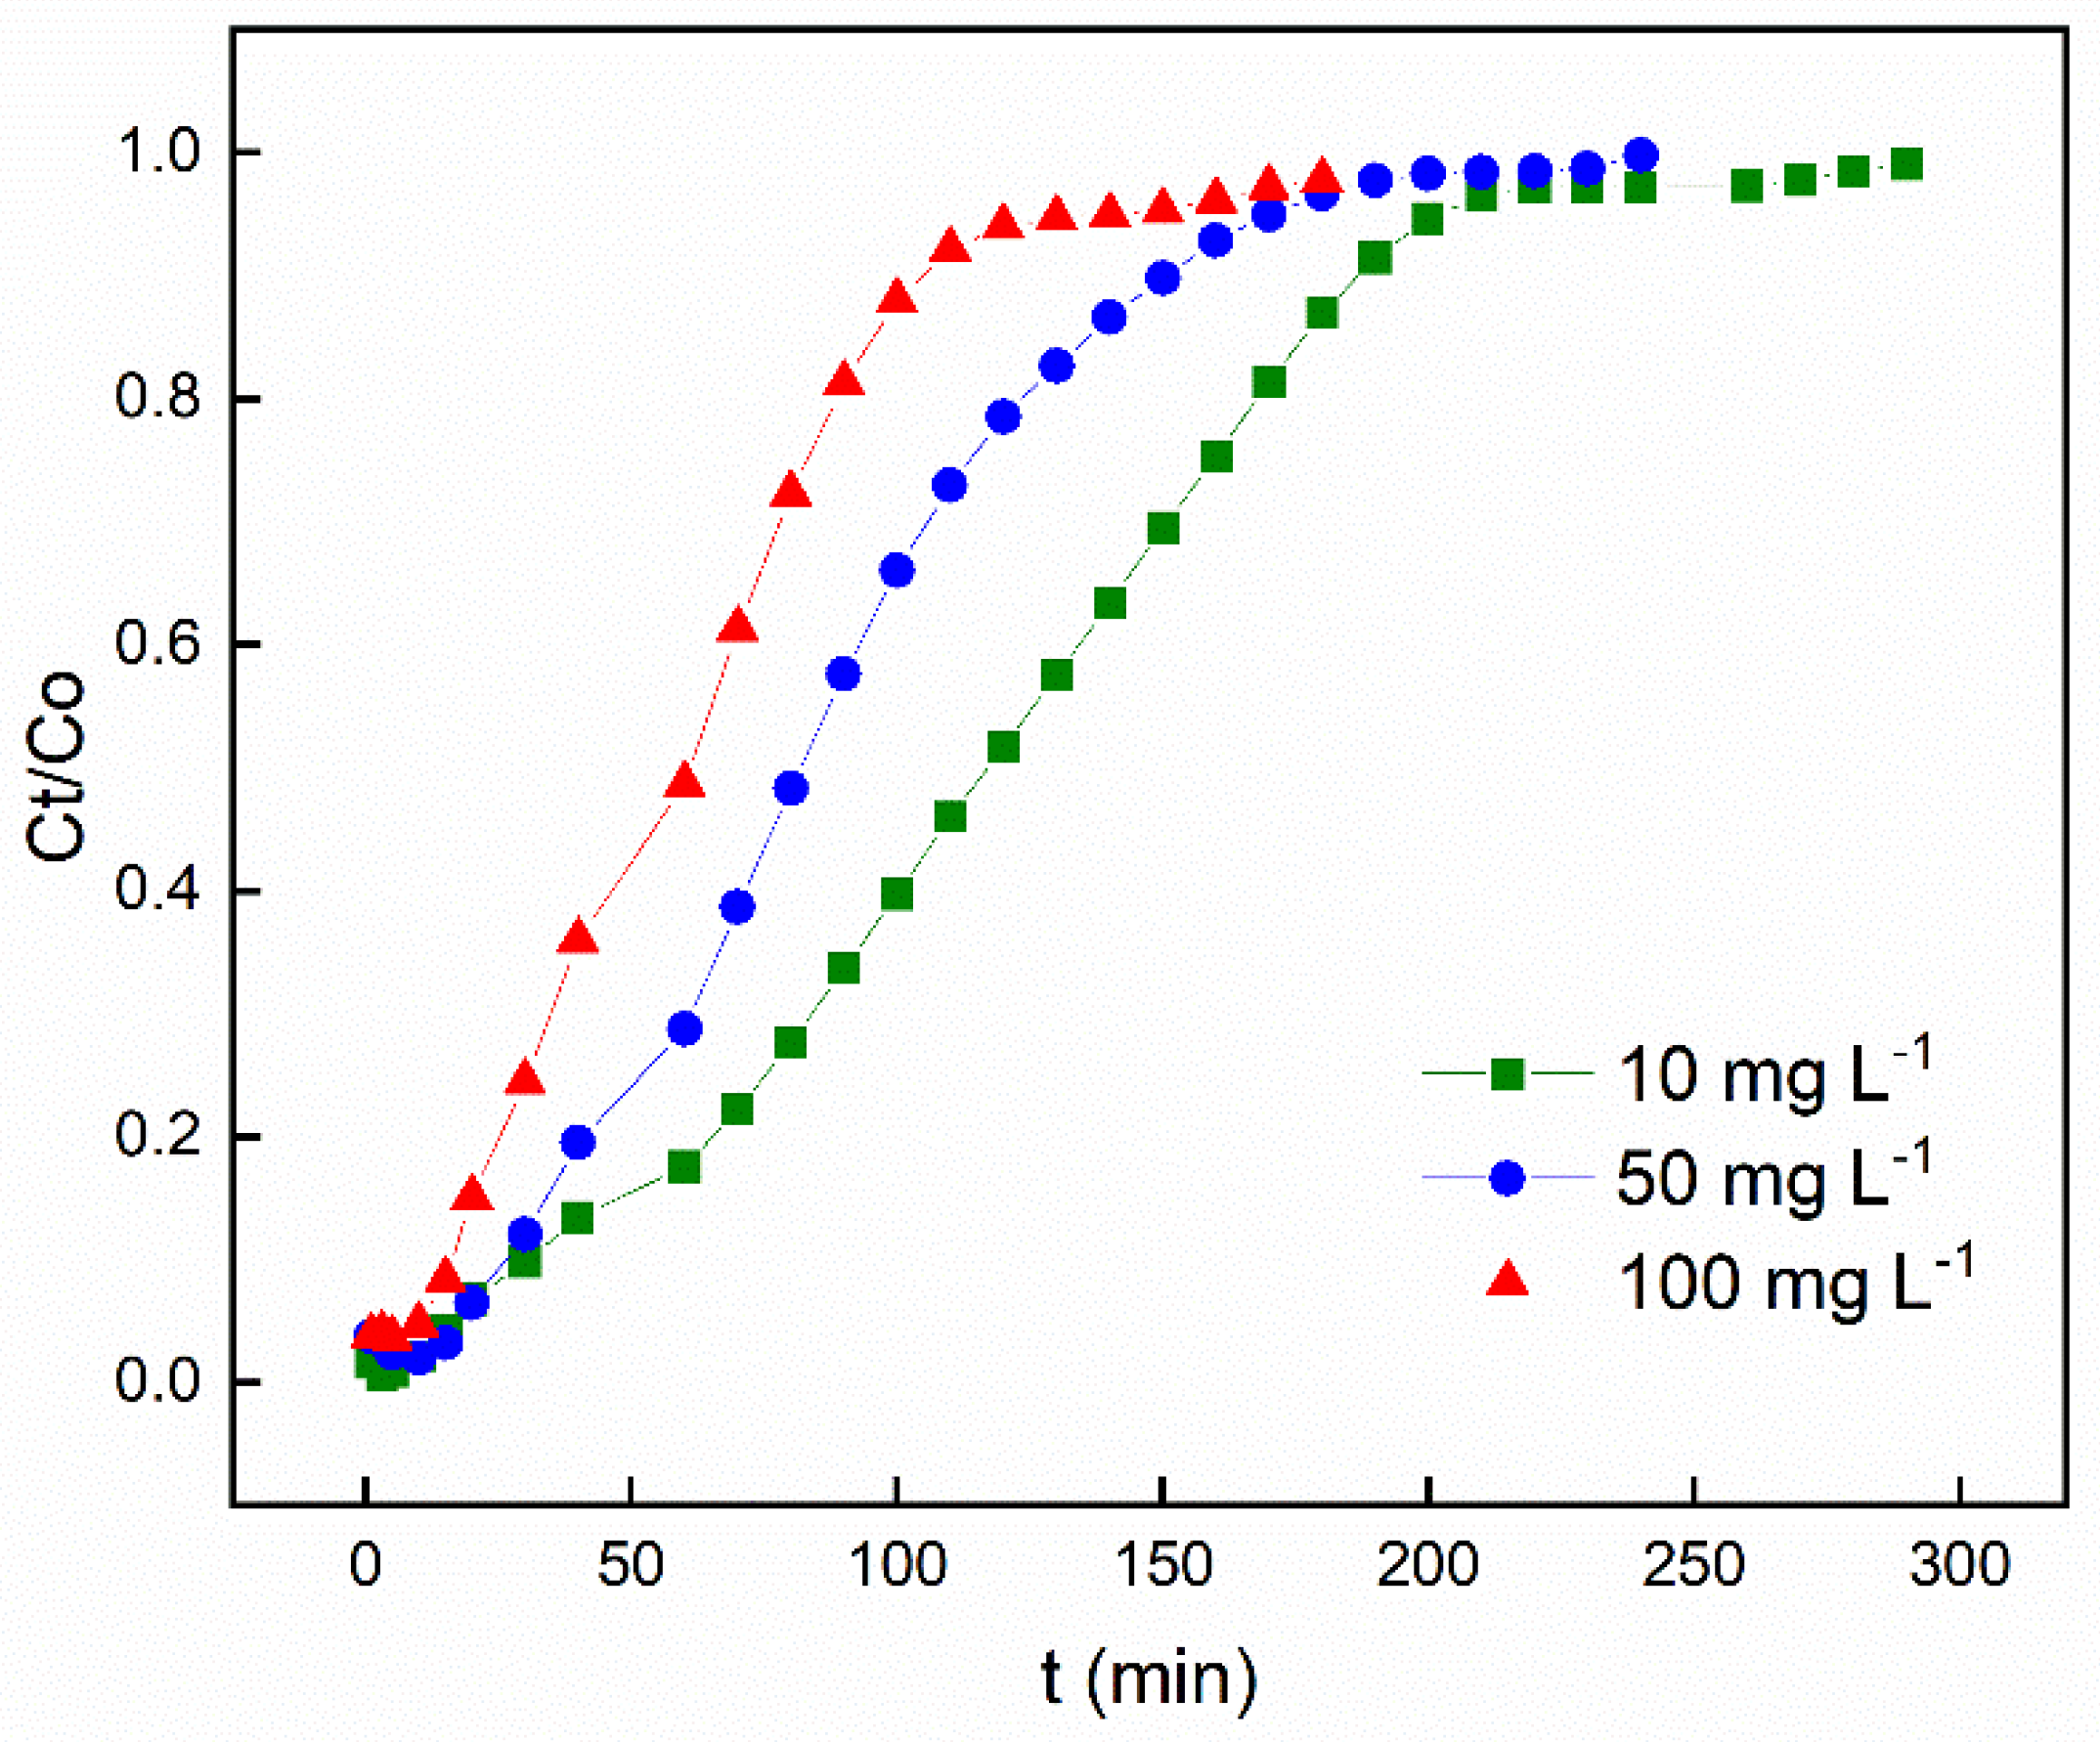
3.2.3. Effect of Initial Concentration
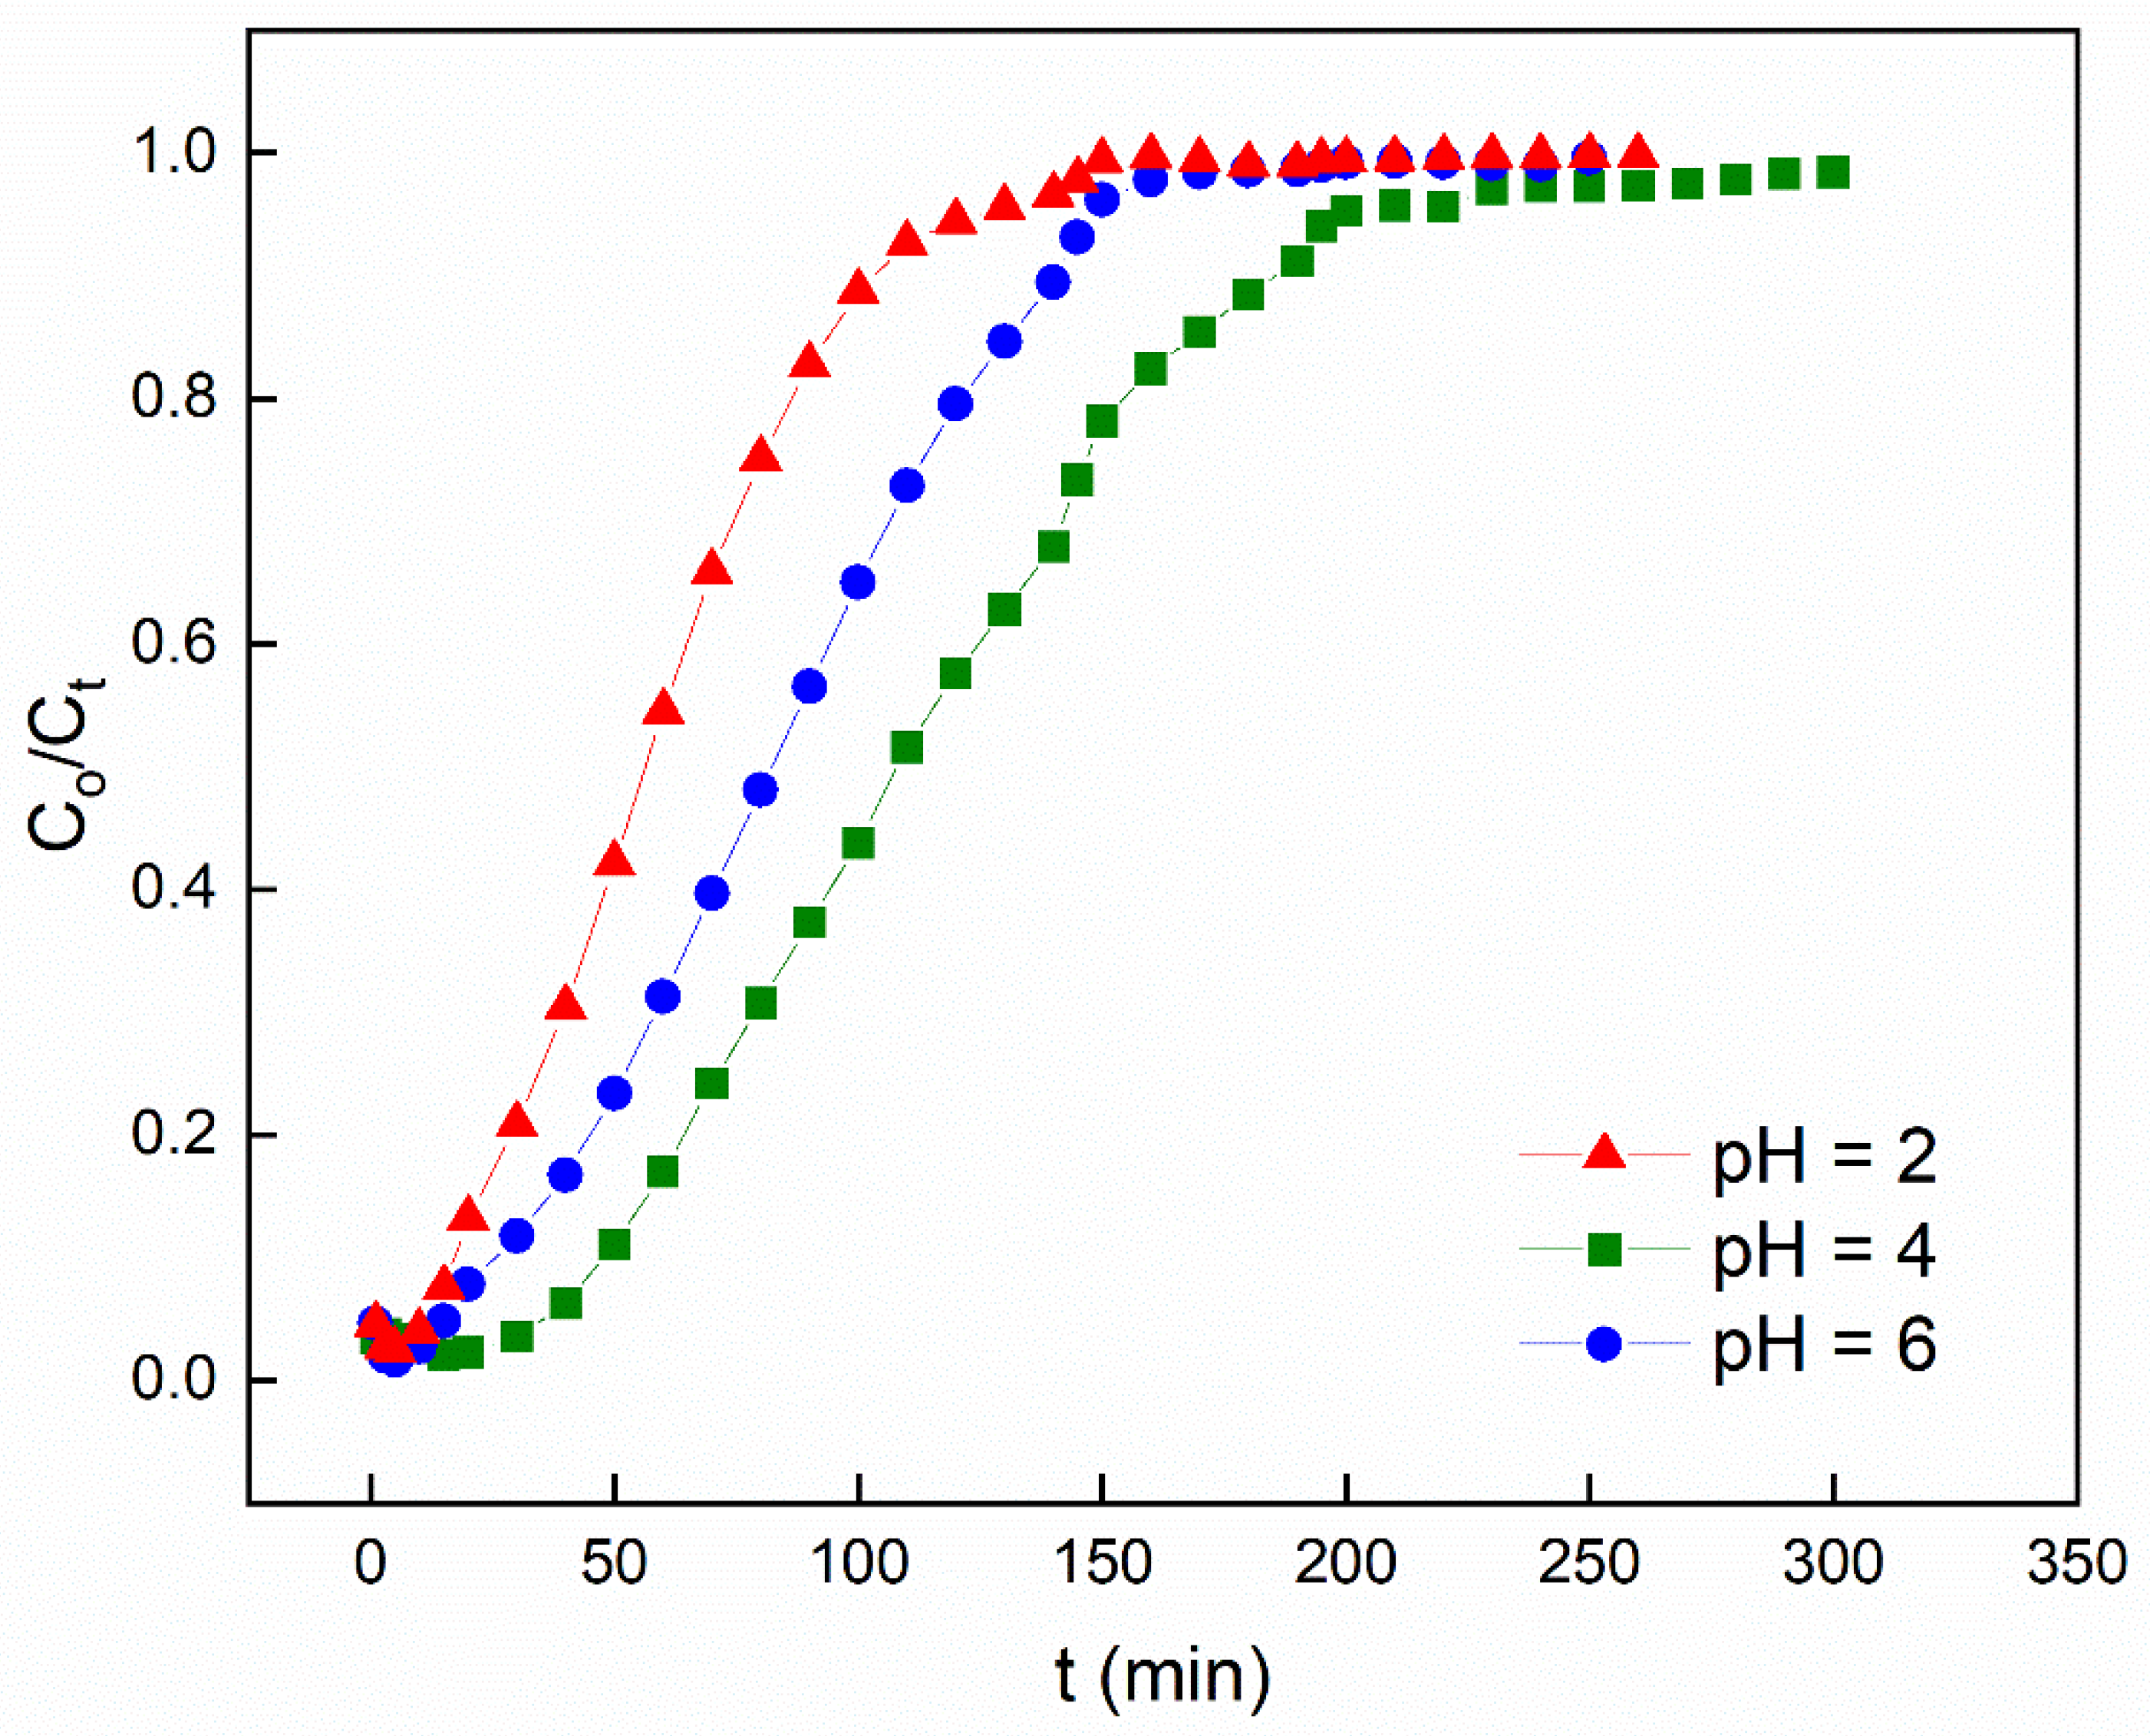
Figure 8 portrays the influence of varying the initial Pb2+ concentration on the breakthrough curve, all the while sustaining a constant adsorbent bed height (100 mm), pH value of 6, and solution flow rate of 6 mL min−1. The graphical representation indicates that an elevation in the initial Pb2+ influent concentration prompts a more rapid achievement of saturation in the adsorption process, subsequently leading to a reduction in breakthrough time. It is noteworthy that at lower Pb2+ inlet concentrations, the breakthrough curves exhibited increased dispersion, resulting in a more gradual manifestation of breakthrough. Conversely, sharper breakthrough curves were observed upon increasing the influent concentration of Pb2+. This phenomenon can be ascribed to the higher concentration gradient, which resulted in swifter movement attributed to the mass transfer coefficient.
An elevated influent concentration results in a more pronounced incline of the breakthrough curve and a shorter breakthrough time, in accordance with findings from previous studies [48]. These results suggest that the concentration affects the level of saturation and breakthrough time, implying that the dispersion mechanism is influenced by the influent concentration. An increase in the influent concentration led to an increase in the driving force for mass transfer, leading to a decrease in the length of the adsorption zone [22,49]. These findings are congruent with prior studies conducted on numerous fixed-bed adsorption frameworks [47,50].

3.2.4. Effect of pH

The pH values exert a critical influence on various aspects of heavy metal behavior within the environment. Beyond its influence on the dissociation of heavy metal sites, pH exerts a substantial impact on solution chemistry by contributing to various processes, including redox reactions, hydrolysis, complexation with organic and/or inorganic ligands, and precipitation. The pH significantly governs these mechanisms and consequently has a notable effect on the availability of heavy metals for biosorption [51]. To assess how pH levels affect the efficiency of Pb2+ adsorption by PACC, a series of pH values ranging from 2 to 6 were utilized for investigation. Throughout this experimentation, the bed height (100 mm), flow rate (4 mL min−1), and initial concentration (50 mg L−1) remained constant. As shown in Figure 9, the breakthrough curve at pH = 2 shifted towards the left, indicating a shorter breakthrough time. This occurrence can be explained by the higher concentration of hydronium ions at lower pH levels, which competes effectively with Pb2+ ions for interaction with the active sites of PACC [52]. Although at pH values greater than 6, Pb2+ ions undergo solvation, hydrolysis, and lead oxide precipitation [53]. These precipitates are unable to be adsorbed by the PACC foam, leading to a decrease in the breakthrough time, which occurred at 240 min. Hence, at a moderate pH (pH = 4), these circumstances can be mitigated, resulting in the longest breakthrough time.

3.3. Modeling of Column Data

Mathematical modeling is of crucial importance in upscaling techniques from laboratory experiments to pilot plants and industrial scales. It acts as a valuable instrument for examining and explaining experimental information, recognizing significant process mechanisms, foreseeing the outcomes of different operational circumstances, and enhancing the total effectiveness of the process [18].

3.3.1. Thomas Model

The theoretical framework suggested by the Thomas model suggests that the flow pattern inside the bed adheres to a plug flow configuration. Additionally, the model incorporates the Langmuir isotherm to describe the equilibrium behavior and second-order reversible reaction kinetics [24]. This simulation is extensively accepted and commonly employed to characterize sorption processes in fixed-bed columns. It is especially applicable in situations where external and internal dispersion has minimal impact on the overall process.
Table 4 demonstrates that the Thomas model exhibited a remarkable fit, with R2 values of 0.96 to 0.98. Based on the model, the total adsorption capacity (qo) rises as the inlet concentration of Pb2+ increases. This phenomenon can be attributed to the fundamental driving force of adsorption, which primarily originates from the difference in Pb2+ concentration between the solution and the adsorbent composite [54]. Furthermore, a surge in flow rate leads to a decreased total adsorption capacity (qTh). Similar findings have been reported in other studies [43,46].

3.3.2. Bohart–Adams Model

Bohart and Adams introduced an equation derived from surface reaction theory to establish a relationship relating to Ct/C0 and t in a continuous system [25]. This equation can be used in illustrating the initial portion of the breakthrough curve, as it postulates that equilibrium is not immediately attained.
The data presented in Table 5 reveals that higher effluent Pb2+ concentration and flow rate are associated with decreased values of kAB, while increased bed height corresponds to an increase in kAB. These trends are consistent with findings from prior research [55,56], indicating that surface mass transfer plays a significant function in the kinetics of the overall system, particularly throughout the preliminary phase of column adsorption [57].
Although the Bohart–Adams model is widely utilized and valuable for conducting and analyzing adsorption-column experiments, it is crucial to acknowledge that its applicability is limited to certain experimental conditions [41,43]. The model’s correlation coefficient falling below 0.96 indicates that it is not sufficient for fully capturing the adsorption behavior of the column. Instead, it is exclusively suitable for depicting the initial portion of the breakthrough curve [5].

3.3.3. Yoon–Nelson Model

Yoon–Nelson postulated that the decline in the likelihood of adsorbate molecule binding is intricately linked to both the probability of adsorbate adsorption and the occurrence of breakthrough phenomena within the adsorbent medium [27] (Table 6).
The Yoon–Nelson model demonstrated its applicability to the current system, as indicated by R2 values surpassing 0.96. According to the model, the 50% breakthrough extended as the bed height increased, but decreased when higher concentrations and flow rates were employed. These observations align with earlier research findings [43,46].
The Thomas and Yoon–Nelson models proficiently described the adsorption patterns of Pb2+ within a fixed-bed column, as demonstrated by high R2 values and well-matched breakthrough curves.

3.4. Comparative Analysis of Breakthrough Curves Fitting

It is worth emphasizing that despite their distinct assumptions, derivations, and simplifications, the Thomas, Bohart–Adams, and Yoon–Nelson models (Equations (5)–(7)) may be expressed using the subsequent formula, where the ‘lumped’ variables a and b are defined in Table 5:
C C O = 1 1 + e x p ( b a t )
Based on Equation (7), it can be concluded that the Thomas, Bohart–Adams, and Yoon–Nelson models are fundamentally equal. The breakthrough curve predictions obtained from Equation (7) depict the breakthrough curve that would be achieved using any of the three previously mentioned models (Equations (5)–(7)). The three sets of parameters (kTh, qTh; kBA, N0; and kYN, t) can be determined from constants ‘a’ and ‘b’ (Table 7) and are thus interchangeable [56].
The merits and limitations of the models utilized in this study were assessed and summed up in Table 8 based on the analysis and relationship of the experimental data. The results show that the three models were well-suited to describe the column data, especially in instances of columns with higher bed heights, where a consistent and even depletion process was observed [57]. Hence, these models can be effectively used to forecast the performance of columns and aid in designing considerations and future enhancement endeavors. The applicability of the three utilized models in this study was observed for adsorption in distinct component systems. The utilization of the Thomas model offered valuable insights into the dynamics of mass transfer between the adsorbent material and metal solutions. This allowed for a better understanding of the driving forces behind these processes under various conditions. The experimental data collected from the Pb2+ columns showed a promising alignment with the theoretical predictions generated by the Thomas and Yoon–Nelson models. This alignment indicated the presence of hindrances to mass transfer within the columns. Each of the three models employed in this study necessitated distinct parameters for their respective theoretical calculations.
Among the three models utilized in this study, the Yoon–Nelson model stood out for its simplicity, requiring fewer parameters and theoretical calculations. It provided valuable information on the 50% breakthrough of the column, enabling the prediction of the saturation period without requiring extensive experimental duration [58]. In contrast, the widely used Bohart–Adams model has proven useful in predicting the sorption capacity of adsorbents in various studies, particularly for the design of large-scale effluent treatment systems. By analyzing experimental breakthrough data, the Bohart–Adams model can estimate breakthrough time and maximum adsorption capacity, which are crucial for efficient system design and operation [54]. However, this model imposes additional parameters and computations to derive predicting data. It primarily focuses on adsorption through surface reactions, the presence of sorption sites, and the starting portion of the breakthrough curve [59]. In the case of removing Pb2+ using PACC, involving the integration of ion exchange and adsorption, the Bohart–Adams model is not an ideal fit for accurately and comprehensively representing column behaviors and mechanisms in this study. Although the employed models exhibited a good fit for certain column parameters, certain parameters were not accurately captured, likely due to the presence of mass transfer resistance and the intricate mechanisms involved in the removal process [59].
The findings suggest that enhanced adsorption efficiency is attained through increased bed heights, reduced flow rates, and higher initial concentrations. Furthermore, Table 9 offers a concise overview of how various adsorbents perform under similar circumstances. This investigation has affirmed that the adsorption capability of PACC is on par with, and conceivably superior to, the capacities of alternative adsorbents noted in contemporary scientific literature.
Given the absence of prior published research specifically focusing on fixed-bed column studies in relation to the biosorption of Pb2+ by PACC, this study can be compared to similar investigations that have examined either the same metal or biosorbents with similar characteristics.

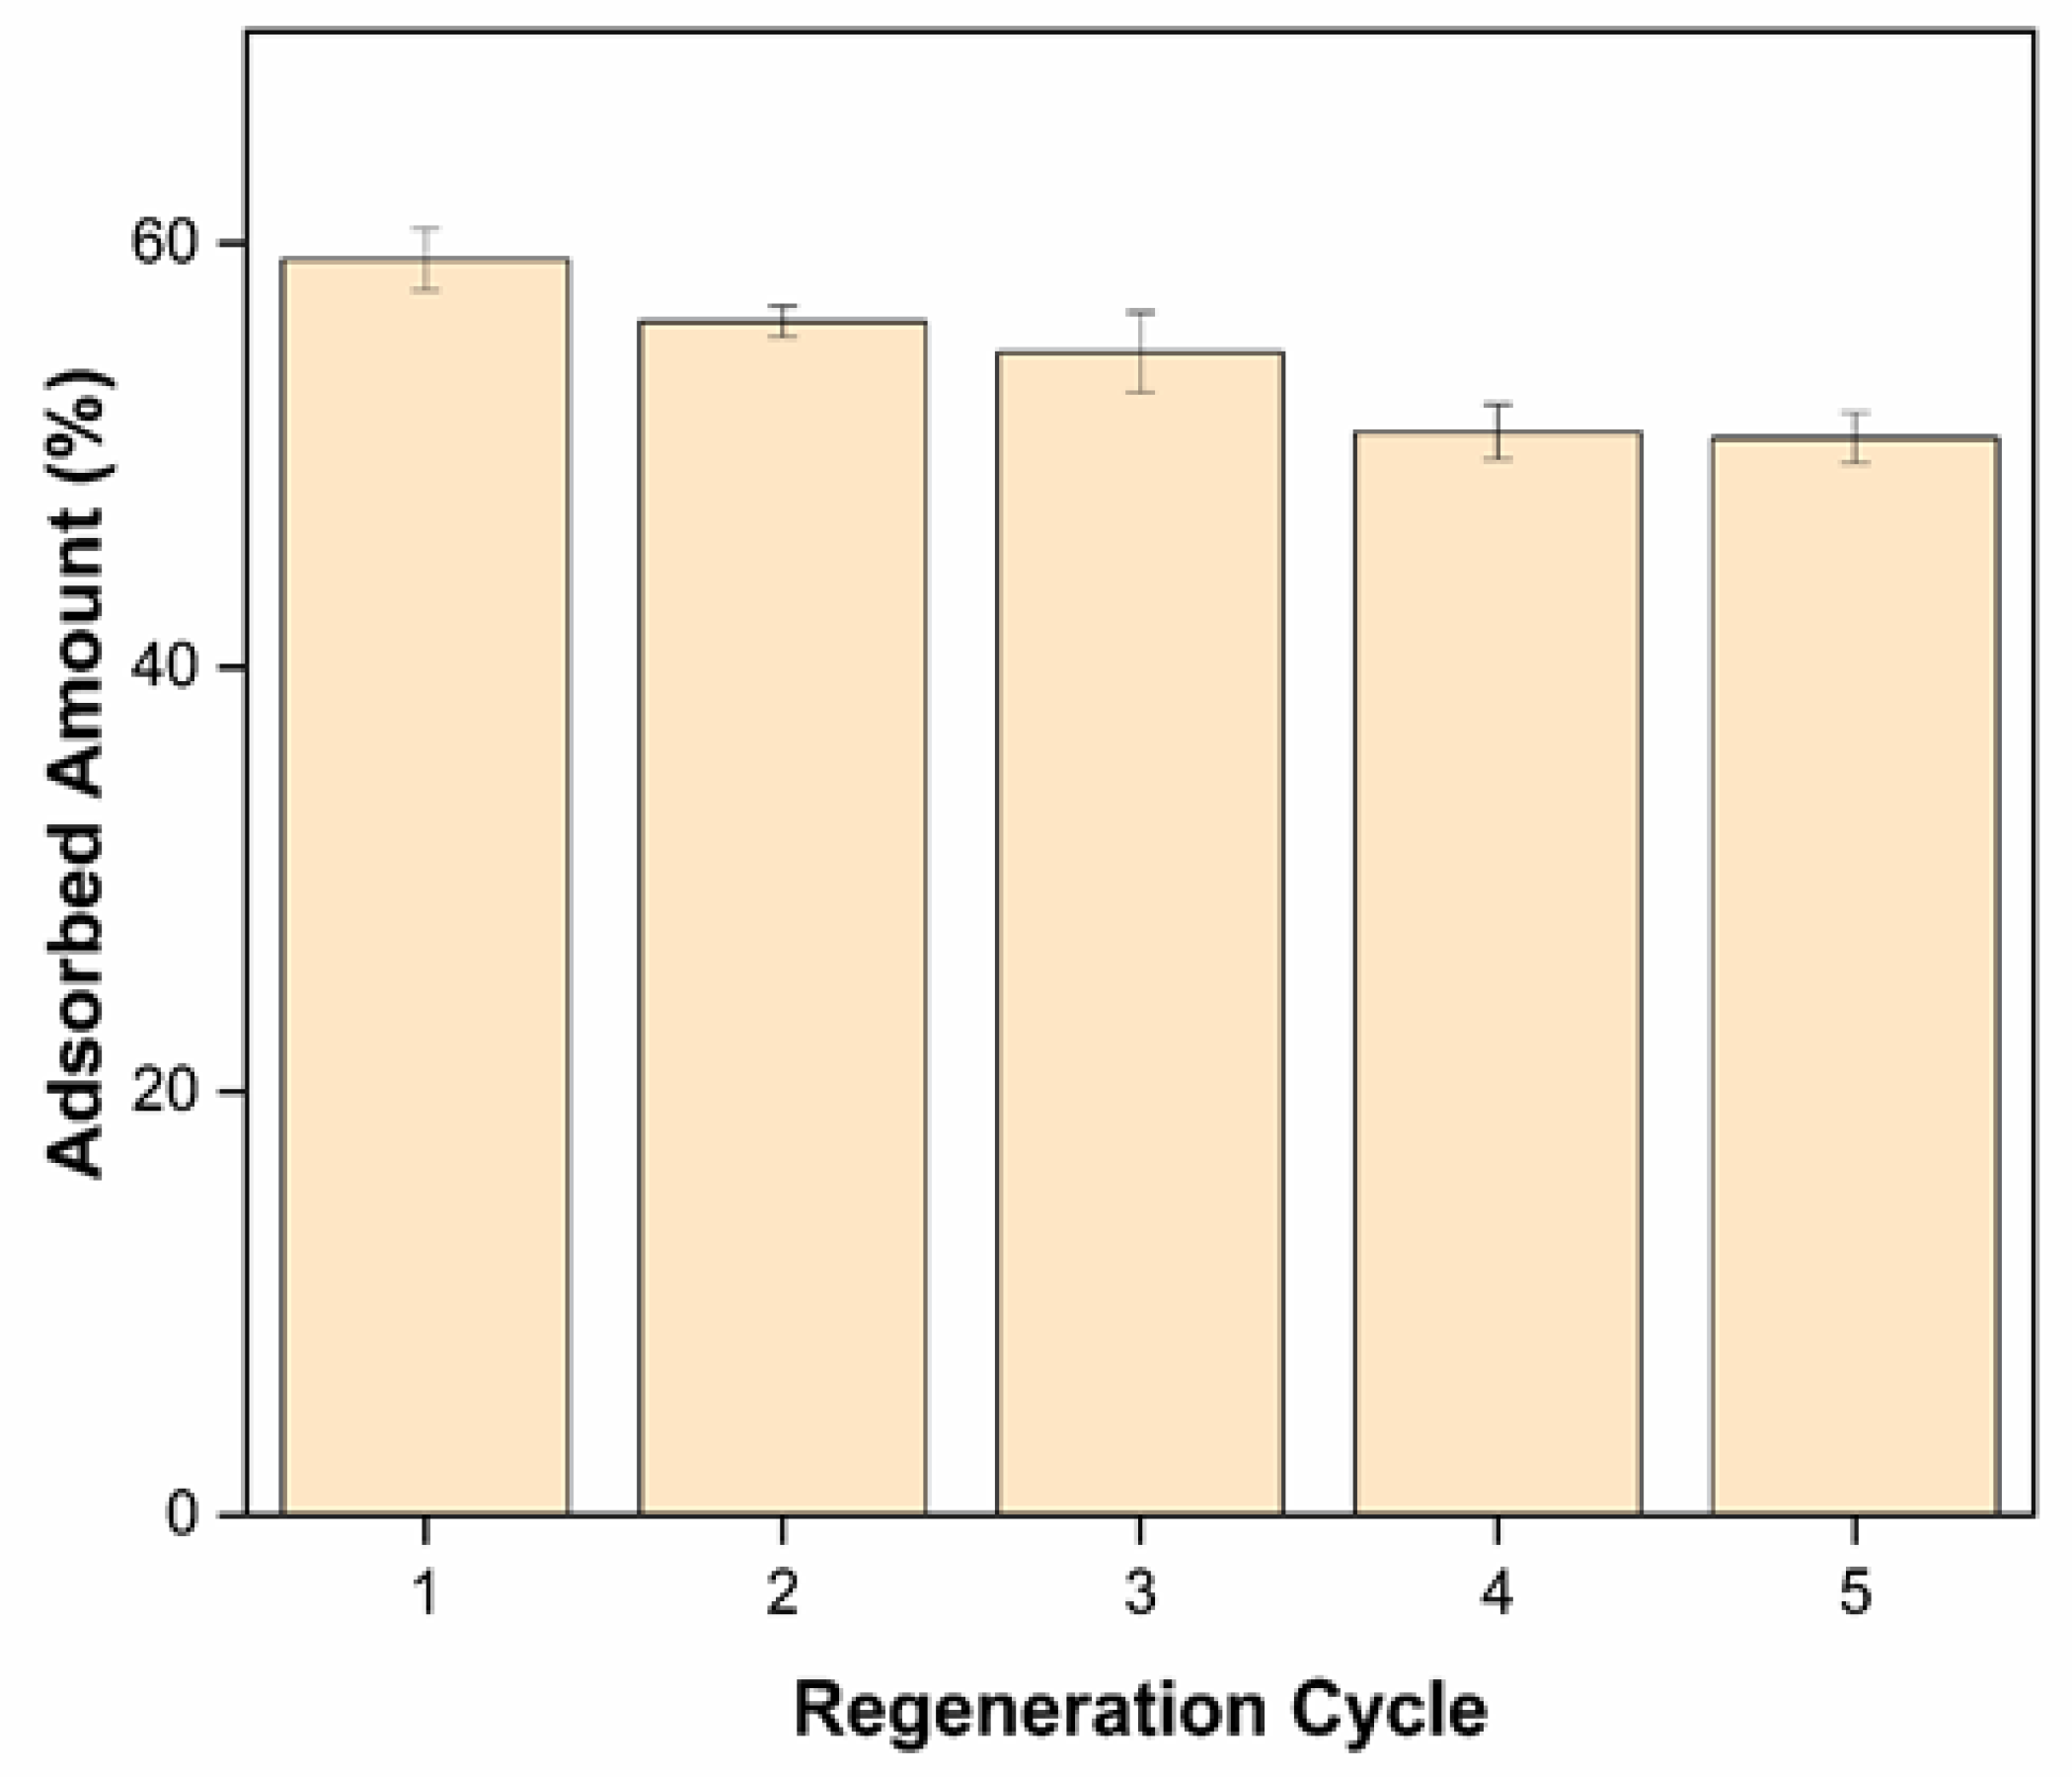
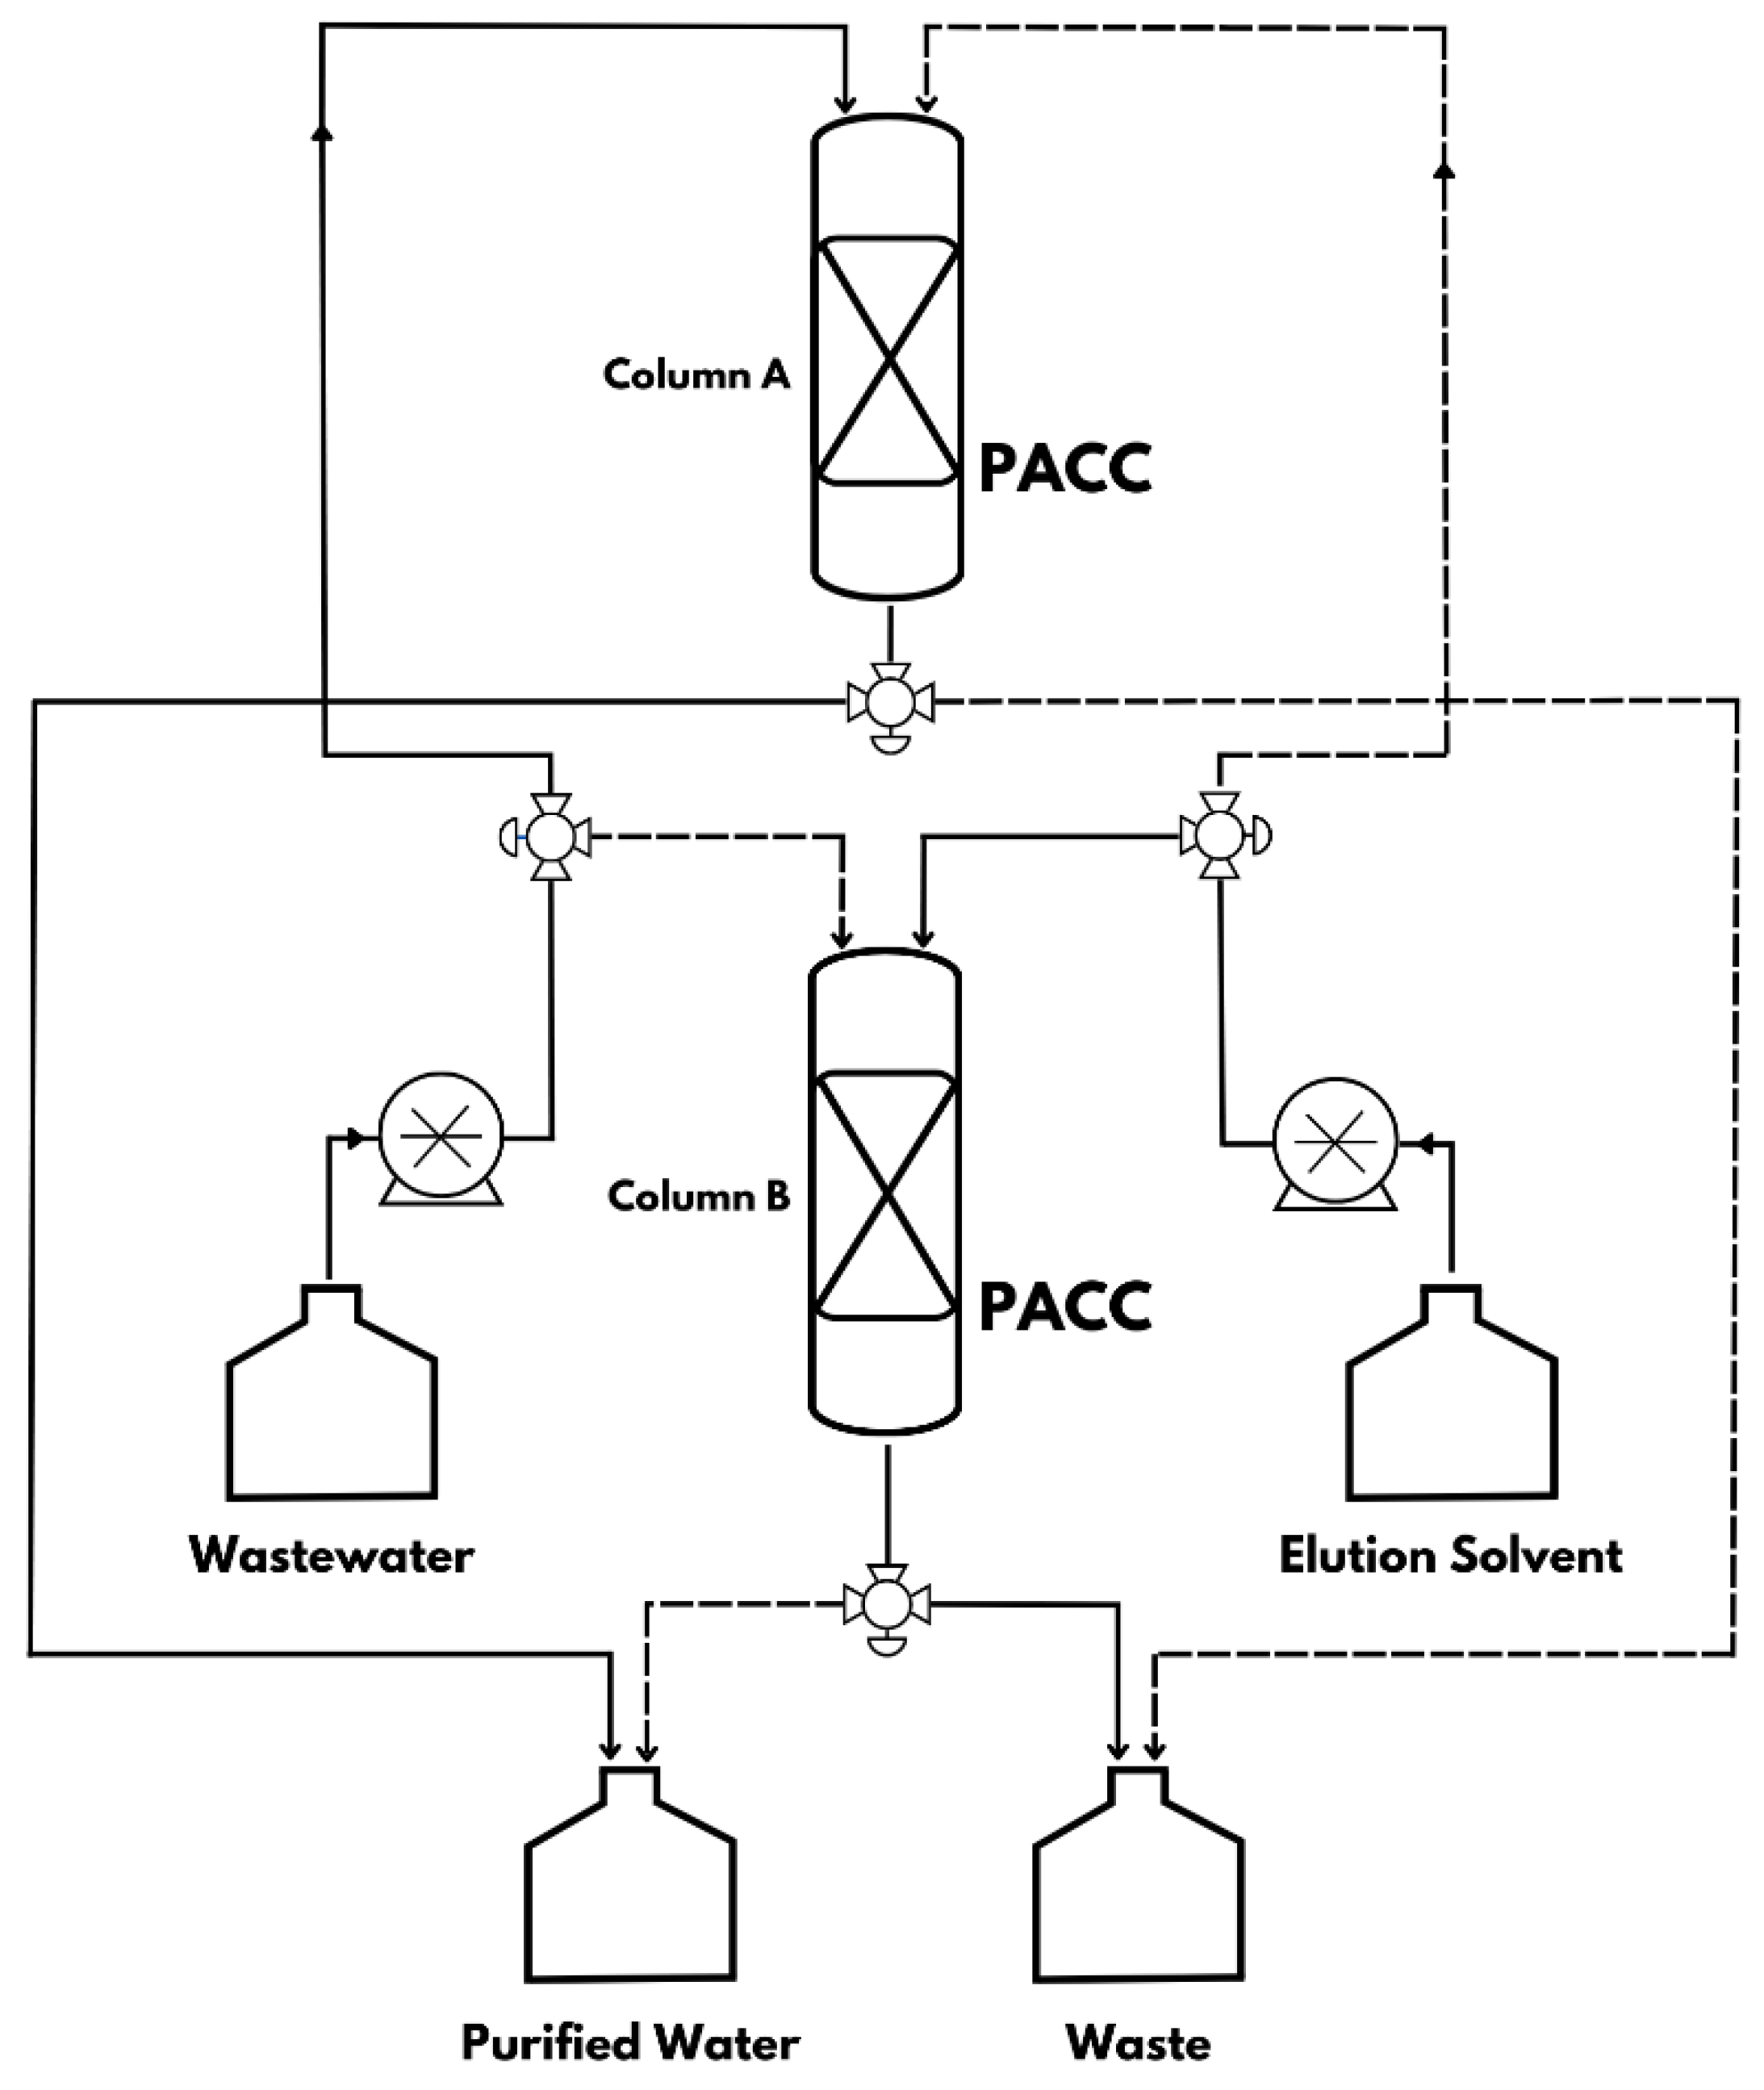
3.5. Regeneration Studies and Implications to Industrial Wastewater Treatment

In line with the comprehensive concept of sustainability, which encompasses economic, social, and environmental factors, the achievement of sustainable industrial development relies heavily on the adoption of viable technologies that generate positive socio-economic and environmental outcomes [65]. This progress extends not only to novel strategies but also to the enhancement of protocols that offer optimal results while minimizing resource utilization, thus providing significant benefits such as environmental safety and yield improvement. In addition to possessing effective adsorption capability, the convenient reusability of the adsorbent without substantial reduction in adsorption capacity and its long-term reusability are crucial considerations for practical applications.
In this study, the PACC material, having undergone Pb2+ adsorption, was subjected to desorption experiments utilizing a 0.1 M NaOH solution as the desorbing agent. The regeneration cycle encompassed the passage of the desorbing agent through the column at a flow rate of 2.5 mL min−1 for a duration of 30 min. Subsequently, a rinsing phase with deionized water was carried out for an additional 30 min before initiating a successive cycle of Pb2+ adsorption. Furthermore, following four (4) cycles of adsorption-desorption, the PACC exhibited a consistent removal efficiency surpassing 80% of its initial capacity, as illustrated in Figure 10. This observation signifies the potential of the composite material for repeated utilization in proficiently eliminating Pb2+ ions from wastewater streams.
Figure 11 displays the FTIR spectra of PACC during distinct phases: pre-adsorption, post-adsorption, and after regeneration. In the pre-adsorption stage, the FTIR spectrum reveals pronounced and intense peaks associated with certain functional groups, specifically -OH, C=O, C-O, and N-H bonds. Upon regeneration, the FTIR spectrum of PACC displays comparable peak intensities to its pre-adsorption state, resembling the initial FTIR spectrum of PACC before exposure to Pb2+ adsorption. This observation demonstrates the successful regeneration of the adsorption sites showing PACC’s reusability feature.
A proposed industrial setup for wastewater treatment is depicted in Figure 12. To showcase the practicality of a continuous adsorptive water treatment method, a rotating pattern of two parallel columns can be utilized for wastewater treatment, as illustrated in Figure 12. Each column can be filled with 50 g of PACC adsorbent and utilized for uninterrupted processing. Once 2.5 L of wastewater has been treated in Column A, the wastewater feed will be directed to Column B, while Column A undergoes simultaneous regeneration using the elution solvent. This method offers the advantage of simultaneous adsorption-desorption processes, therefore circumventing the drawbacks associated with conventional adsorbents, which necessitate costly operating and manufacturing methods, resulting in potential secondary pollution. The suggested approach is expected to mitigate environmental and health risks in comparison to alternative methods. A comprehensive life cycle assessment (LCA) can provide further evaluation and assessment of the environmental impact and sustainability aspects of this approach.

4. Conclusions

In conclusion, this study has thoroughly investigated the potential of coconut oil-based porous activated carbon composites (PACC) as a sustainable and cost-effective alternative to conventional sorbents. Our findings reveal that PACC exhibits robust adsorption capabilities for the removal of Pb2+ from aqueous solutions, as demonstrated by fixed-bed column studies, in accordance with the Thomas and Yoon–Nelson breakthrough curve models. These remarkable performance characteristics can be attributed to the outstanding physicochemical properties of PACC, including its high porosity, substantial cell size, and enhanced negative polarity. Furthermore, PACC stands out for its remarkable reusability, maintaining a significant adsorption capacity while upholding durability and structural stability, as confirmed by i-depth analyses of its physicochemical and thermal properties. Consequently, the exceptional attributes of PACC make a compelling case for its potential superiority and comparability to other biosorbents. The successful synthesis of PACC underscores its promise as an economically viable, environmentally friendly, and sustainable biosorbent for the large-scale removal of heavy metals, particularly Pb2+, from wastewater. This study paves the way for further exploration and application of PACC in addressing critical challenges associated with heavy metal pollution in aquatic environments.

Author Contributions

Conceptualization, R.M.D.F.; Data curation, R.J.R.E., T.R.B.T. and A.A.L. (Alona A. Lubguban); Formal analysis, R.G.D.J.; Funding acquisition, G.G.D., A.C.A. and A.A.L. (Arnold A. Lubguban); Methodology, R.J.R.E. and T.R.B.T.; Resources, R.M.D.F.; Software, R.M.D.F., R.J.R.E. and T.R.B.T.; Supervision, R.M.M., H.P.B. and A.A.L. (Arnold A. Lubguban); Writing—review and editing, R.F.A.J., R.Y.C., R.M.M., A.C.A., H.P.B. and A.A.L. (Arnold A. Lubguban). All authors have read and agreed to the published version of the manuscript.

Funding

The Department of Science and Technology—Accelerated Science and Technology Human Resource Development Program provided support for this study as part of the primary author’s scholarship program.

Informed Consent Statement

Not applicable.

Data Availability Statement

The datasets utilized and/or analyzed during the current study are available from the corresponding author upon reasonable request.

Acknowledgments

The authors wish to express their gratitude for the financial assistance provided by the Department of Science and Technology through the Niche Centers in the Region (NICER)—R&D Center for Sustainable Polymers.

Conflicts of Interest

The authors declare no conflict of interest.

References

  1. Zhao, X.; Li, Z.; Wang, D.; Li, J.; Zou, B.; Tao, Y.; Lei, L.; Qiao, F.; Huang, J. Assessment of residents’ total environmental exposure to heavy metals in China. Sci. Rep. 2019, 9, 16386. [Google Scholar] [CrossRef] [PubMed]
  2. Mohamed, M.H.; Udoetok, I.A.; Solgi, M.; Steiger, B.G.K.; Zhou, Z.; Wilson, L.D. Design of Sustainable Biomaterial Composite Adsorbents for Point-of-Use Removal of Lead Ions from Water. Front. Water 2022, 4, 739492. [Google Scholar] [CrossRef]
  3. Wang, Y.; Zhao, G.; Zhang, Q.; Wang, H.; Zhang, Y.; Cao, W.; Zhang, N.; Du, B.; Wei, Q. Electrochemical aptasensor based on gold modified graphene nanocomposite with different morphologies for ultrasensitive detection of Pb2+. Sens. Actuators B Chem. 2019, 288, 325–331. [Google Scholar] [CrossRef]
  4. Levallois, P.; Barn, P.; Valcke, M.; Gauvin, D.; Kosatsky, T. Public Health Consequences of Lead in Drinking Water. Curr. Environ. Health Rep. 2018, 5, 255–262. [Google Scholar] [CrossRef] [PubMed]
  5. Basu, M.; Guha, A.K.; Ray, L. Adsorption of Lead on Lentil Husk in Fixed Bed Column Bioreactor. Bioresour. Technol. 2019, 283, 86–95. [Google Scholar] [CrossRef]
  6. Renu, M.A.; Singh, K.; Upadhyaya, S.; Dohare, R. Removal of heavy metals from wastewater using modified agricultural adsorbents. Mater. Today Proc. 2017, 4, 10534–10538. [Google Scholar] [CrossRef]
  7. Kuang, Y.; Zhang, X.; Zhou, S. Adsorption of Methylene Blue in Water onto Activated Carbon by Surfactant Modification. Water 2020, 12, 587. [Google Scholar] [CrossRef]
  8. Maulina, S.; Iriansyah, M. Characteristics of activated carbon resulted from pyrolysis of the oil palm fronds powder. IOP Conf. Ser. Mater. Sci. Eng. 2018, 309, 012072. [Google Scholar] [CrossRef]
  9. Wang, B.; Lan, J.; Bo, C.; Gong, B.; Ou, J. Adsorption of heavy metal onto biomass-derived activated carbon: Review. RSC Adv. 2023, 13, 4275–4302. [Google Scholar] [CrossRef]
  10. Lou, X.-Y.; Boada, R.; Simonelli, L.; Valiente, M. Enhanced arsenite removal by superparamagnetic iron oxide nanoparticles in-situ synthesized on a commercial cube-shape sponge: Adsorption-oxidation mechanism. J. Colloid Interface Sci. 2022, 614, 460–467. [Google Scholar] [CrossRef] [PubMed]
  11. Hethnawi, A.; Manasrah, A.D.; Vitale, G.; Nassar, N.N. Fixed-bed column studies of total organic carbon removal from industrial wastewater by use of diatomite decorated with polyethylenimine-functionalized pyroxene nanoparticles. J. Colloid Interface Sci. 2018, 513, 28–42. [Google Scholar] [CrossRef] [PubMed]
  12. Sawant, S.Y.; Pawar, R.R.; Lee, S.-M.; Cho, M.H. Binder-free production of 3D N-doped porous carbon cubes for efficient Pb2+ removal through batch and fixed bed adsorption. J. Clean. Prod. 2017, 168, 290–301. [Google Scholar] [CrossRef]
  13. Kalaivani, S.S.; Muthukrishnaraj, A.; Sivanesan, S.; Ravikumar, L. Novel hyperbranched polyurethane resins for the removal of heavy metal ions from aqueous solution. Process Saf. Environ. Prot. 2016, 104, 11–23. [Google Scholar] [CrossRef]
  14. Prasad, P.S.; Gomathi, T.; Sudha, P.; Deepa, M.; Rambabu, K.; Banat, F. Biosilica/Silk Fibroin/Polyurethane biocomposite for toxic heavy metals removal from aqueous streams. Environ. Technol. Innov. 2022, 28, 102741. [Google Scholar] [CrossRef]
  15. Carriço, C.S.; Fraga, T.; Pasa, V.M. Production and characterization of polyurethane foams from a simple mixture of castor oil, crude glycerol and untreated lignin as bio-based polyols. Eur. Polym. J. 2016, 85, 53–61. [Google Scholar] [CrossRef]
  16. Kaikade, D.S.; Sabnis, A.S. Polyurethane foams from vegetable oil-based polyols: A review. Polym. Bull. 2022, 80, 2239–2261. [Google Scholar] [CrossRef]
  17. Dingcong, R.G.; Malaluan, R.M.; Alguno, A.C.; Estrada, D.J.E.; Lubguban, A.A.; Resurreccion, E.P.; Dumancas, G.G.; Al-Moameri, H.H.; Lubguban, A.A. A novel reaction mechanism for the synthesis of coconut oil-derived biopolyol for rigid poly(urethane-urea) hybrid foam application. RSC Adv. 2023, 13, 1985–1994. [Google Scholar] [CrossRef]
  18. De Franco, M.A.E.; de Carvalho, C.B.; Bonetto, M.M.; de Pelegrini Soares, R.; Féris, L.A. Removal of amoxicillin from water by adsorption onto activated carbon in batch process and fixed bed column: Kinetics, isotherms, experimental design and breakthrough curves modelling. J. Clean. Prod. 2017, 161, 947–956. [Google Scholar] [CrossRef]
  19. Bo, S.; Luo, J.; An, Q.; Xiao, Z.; Wang, H.; Cai, W.; Zhai, S.; Li, Z. Efficiently selective adsorption of Pb(II) with functionalized alginate-based adsorbent in batch/column systems: Mechanism and application simulation. J. Clean. Prod. 2019, 250, 119585. [Google Scholar] [CrossRef]
  20. Fouda-Mbanga, B.; Prabakaran, E.; Pillay, K. Synthesis and characterization of CDs/Al2O3 nanofibers nanocomposite for Pb2+ ions adsorption and reuse for latent fingerprint detection. Arab. J. Chem. 2020, 13, 6762–6781. [Google Scholar] [CrossRef]
  21. Recepoğlu, Y.K.; Kabay, N.; Ipek, I.Y.; Arda, M.; Yüksel, M.; Yoshizuka, K.; Nishihama, S. Packed bed column dynamic study for boron removal from geothermal brine by a chelating fiber and breakthrough curve analysis by using mathematical models. Desalination 2018, 437, 1–6. [Google Scholar] [CrossRef]
  22. De Franco, M.A.E.; de Carvalho, C.B.; Bonetto, M.M.; de Pelegrini Soares, R.; Féris, L.A. Diclofenac removal from water by adsorption using activated carbon in batch mode and fixed-bed column: Isotherms, thermodynamic study and breakthrough curves modeling. J. Clean. Prod. 2018, 181, 145–154. [Google Scholar] [CrossRef]
  23. Bulgariu, D.; Bulgariu, L. Sorption of Pb(II) onto a mixture of algae waste biomass and anion exchanger resin in a packed-bed column. Bioresour. Technol. 2013, 129, 374–380. [Google Scholar] [CrossRef] [PubMed]
  24. Thomas, H.C. chromatography: A problem in kinetics. Ann. N. Y. Acad. Sci. 1948, 49, 161–182. [Google Scholar] [CrossRef] [PubMed]
  25. Bohart, G.S.; Adams, E.Q. Some aspects of the behavior of charcoal with respect to chlorine. J. Am. Chem. Soc. 1920, 42, 523–544. [Google Scholar] [CrossRef]
  26. Hoang, M.T.; Pham, T.D.; Nguyen, V.T.; Nguyen, M.K.; Pham, T.T.; Van der Bruggen, B. Removal and recovery of lead from wastewater using an integrated system of adsorption and crystallization. J. Clean. Prod. 2019, 213, 1204–1216. [Google Scholar] [CrossRef]
  27. Yoon, Y.H.; Nelson, J.H. Application of Gas Adsorption Kinetics I. A Theoretical Model for Respirator Cartridge Service Life. Am. Ind. Hyg. Assoc. J. 1984, 45, 509–516. [Google Scholar] [CrossRef]
  28. Keshavarz, A.; Zilouei, H.; Abdolmaleki, A.; Asadinezhad, A.; Nikkhah, A.A. Impregnation of polyurethane foam with activated carbon for enhancing oil removal from water. Int. J. Environ. Sci. Technol. 2016, 13, 699–710. [Google Scholar] [CrossRef]
  29. Li, B.; Zhao, G.; Wang, G.; Zhang, L.; Gong, J.; Shi, Z. Biodegradable PLA/PBS open-cell foam fabricated by supercritical CO2 foaming for selective oil-adsorption. Sep. Purif. Technol. 2021, 257, 117949. [Google Scholar] [CrossRef]
  30. Qu, J.; Song, T.; Liang, J.; Bai, X.; Li, Y.; Wei, Y.; Huang, S.; Dong, L.; Jin, Y. Adsorption of lead (II) from aqueous solution by modified Auricularia matrix waste: A fixed-bed column study. Ecotoxicol. Environ. Saf. 2019, 169, 722–729. [Google Scholar] [CrossRef]
  31. Wang, S.; Jin, C.; Qian, W. Bi2O3 with activated carbon composite as a supercapacitor electrode. J. Alloys Compd. 2014, 615, 12–17. [Google Scholar] [CrossRef]
  32. Vuković, G.D.; Marinković, A.D.; Škapin, S.D.; Ristić, M.Đ.; Aleksić, R.; Perić-Grujić, A.A.; Uskoković, P.S. Removal of lead from water by amino modified multi-walled carbon nanotubes. Chem. Eng. J. 2011, 173, 855–865. [Google Scholar] [CrossRef]
  33. Hassan, A.; Abdel-Mohsen, A.; Elhadidy, H. Adsorption of arsenic by activated carbon, calcium alginate and their composite beads. Int. J. Biol. Macromol. 2014, 68, 125–130. [Google Scholar] [CrossRef]
  34. Wang, H.; Wang, Q.-S.; He, J.-J.; Mao, Z.-L.; Sun, J.-H. Study on the Pyrolytic Behaviors and Kinetics of Rigid Polyurethane Foams. Procedia Eng. 2013, 52, 377–385. [Google Scholar] [CrossRef]
  35. Xiong, L.W.; Badri, K.H. Preparation of polyurethane composites with activated carbon black as the reinforcing filler. J. Polym. Sci. Technol. 2018, 3, 11–18. [Google Scholar]
  36. Mathivanan, J.; Liu, H.; Gan, J.; Chandrasekaran, A.R.; Sheng, J. Fluorescent Aptaswitch for Detection of Lead Ions. ACS Appl. Bio Mater. 2022, 5, 5089–5093. [Google Scholar] [CrossRef]
  37. Eichhorn, S.J.; Sampson, W.W. Relationships between specific surface area and pore size in electrospun polymer fibre networks. J. R. Soc. Interface 2010, 7, 641–649. [Google Scholar] [CrossRef]
  38. Nam, G.; Choi, S.; Byun, H.; Rhym, Y.-M.; Shim, S.E. Preparation of macroporous carbon foams using a polyurethane foam template replica method without curing step. Macromol. Res. 2013, 21, 958–964. [Google Scholar] [CrossRef]
  39. El Malti, W.; Hamieh, M.; Noaman, A.; El-Dine, R.N.; Hijazi, A.; Al-Khatib, W. Polyurethane Loaded with Vegetable Activated Carbon for Heavy Metals Removal from Water. J. Ecol. Eng. 2021, 22, 99–110. [Google Scholar] [CrossRef]
  40. Udayakumar, M.; El Mrabate, B.; Koós, T.; Szemmelveisz, K.; Kristály, F.; Leskó, M.; Filep, A.; Géber, R.; Schabikowski, M.; Baumli, P.; et al. Synthesis of activated carbon foams with high specific surface area using polyurethane elastomer templates for effective removal of methylene blue. Arab. J. Chem. 2021, 14, 103214. [Google Scholar] [CrossRef]
  41. Mobasherpour, I.; Salahi, E.; Asjodi, A. Research on the Batch and Fixed-Bed Column Performance of Red Mud Adsorbents for Lead Removal. Can. Chem. Trans. 2014, 2, 83–96. [Google Scholar] [CrossRef]
  42. Albadarin, A.B.; Mangwandi, C.; Al-Muhtaseb, A.H.; Walker, G.M.; Allen, S.J.; Ahmad, M.N. Modelling and Fixed Bed Column Adsorption of Cr(VI) onto Orthophosphoric Acid-activated Lignin. Chin. J. Chem. Eng. 2012, 20, 469–477. [Google Scholar] [CrossRef]
  43. Makrigianni, V.; Giannakas, A.; Hela, D.; Papadaki, M.; Konstantinou, I. Adsorption of methylene blue dye by pyrolytic tire char in fixed-bed column. Desalin. Water Treat. 2017, 65, 346–358. [Google Scholar] [CrossRef]
  44. Gong, J.-L.; Zhang, Y.-L.; Jiang, Y.; Zeng, G.-M.; Cui, Z.-H.; Liu, K.; Deng, C.-H.; Niu, Q.-Y.; Deng, J.-H.; Huan, S.-Y. Continuous adsorption of Pb(II) and methylene blue by engineered graphite oxide coated sand in fixed-bed column. Appl. Surf. Sci. 2015, 330, 148–157. [Google Scholar] [CrossRef]
  45. Ahmad, A.A.; Hameed, B.H. Fixed-bed adsorption of reactive azo dye onto granular activated carbon prepared from waste. J. Hazard. Mater. 2010, 175, 298–303. [Google Scholar] [CrossRef]
  46. Boucherdoud, A.; Kherroub, D.E.; Bestani, B.; Benderdouche, N.; Douinat, O. Fixed-bed adsorption dynamics of methylene blue from aqueous solution using alginate-activated carbon composites adsorbents. Alger. J. Environ. Sci. Technol. Month Ed. 2022, 8. [Google Scholar]
  47. Dotto, G.; dos Santos, J.N.; Rosa, R.; Pinto, L.; Pavan, F.; Lima, E. Fixed bed adsorption of Methylene Blue by ultrasonic surface modified chitin supported on sand. Chem. Eng. Res. Des. 2015, 100, 302–310. [Google Scholar] [CrossRef]
  48. Li, Y.; Zhu, Y.; Zhu, Z.; Zhang, X.; Wang, D.; Xie, L. Fixed-bed column adsorption of arsenic(v) by porous composite of magnetite/hematite/carbon with eucalyptus wood microstructure. J. Environ. Eng. Landsc. Manag. 2018, 26, 38–56. [Google Scholar] [CrossRef]
  49. El Mouhri, G.; Merzouki, M.; Belhassan, H.; Miyah, Y.; Amakdouf, H.; Elmountassir, R.; Lahrichi, A. Continuous Adsorption Modeling and Fixed Bed Column Studies: Adsorption of Tannery Wastewater Pollutants Using Beach Sand. J. Chem. 2020, 2020, 1–9. [Google Scholar] [CrossRef]
  50. Gomaa, H.; Shenashen, M.A.; Yamaguchi, H.; Alamoudi, A.S.; Abdelmottaleb, M.; Cheira, M.F.; El-Naser, T.A.S.; El-Safty, S.A. Highly-efficient removal of AsV, Pb2+, Fe3+, and Al3+ pollutants from water using hierarchical, microscopic TiO2 and TiOF2 adsorbents through batch and fixed-bed columnar techniques. J. Clean. Prod. 2018, 182, 910–925. [Google Scholar] [CrossRef]
  51. Khan, M.R.; Hegde, R.A.; Shabiimam, M.A. Adsorption of Lead by Bentonite Clay. Int. J. Sci. Res. Manag. 2017, 5, 5800–5804. [Google Scholar] [CrossRef]
  52. Pap, S.; Radonić, J.; Trifunović, S.; Adamović, D.; Mihajlović, I.; Miloradov, M.V.; Sekulić, M.T. Evaluation of the adsorption potential of eco-friendly activated carbon prepared from cherry kernels for the removal of Pb2+, Cd2+ and Ni2+ from aqueous wastes. J. Environ. Manag. 2016, 184, 297–306. [Google Scholar] [CrossRef] [PubMed]
  53. Choudhary, V.; Patel, M.; Pittman, C.U., Jr.; Mohan, D. Batch and Continuous Fixed-Bed Lead Removal Using Himalayan Pine Needle Biochar: Isotherm and Kinetic Studies. ACS Omega 2020, 5, 16366–16378. [Google Scholar] [CrossRef] [PubMed]
  54. Lim, A.P.; Aris, A.Z. Continuous fixed-bed column study and adsorption modeling: Removal of cadmium (II) and lead (II) ions in aqueous solution by dead calcareous skeletons. Biochem. Eng. J. 2014, 87, 50–61. [Google Scholar] [CrossRef]
  55. Liu, Y.; Gao, Q.; Pu, S.; Wang, H.; Xia, K.; Han, B.; Zhou, C. Carboxyl-functionalized lotus seedpod: A highly efficient and reusable agricultural waste-based adsorbent for removal of toxic Pb2+ ions from aqueous solution. Colloids Surfaces A Physicochem. Eng. Asp. 2019, 568, 391–401. [Google Scholar] [CrossRef]
  56. Chatterjee, S.; Mondal, S.; De, S. Design and scaling up of fixed bed adsorption columns for lead removal by treated laterite. J. Clean. Prod. 2018, 177, 760–774. [Google Scholar] [CrossRef]
  57. Futalan, C.M.; Wan, M.-W. Fixed-Bed Adsorption of Lead from Aqueous Solution Using Chitosan-Coated Bentonite. Int. J. Environ. Res. Public Health 2022, 19, 2597. [Google Scholar] [CrossRef]
  58. Chu, K.H. Breakthrough curve analysis by simplistic models of fixed bed adsorption: In defense of the century-old Bohart-Adams model. Chem. Eng. J. 2020, 380, 122513. [Google Scholar] [CrossRef]
  59. Sreenivas, K.; Inarkar, M.; Gokhale, S.; Lele, S. Re-utilization of ash gourd (Benincasa hispida) peel waste for chromium (VI) biosorption: Equilibrium and column studies. J. Environ. Chem. Eng. 2014, 2, 455–462. [Google Scholar] [CrossRef]
  60. Dorado, A.D.; Gamisans, X.; Valderrama, C.; Solé, M.; Lao, C. Cr(III) removal from aqueous solutions: A straightforward model approaching of the adsorption in a fixed-bed column. J. Environ. Sci. Health Part A 2014, 49, 179–186. [Google Scholar] [CrossRef]
  61. Anwar, J.; Shafique, U.; Zaman, W.U.; Salman, M.; Dar, A.; Anwar, S. Removal of Pb(II) and Cd(II) from water by adsorption on peels of banana. Bioresour. Technol. 2010, 101, 1752–1755. [Google Scholar] [CrossRef] [PubMed]
  62. Mittal, H.; Maity, A.; Ray, S.S. The Adsorption of Pb2+ and Cu2+ onto Gum Ghatti-Grafted Poly(acrylamide-co-acrylonitrile) Biodegradable Hydrogel: Isotherms and Kinetic Models. J. Phys. Chem. B 2015, 119, 2026–2039. [Google Scholar] [CrossRef]
  63. Ma, J.; Xia, M.; Zhu, S.; Wang, F. A new alendronate doped HAP nanomaterial for Pb2+, Cu2+ and Cd2+ effect absorption. J. Hazard. Mater. 2020, 400, 123143. [Google Scholar] [CrossRef] [PubMed]
  64. Iqbal, M.; Saeed, A.; Zafar, S.I. FTIR spectrophotometry, kinetics and adsorption isotherms modeling, ion exchange, and EDX analysis for understanding the mechanism of Cd2+ and Pb2+ removal by mango peel waste. J. Hazard. Mater. 2009, 164, 161–171. [Google Scholar] [CrossRef] [PubMed]
  65. Purvis, B.; Mao, Y.; Robinson, D. Three pillars of sustainability: In search of conceptual origins. Sustain. Sci. 2019, 14, 681–695. [Google Scholar] [CrossRef]
Figure 1. Laboratory-scale fixed-bed column setup using polyurethane-activated carbon composite (PACC) as a sorbent material.
Sustainability 15 14344 g001
Figure 2. SEM images of blank polyurethane foam (a.1,a.2), polyurethane-activated carbon composite (b.1,b.2), polyurethane-activated carbon composite after lead adsorption (c.1,c.2).
Sustainability 15 14344 g002
Figure 3. Fourier transform infrared (FTIR) spectra of blank polyurethane foam, polyurethane-activated carbon composite (PACC), and PACC after Pb adsorption.
Sustainability 15 14344 g003
Figure 4. XRD profile of a blank polyurethane (PU) and polyurethane-activated carbon composite (PACC).
Sustainability 15 14344 g004
Figure 5. TGA-DTG curves of (a) polyurethane (PU), (b) polyurethane-activated carbon composite (PACC), and (c) PACC composite after adsorption.
Sustainability 15 14344 g005
Figure 6. Breakthrough curves for Pb2+ adsorption on polyurethane-activated carbon composite (PACC) at different bed heights.
Sustainability 15 14344 g006
Figure 7. Breakthrough curves for Pb2+ adsorption on polyurethane-activated carbon composite (PACC) at different flow rates.
Sustainability 15 14344 g007
Figure 8. Breakthrough curves for Pb2+ adsorption on polyurethane-activated carbon composite (PACC) at different initial concentrations.
Sustainability 15 14344 g008
Figure 9. Breakthrough curves for Pb2+ adsorption on polyurethane-activated carbon composite (PACC) at different pH values.
Sustainability 15 14344 g009
Figure 10. Regeneration performance of polyurethane-activated carbon composite (PACC) in sequestering Pb2+ in fixed-bed column.
Sustainability 15 14344 g010
Figure 11. Fourier transform infrared (FTIR) spectra of polyurethane-activated carbon composite (PACC), PACC after Pb adsorption, and PACC after regeneration.
Sustainability 15 14344 g011
Figure 12. Continuous adsorption unit process diagram using polyurethane-activated carbon composite (PACC) as a sorbent material.
Sustainability 15 14344 g012
Table 1. Integration of A-side components, B-side components, and filler in the formulation of polyurethane-activated carbon composite (PACC) material.
IngredientsConcentration
(Based on 100 Parts Polyol)
B-side Components
VORANOL® 4701 (petroleum-based polyol)80.00
Coconut-based polyol20.00
Polycat® 8 (gelling catalyst)0.50
INV® 690 (surfactant)1.75
Silicon oil5.00
Fillers
Coconut activated carbon40.00
A-side Component
Isocyanate index of PAPI® 27100.0
Table 2. Elemental composition comparison of blank PU (a), PACC (b), and PACC after lead adsorption (c).
ElementWt%
abcDifference (b−a)Difference (c−b)
CK53.28 ± 1.1355.13 ± 1.0556.11 ± 1.031.85−4.02
NK12.58 ± 1.0010.58 ± 0.819.56 ± 0.79−2.003.98
OK23.73 ± 1.1933.60 ± 1.2221.27 ± 1.209.87−4.33
SiK1.31 ± 0.010.60 ± 0.010.51 ± 0.01
PtK3.10 ± 0.800.09 ± 0.110.18 ± 0.09
PbK0.000.0012.37 ± 0.16
O/C0.450.610.3835.55%−37.70%
(O+N)/C0.680.800.5517.65%−31.25%
Table 3. Data parameters attained at different bed heights, pH, flow rates, and inlet Pb concentrations (T = 28 ± 1 °C).
Data parameters attained at different bed heights with constant initial concentration (50 mg L−1), flow rate (4 mL min−1), and pH (6)
Bed height
(mm)
Total time
(min)
Total mass adsorbed, qtotal
(mg)
Equilibrium uptake, qeq
(mg g−1)
Effluent volume
(mL)
5019035.857.17760
100240106.310.63960
150300125.78.381200
Data parameters attained at different initial concentrations with constant bed height (100 mm), flow rate (4 mL min−1), and pH (6)
Initial Concentration
(mg L−1)
Total time
(min)
Total mass adsorbed, qtotal
(mg)
Equilibrium uptake, qeq
(mg g−1)
Effluent volume
(mL)
1029094.69.461100
50240106.610.66960
100180135.413.54270
Data parameters attained at different flow rates with constant bed height (100 mm), initial concentration (50 mg L−1), and pH (6)
Flow rate
(mL min−1)
Total time
(min)
Total mass adsorbed, qtotal
(mg)
Equilibrium uptake, qeq
(mg g−1)
Effluent volume
(mL)
4250106.610.661000
6195105.610.561170
815086.68.661200
Data parameters attained at different pH with constant bed height (100 mm), initial concentration (50 mg L−1), and flow rate (4 mL min−1)
pHTotal time
(min)
Total mass adsorbed, qtotal
(mg)
Equilibrium uptake, qeq
(mg g−1)
Effluent volume
(mL)
2265220.322.031060
4300280.028.001200
6250107.010.701000
Table 4. Thomas model parameters at different conditions using linear regression analysis.
Parameter kTh
(L mg−1 min−1) × 10−4
qTh
(mg g−1)
R2
Flow rate 42.110.37740.8801
(mL min−1)63.130.38660.8764
84.320.97250.9122
Bed height (mm)503.500.71060.9354
1002.110.37740.8801
1501.730.36900.8284
pH21.500.82670.8801
41.801.80250.9784
62.110.37740.8801
Initial metal103.530.27060.9301
concentration 502.110.37740.8801
(mg L−1)1001.640.73560.8664
Table 5. Bohart–Adams model parameters at different conditions using linear regression analysis.
Parameter KAB
(L mg−1 min−1) × 10−5
N0
(mg L−1)
R2
Flow rate 42.440.60230.6781
(mL min−1)62.930.71810.5621
82.300.75030.7032
Bed height (mm)502.250.91500.8164
1002.440.60230.6781
1501.830.50350.6132
23.100.70410.6789
pH42.890.82780.8954
62.440.60230.6781
Initial metal104.050.40370.8381
concentration 502.440.60230.6781
(mg L−1)1001.330.89800.6964
Table 6. Yoon–Nelson model parameters at different conditions using linear regression analysis.
Parameter kYN
(mg−1 min−1) ×
10−2
Tcalc
(min)
R2
Flow rate 42.119.43820.8801
(mL min−1)63.136.44450.8764
84.325.89820.9122
Bed height (mm)53.508.88420.9354
102.119.43820.8801
151.7313.84220.8284
pH21.5020.67060.8801
41.7745.06410.9784
62.119.43820.8801
Initial metal101.7213.52440.9301
concentration 502.119.43820.8801
(mg L−1)1003.249.19650.8664
Table 7. Parameters of “a” and “b” of generic model (Equation (7)) formulated using variables of different models.
ThomasBohart–AdamsYoon–Nelson
akThCokBACokYN
bkThqThM/QkBANoZ/ukYNτ
Table 8. Merits and limitations of column models employed in this study in relation to PACC.
MeritsLimitations
Thomas model
  • Appropriate for sizeable bed depth adsorbent of Pb2+ columns
  • Best fitted for columns with mass transfer resistance
  • Insufficient representation for Pb2+ columns with shorter bed lengths
Bohart–Adams
  • Offered an estimation of the equilibrium concentration of the adsorbate
  • Require additional parameters for the model to be utilized
  • Insufficiently described the behaviors of the metal columns
  • Only applicable to adsorption processes involving surface reactions
Yoon–Nelson model
  • Requires fewer parameters for computation
  • The projected 50% breakthrough time was realistic
  • Inadequate for Pb2+ columns with a shallow bed depth of adsorbent
Table 9. Summary of capacity uptake of other adsorbents used for Pb2+ adsorption.
Adsorbentqeq (mg g−1)Reference
PACC28.00Present study
Rice husk ash12.6[60]
Coir18.9[61]
Papaya wood17.4[62]
Hazelnut shell16.23[63]
Olive pomace7.0[62]
Jute17.8[63]
Olive stone waste14.5[64]
Disclaimer/Publisher’s Note: The statements, opinions and data contained in all publications are solely those of the individual author(s) and contributor(s) and not of MDPI and/or the editor(s). MDPI and/or the editor(s) disclaim responsibility for any injury to people or property resulting from any ideas, methods, instructions or products referred to in the content.

