
Assessing the Sustainability Impacts of the Xiaolangdi Dam: Land Use and Socioeconomic Change in the Middle and Lower Reaches of the Yellow River Basin

 ,
, 
Abstract
:1. Introduction
2. Materials and Methods
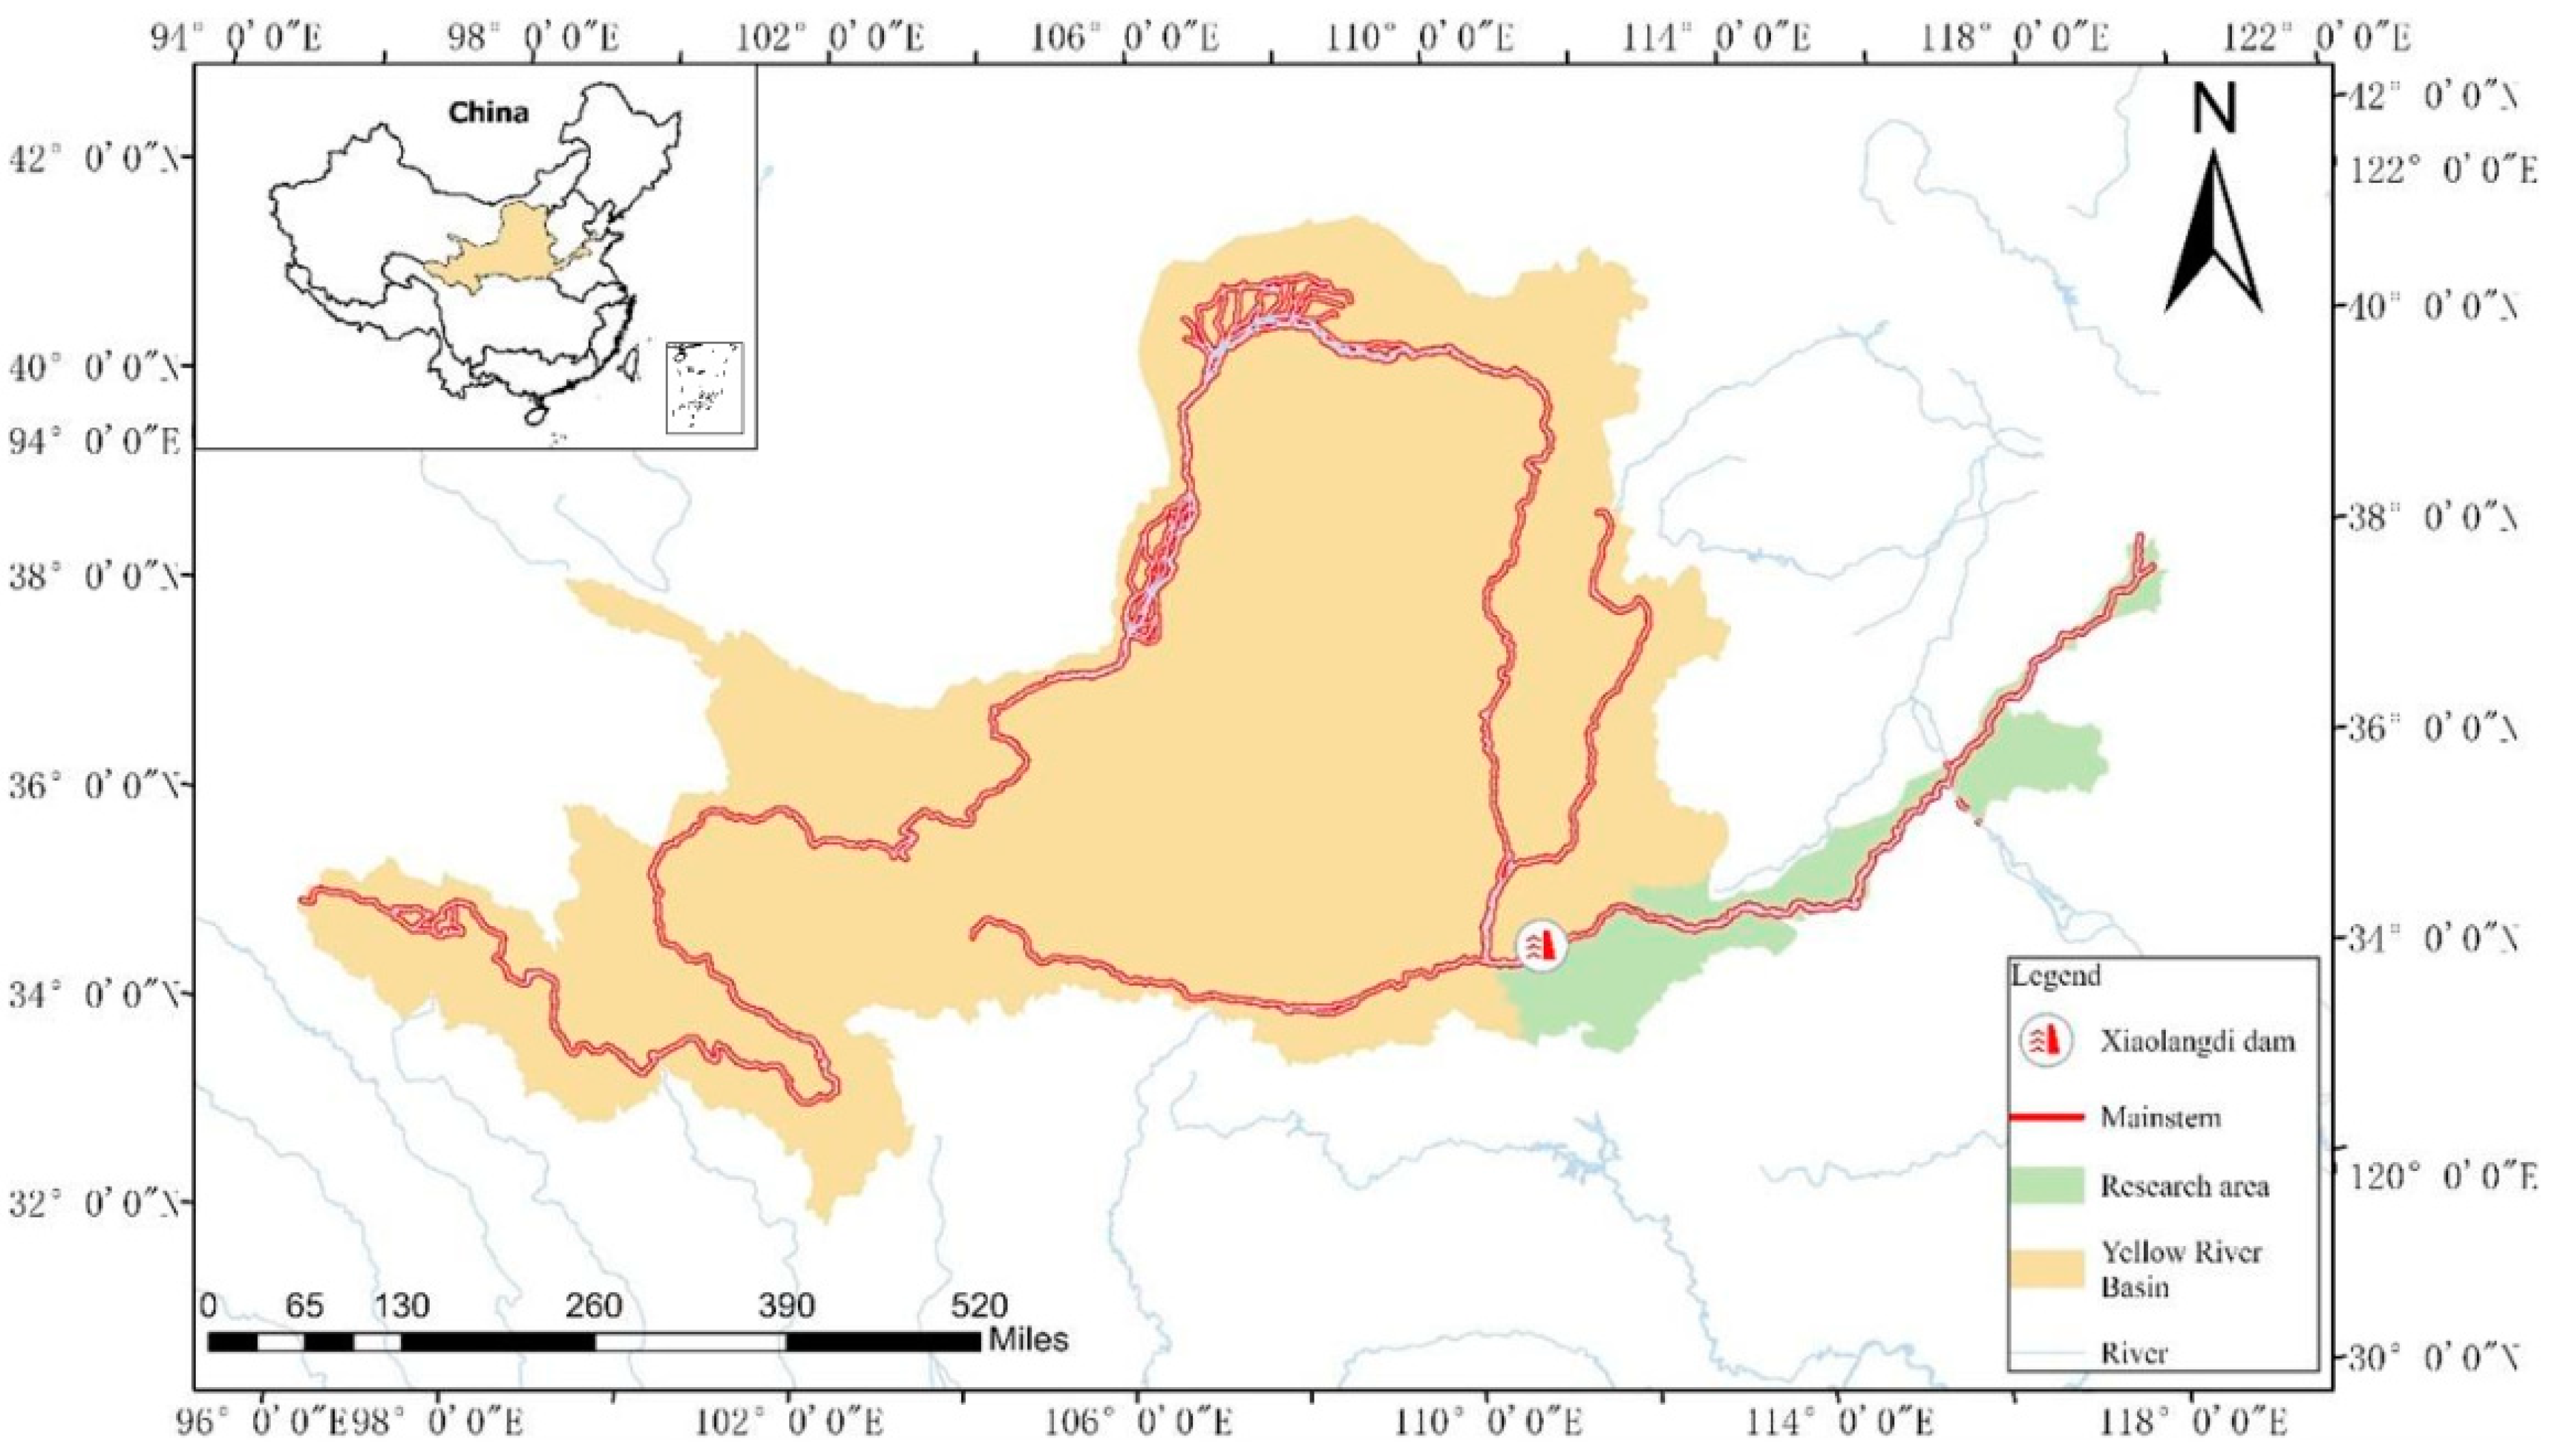
2.1. Research Area
2.2. Data Resources
2.3. Analysis of Land Use Change Rate
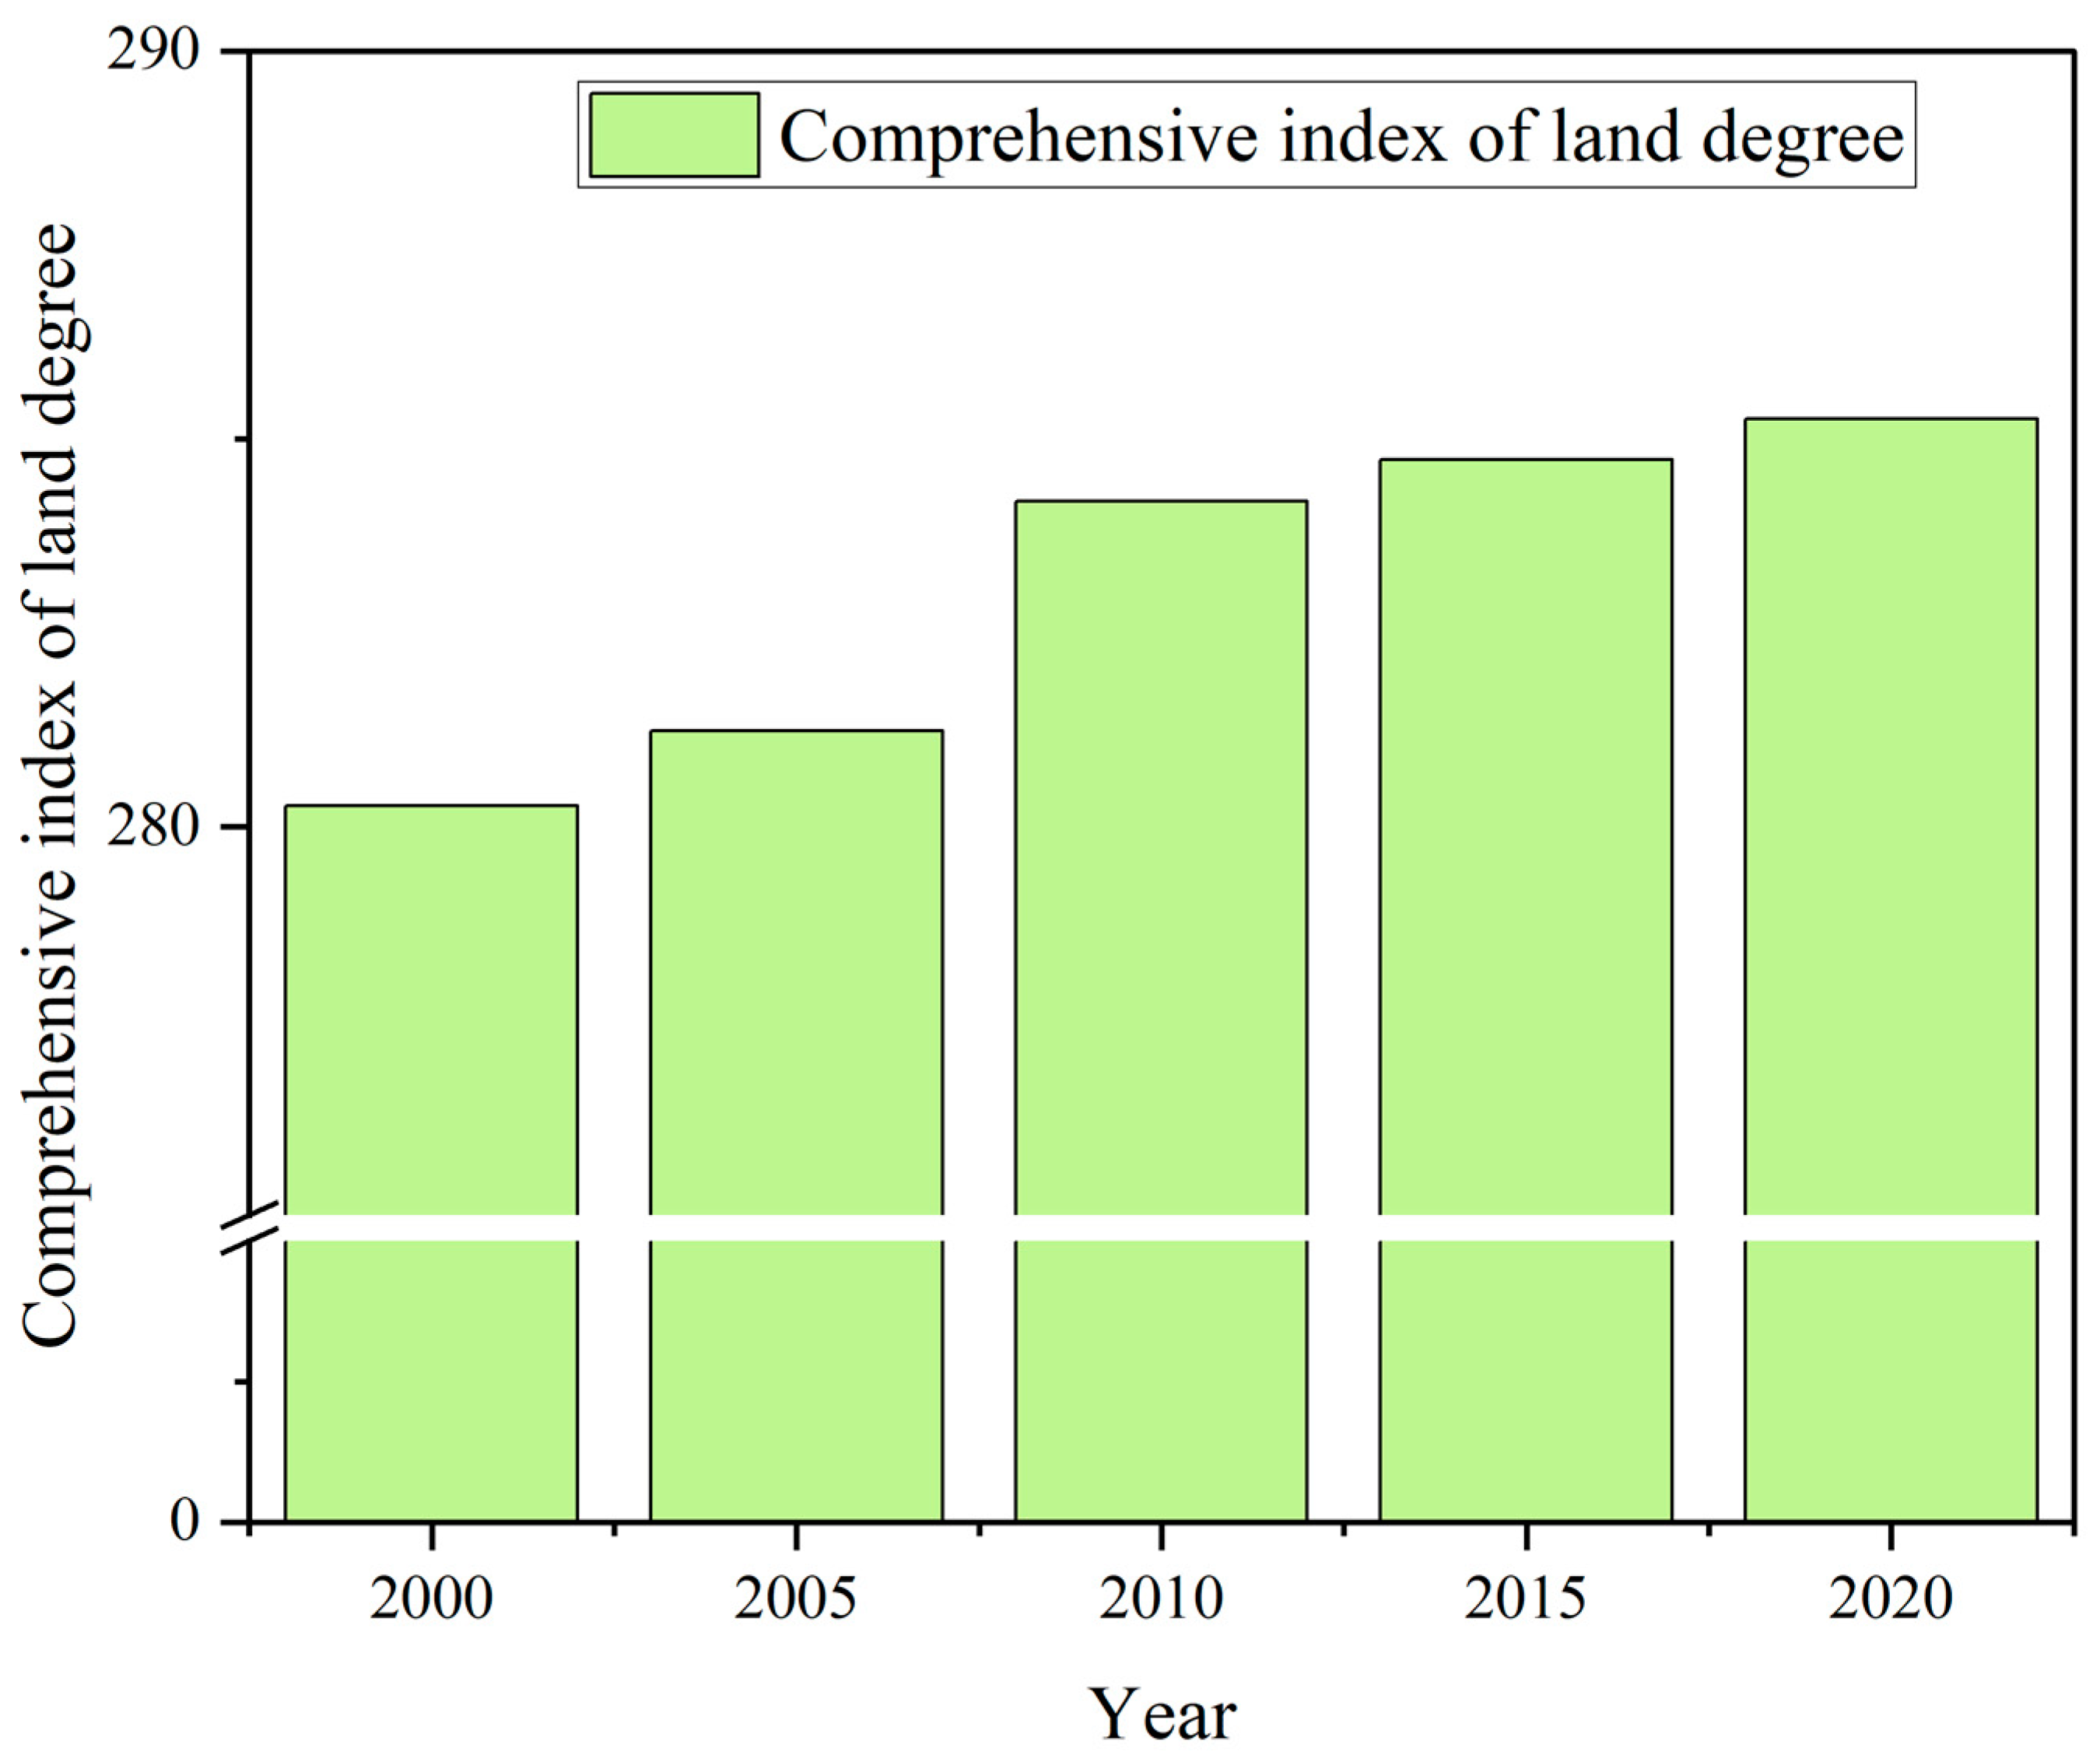
2.4. Comprehensive Index of Land Use
2.5. Correlation Analysis between Land Use Change and Socio-Economic Indicators
3. Results
3.1. Analysis of the Characteristics of Land Use Change
3.2. Time Change Characteristics of Land Use Types
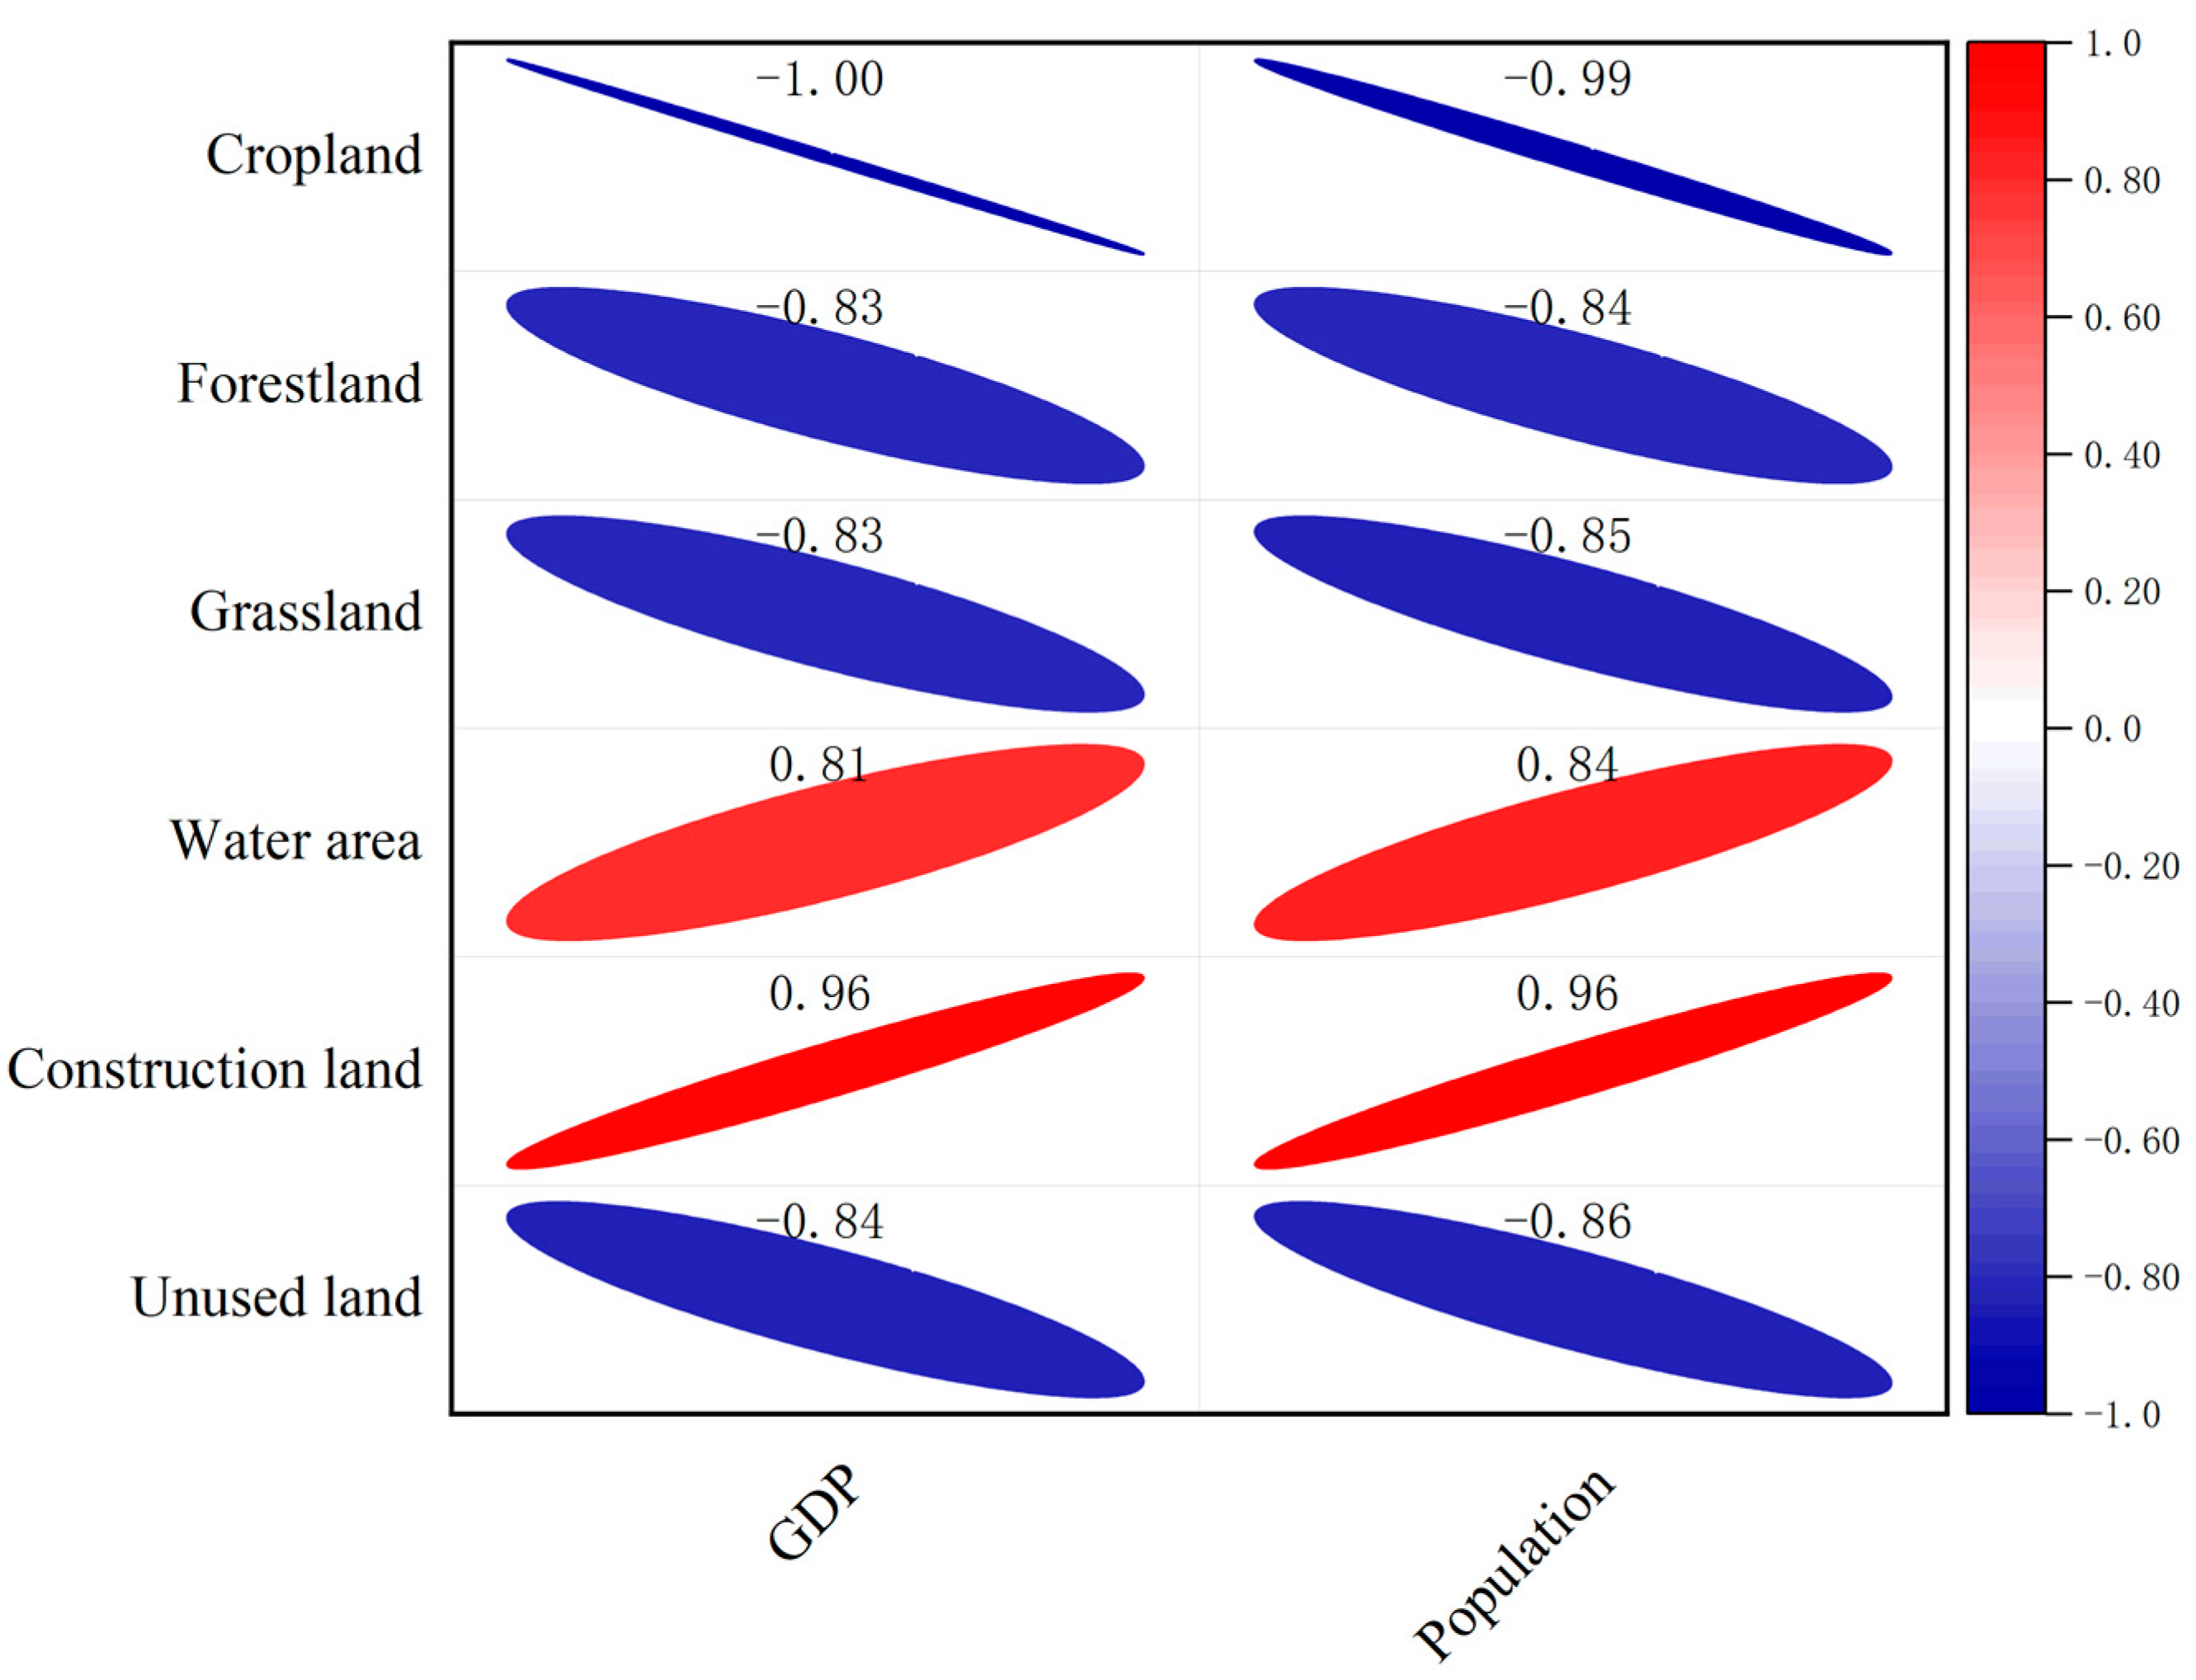
3.3. Correlation Analysis between Land Use Change and Socio-Economic Indicators
4. Discussion
5. Conclusions
Author Contributions
Funding
Institutional Review Board Statement
Informed Consent Statement
Data Availability Statement
Conflicts of Interest
References
- Loos, J.R.; Andersson, K.; Bulger, S.; Cody, K.C.; Cox, M.; Gebben, A.; Smith, S.M. Individual to collective adaptation through incremental change in Colorado groundwater governance. Front. Environ. Sci. 2022, 10, 958597. [Google Scholar] [CrossRef]
- Dahlmann, H.; Stephan, R.; Stahl, K. Upstream-downstream asymmetries of drought impacts in major river basins of the European Alps. Front. Water 2022, 4, 1061991. [Google Scholar] [CrossRef]
- Beck, M.W.; Claassen, A.H.; Hundt, P.J. Environmental and livelihood impacts of dams: Common lessons across development gradients that challenge sustainability. Int. J. River Basin Manag. 2012, 10, 73–92. [Google Scholar] [CrossRef]
- Llamosas, C. Energy security and capabilities in asymmetrical settings: An analysis of the effects of the Itaipú transboundary dam. Energy Sustain. Dev. 2023, 74, 269–284. [Google Scholar] [CrossRef]
- Strzepek, K.M.; Yohe, G.W.; Tol, R.S.J.; Rosegrant, M.W. The value of the high Aswan Dam to the Egyptian economy. Ecol. Econ. 2008, 66, 117–126. [Google Scholar] [CrossRef]
- Sun, X.P.; He, S.M.; Guo, Y.; Sima, W.; Liu, W.F.; Wang, Y.H. Comprehensive evaluation of the impact of the water conservancy project in on the ecosystem of the Yangtze river basin. J. Coast. Res. 2019, 94, 758–762. [Google Scholar] [CrossRef]
- Zhu, W.Q.; Ren, G.B.; Wang, J.P.; Wang, J.B.; Hu, Y.B.; Lin, Z.Y.; Li, W.; Zhao, Y.J.; Li, S.B.; Wang, N. Monitoring the invasive plant spartina alterniflora in Jiangsu Coastal Wetland using MRCNN and long-time series landsat data. Remote Sens. 2022, 14, 2630. [Google Scholar] [CrossRef]
- Zhu, Z.; Mei, Z.; Li, S.; Ren, G.; Feng, Y. Evaluation of Ecological Carrying Capacity and Identification of Its Influencing Factors Based on Remote Sensing and Geographic Information System: A Case Study of the Yellow River Basin in Shaanxi. Land 2022, 11, 1080. [Google Scholar] [CrossRef]
- Izakovičová, Z.; Mederly, P.; Petrovič, F. Long-term land use changes driven by urbanisation and their environmental effects (Example of Trnava City, Slovakia). Sustainability 2017, 9, 1553. [Google Scholar] [CrossRef]
- Sterner, S.; Aslan, C.; Best, R.; Chaudhry, T. Forest management effects on vegetation regeneration after a high severity wildfire: A case study in the southern Cascade range. For. Ecol. Manag. 2022, 520, 120394. [Google Scholar] [CrossRef]
- Ru, X.; Song, H.; Xia, H.; Zhai, S.; Wang, Y.; Min, R.; Zhang, H.; Qiao, L. Effects of Land Use and Land Cover Change on Temperature in Summer over the Yellow River Basin, China. Remote Sens. 2022, 14, 4352. [Google Scholar] [CrossRef]
- Lara, C.; Martinez-Bolaños, E.; López-Vázquez, K.; Díaz-Castelazo, C.; Castillo-Guevara, C.; Cuautle, M. Effect of agricultural land-use change on the structure of a temperate forest ant–plant interaction network. Entomol. Sci. 2020, 23, 128–141. [Google Scholar] [CrossRef]
- Pathirana, A.; Denekew, H.B.; Veerbeek, W.; Zevenbergen, C.; Banda, A.T. Impact of urban growth-driven landuse change on microclimate and extreme precipitation—A sensitivity study. Atmos. Res. 2014, 138, 59–72. [Google Scholar] [CrossRef]
- Kong, D.; Miao, C.; Wu, J.; Borthwick, A.G.; Duan, Q.; Zhang, X. Environmental impact assessments of the Xiaolangdi Reservoir on the most hyperconcentrated laden river, Yellow River, China. Environ. Sci. Pollut. Res. Int. 2017, 24, 4337–4351. [Google Scholar] [CrossRef] [PubMed]
- Chang, J. Impact of Xiaolangdi Dam on Agricultural Landscape in the Middle and Lower Reaches of The Yellow River; Henan University: Kaifeng, China, 2021. (In Chinese) [Google Scholar]
- Kong, D.X.; Miao, C.Y.; Duan, Q.Y.; Li, J.H.; Zheng, H.Y.; Gou, J.J. Xiaolangdi Dam: A valve for streamflow extremes on the lower Yellow RiverWang. J. Hydrol. 2022, 606, 127426. [Google Scholar] [CrossRef]
- Xu, X.; Liu, J.; Zhang, S.; Li, R.; Yan, C.; Wu, S.; China Many Periods of Land Use Remote Sensing Monitoring Data Set (CNLUCC). Data Registration and Publishing System of the Resource and Environmental Science Data Center of the Chinese Academy of Sciencesresources and Environment Science Data Registration and Publication System. 2018. Available online: https://www.resdc.cn/DOI/DOI.aspx?DOIID=54 (accessed on 30 June 2023).
- Liu, Y.; Wang, Y.; Lin, Y.; Ma, X.; Guo, S.; Ouyang, Q.; Sun, C. Habitat Quality Assessment and Driving Factors Analysis of Guangdong Province, China. Sustainability 2023, 15, 11615. [Google Scholar] [CrossRef]
- Zhuang, D.F.; Liu, J.Y. Study on the model of regional differentiation of land use degree in China. J. Nat. Resour. 1997, 12, 10–16. (In Chinese) [Google Scholar]
- Xu, X.; Gao, Q.; Peng, C.H.; Cui, X.F.; Liu, Y.H.; Jiang, L. Integrating global socio-economic influences into a regional land use change model for China. Front. Earth Sci. 2014, 8, 81–92. [Google Scholar] [CrossRef]
- Lu, J.; Li, L.; Jiang, E.; Gan, R.; Liu, C.; Deng, Y. Ecological Water Demand Estimations for Desert Terminal Lake Survival under Inland River Water Diversion Regulation. Water 2023, 15, 66. [Google Scholar] [CrossRef]
- Wang, A.; Wang, S.; Liang, S.; Yang, R.; Yang, M.; Yang, J. Research on Ecological Protection and High-Quality Development of the Lower Yellow River Based on System Dynamics. Water 2023, 15, 3046. [Google Scholar] [CrossRef]
- Li, Y.; Li, Y.; Duan, X.; Cai, Z.; Li, Y.; He, B.; Yin, L. Trade-off analyses between food provision and soil conservation service of Grain for Green Program in Mountainous Area. Int. Soil Water Conserv. Res. 2023; in press. [Google Scholar] [CrossRef]
- Ma, X.; Zhang, H. Land-Use/Land-Cover Change and Ecosystem Service Provision in Qinghai Province, China: From the Perspective of Five Ecological Function Zones. Land 2023, 12, 656. [Google Scholar] [CrossRef]
- Liu, C.; Xu, Y.Q.; Sun, P.L.; Huang, A.; Zheng, W.R. Land use change and its driving forces toward mutual conversion in Zhangjiakou City, a farming-pastoral ecotone in Northern China. Environ. Monit. Assess. 2017, 189, 10. [Google Scholar] [CrossRef] [PubMed]
- Wang, R.Y.; Tan, R. Efficiency and distribution of rural construction land marketization in contemporary China. China Econ. Rev. 2020, 60, 101223. [Google Scholar] [CrossRef]
- Wang, Z.M.; Liu, Z.X.; Liu, J. Innovation strategy or policy pressure? The motivations of BIM adoption in China’s AEC enterprises. J. Asian Archit. Build. Eng. 2022, 21, 1578–1589. [Google Scholar] [CrossRef]
- Ma, J.J.; Chen, J.J.; Chen, W.X.; Huang, L.C. A coupled thermal-elastic-plastic-damage model for concrete subjected to dynamic loading. Int. J. Plast. 2022, 153, 103279. [Google Scholar] [CrossRef]
- Hagos, G. Land Use-Land Cover dynamics of Huluka watershed, Central Rift Valley, Ethiopia. Int. Soil Water Conserv. Res. 2014, 2, 25–33. [Google Scholar] [CrossRef]
- Wang, S.Y.; Zhang, B.; Yang, C.J.; Zhao, Y.; Wang, H. Temporal change and suitability assessment of cropland in the Yellow River Basin during 1990–2005. Int. J. Geogr. Inf. Sci. 2012, 26, 519–539. [Google Scholar] [CrossRef]


| Data Type | Data Resource | Time Resolution | Spatial Resolution | Remarks |
|---|---|---|---|---|
| Population (person/km2) | National Earth System Science Data Center | 2000, 2005, 2010, 2015, 2020 | 1 km | Statistical yearbook of Shandong Province and Henan Province |
| GDP (ten thousand CNY/km2) | National Earth System Science Data Center | 2000, 2005, 2010, 2015, 2020 | 1 km | Statistical yearbook of Shandong Province and Henan Province |
| Land use | Resources and Environmental Sciences and Data Center | 2000, 2005, 2010, 2015, 2020 | 1 km | Landsat TM/ETM |
| Item | Year | Land Use Type | |||||
|---|---|---|---|---|---|---|---|
| Cropland | Forestland | Grassland | Water Area | Construction Land | Unused Land | ||
| Area proportion (%) | 2000 | 58.78 | 16.29 | 9.42 | 3.81 | 11.07 | 0.64 |
| 2005 | 58.45 | 16.25 | 8.68 | 4.49 | 11.64 | 0.49 | |
| 2010 | 58.13 | 16.06 | 7.74 | 4.70 | 13.14 | 0.22 | |
| 2015 | 57.49 | 16.06 | 7.74 | 4.77 | 13.73 | 0.21 | |
| 2020 | 56.90 | 16.06 | 7.73 | 4.81 | 14.28 | 0.21 | |
| Area change (km2) | 2000–2005 | −195 | −24 | −439 | 405 | 341 | −88 |
| 2005–2010 | −187 | −114 | −558 | 128 | 893 | −162 | |
| 2010–2015 | −383 | 2 | −3 | 40 | 347 | −3 | |
| 2015–2020 | −348 | 0 | −4 | 25 | 329 | −2 | |
| 2000–2020 | −1113 | −136 | −1004 | 598 | 1910 | −255 | |
| Period | Cropland | Forestland | Grassland | Water Area | Construction Land | Unused Land | Dynamic Degree of Land Use |
|---|---|---|---|---|---|---|---|
| 2000–2005 | −0.11 | −0.05 | −1.57 | 3.58 | 1.04 | −4.63 | 10.98 |
| 2005–2010 | −0.11 | −0.24 | −2.16 | 0.96 | 2.58 | −11.10 | 17.14 |
| 2010–2015 | −0.22 | 0.00 | −0.01 | 0.29 | 0.89 | −0.46 | 1.88 |
| 2015–2020 | −0.20 | 0.00 | −0.02 | 0.18 | 0.81 | −0.31 | 1.52 |
| 2000–2020 | −0.16 | −0.07 | −0.90 | 1.32 | 1.45 | −3.36 | 7.26 |
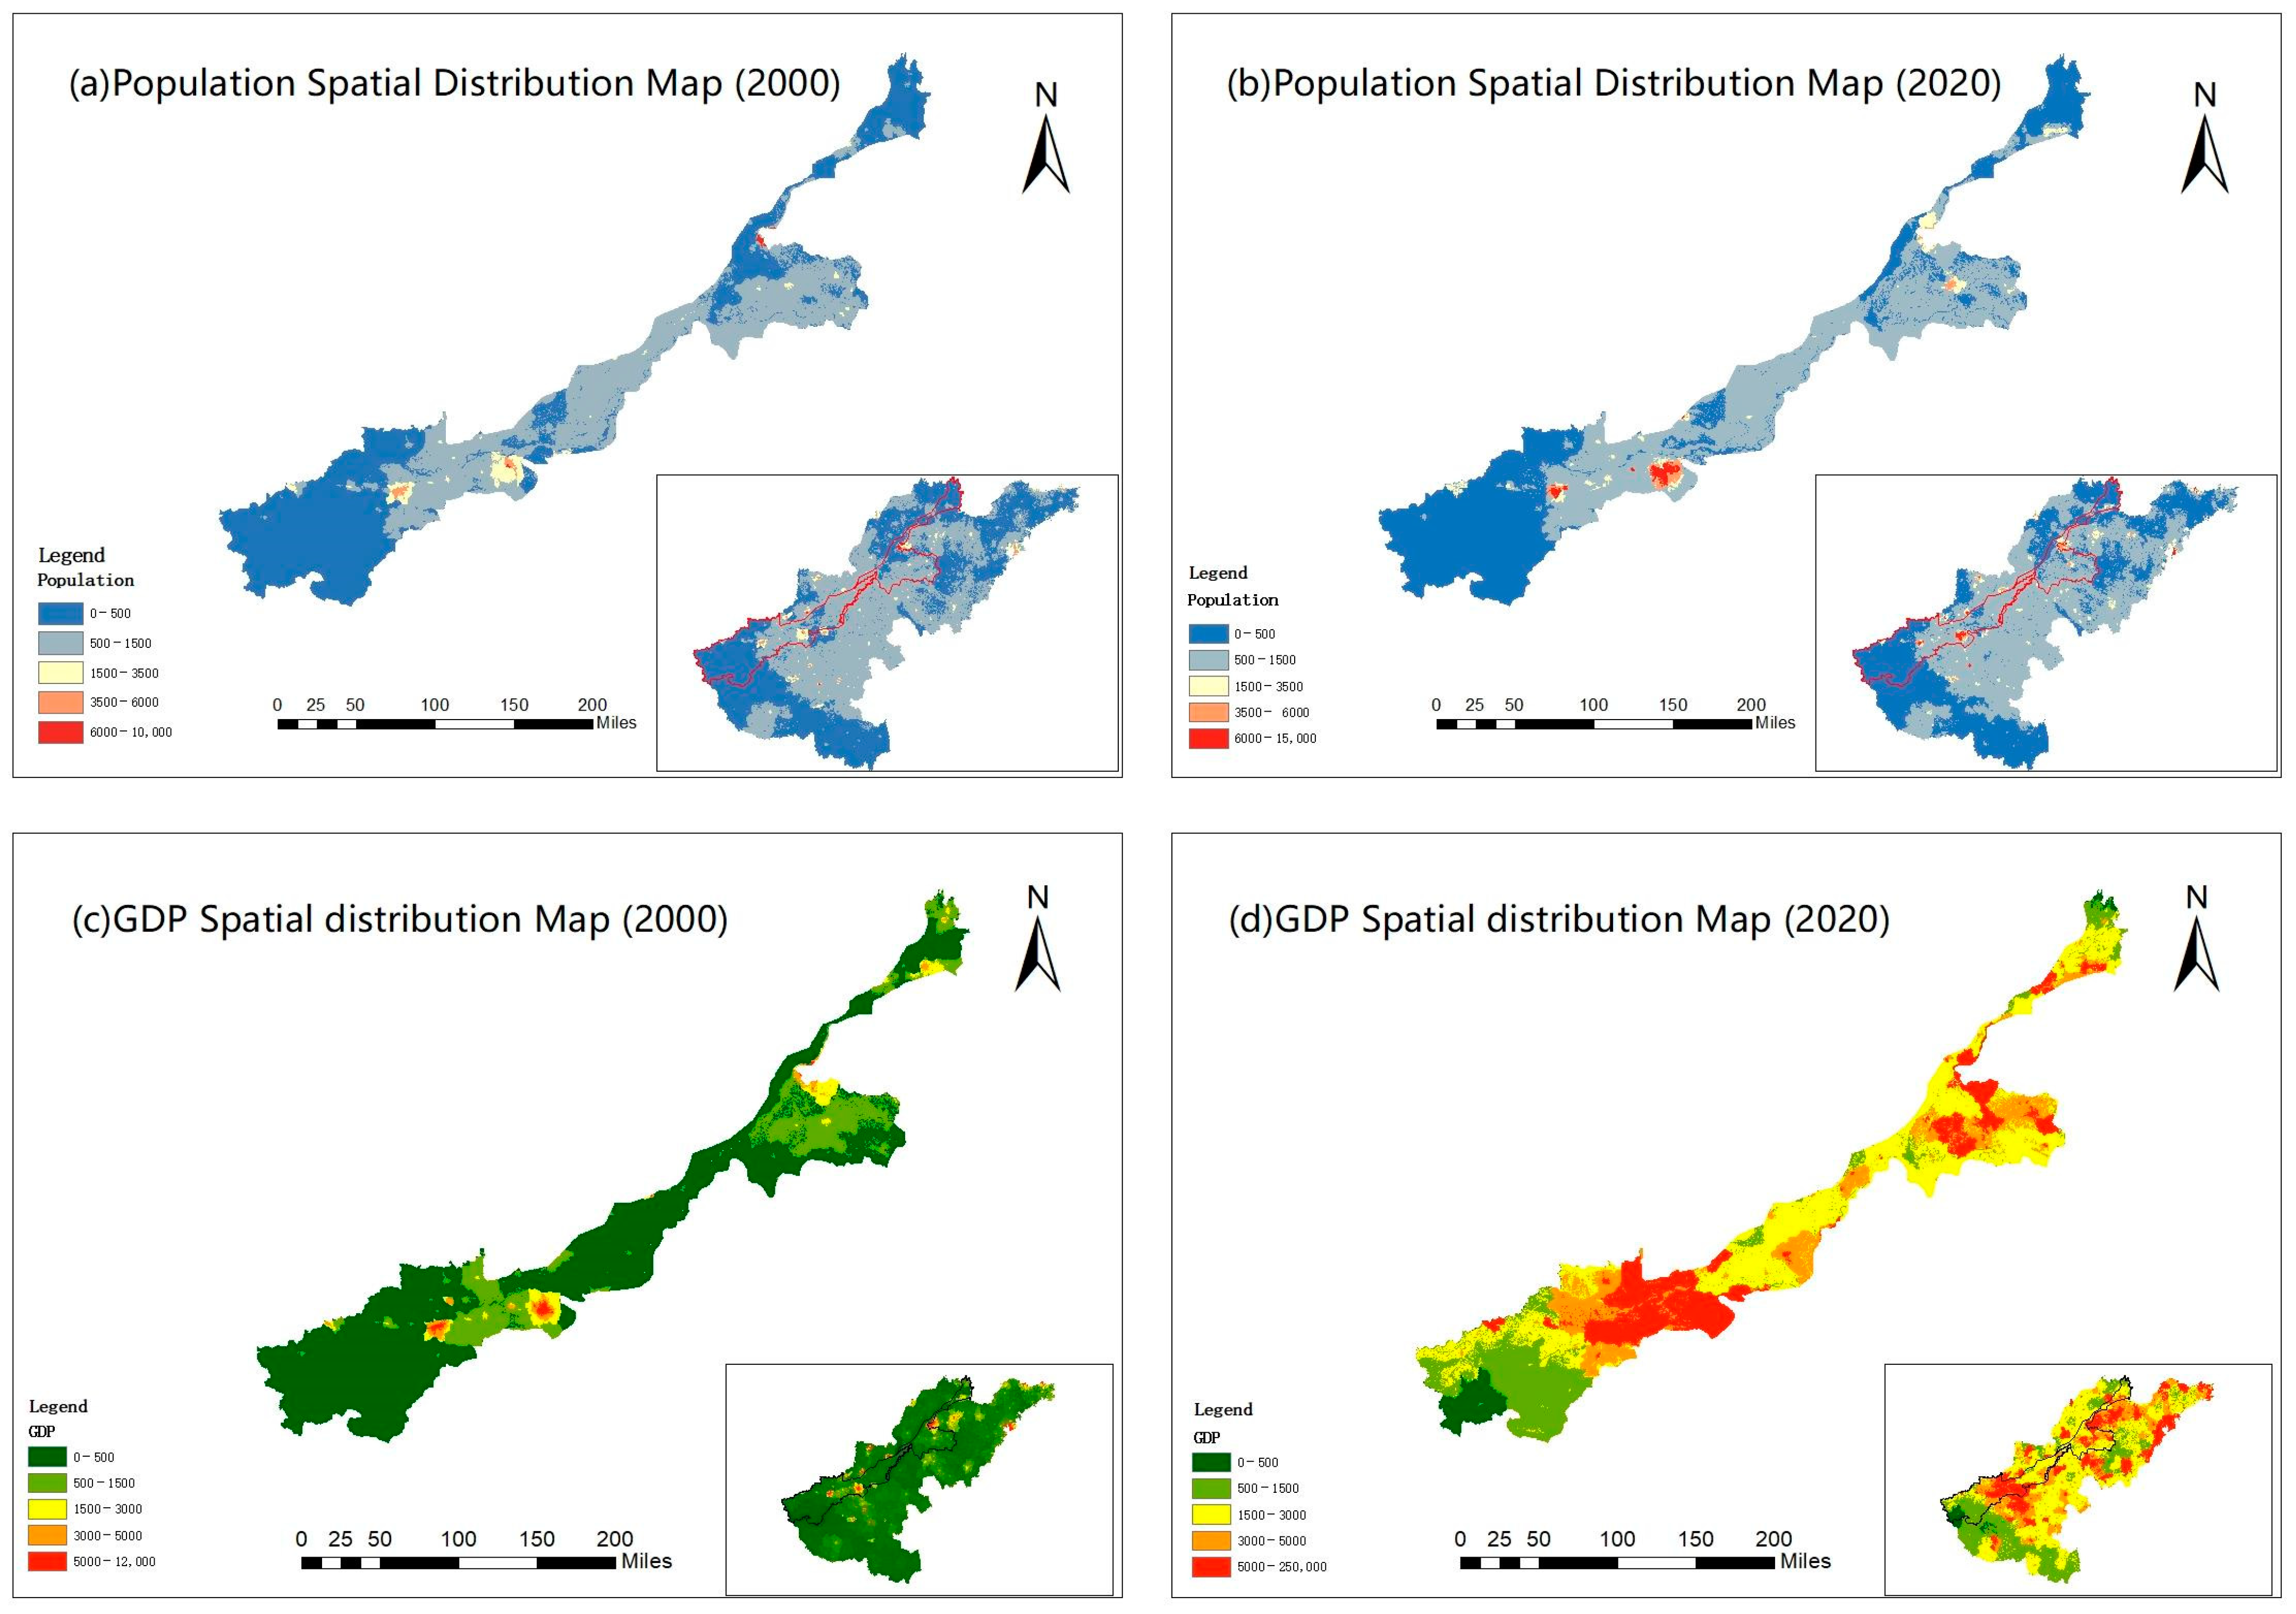
| Indicators/Year | 2000 | 2020 | Growth Rate |
|---|---|---|---|
| Research area population index (person/km2) | 530 | 642 | 21.13% |
| Population index of the province (person/km2) | 553 | 617 | 11.57% |
| Research area GDP index (CNY/km2) | 465 | 4667 | 903.66% |
| GDP index of the province (ten thousand CNY/km2) | 433 | 3851 | 789.38% |
Disclaimer/Publisher’s Note: The statements, opinions and data contained in all publications are solely those of the individual author(s) and contributor(s) and not of MDPI and/or the editor(s). MDPI and/or the editor(s) disclaim responsibility for any injury to people or property resulting from any ideas, methods, instructions or products referred to in the content. |
© 2023 by the authors. Licensee MDPI, Basel, Switzerland. This article is an open access article distributed under the terms and conditions of the Creative Commons Attribution (CC BY) license (https://creativecommons.org/licenses/by/4.0/).
Share and Cite
Wang, W.; Xi, J.; Sun, L.; Liu, B.; Hu, Y.; Han, Z.; Benson, D. Assessing the Sustainability Impacts of the Xiaolangdi Dam: Land Use and Socioeconomic Change in the Middle and Lower Reaches of the Yellow River Basin. Sustainability 2023, 15, 14343. https://doi.org/10.3390/su151914343
Wang W, Xi J, Sun L, Liu B, Hu Y, Han Z, Benson D. Assessing the Sustainability Impacts of the Xiaolangdi Dam: Land Use and Socioeconomic Change in the Middle and Lower Reaches of the Yellow River Basin. Sustainability. 2023; 15(19):14343. https://doi.org/10.3390/su151914343
Chicago/Turabian StyleWang, Wei, Jiarui Xi, Liu Sun, Bo Liu, Yawei Hu, Zhen Han, and David Benson. 2023. "Assessing the Sustainability Impacts of the Xiaolangdi Dam: Land Use and Socioeconomic Change in the Middle and Lower Reaches of the Yellow River Basin" Sustainability 15, no. 19: 14343. https://doi.org/10.3390/su151914343
APA StyleWang, W., Xi, J., Sun, L., Liu, B., Hu, Y., Han, Z., & Benson, D. (2023). Assessing the Sustainability Impacts of the Xiaolangdi Dam: Land Use and Socioeconomic Change in the Middle and Lower Reaches of the Yellow River Basin. Sustainability, 15(19), 14343. https://doi.org/10.3390/su151914343