Article

Environmental Impact Assessment of Nesjavellir Geothermal Power Plant for Heat and Electricity Production

by
María Dolores Mainar-Toledo
1,*,
Maryori Díaz-Ramírez
1,2,
Snorri J. Egilsson
3,
Claudio Zuffi
4,
Giampaolo Manfrida
4 and
Héctor Leiva
1
1
Research Centre for Energy Resources and Consumption (CIRCE), Avenida Ranillas Edificio Dinamiza, 3D, 50018 Zaragoza, Spain
2
CIRCE Institute, Fundación CIRCE, Universidad de Zaragoza, 50009 Zaragoza, Spain
3
Reykjavik Energy, Bæjarháls 1, 110 Reykjavik, Iceland
4
Department of Industrial Engineering, University of Florence, 50139 Florence, Italy
*
Author to whom correspondence should be addressed.
Sustainability 2023, 15(18), 13943; https://doi.org/10.3390/su151813943
Submission received: 22 June 2023 / Revised: 26 July 2023 / Accepted: 13 September 2023 / Published: 20 September 2023

Abstract

:
This work is focused on presenting the main results and discussions concerning the environmental benefits of reducing the non-condensable gases emitted from the Nesjavellir geothermal power plant. The primary objective of this study is to conduct a life cycle evaluation to analyse the overall environmental benefit effects of producing 1 kWh of electricity and 1 kWh of thermal energy in the geothermal power plant at Nesjavellir, which is located in Iceland. The assessment is performed both before and after implementing an abatement system designed to reduce CO2 and H2S gases. The production of geothermal energy is increasing every year and, therefore, it is crucial to identify and quantify the key environmental factors of producing this type of energy and improvements for the future energy transition of the energy generation sector. Firstly, the results show that the environmental impact of electricity production is higher compared to heat production. More in detail, the emissions due to the nature of the geothermal fluid and the construction phase represent the most relevant environmental load for both electricity and heat production for nearly all the 18 environmental impact indicators studied. Furthermore, considering the abatement system for the non-condensable gas emissions, reductions of 78% and 60% in global warming potential is achieved for a production of 1 kWh of electricity and 1 kWh of thermal energy. In terms of external environmental costs, the implementation of an abatement system results in a reduction exceeding 95% for both electricity and thermal energy production per kilowatt-hour. The outcomes obtained from both the baseline scenario and the application of the abatement system undeniably prove that the latter results in a substantial decrease in the overall environmental impacts linked to the generation of 1 kWh of electricity and 1 kWh of heat, encompassing a notable reduction in external environmental costs (externalities).

1. Introduction

Energy is the primary necessity for development, innovation and modernisation in nearly all key sectors including health, education, agriculture and industry [1]. Thus, the demand for energy faces a constant increase [2]. Currently, the majority of energy production methods rely on the consumption of fossil fuels [3]. This originates a wide-spread of issues of serious concern, such as ozone depletion or greenhouse gas emissions accounting to global warming and climate change [4]. In an effort to deal with this escalating demand, the scientific community is continuously aiming to find and improve new approaches to develop sustainable energy technologies. Renewable energy sources (RESs) are, therefore, essential instruments to break the dependency of humankind on fossil fuel expenditure [5].
Among the RESs, the utilisation of geothermal energy for heat and/or electricity pro-duction has earned increased appeal [6] due to current and upcoming political objectives aimed at decreasing greenhouse gas emissions [7], consequently diminishing the depletion of limited energy sources while ensuring sufficient energy supply. Geothermal energy delivers heat and/or electrical power from a renewable energy source that is detached from atmospheric limitations, such as solar radiation intensity or wind flow speed [8]. Although only a reduced portion of this great potential is currently being exploited [9], the geothermal energy capacity worldwide reached over 15 GW in 2021 [10]. High-temperature and high-enthalpy geothermal reservoirs, situated at remarkably favourable geological countries (e.g., Iceland, Italy, the United States, Indonesia, Philippines, etc.), provide the largest share of this capacity [11].
Geothermal energy, however, entails a critical concern in regard to the environmental impact, among others, associated with the construction, operation and end-of-life (EOL) [12,13] of a power plant. There are critical concerns with the high amount of non-condensable gases included in the geothermal fluid composition, which will later represent an environmental impact due to the emissions released to the atmosphere during GPP operation, apart from the problems that are created in the operation (corrosion, calcite deposition, etc.) and the health and safety risks. In this sense, recent efforts are based on the application of solutions [14] aiming to minimise the emissions of pollutants, such as carbon dioxide and hydrogen sulphide [15].
This study analyses the Nesjavellir geothermal power plant (GPP) as it replicates the solution that is already implemented in the Hellishedi geothermal power plant [16,17]. The innovations applied to this power plant are Carbfix [18] and Sulfix [19], which aim to minimise the emissions of CO2 and H2S, respectively. The GECO project has proven to be technically feasible in the Nesjavellir GPP by reducing a portion of the gaseous emissions. Further research is needed to evaluate the environmental impact and cost implications of including these innovations at the Nesjavellir GPP plant.
The application of the life cycle assessment (LCA) methodology has proven to be a valuable and promising tool for conducting a comprehensive analysis of the environmental impacts of geothermal energy conversion [16,17,20]. Its utilisation has demonstrated its capability to generate quantitative results and facilitate comparisons among different types of plants and resource conditions. The application to the Nesjavellir GPP is expected to be useful to identify actions [21] to improve the environmental impacts associated with innovations applied to the geothermal energy production processes with the aim of reducing CO2 and H2S emissions.
Specific efforts were particularly focused on identifying hot spots in the life cycle of the Nesjavellir power plant in terms of exergoenvironmental analyses based on the life cycle assessment (LCA) evaluations [17]. In addition, they were useful to suggest improvements where possible.
The present work provides a deeper assessment of the environmental impacts associated with innovations applied to the Nesjavellir GPP with the aim of reducing CO2 and H2S emissions. Moreover, an additional analysis was conducted, considering the monetarisation of the environmental impacts or so-called externalities; they appear when there are relevant and undesirable consequences for third parties. In this sense, this study also evaluates the reduction in environmental external costs by comparing the Nesjavellir GPP before and after implementing the NCG reduction technology.

2. Materials and Methods

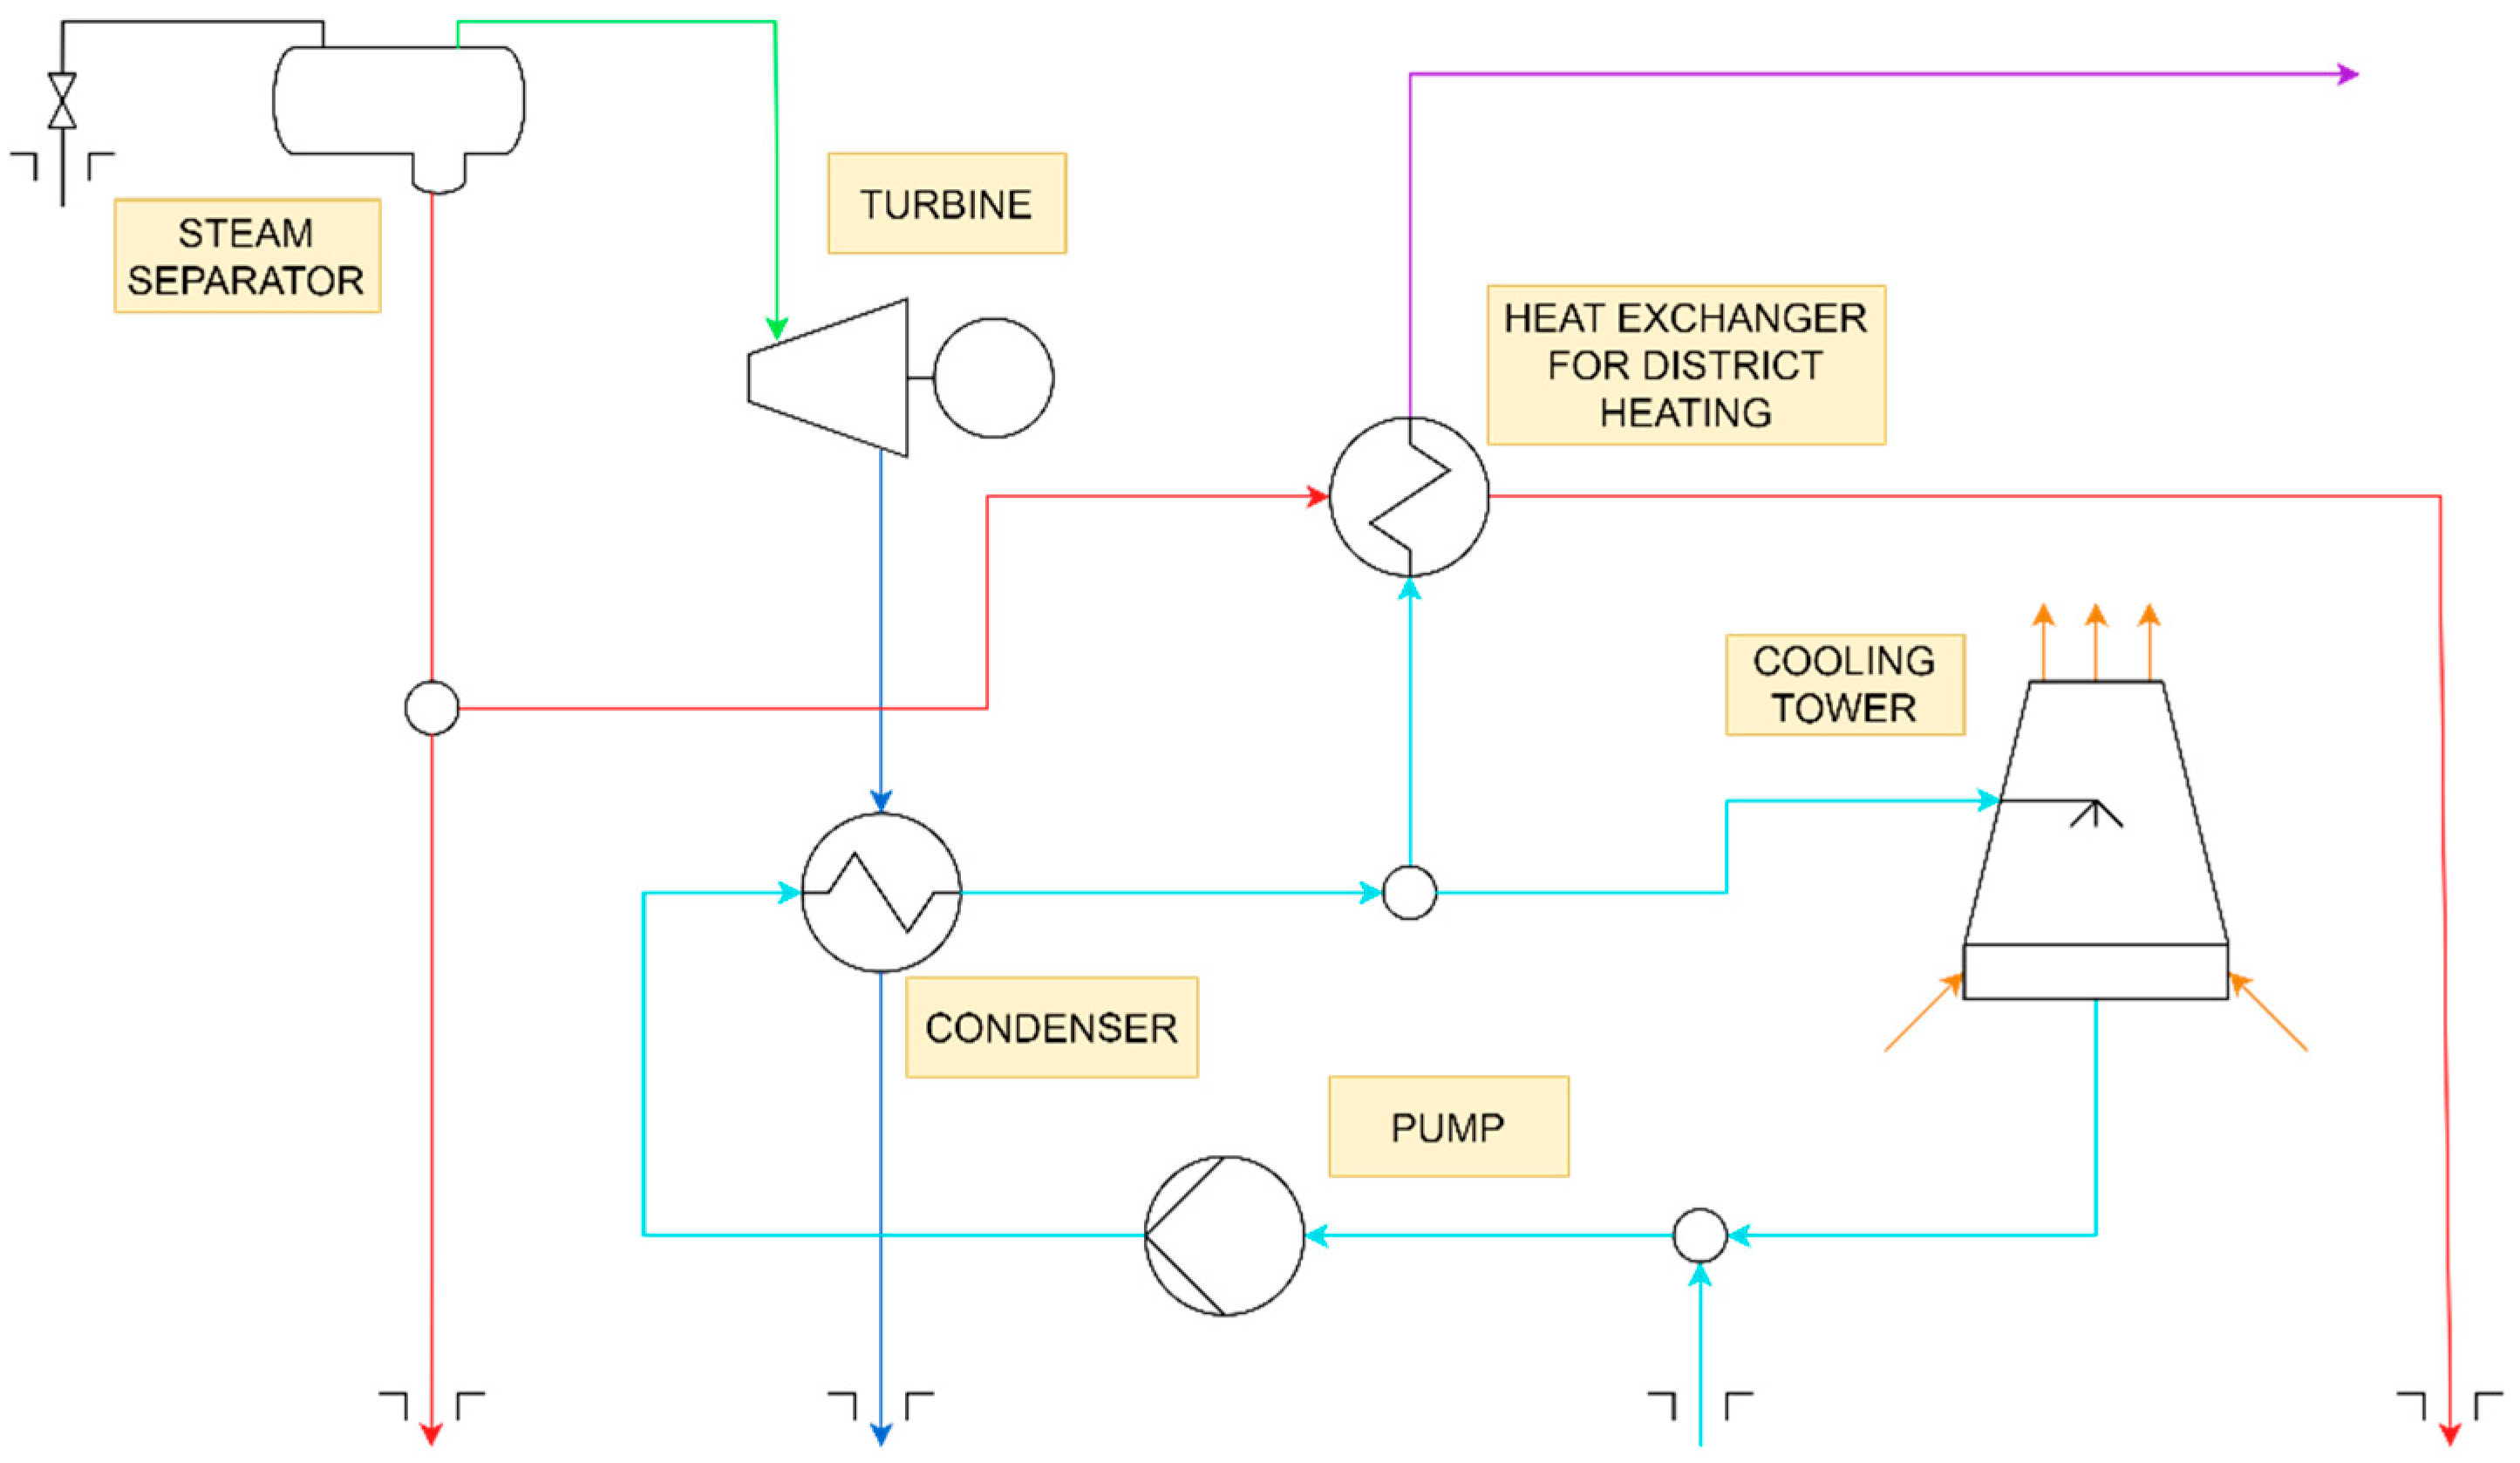
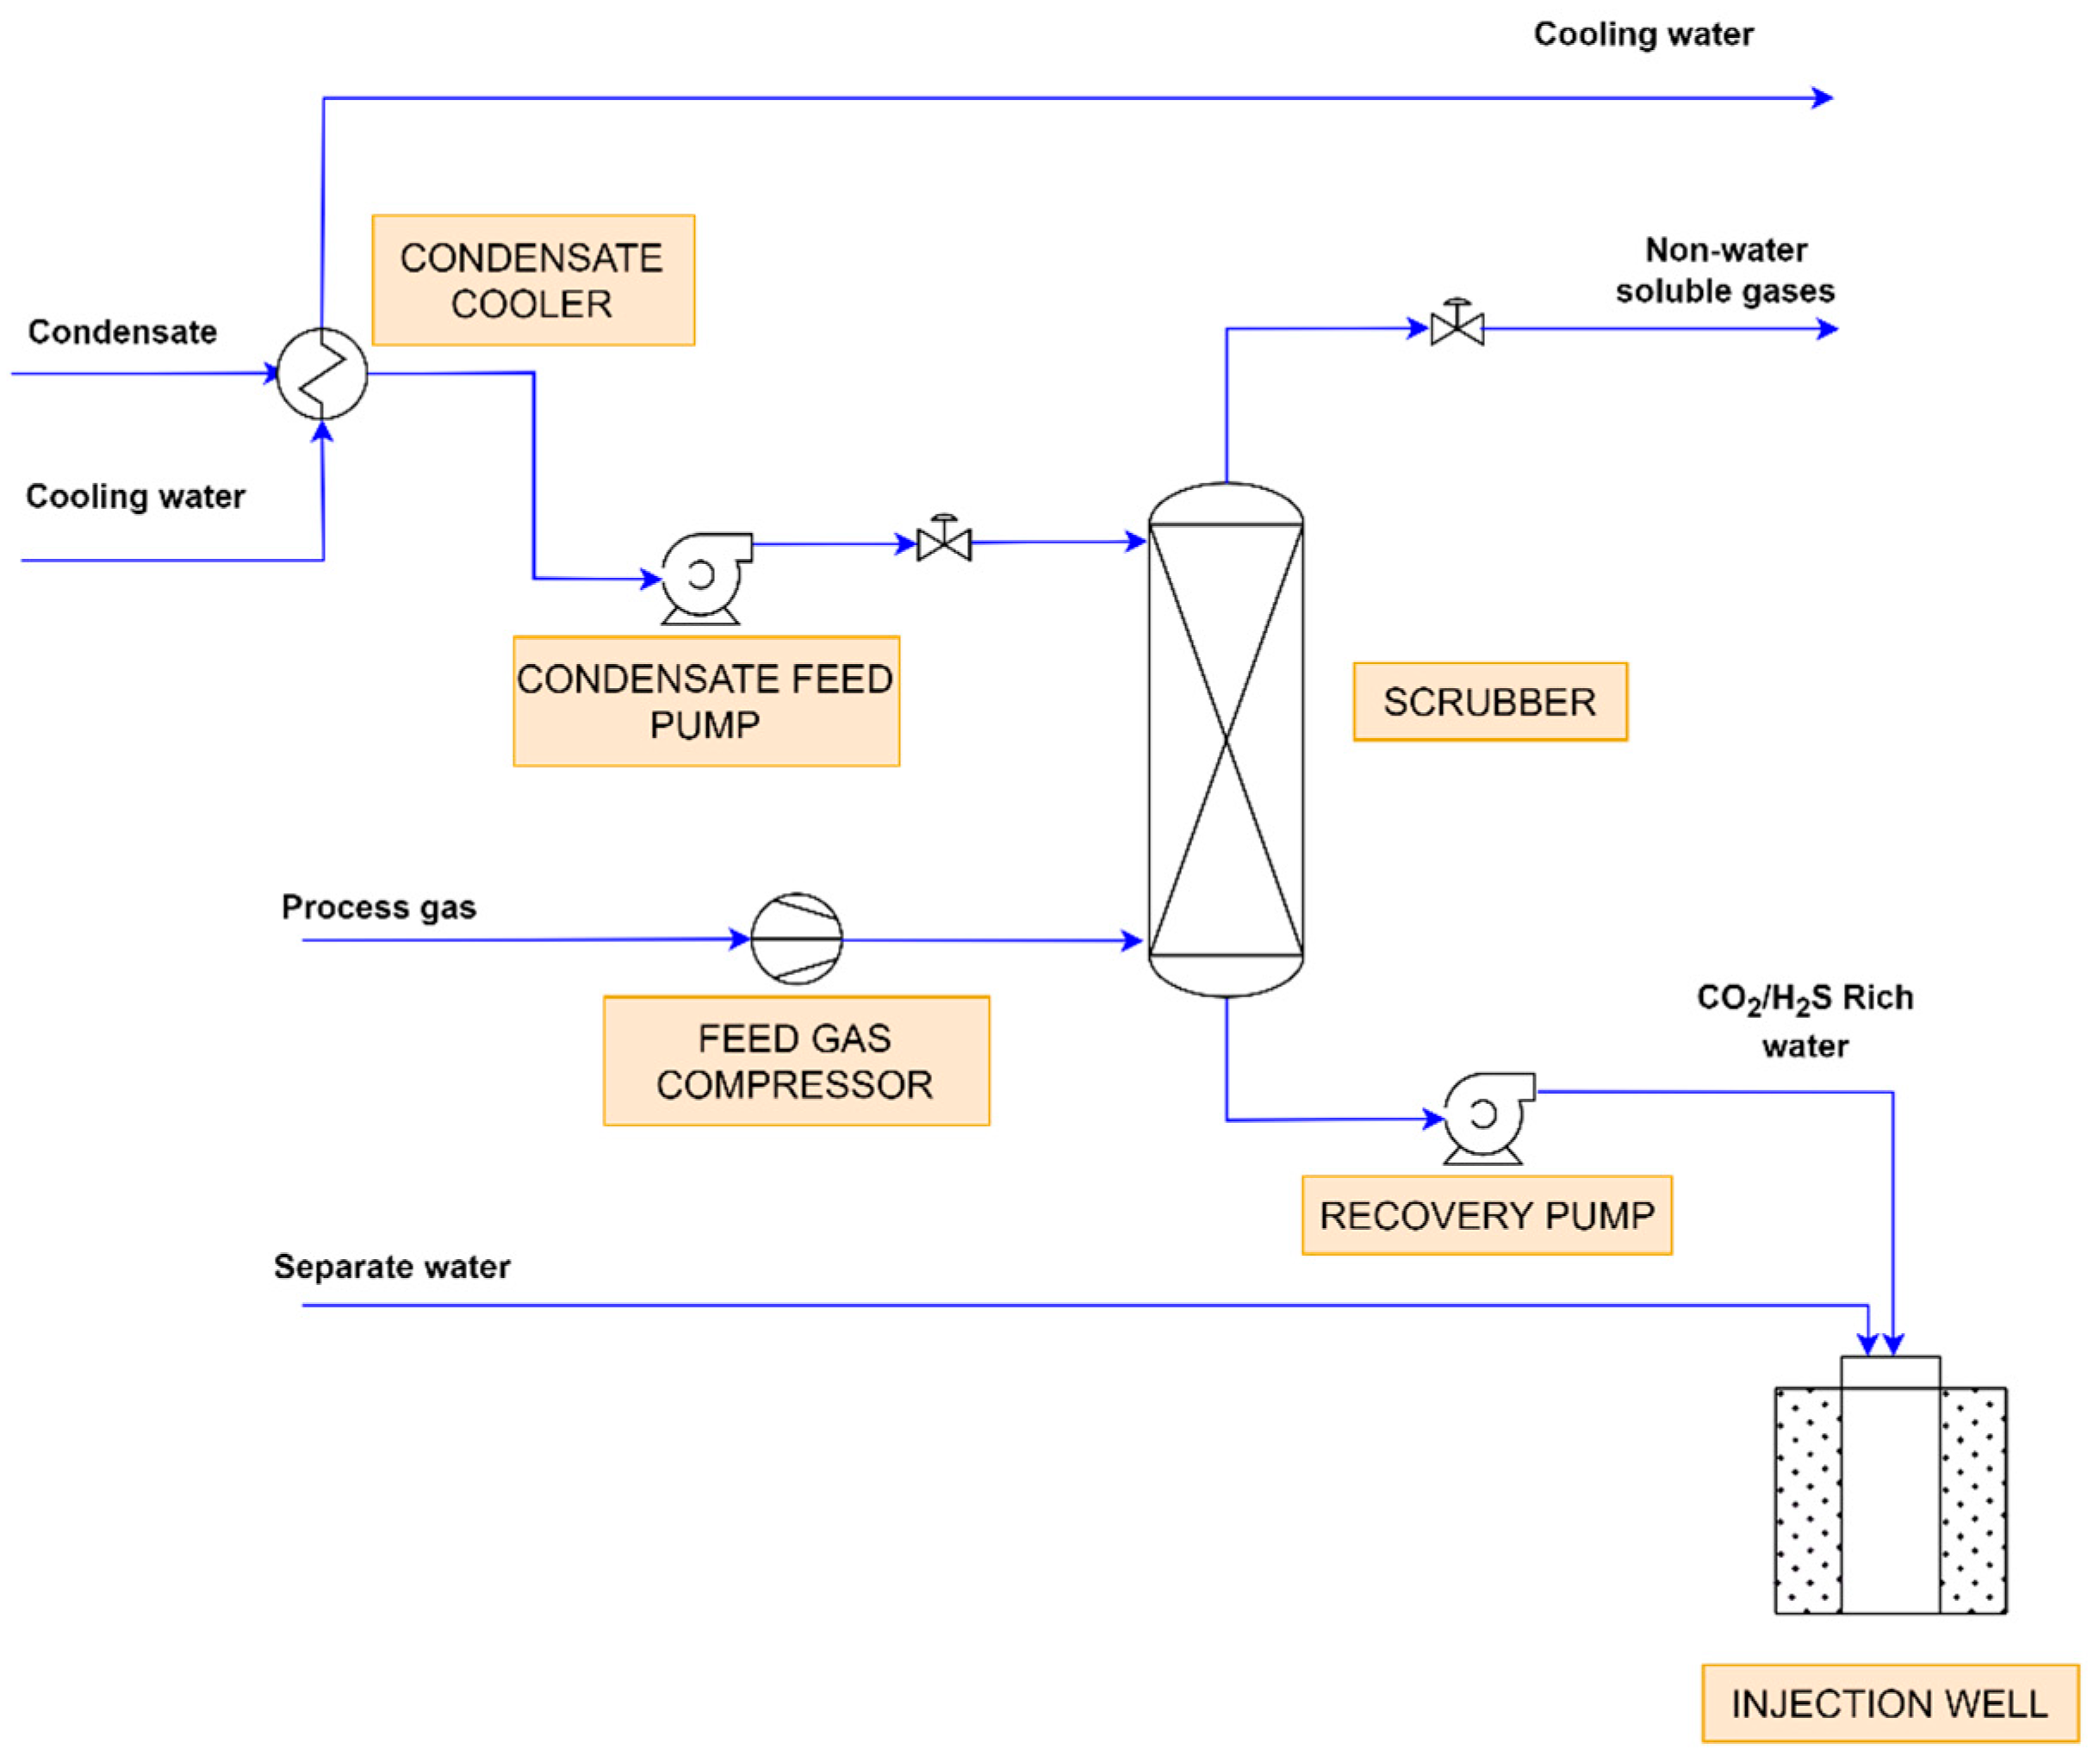
2.1. Nesjavellir GPP

The Nesjavellir GPP, located in the high-enthalpy Nesjavellir Geothermal Field, is one of the largest geothermal power stations in Iceland [22]. Originally commissioned in 1990, the plant has been continuously remodelled up to this day to facilitate a capacity of 120 MW of electricity generation and 290 MW of district heating. It operates as a combined cycle plant, in which a blend of geothermal brine and steam is transported to a central separation station at 14 bars and 200 °C. According to Reykjavik Energy, the current owner of the plant, the power that is generated is sufficient to provide heat for homes and electricity for approximately 7500 people [23]. In Figure 1, a descriptive flow chart of the plant showing the different geothermal fluid outputs can be observed.
Gaseous emissions from geothermal fluids are an unavoidable aspect of high-enthalpy geothermal applications. Annual emissions of geothermal gases can reach up to 15,000 tonnes of CO2 and 7500 tonnes of H2S, according to data collected by Reykjavík Energy [24]. In this regard, the Icelandic government introduced a new regulation in 2010 concerning the H2S concentration in the air, imposing stringent requirements on the geothermal industry to decrease emissions of this chemical compound from their power plants. Since the commissioning of the Nesjavellir power plant in 1990, Reykjavík Energy has been actively dedicated to finding solutions focused on H2S abatement.
Relevant examples include the two experimental projects involving gas re-injection, CarbFix and SulFix. Both technologies allow for the sequestering of CO2 and H2S into minerals. CarbFix and SulFix technology are based on dissolving gases in formation fluids and well water during subsurface injection. This solubility capture approach facilitates the carbonation of the host rock, ensuring the long-term secure sequestration of CO2 and H2S in the subsurface. SulFix technology aims to assess the feasibility of in situ sequestration of H2S minerals in basaltic rocks by employing methods and a technology similar to CarbFix. Figure 2 represents a simplified model of the pilot plant modified from the Hellisheidi power plant, which is utilised as the abatement system for non-condensable gases emitted by the Nesjavellir power plant. This technology encompasses the dissolution in the water of geothermal gases (mainly CO2 and H2S), followed by their injection into the bedrock. In CarbFix, the re-injection target zone is situated between 30 and 80 °C and depths ranging from 400 to 800 m. In contrast, SulFix targets the >200 °C high-temperature geothermal system below 800 m [25].
Figure 1 illustrates the process of two-phase flow from geothermal wells, where steam and geothermal brine are separated at a central station operating at an absolute pressure of 12 bars. The separated steam is then transported to the power plant, where it undergoes moisture separation., facilitating the generation of electric energy by redirecting the steam through condensing turbines.
Subsequently, the exhaust steam from the turbines is used to preheat fresh water, while the geothermal brine from the steam separators heats the preheated water from the condensers to the temperature required for the district heating system.
To prevent the corrosive effects caused by the saturation of cold ground water with dissolved oxygen when heated, the heated water undergoes a deaeration process before leaving the plant. Deaeration is achieved by boiling the water under vacuum conditions and injecting small amounts of geothermal steam, which contains H2S.

2.2. Environmental Evaluation Methodology

The LCA methodology’ framework is standardised by ISO 14040, ensuring that evaluation methods are developed with significant consistency and quality assurance, enabling meaningful comparisons. Life cycle assessment (LCA) methodology is a valuable approach utilised to optimise various industrial processes and energy systems [26,27,28,29,30,31]. With this methodology, it becomes possible to identify hot spots in the production process life cycle and suggest improvements, such as minimising material consumption, reducing the impact of harmful emissions and enhancing equipment performance.
In accordance with established standards, the LCA studies involve four interconnected stages: (1) definition of goal and scope, (2) inventory analysis, (3) impact assessment and (4) interpretation. For this study, the LCA modelling was conducted using the Simapro v9.1 software, while the ReCiPe 2016 Midpoint (H) v 1.04 method (2010 Global) was employed for the assessment. Inventory data for the development of the life cycle inventory (LCI) were obtained from the Ecoinvent database version 3.8, as provided by Karlsdottir et al. [32], and primary data from the company in charge of the management of Nesjavellir GPP, Reykjavik Energy. In addition, all assessments presented in this study were performed following updated guidelines for geothermal plants obtained from the GEOENVI H2020 project [32].
Despite the Nesjavellir GPP being a combined heat and power (CHP) plant, this study does not describe the three more common allocation methods used in LCA evaluations (i.e., energy, exergy and economic allocations) for this type of energy plant [33]. Instead, this paper focuses exclusively on exergy allocation to assess the environmental burden of electricity and heat from the geothermal CHP plant, as it is the one that is more recently in use and not extensively reported in the literature [16,17,34].

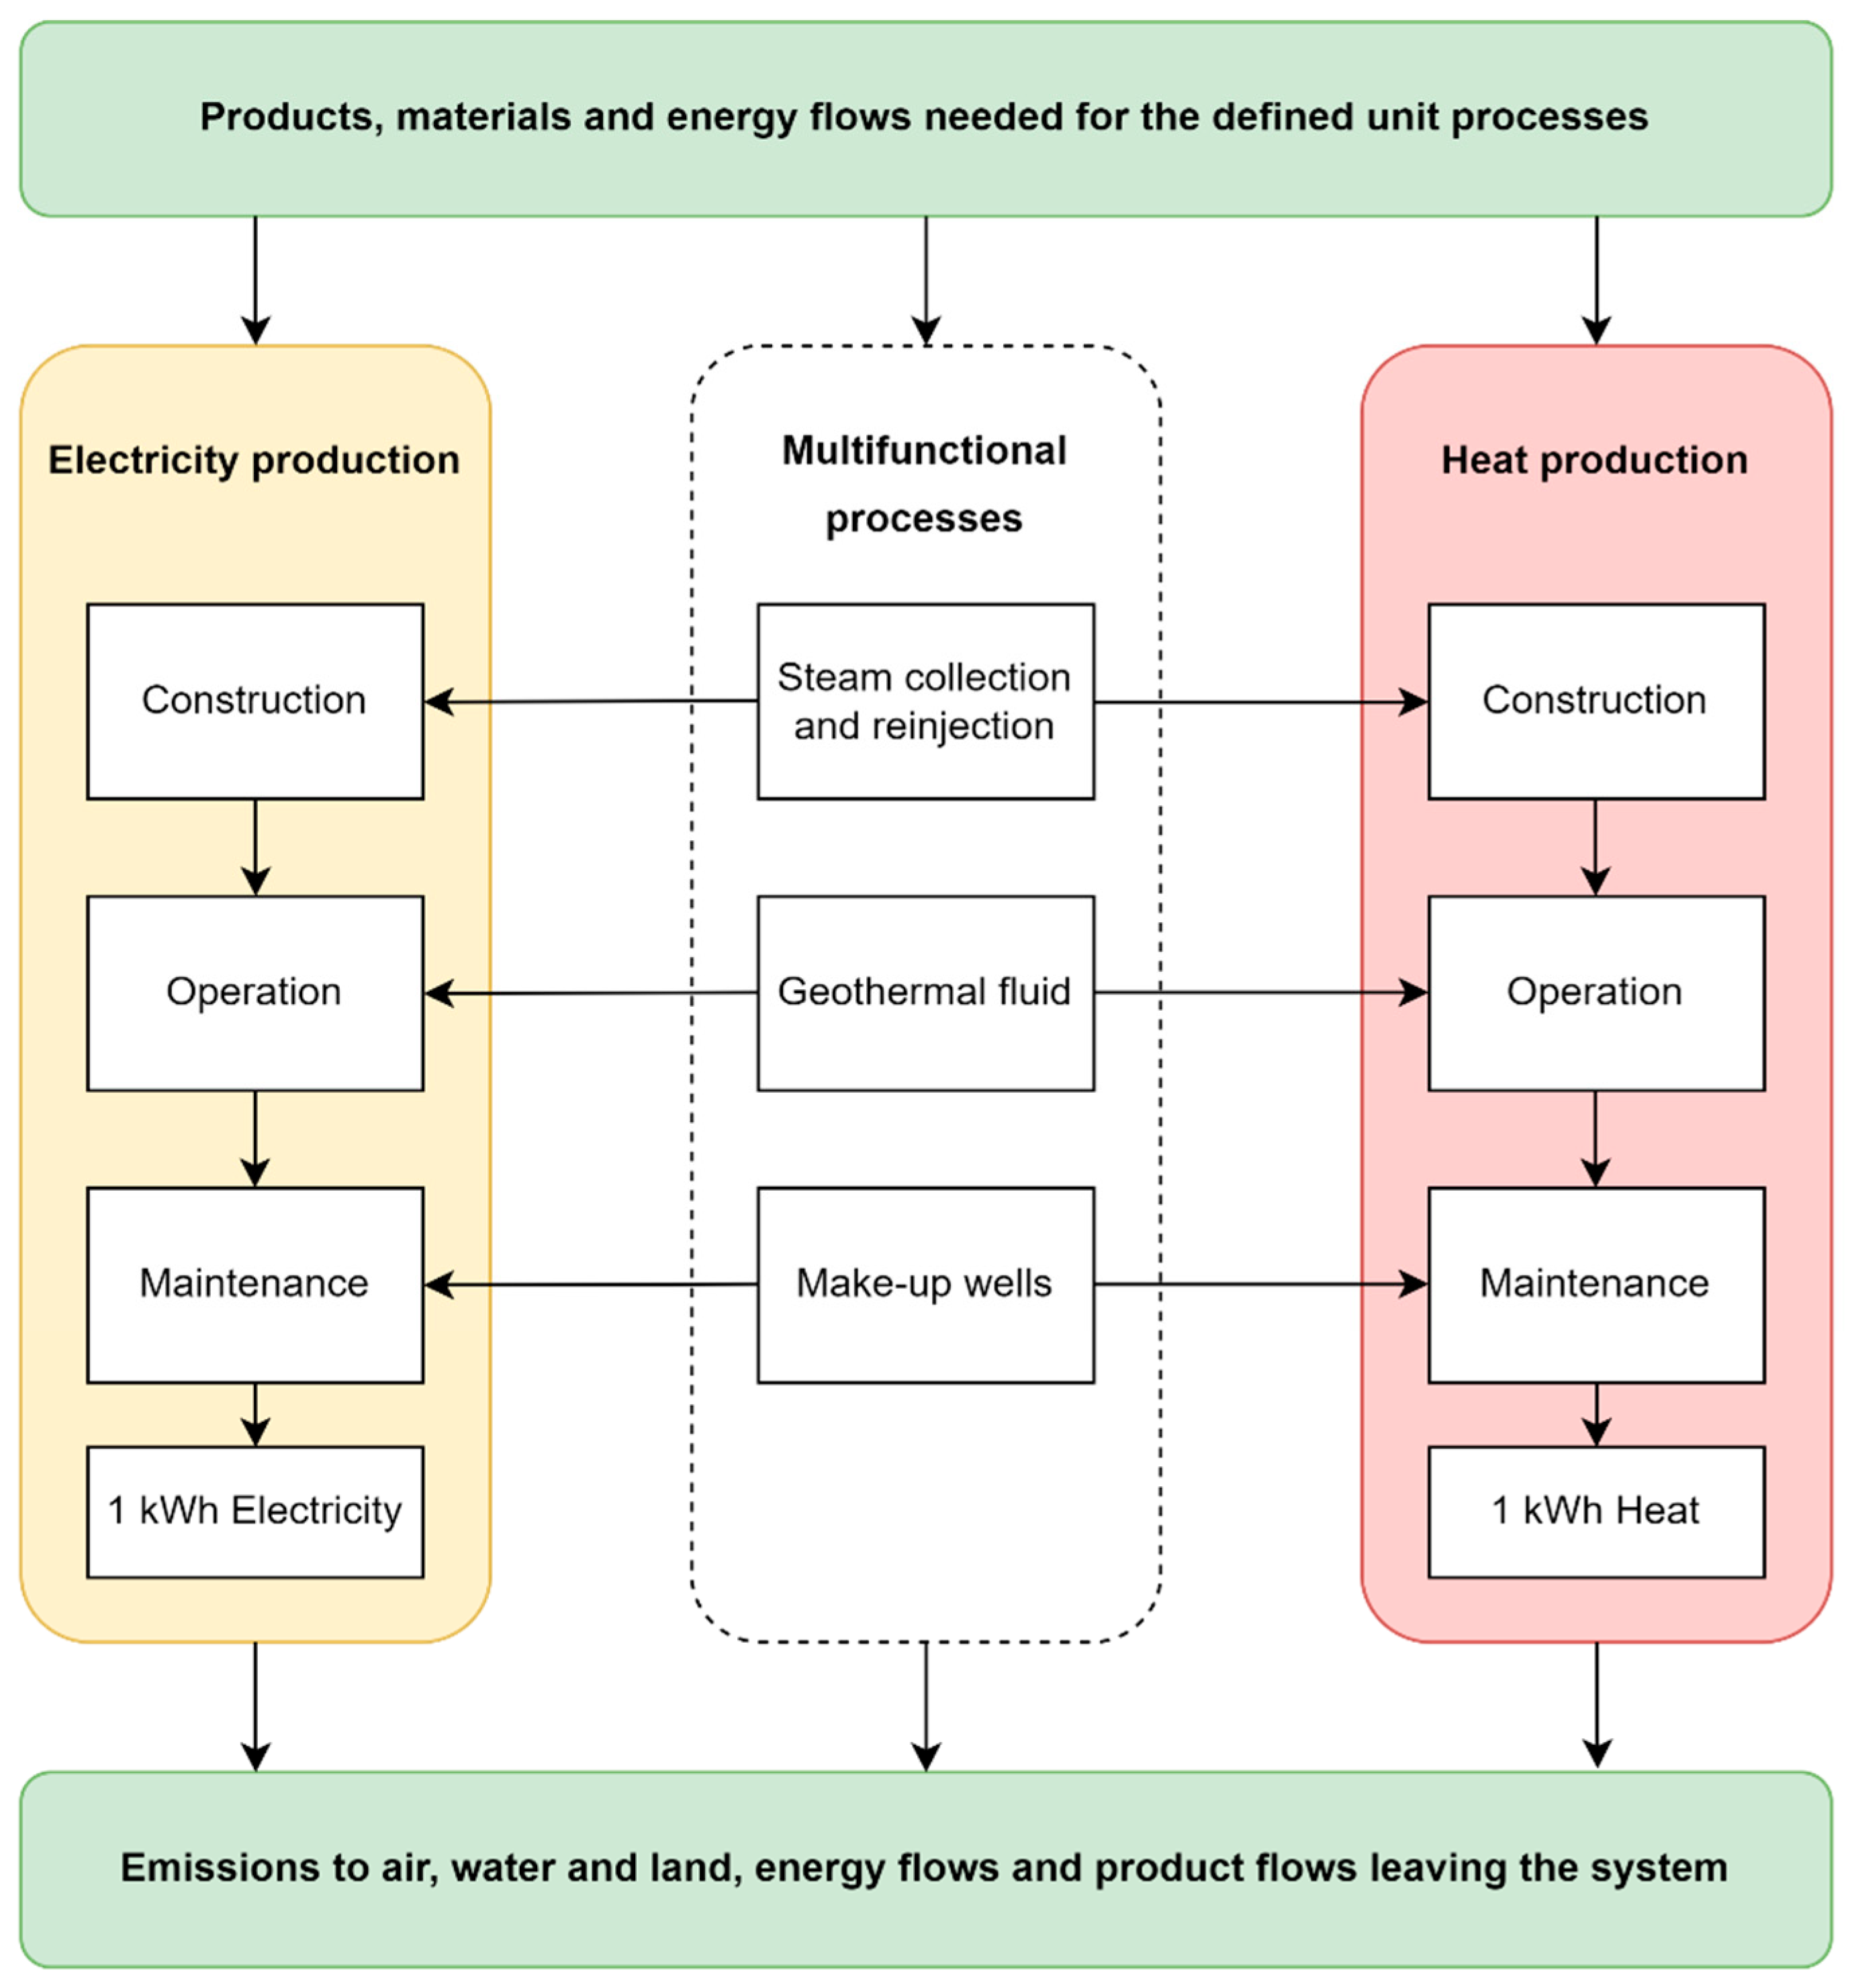
2.2.1. Goal and Scope Definition

The initiation of any LCA study involves defining the study’s goal and scope, which includes establishing the study’s scope, system boundary and the definition of the functional unit. The main objective of this analysis is to evaluate the environmental performance associated with the overall environmental effect of producing 1 kWh of electrical and 1 kWh of thermal energy in the geothermal plant at Nesjavellir, Iceland. This approach aims to identify crucial aspects related to specific production phases and opportunities for the technological improvements from a life cycle perspective. The system boundaries of this LCA study adopt a cradle-to-grave approach, encompassing the three phases of construction, operation and dismantling (Figure 3).
Functional Unit: The functional unit serves as the reference to which the inputs and outputs of the process are related and is determined based on the principal function of the processes under assessment. In this work, 1 kWh of provided or delivered electricity and 1 kWh of provided or delivered heat were selected as functional units, considering a temporal scale of 30 years.
System Description and Boundaries: The system is based on a cradle-to-grave approach and follows the energy production of both energy sources (electricity and heat) for the construction, operation and use, and dismantling phases of the GPP from a life cycle perspective. As the Nesjavellir power plant produces both electricity and hot water simultaneously, certain processes are solely dedicated to either electricity or heat production, respectively. Expectedly, some of these processes can be defined as multifunctional and are involved in the production of both energy types. Figure 4 displays the different unit processes and how they are distributed regarding the source of energy production.
The life cycle assessment (LCA) methodology comprehensively evaluates the entire life cycle of the geothermal power plant, taking into account not only the operational phase, but also the upstream processes involved in the extraction and production of raw materials essential for its construction. As a result, the environmental impact assessment for generating 1 kWh of product encompasses the entire supply chain, including activities like mining, processing and transporting raw materials (Figure 3) such as steel, concrete and other construction materials.

2.2.2. Exergy Allocation Factors

The exergy allocation approach takes into account the quality of energy and assigns a higher share of the environmental impacts to electricity. The main reason for allocating the contribution of the impact based on exergy is because there is a mechanical component, the heat exchanger, that is shared by the two types of energy production. Due to the aforementioned reason, the system exergy converted from electricity and heat was chosen as the allocation factor to exclusively allocate all the multifunctional processes (M), as shown in the work by Maryori et al. [16].
Going into more detail, the exergy allocation factor is a ratio comprising, in the numerator, the contribution of electrical exergy or heat exergy, and in the denominator, the total exergy generated. Additional information concerning the calculation of the exergy allocation factor was included in a previous study [35]. Consequently, the allocation factor applied for multifunctional processes resulted in 78.8% for electricity production and 21.2% for heat production.
E x e r g y = P n , e × 1 A p P n , e × 1 A p + P n , h × T e n v T f ,
where:
  • P n , e —the installed electricity capacity (MW);
  • P n , h —the installed hot water capacity (MW);
  • A p —the auxiliary power demand (4%);
  • T e n v —the average temperature of the surrounding environment (K);
  • T f —the log-mean temperature of the district heating network (K).

2.2.3. Life Cycle Inventory

The inventory analysis involves a meticulous data collection process encompassing all inputs and outputs (e.g., energy, materials and emissions) that are identifiable within the system boundaries of the GPP. This process also entails data homogenisation based on the chosen functional unit. The subsequent sections include a general description of the key considerations regarding the life cycle inventory (LCI) of the system. Firstly, an exhaustive revision of the literature on previous inventories from other CHP plants was performed, and primary data were compiled from the following life cycle stages: construction, operation and use, and maintenance, as well as closure of the plant.
Secondly, secondary data were gathered for different phases of the GPP’s life cycle such as wells (production, reinjection and make-up), installed capacity for power and heat production, capacity factor and abatement equipment in recent years.
It is crucial to emphasise that the LCI referred to the manufacturing process was based on foreground information provided by the GECO project partners and background data for the remaining stages.
  • Construction
In this stage, there are common processes needed for both the production of power and the production of heat; in this case, they are named as multifunctional processes. The rest of the processes are dedicated to either power production or heat production; in this case, geothermal wells, wellhead equipment, collection pipelines, extraction site-land use, power plant buildings and mechanical equipment are included. In this phase, the NCG reinjection system or abatement system is included.
  • Operation and Maintenance
This stage comprises inputs and outputs related to plant operation for power and heat production, including abatement processes that correspond to CarbFix and SulFix technology. In this stage, impacts are related to geothermal fluid, the consumption of chemicals during maintenance and the machinery component replacement. Emissions of H2S from the geothermal fluid are modelled in this work as sulphur dioxide. Results will be referred to the terrestrial acidification. Furthermore, a 1% machinery component replacement per year was assumed for power and heat production.
  • Dismantling
This stage was considered in a simplified way due to the limited raw data available. Accordingly, the input and output information (materials and waste) considered at the Nesjavellir GPP was related to the closure of the wells after 30 years of operation. The standard cementing process for well closure was considered, which was derived from the data generated from ENEL GP in the GEOENVI project [32].

2.2.4. Impact Assessment

During this stage, an evaluation of the potential environmental impacts associated with the inventory data is performed. The environmental analysis was executed using SimaPro software version Analyst 9.3.0.3, in conjunction with in-house databases complemented by Ecoinvent 3.8. For this particular study, the ReCiPe 2016 v1.1 midpoint environmental method was applied, and hierarchical evaluation was undertaken. Due to ReCiPe, eighteen midpoint impact categories were involved, specific indicators were chosen for detailed analysis because of their relevance to the study’s objectives. The selected impact categories are presented in Table 1 [34].

2.2.5. Interpretation

This LCA stage provides an understanding and analysis of the inventory phase results, the consequential impacts in light of possible uncertainties of the data used and the assumptions that were considered, as well as the eventual drawing of conclusions and recommendations for the improvement of the design.

2.3. Environmental Evaluation Methodology

For determining external environmental costs, different weighting methodologies exist. All of them share a common framework based on the analysis of the cause–effect chain to derive environmental impacts from the life cycle inventories. Then, a monetary weight is assigned to each environmental impact according to the equation below:
EC = EI × ECF
where:
  • EI—the environmental indicator referred to the unit of the reference substance under consideration (for example, kg CO2 eq as the unit for the global warming indicator per kWh);
  • ECF—the external environmental cost factor related to the environmental impact (EI) under consideration in EUR/(unit of the EI).
Thereby, the external cost (EC) is obtained in euros.
Appendix B, Table A12 summarises the cost factors of 2015 for different environmental impacts, and the same factors are updated to 2021 prices [36], considering the 18 environmental impact categories in the ReCipe midpoint (H). The integrated economic value conversion system was established through the regulation of pollutant discharge fees, environmental tax and the WTP theory [37]. Externalities arise when significant and undesirable consequences affect third parties. For this study, the externalities compared the cost associated with the emissions caused by an activity, and in this case, there was a focus on GPP gases emitted. Therefore, the negative externalities of the baseline were evaluated to compare the values with the same power plant implementing GECO technology. Incorporating externalities’ costs into the GECO project and the economic system is of paramount importance. These external costs can exert a profound influence on the selection of competitive strategies within the energy production market.

3. Results

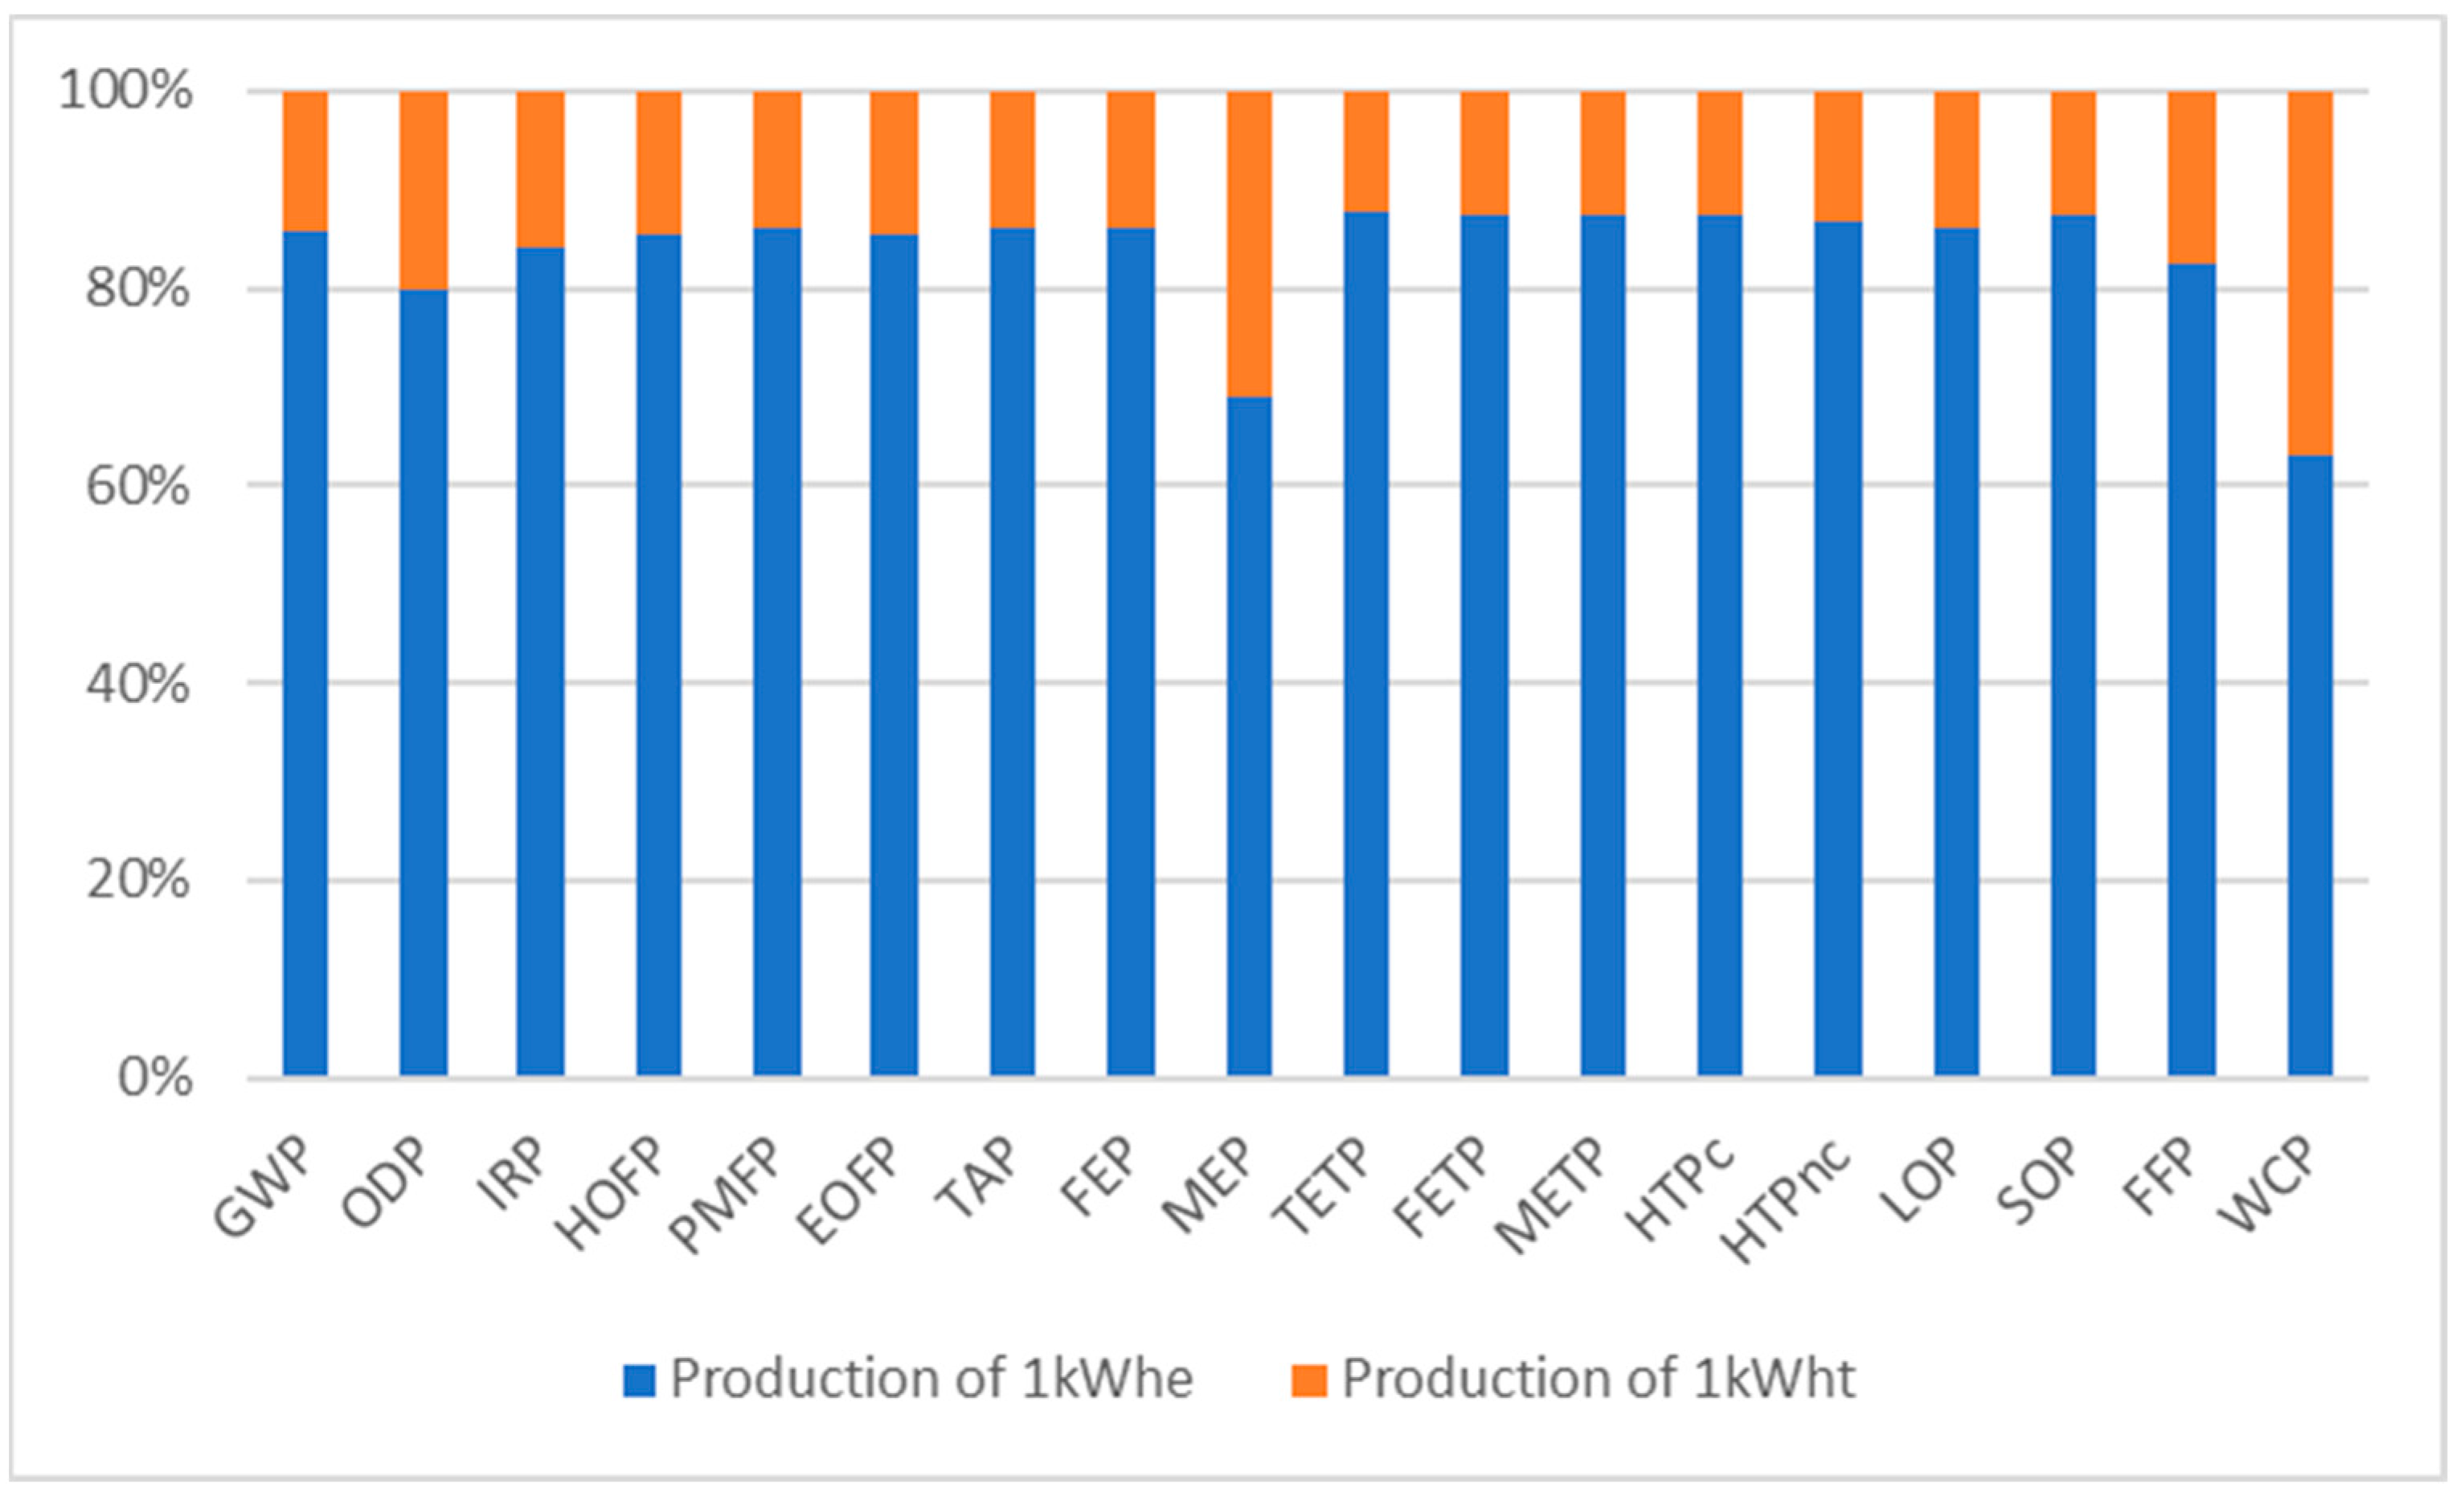
3.1. Life Cycle Assessment of Nesjavellir GPP Baseline

The impacts associated with both productions, electricity and heat, for 1 kWhe and 1 kWht, can be seen in Figure 5 for all the phases of the GPP explained in Section 2.2.3. The results are expressed in percentage, considering 100% as the sum of the environmental impact for both energy productions, and for each impact category. The highest impact for all the categories is due to the electricity production of 1 kWhe (blue bars). For heat production, 1 kWht, the highest impact is seen in the water depletion category, which is due to the use of large quantities of fresh water for district heating in Reykjavik. All the previous results are in line with the results obtained in the work by Diaz et al., 2023, in relation to the Hellisheidi GPP [16].
Regarding the global warming potential indicator, 1 kWh of produced electricity represents a total of 15.47 g CO2 eq, while 1 kWh of produced heat has an associated impact of 2.55 g CO2 eq, i.e., the impact of producing 1 kWhe is six times greater than producing 1 kWht. These obtained values are within the order of magnitude represented by Karlsdottir et al. [36] where the allocation exergy method is applied to assess the case study of Hellisheidi.

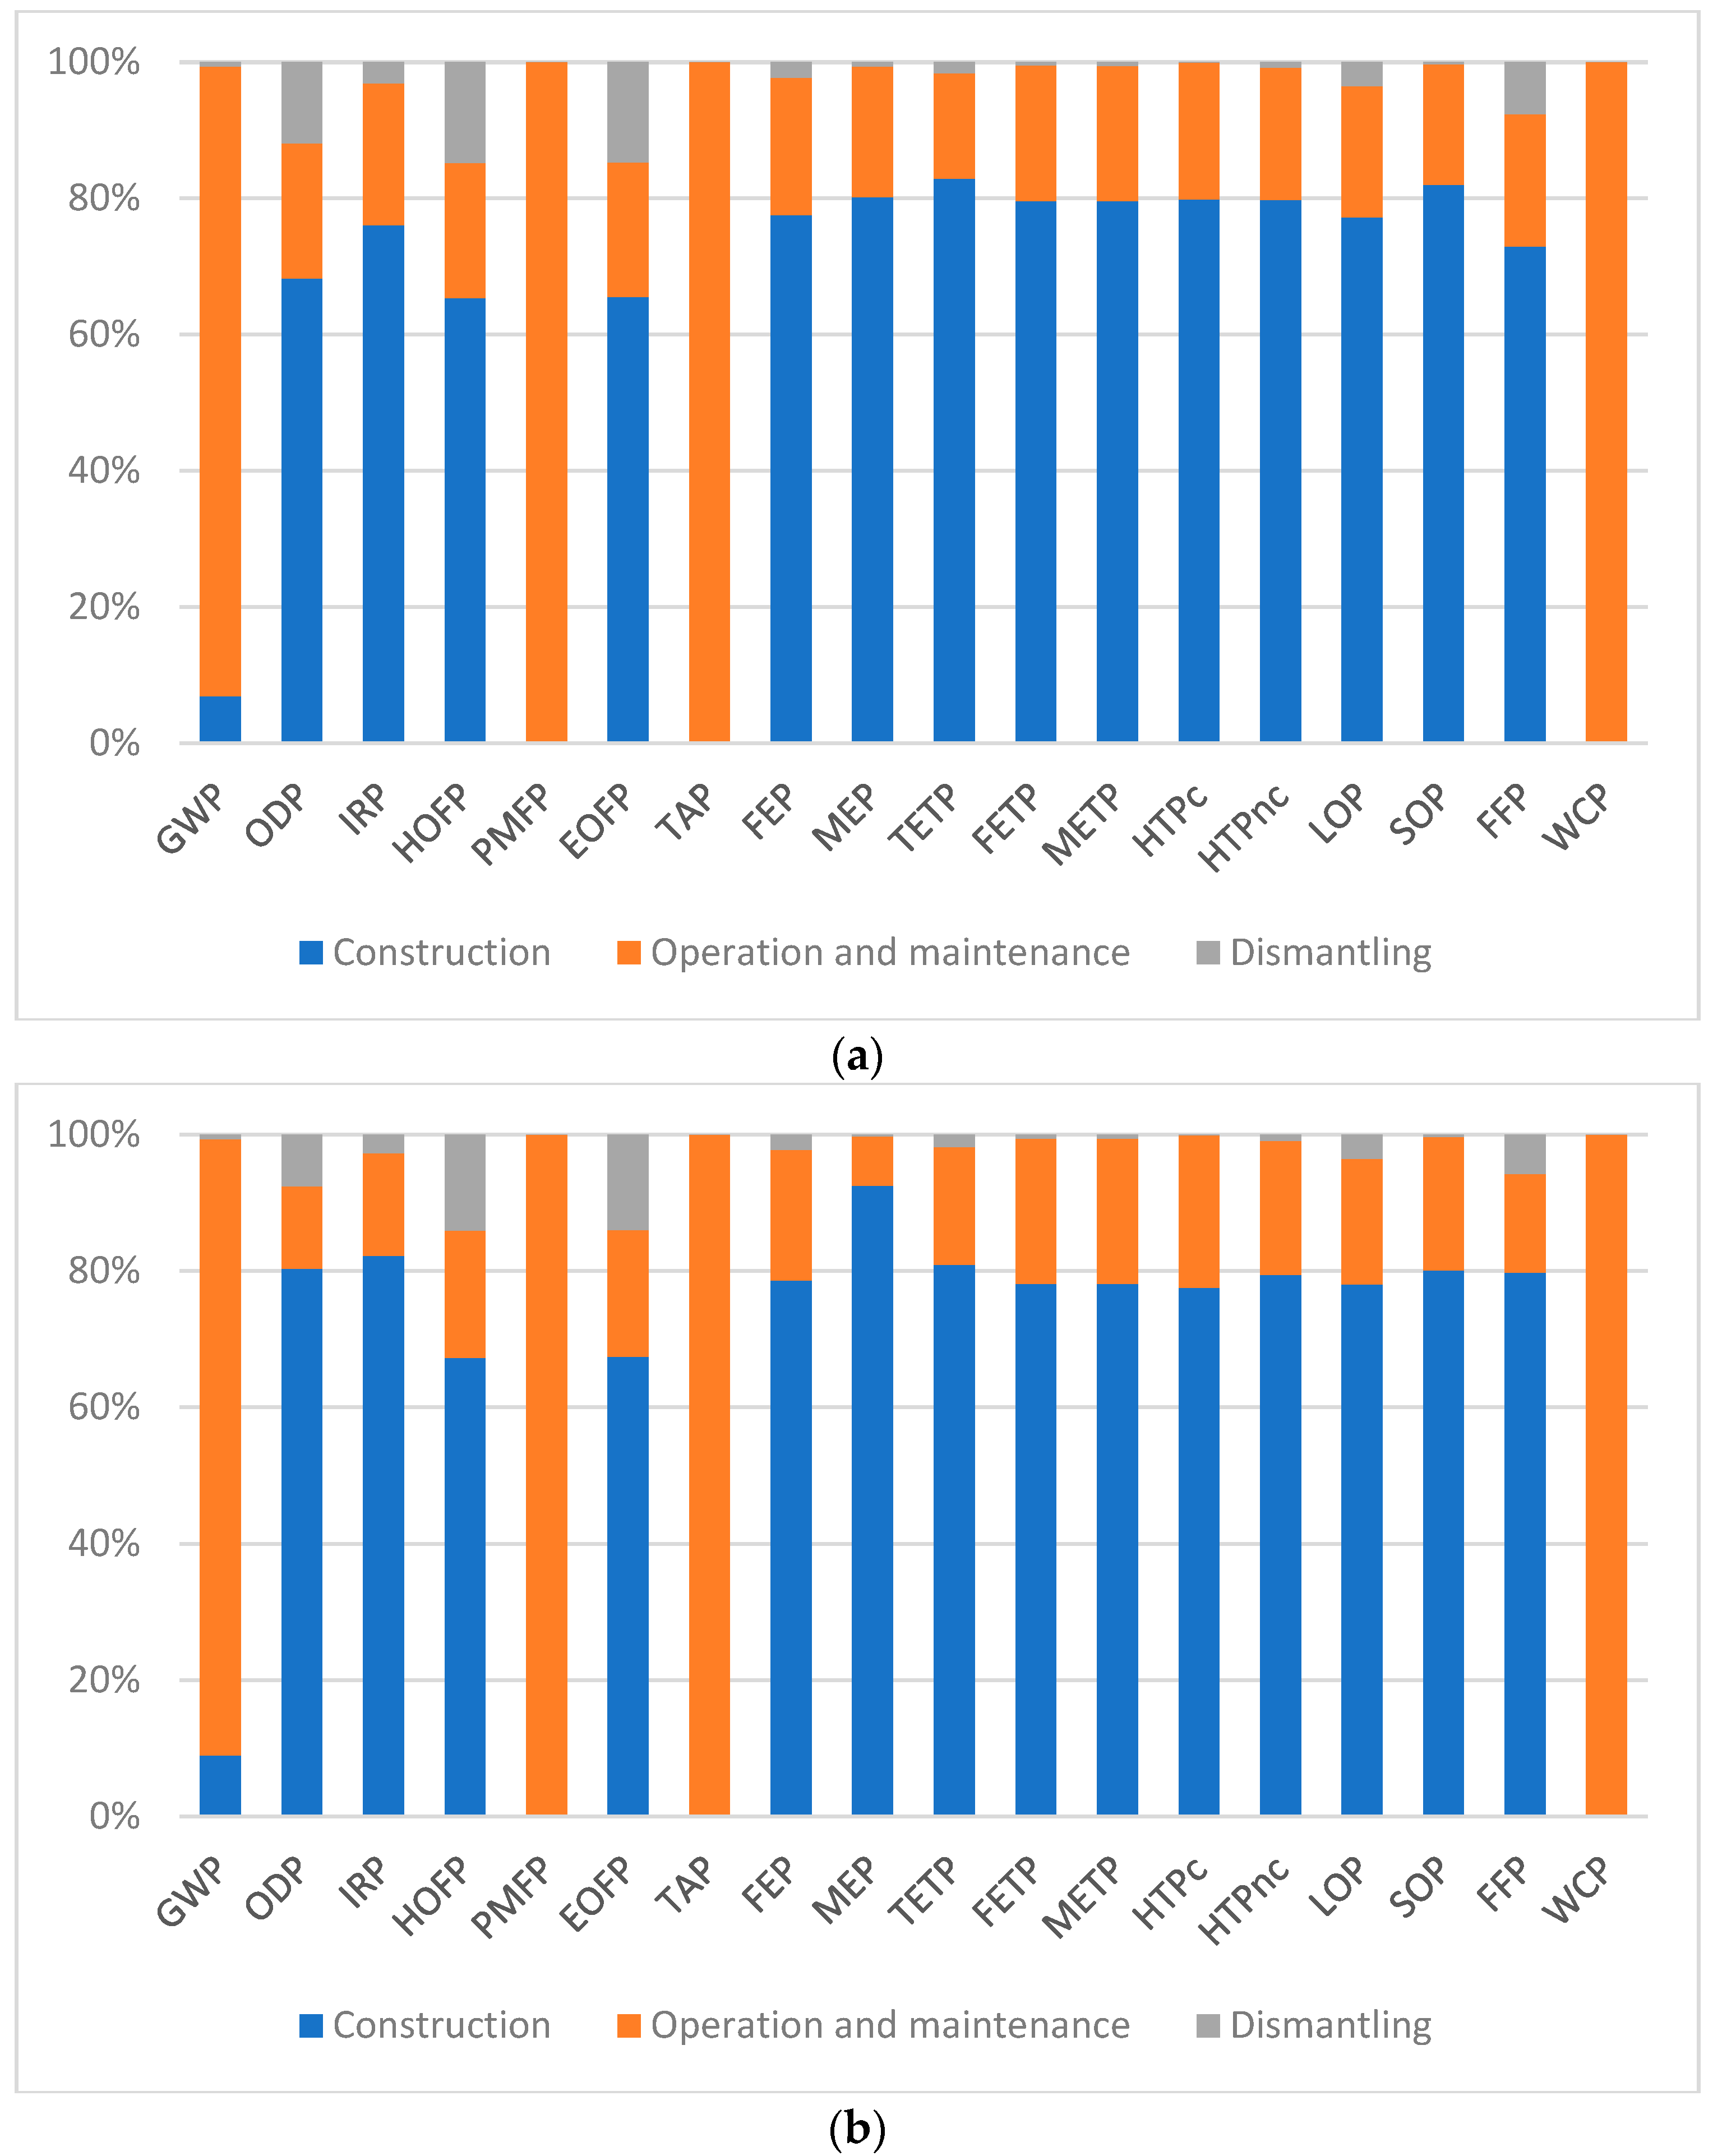
3.2. Life Cycle Assessment of the Three Main Stages of the Baseline Scenario

A detailed analysis of the three main stages of the life cycle was carried out. The results of construction, operation and maintenance, and dismantling are shown in Figure 6.
The construction phase has the most relevant environmental load for both electricity and heat production in nearly all 18 indicators studied. Exceptions are observed for the global warming potential, terrestrial acidification, fine particulate matter formation and water consumption, in which the highest environmental impacting process is the operation and maintenance stage (O&M).
Furthermore, the dismantling stage had the lowest impact on all the evaluated indicators. The trends observed for the three stages studied are observed in the work of A. Paulillo et al. [38], dedicated to evaluating the case study of Hellisheidi.

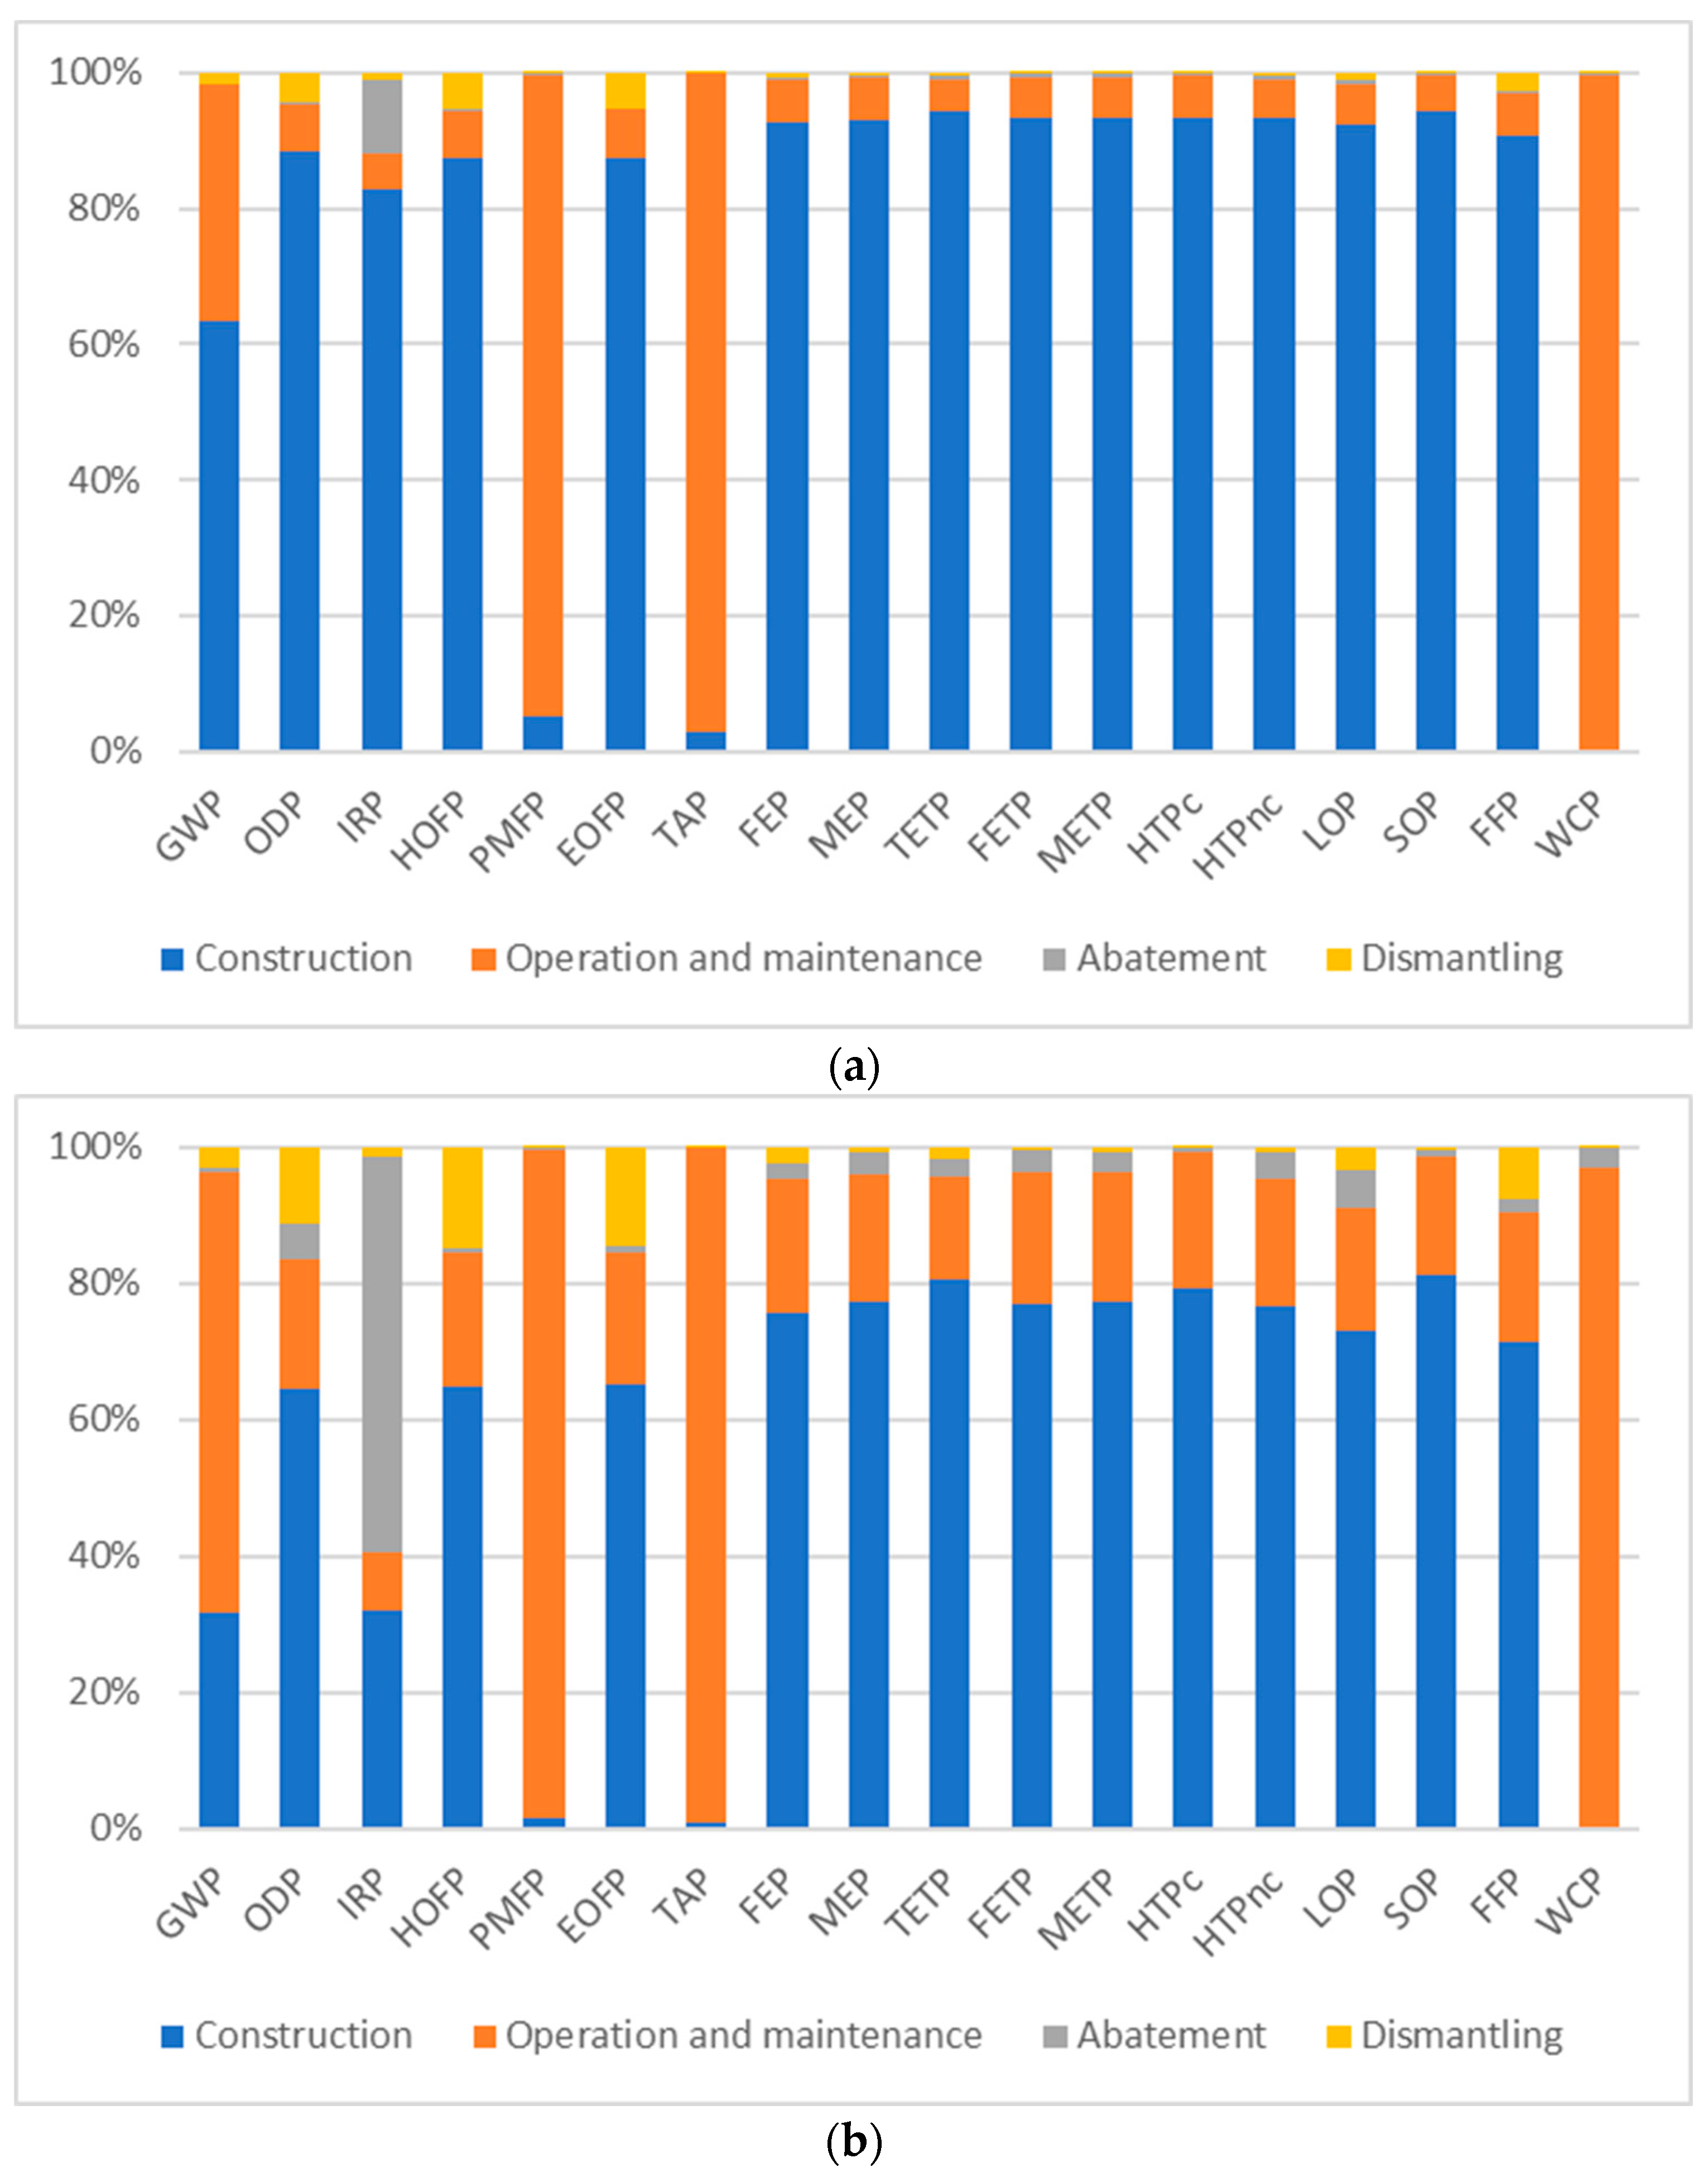
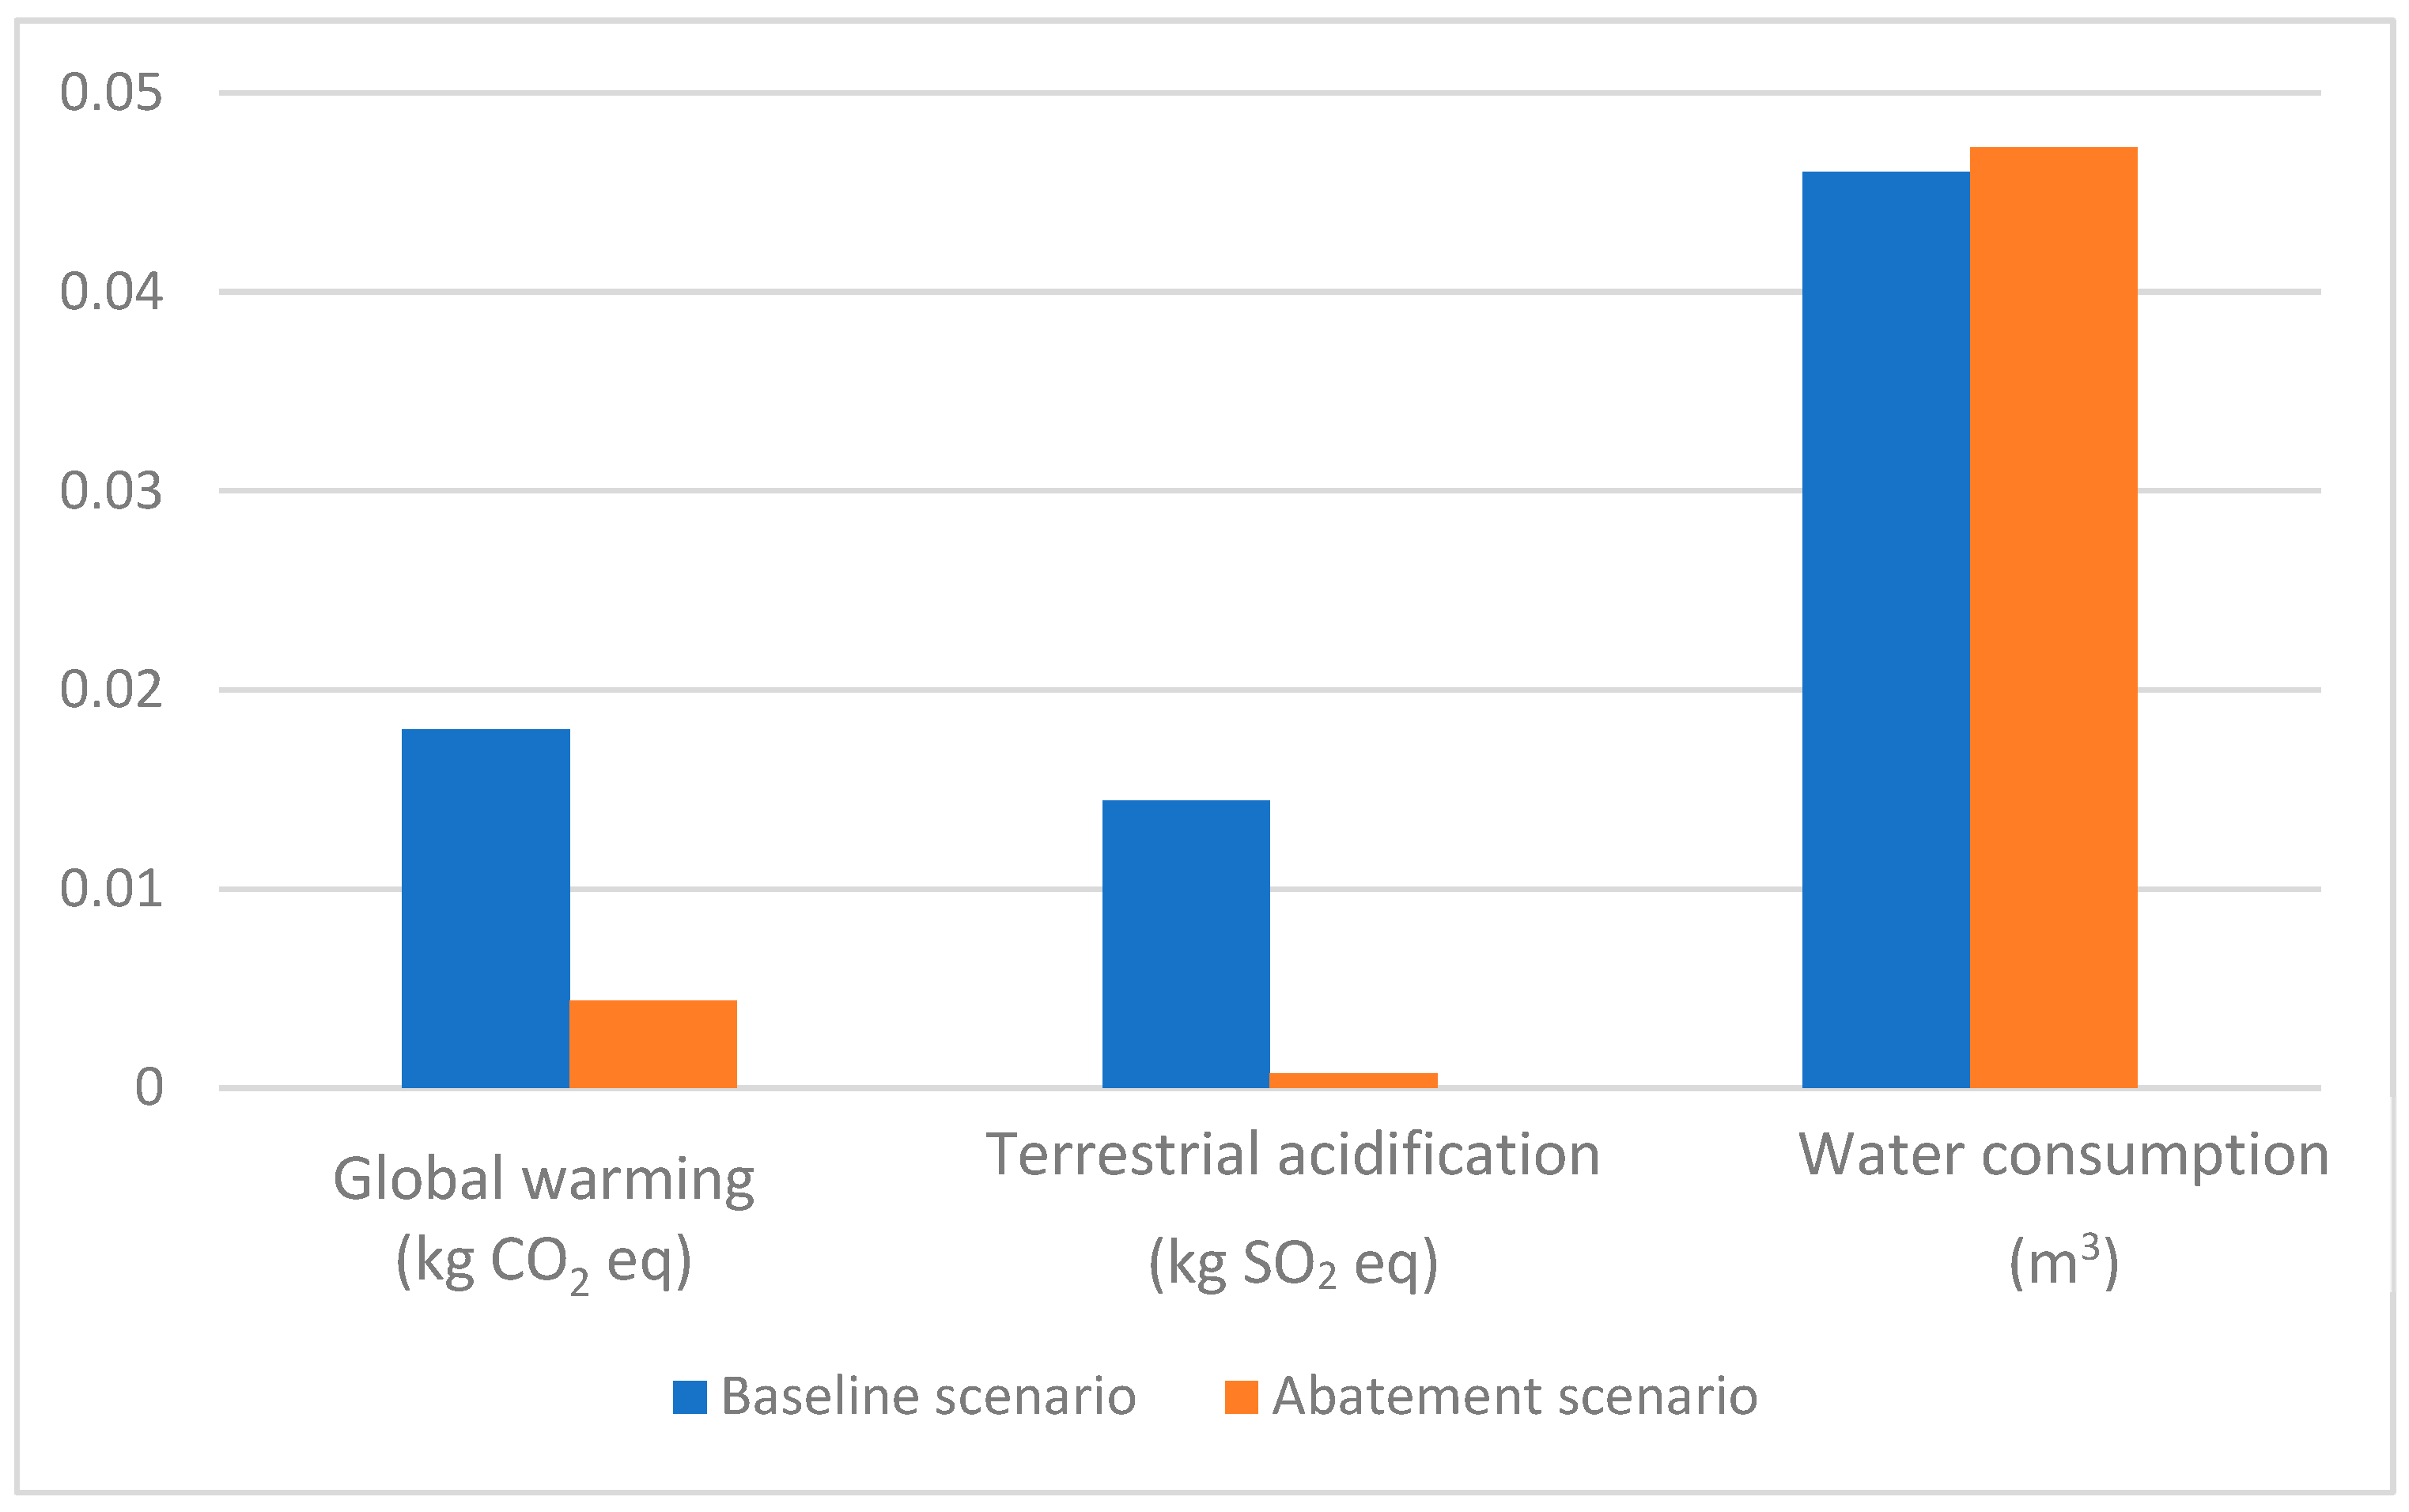
3.3. Results Comparison by Applying Abatement Stage

Figure 7 is included to compare the environmental load achieved by the implementation of a fourth stage, which corresponds to the abatement system. This technology, developed within the GECO project, allows for a 95% reduction in CO2 and H2S emissions form the Nesjavellir GPP. As in the baseline scenario, the 18 indicators studied are shown to produce 1 kWhe and 1 kWht.
Concerning the global warming potential indicator, the implementation of the abatement system results in the production of 3.4 g CO2 eq and 1.01 g CO2 eq for 1 kWhe and 1 kWht, respectively. Compared to the plant model without the NCG system capture, it reveals reductions of 78% and 60% in the global warming potential terms for the production of 1 kWhe and 1 kWht, respectively. The introduction of the CarbFix abatement system to remove CO2 and H2S from the NCGs emitted by the Nesjavellir GPP brings about changes in the evaluated environmental impacts for the baseline scenario. The abatement stage considers the construction of the facilities (equipment and piping) as well as its operation and maintenance (equipment replacement and water consumption). The energy consumption is embedded in the plant’s net electricity. The NCGs are linked to the geothermal fluid extracted from the subsurface which, for simplicity of calculations, is analysed in the operation and maintenance of the baseline scenario (orange bars).
In more detail to the category impacts, Figure 8 illustrates the relevant impact changes between the baseline scenario and the abatement system studied. The main results reveal that the technology of the NCG reduction system is environmentally plausible from the baseline scenario, increasing the amount of CO2 and H2S captured. Figure 8 shows the most significant changes in terms of the global warming potential, terrestrial acidification and water consumption, and the latter is increased due to the amount of water used in the scrubber.

3.4. Environmental Evaluation Methodology

Table 2 and Table 3 represent the cost associated with the externalities for the initial scenario without the abatement system. The parameters of global warming potential and terrestrial acidification are considered for 1 kWh of electricity and thermal energy. These values are relevant since they are compared with the case in which the GECO project innovations are implemented (CarbFix technology modified).
Table 4 and Table 5 summarise the information related to the externalities for each of the productions.
Figure 9 is a clear representation of the added value of implementing the abatement system developed in the GECO project. There is a significant change associated with the externalities. The change in the cost associated with the emissions in the baseline and after applying the GECO project technology has reduced the external costs to result in a 97% impact for the production of 1 kWhe and a 98% impact for the production of 1 kWht.

4. Conclusions

This study was dedicated to the environmental assessment of the Nesjavellir GPP as well as the implementation of the abatement system developed in the GECO project. In this vein, primary raw data concerning geothermal wells and different technical parameters as well as secondary data from the database used for the LCA modelling were obtained. The LCI data was allocated using the exergy approach, with material and energy burdens normalised per functional unit of 1 kWh for net electricity and 1 kWh of net heat produced. The results show that when reducing the NCG in the pilot plant, there are already environmental, cost, and environmental cost benefits for the global warming and terrestrial acidification impact categories for the case of the environmental impacts and costs.
Though the comprehensive baseline (initial situation) LCA was carried out in this work, it becomes evident that the construction stage plays a pivotal role in shaping the overall global environmental burden of the system. The findings underscore the crucial significance of addressing environmental considerations during the construction phase of the Nesjavellir GPP for effective environmental impact mitigation and sustainability. Related impacts were found to be dominated by the geothermal wells, mechanical equipment and power plant building. This environmental behaviour of the Nesjavellir GPP has reflected similar trends that were determined for the environmental performance of the Hellisheidi GPP defined by previous works in the literature.
When installing the abatement system, there were some categories that were improved in the global environmental performance of the Nesjavellir GPP, mainly the global warming potential, terrestrial acidification and fine particulate matter formation. Therefore, the benefits of incorporating this type of technology have been supported by the LCA and externality studies.

Author Contributions

Conceptualisation, M.D.M.-T., H.L. and M.D.-R.; methodology, M.D.M.-T., H.L. and M.D.-R.; validation, S.J.E., G.M. and C.Z.; formal analysis, M.D.M.-T., H.L., G.M., C.Z. and M.D.-R.; investigation, M.D.M.-T., H.L., G.M., C.Z. and M.D.-R.; resources, S.J.E.; writing—original draft preparation, M.D.M.-T., H.L. and M.D.-R.; writing—review and editing, M.D.M.-T., H.L., G.M., C.Z., S.J.E. and M.D.-R. All authors have read and agreed to the published version of the manuscript.

Funding

This research received funding from the European Union’s Horizon 2020 Research and Innovation Programme under Grant Agreement no. 818169, GECO project (Geothermal Emission Gas Control, https://https://geco-h2020.eu/) (accessed on 25 January 2022).

Institutional Review Board Statement

Not applicable.

Informed Consent Statement

Not applicable.

Data Availability Statement

The data presented in this study are available in the Appendix A and Appendix B in this manuscript. Additional data are not available due to confidential issues.

Acknowledgments

The authors express their gratitude to the GECO project’s partners for their support in the development of this study.

Conflicts of Interest

The authors declare no conflict of interest.

Nomenclature

EIEnvironmental indicator
GPPGeothermal power plant
LCALife cycle assessment
LCILife cycle inventory
NCGNon-condensable gases
WTPWillingness to pay

Appendix A. LCI of Nesjavellir Power Plant

LCI for the construction stage of Nesjavellir power plant.
Table A1. Inventory related to geothermal narrow wells (construction) per plant lifetime.
Construction—Geothermal Narrow WellsAmountUnit
Steel (for well casing)2,373,155.4kg
Portland cement (drilling)136,500kg
Portland cement (well casing)1,314,366.9kg
Silica flour (well casing)525,747.9kg
Wyoming bentonite (well casing)26,287.8kg
Perlite (well casing)26,287.8kg
Retardant (drilling)2436kg
Water binder4200kg
Drill soap (drilling)12,425.7kg
Bentonite clay (drilling)823,200kg
Caustic soda (drilling)58,612.47kg
Water (from ground, for concrete)12,534,459kg
Water (from ground, for drilling)12,534,459kg
Diesel (operating of drill rig)2,004,307.2L
Table A2. Inventory related to geothermal reinjection wells (construction) per plant lifetime.
Construction—Geothermal Reinjection WellsAmountUnit
Steel (for well casing)162,657kg
Portland cement (drilling)9222.15kg
Portland cement (well casing)88,800.75kg
Silica flour (well casing)35,520.35kg
Wyoming bentonite (well casing)1776.05kg
Perlite (well casing)1776.05kg
Retardant (drilling)164.6kg
Water binder283.75kg
Drill soap (drilling)839.5kg
Bentonite clay (drilling)55,616.75kg
Caustic soda (drilling)3959.95kg
Water (from ground, for concrete)76,986.2kg
Water (from ground, for drilling)846,848.4kg
Diesel (operating of drill rig)137,376L
Table A3. Inventory related to wellhead equipment (construction) per plant lifetime.
Construction—Wellhead EquipmentAmountUnit
Excavation78,000m3
Fill2600m3
Concrete468kg
Steel378,924kg
Stainless steel416kg
Aluminium31,668kg
Table A4. Inventory related to collection pipeline (construction).
Construction—Collection PipelineAmountUnit
Excavation93,600m3
Fill43,160m3
Concrete3,744,000kg
Steel1,024,400Kg
Aluminium32,240Kg
Rockwool223,600Kg
Table A5. Inventory related to extraction site land use (construction).
Construction—Extraction Site Land UseAmountUnit
Land use for drilling operations135m2
Land use for drilling operations810m2
Table A6. Inventory related to heating station buildings (construction).
Construction—Power Plant BuildingsAmountUnit
Excavation230,100m3
Filling168,900m3
Concrete21,600,000m3
Steel6,617,400kg material
Stainless steel75,600kg material
Aluminium88,200kg material
Cooper19,800kg material
Mineral wool74,700kg material
Asphalt531,000kg material
Table A7. Inventory related to power plant buildings (construction).
Construction—Electrical Distribution BuildingsAmountUnit
Excavation38,750m3
Fill40,770m3
Concrete17,551,200m3
Steel742,983.8kg material
Cast iron41,423.70kg material
Black steel267,113kg material
PVC1660.20kg material
Rock wool35,155kg material
Iron69,600kg material
Aluminium69,600kg material
Plastic196kg material
Seals225kg material
Wood11,385kg material
Aluminium cladding7656kg material
Stainless steel42,140kg material
Antifreeze2072kg material
Asphalt154,767kg material
Fibreglass3750kg material
Stone10,267kg material
Table A8. Inventory related to mechanical equipment for electricity and heat.
EquipmentMaterialAmountUnit
HP Steam SeparatorSteel179,961kg material
Aluminium3355kg material
Mineral wool18,007kg material
PE plastic701kg material
HP Pre-separatorSteel31,945kg material
Aluminium599kg material
Mineral wool3216kg material
PE plastic125kg material
HP Moisture SeparatorSteel104,134kg material
Aluminium1654kg material
Mineral wool8875kg material
PE plastic345kg material
Steam HoodSteel59,831kg material
Stainless steel22,160kg material
Aluminium1428kg material
Mineral wool5552kg material
PE plastic304kg material
HP TurbineSteel816,000kg material
Transformer oil + lubricant oil28,160kg material
Cold and EnginesSteel25,688kg material
Aluminium32,128kg material
GRP fibreglass reinforced plastic380,932kg material
HP CondenserStainless steel425,600kg material
Aluminium3240kg material
Titanium106,400kg material
Mineral wool1440kg material
Electrical TransformersSteel203,175kg material
Copper74,770kg material
Transformer oil107,394kg material
Wood10,691kg material
Cooling TowerSteel6422kg material
Aluminium8032kg material
GRP fibreglass reinforced plastic95,233kg material
The “six-tenths rule” was used for the scaling of the abatement equipment [40] at the Nesjavellir plant. Through this method, it was possible to make an estimate for the calculation of the amount of material needed in the scale-up from the pilot plant. This required values for the materials used in the pilot plant equipment and the gas removal capacities (%) of both the pilot plant and the future facility. The re-injection values are 8% and 95%, respectively. These parameters are related according to Equation (A1):
M a t e r i a l 2 M a t e r i a l 1 = R e m o v a l c a p a c i t y 2 ( % ) R e m o v a l   c a p a c i t y 1   % n    
where:
  • Material1—the amount of material corresponding to the pilot facilities (kg);
  • Material2—the amount of material corresponding to the facilities expected for 2030 (kg);
  • Removal capacity1—the percentage of gases not emitted to the atmosphere (8%);
  • Removal capacity2—the percentage of gases not emitted to the atmosphere expected for 2030 (95%);
  • n—William exponent, which may vary from 0.48 to 0.87 for equipment.
Table A9. Inventory related to the abatement process (equipment).
EquipmentMaterialAmountUnit
HousingSteel16,771.19kg material
Heat exchangerStainless steel3310kg material
CompressorSteel4650.91kg material
Copper618.64kg material
Absorption towerStainless steel4767.36kg material
Pump 1Stainless steel75.42kg material
Copper10.03kg material
Pump 2Stainless steel68.41kg material
Copper9.10kg material
Table A10. Inventory related to the abatement piping (construction).
MaterialAmountUnit
High-density polyethylene 48,182.38kg material
Polyurethane (insulation)698.42kg material
Cross-linked polyethylene103.69kg material
Polyethylene736.62kg material
Stainless steel3658.25kg material
Table A11. Inventory related the operation and maintenance of abatement stage.
Operation Phase (Utilities)
MaterialAmountUnit
Utility consumptionWater 41,754,956,217l
Electricity220,373,380kWh
Maintenance Phase (Replacement)
EquipmentMaterialAmountUnit
Heat exchangerStainless steel9930.307kg material
CompressorStainless steel11,162.17kg material
Copper1484.75kg material
Pump 1Stainless steel133.10kg material
Copper17.70kg material
Pump 2Stainless steel120.73kg material
Copper16.05kg material

Appendix B. Economic Value Conversion Factors

Table A12. Economic value conversion factors (EUR/midpoint impact unit).
Impact CategoryUnitEconomic Value Conversion Factor (EUR)
Climate changekg CO2 eq0.0273
Terrestrial acidificationkg SO2 eq0.9191
Freshwater eutrophicationkg P eq4.0768
Marine eutrophicationkg N eq1.274
Terrestrial ecotoxicitykg 1.4-DB eq10.2284
Freshwater ecotoxicity kg 1.4-DB eq10.2284
Marine ecotoxicitykg 1.4-DB eq10.2284
Agricultural land occupationm2a0.14833
Urban land occupationm2a0.10374
Natural land transformationm2a2.9666
Water depletionm30.0546
Metal depletionkg Fe eq0.004368
Fossil depletionkg oilg eq0.02457
Ozone depletionDALY8471.827
Photochemical oxidant formationDALY8471.827
Particulate matter formationDALY8471.827
Human toxicityDALY8471.827
Ionising radiationDALY8471.827

References

  1. Gunnarsdottir, I.; Davidsdottir, B.; Worrell, E.; Sigurgeirsdottir, S. Indicators for sustainable energy development: An Icelandic case study. Energy Policy 2022, 164, 112926. [Google Scholar] [CrossRef]
  2. Armaroli, N.; Balzani, V. The future of energy supply: Challenges and opportunities. Angew. Chem. Int. Ed. 2007, 46, 52–66. [Google Scholar] [CrossRef] [PubMed]
  3. Greiner, P.T.; York, R.; McGee, J.A. When are fossil fuels displaced? An exploratory inquiry into the role of nuclear electricity production in the displacement of fossil fuels. Heliyon 2022, 8, e08795. [Google Scholar] [CrossRef]
  4. Olabi, A.G.; Abdelkareem, M.A. Renewable energy and climate change. Renew. Sustain. Energy Rev. 2022, 158, 112111. [Google Scholar] [CrossRef]
  5. Tutak, M.; Brodny, J. Renewable energy consumption in economic sectors in the EU-27. The impact on economics, environment and conventional energy sources. A 20-year perspective. J. Clean. Prod. 2022, 345, 131076. [Google Scholar] [CrossRef]
  6. Cunha, R.P.; Bourne-Webb, P.J. A critical review on the current knowledge of geothermal energy piles to sustainably climatize buildings. Renew. Sustain. Energy Rev. 2022, 158, 112072. [Google Scholar] [CrossRef]
  7. Vargas, C.A.; Caracciolo, L.; Ball, P.J. Geothermal energy as a means to decarbonize the energy mix of megacities. Commun. Earth Environ. 2022, 3, 66. [Google Scholar] [CrossRef]
  8. Frick, S.; Kaltschmitt, M.; Schröder, G. Life cycle assessment of geothermal binary power plants using enhanced low-temperature reservoirs. Energy 2010, 35, 2281–2294. [Google Scholar] [CrossRef]
  9. Vicidomini, M.; Agostino, D.D. Geothermal Source Exploitation for Energy Saving and Environmental Energy Production. Energies 2022, 15, 6420. [Google Scholar] [CrossRef]
  10. Global Geothermal Energy Capacity 2021|Statista. Available online: https://www.statista.com/statistics/476281/global-capacity-of-geothermal-energy/ (accessed on 27 March 2023).
  11. Lund, J.W.; Toth, A.N. Direct utilization of geothermal energy 2020 worldwide review. Geothermics 2021, 90, 101915. [Google Scholar] [CrossRef]
  12. Gkousis, S.; Welkenhuysen, K.; Compernolle, T. Deep geothermal energy extraction, a review on environmental hotspots with focus on geo-technical site conditions. Renew. Sustain. Energy Rev. 2022, 162, 112430. [Google Scholar] [CrossRef]
  13. Soltani, M.; Kashkooli, F.M.; Souri, M.; Rafiei, B.; Jabarifar, M.; Gharali, K.; Nathwani, J.S. Environmental, economic, and social impacts of geothermal energy systems. Renew. Sustain. Energy Rev. 2021, 140, 110750. [Google Scholar] [CrossRef]
  14. Hamm, S.G.; Anderson, A.; Blankenship, D.; Boyd, L.W.; Brown, E.A.; Frone, Z.; Winick, J. Geothermal energy R&D: An overview of the U.S. department of energy’s geothermal technologies office. J. Energy Resour. Technol. Trans. ASME 2021, 143, 100801–100802. [Google Scholar] [CrossRef]
  15. Kabeyi, M.J.B.; Olanrewaju, O.A. Geothermal wellhead technology power plants in grid electricity generation: A review. Energy Strategy Rev. 2022, 39, 100735. [Google Scholar] [CrossRef]
  16. Díaz-Ramírez, M.; Jokull, S.; Zuffi, C.; Mainar-Toledo, M.D.; Manfrida, G. Environmental Assessment of Hellisheidi Geothermal Power Plant based on Exergy Allocation Factors for Heat and Electricity Production. Energies 2023, 16, 3616. [Google Scholar] [CrossRef]
  17. Manfrida, G.; Talluri, L.; Ungar, P.; Zuffi, C.; Díaz-Ramírez, M.; Leiva, H.; Mainar-Toledo, M.D.; Jokull, S. Exergo-economic and exergo-environmental assessment of two large CHP geothermal power plants. Geothermics 2023, 113, 102758. [Google Scholar] [CrossRef]
  18. Sigfússon, B.; Arnarson, M.P.; Snæbjörnsdóttir, S.Ó.; Karlsdóttir, M.R.; Aradóttir, E.S.; Gunnarsson, I. Reducing emissions of carbon dioxide and hydrogen sulphide at Hellisheidi power plant in 2014–2017 and the role of CarbFix in achieving the 2040 Iceland climate goals. Energy Procedia 2018, 146, 135–145. [Google Scholar] [CrossRef]
  19. Kristjánsdóttir, H.; Kristjánsdóttir, S. Carbfix and sulfix in geothermal production, and the blue lagoon in iceland: Grindavík urban settlement, and volcanic activity. Balt. J. Econ. Stud. 2021, 7, 1–9. [Google Scholar] [CrossRef]
  20. Karlsdottir, M.R.; Palsson, O.P.; Palsson, H. LCA of Combined Heat and Power Production at Hellisheidi Geothermal Power Plant with Focus on Primary Energy Efficiency. 2010, pp. 184–192. Available online: https://iris.rais.is/en/publications/lca-of-combined-heat-and-power-production-at-hellisheidi-geotherm (accessed on 27 March 2023).
  21. Douziech, M.; Tosti, L.; Ferrara, N.; Parisi, M.L.; Pérez-López, P.; Ravier, G. Applying harmonised geothermal life cycle assessment guidelines to the Rittershoffen geothermal heat plant. Energies 2021, 14, 3820. [Google Scholar] [CrossRef]
  22. Gómez-Diaz, E.; Newson, J.; Scott, S.; Ratouis, T. Numerical Modelling of Fluid Flow and Heat Transfer in a Dual-porosity Domain in the Shallow Zone of the Nesjavellir Geothermal System. In Proceedings of the 43rd New Zealand Geothermal Workshop, Wellington, New Zealand, 23–25 November 2021; Available online: https://www.researchgate.net/publication/358274211_Numerical_Modelling_of_Fluid_Flow_and_Heat_Transfer_in_a_Dual-porosity_Domain_in_the_Shallow_Zone_of_the_Nesjavellir_Geothermal_System (accessed on 27 March 2023).
  23. Atlason, R.S.; Unnthorsson, R. Hot water production improves the energy return on investment of geothermal power plants. Energy 2013, 51, 273–280. [Google Scholar] [CrossRef]
  24. Reykjavík Energy. Emissions of Carbon Dioxide & Hydrogen Sulphide and Emission Intensity from Hellisheidi and Nesjavellir; Reykjavík Energy: Reykjavík, Iceland, 2021. [Google Scholar]
  25. Gunnarsson, I.; Aradóttir, E.S.; Sigfússon, B.; Gunnlaugsson, E.; Júlíusson, B.M. Geothermal Gas Emission From Hellisheidi and Nesjavellir Power Plants, Iceland. GRC Trans. 2013, 37, 7859. Available online: https://www.or.is/documents/645/geothermal_gas_emission_from_hellisheidi_and_nesjavellir_power_plants_fudCiwr.pdf (accessed on 5 April 2023).
  26. Díaz-Ramírez, M.C.; Blecua-de-Pedro, M.; Arnal, A.J.; Post, J. Acid/base flow battery environmental and economic performance based on its potential service to renewables support. J. Clean. Prod. 2022, 330, 129529. [Google Scholar] [CrossRef]
  27. Royo, P.; Acevedo, L.; Arnal, J.; Diaz-Ramírez, M.; García-Armingol, T.; Ferreira, V.J.; Ferreira, G.; López-Sabirón, A.M. Decision Support System of Innovative High-Temperature Latent Heat Storage for Waste Heat Recovery in the Energy-Intensive Industry. Energies 2021, 14, 365. [Google Scholar] [CrossRef]
  28. Blecua-De-pedro, M.; Díaz-Ramírez, M.C. Assessment of Potential Barriers to the Implementation of an Innovative AB-FB Energy Storage System under a Sustainable Perspective. Sustainability 2021, 13, 11042. [Google Scholar] [CrossRef]
  29. Arnal, Á.J.; Díaz-Ramírez, M.; Acevedo, L.; Ferreira, V.J.; García-Armingol, T.; López-Sabirón, A.M.; Ferreira, G. Multicriteria analysis for retrofitting of natural gas melting and heating furnaces for sustainable manufacturing and industry 4.0. J. Energy Resour. Technol. Trans. ASME 2020, 142, 2. [Google Scholar] [CrossRef]
  30. Díaz-Ramírez, M.C.; Ferreira, V.J.; García-Armingol, T.; López-Sabirón, A.M.; Ferreira, G. Battery Manufacturing Resource Assessment to Minimise Component Production Environmental Impacts. Sustainability 2020, 12, 6840. [Google Scholar] [CrossRef]
  31. Díaz-Ramírez, M.C.; Ferreira, V.J.; García-Armingol, T.; López-Sabirón, A.M.; Ferreira, G. Environmental Assessment of Electrochemical Energy Storage Device Manufacturing to Identify Drivers for Attaining Goals of Sustainable Materials 4.0. Sustainability 2020, 12, 342. [Google Scholar] [CrossRef]
  32. Karlsdóttir, M.R.; Pálsson, Ó.P.; Pálsson, H.; Maya-Drysdale, L. Life cycle inventory of a flash geothermal combined heat and power plant located in Iceland. Int. J. Life Cycle Assess. 2015, 20, 503–519. [Google Scholar] [CrossRef]
  33. Blanc, I.; Damen, L.; Douziech, M.; Fiaschi, D.; Manfrida, G.; Parisi, M.L.; Lopez, P.P.; Ravier, G.; Tosti, L.; Mendecka, B. First version of harmonized Guidelines to Perform Environmental Assessment for Geothermal Systems Based on LCA and non LCA Impact Indicators: LCA Guidelines for Geothermal Installations. Deliverable 3.2. In GEOENVI Project. 2010. Available online: https://www.geoenvi.eu/wp-content/uploads/2020/03/D3.2_LCA_Guidelines-for-geothermal-installations_February-2020.pdf (accessed on 22 January 2022).
  34. Hai, T.; Radman, S.; Abed, A.M.; Shawabkeh, A.; Abbas, S.Z.; Deifalla, A.; Ghaebi, H. Exergo-economic and exergo-environmental evaluations and multi-objective optimization of a novel multi-generation plant powered by geothermal energy. Process Saf. Environ. Prot. 2023, 172, 57–68. [Google Scholar] [CrossRef]
  35. Colucci, V.; Manfrida, G.; Mendecka, B.; Talluri, L.; Zuffi, C. LCA and Exergo-Environmental Evaluation of a Combined Heat and Power Double-Flash Geothermal Power Plant. Sustainability 2021, 13, 1935. [Google Scholar] [CrossRef]
  36. Karlsdottir, M.R.; Heinonen, J.; Palsson, H.; Palsson, O.P. High-Temperature Geothermal Utilization in the Context of European Energy Policy—Implications and Limitations. Energies 2020, 12, 3187. [Google Scholar] [CrossRef]
  37. Orfanidou, V.S.; Rachaniotis, N.P.; Tsoulfas, G.T.; Chondrokoukis, G.P. Life Cycle Costing Implementation in Green Public Procurement: A Case Study from the Greek Public Sector. Sustainability 2023, 15, 2817. [Google Scholar] [CrossRef]
  38. Paulillo, A.; Striolo, A.; Lettieri, P. The environmental impacts and the carbon intensity of geothermal energy: A case study on the Hellisheiði plant. Environ. Int. 2019, 133, 105226. [Google Scholar] [CrossRef] [PubMed]
  39. Yuan, X.; Chen, L.; Sheng, X.; Liu, M.; Xu, Y.; Tang, Y.; Wang, Q.; Ma, Q.; Zuo, J. Life Cycle Cost of Electricity Production: A Comparative Study of Coal-Fired, Biomass, and Wind Power in China. Energies 2021, 14, 3463. [Google Scholar] [CrossRef]
  40. Seider, W.D.; Lewin, D.R.; Seader, J.D.; Widagdo, S.; Gani, K.M.N.R. Product and Process Design Principles: Synthesis, Analysis, and Evaluation, 4th ed.; John Wiley & Sons: Hoboken, NJ, USA, 2016. [Google Scholar]
Figure 1. Simplified diagram of the Nesjavellir power plant (source: Reykjavik Energy).
Sustainability 15 13943 g001
Figure 2. Schematic representation of the geothermal gas injection process at the CarbFix pilot plant of the Nesjavellir power plant (source: GECO project).
Sustainability 15 13943 g002
Figure 3. Supply chain of producing 1 kWh of thermal and electricity energy.
Sustainability 15 13943 g003
Figure 4. Principal unit processes outlining the generation of electricity and heat at the Nesjavellir CHP plant.
Sustainability 15 13943 g004
Figure 5. Environmental impacts related to production of 1 kWhe and 1 kWht.
Sustainability 15 13943 g005
Figure 6. Environmental impacts related to the three main stages. (a) Production of 1 kWhe and (b) production of 1 kWht.
Sustainability 15 13943 g006
Figure 7. Environmental impacts of all stages related to production of (a) 1 kWhe and (b) 1 kWht when implementing abatement system on Nesjavellir.
Sustainability 15 13943 g007
Figure 8. Comparison of baseline scenario and abatement system implementation.
Sustainability 15 13943 g008
Figure 9. Comparison in terms of EUR/kWh between the baseline and the geothermal plant implementing the capture and reinjection system in Nesjavellir.
Sustainability 15 13943 g009
Table 1. Environmental impact indicators and respective units for the study.
Impact CategoryUnitAbbr.
Global Warming Potentialkg CO2 eqGWP
Stratospheric Ozone Depletionkg CF-11 eqODP
Ionising Radiationkg Co-60 eqIRP
Ozone Formation, Human Healthkg NOx eq HOFP
Ozone Formation, Terrestrial Ecosystemkg NOx eqEOFP
Fine Particulate Matter Formationkg PM2.5 eqPMFP
Terrestrial Acidificationkg SO2 eqTAP
Freshwater Eutrophication kg P eqFEP
Marine Eutrophication kg N eqMEP
Terrestrial Ecotoxicitykg 1,4-DCBTETP
Freshwater Ecotoxicitykg 1,4-DCBFETP
Marine Ecotoxicitykg 1,4-DCBMETP
Human Carcinogenic Toxicitykg 1,4-DCBHTPc
Human Non-Carcinogenic Toxicitykg 1,4-DCBHTPnc
Land Usem2a crop eqLOP
Mineral Resource Scarcitykg Cu eqSOP
Fossil Resource Scarcitykg oil eqFFP
Water Consumptionm3WCP
Table 2. Life cycle inventory assessment midpoint results of Nesjavellir GPP baseline (externalities for 1 kWhe).
Impact CategoryUnitEconomic Value Conversion Factor (EUR/EI) [39]Total Environmental Impact per Functional Unit (EI/kWhe)External Cost (EUR/kWhe)
Climate changekg CO2 eq0.030.01554.65 × 10−4
Terrestrial acidificationkg SO2 eq1.010.01240.0125
Total---0.01297
Table 3. Life cycle inventory assessment midpoint results of Nesjavellir GPP baseline (externalities for 1 kWht).
Impact CategoryUnitEconomic Value Conversion Factor (EUR/EI) [39]Total Environmental Impact per Functional Unit (EI/kWht)External Cost (EUR/kWht)
Climate changekg CO2 eq0.030.002557.65 × 10−5
Terrestrial acidificationkg SO2 eq1.010.0020.00202
Total---0.0021
Table 4. Life cycle inventory assessment midpoint results of Nesjavellir GPP including the abatement system (externalities for 1 kWhe).
Impact CategoryUnitEconomic Value Conversion Factor (EUR/EI) [39]Total Environmental Impact per Functional Unit (EI/kWhe)External Cost (EUR/kWhe)
Climate changekg CO2 eq0.030.003391.017 × 10−4
Terrestrial acidificationkg SO2 eq1.016.63 × 10−46.696 × 10⁻⁴
Total---0.00078
Table 5. Life cycle inventory assessment midpoint results of Nesjavellir GPP including the abatement system (externalities for 1 kWht).
Impact CategoryUnitEconomic Value Conversion Factor (EUR/EI) [39]Total Environmental Impact per Functional Unit (EI/kWht)External Cost (EUR/kWht)
Climate changekg CO2 eq0.030.001013 × 10−5
Terrestrial acidificationkg SO2 eq1.011.03 × 10−41.04 × 10⁻⁴
Total---0.000134
Disclaimer/Publisher’s Note: The statements, opinions and data contained in all publications are solely those of the individual author(s) and contributor(s) and not of MDPI and/or the editor(s). MDPI and/or the editor(s) disclaim responsibility for any injury to people or property resulting from any ideas, methods, instructions or products referred to in the content.

