Abstract
As an important replacement resource for conventional oil and gas, tight oil and gas are quite abundant. Long horizontal wells and multi-stage fracturing have become key technologies for developing tight oil and gas, and reasonable shut-in measures can improve the utilization efficiency of fracturing fluid. Therefore, it is especially critical to master the pressure transfer law during the shut-in process in tight reservoirs to further improve the energy efficiency of fracturing fluid. However, many studies have mostly focused on the separate design of fracturing, shut-in and production, and have not yet revealed the pressure transfer law during shutting in well based on the integration of fracturing, shut-in and production, which makes it difficult to realize the efficient development of tight oil and gas. Taking the tight oil reservoir in Block M as an example, the geological model of the target block was established using an integrated fracturing development software platform, on which the simulation of fracture extension, well shut-in and production was carried out. The changes in the reservoir pressure field during shutting in well were analyzed, and the influence law of fracturing fluid volume, shut-in time, reservoir original formation pressure and fracture network complexity on the effect of well shut-in were studied to optimize the shut-in system. It was found that the retained fluid increases, the pore pressure of the near-fracture matrix increases, and the diffusion distance of fracturing fluid to the distant matrix increases. The tight oil production increased after shutting in well, and the optimal retained fluid volume of 9600 m3 was actually preferred based on the model. The pore pressure of the near-fracture matrix decreases as the shut-in time increases, the diffusion distance of fracturing fluid to the distant matrix increases, and the pore pressure decreases with an increase in diffusion distance. The tight oil production increased after shutting in well, and the optimal shut-in time was actually preferred to be 90 days based on the model. The increase in formation pressure on abnormal low pressure formation is larger, and the production can be significantly improved after shutting in well. The more complex the fracture network is, the more obvious the non-uniform variation in matrix pore pressure during shutting in well. The research is of great significance for the optimal design of a shut-in system for tight reservoirs and the sustainable development of oil and gas resources in China.
1. Introduction
With the increasing depletion of conventional oil and gas, the development of conventional oil and gas in China has entered the middle and late stage, and unconventional oil and gas have gradually become the focus of oil and gas development [,,,,]. As the key resource for unconventional oil and gas development, tight oil is quite abundant. So far, tight oil with commercial exploitation potential has been found in Junggar, Ordos, Sichuan, Songliao and other basins [,,,,].
Horizontal wells and volumetric fracturing technology can form a complex network of fractures in the reservoir. The ability to increase the volume of reservoir modification while increasing the flow conductivity of the fractures can lead to an increase in single-well production [,,,,]. The oil field site shows that a reasonable shut-in system can not only strengthen the displacement of fracturing fluid with reservoir crude oil to increase production [,,,,], but also effectively replenish formation energy to avoid production decline due to rapid depletion of formation energy [,,,,]. In recent years, scholars at home and abroad have conducted a lot of research on this. Meng et al. [] found that an important reason for the improvement of core permeability during well shut-in is the generation of microfractures induced by percolation. Gupta [] and Fan [] investigated the effect law of fracture fluid flowback rate on short- and long-term production during well shut-in by indoor experiments and numerical simulations, respectively. They found that the lower the fracture fluid rejection, the higher the early recovery rate. Based on spontaneous percolation of cores and NMR experiments, Mianmo et al. [] found that the larger capillary forces within the micropores of tight reservoirs can facilitate the entry of fracturing fluid into the reservoir matrix, which in turn can release water-lock damage. Nur et al. [] established a single-hole discrete fracture network for tight reservoirs with severe water-lock effects to simulate production after well shut-in. They found that shutting in well can weaken reservoir water-lock damage. Wang et al. [] developed an analytical model to calculate the pressure distribution in the fracture fluid seepage area during fracturing and shutting in well. They found that the fracture fluid seepage area increased with the increase in shut-in time. Cheng et al. [] simulated the dynamic distribution of fluid in the fracture and matrix over time during shutting in well and production. They found that extending the shut-in time can significantly increase production. Le et al. [] used a numerical simulation to study the imbibition of fracturing fluid into the reservoir matrix after shutting in well and calculated the change in permeability within the reservoir. The results showed that shutting in well can promote the recovery of reservoir permeability to some extent.
However, most of the research focuses on the separate design of fracturing and well shut-in, and few scholars have conducted comprehensive research on both, which is difficult to meet the requirements of actual oil and gas development. Therefore, taking the tight oil reservoir in Block M as the target of the study, an integrated fracturing, shut-in and production model was constructed with the help of a Petrel-integrated software platform. Based on this, the optimized design of a production enhancement method after shutting in well is carried out according to the reservoir characteristics. As an important link in the integration of geological engineering, the numerical simulation results in this paper, if combined with the indoor experimental means, can more accurately reflect the actual oilfield site and formulate the optimal design of fracturing and well shut-in solutions in the future. This research is expected to make a greater contribution to the sustainable development of oil and gas and ensure a stable supply of energy security.
2. Block Background
2.1. Geological Characteristics
The target block of the simulation is the M block tight oil reservoir. The main oil reservoir is the C1 reservoir with a depth of 2070 m and an average effective oil thickness of 12.5 m. The target reservoir is dominated by feldspar lithic sandstone and lithic feldspar sandstone. The pore is mainly the solubility-intergranular combination type, and the brittleness index of the reservoir rock is 35–40% []. The porosity of the C1 reservoir in the target block is mainly distributed in 8–10%. The permeability is mainly distributed below 0.05 mD. The average porosity and permeability are 9.9% and 0.13 mD, respectively. The distribution of porosity and permeability are shown in Figure 1 and Figure 2. The original formation pressure of the target reservoir is 15.8 MPa, with a horizontal stress difference between two directions of 5–8 MPa and a more developed natural microfracture in the reservoir.
Figure 1.
Porosity distribution frequency.
Figure 2.
Permeability distribution frequency.
2.2. Development Characteristics
The tight oil reservoir in the target block is characterized by a small horizontal stress difference, a high rock brittleness index, the development of natural fractures and a quasi-natural energy development of the/a staggered horizontal well network in the early stage. The multi-stage fracturing technology of “long horizontal section, multi-fluid volume, large displacement, multi-cluster injection, low-viscosity fracturing fluid and multi-scale proppant” in the later stage form a complex fracture network in the reservoir and increase the production of a single well.
High production was achieved by shutting in well for a period of time after fracturing. The conventional fracturing fluid immediate backflow system can no longer meet the new requirements for the efficient development of tight oil. A reasonable shut-in system is gradually becoming a new trend for exploring effective ways to use tight oil and an efficient development mode [].
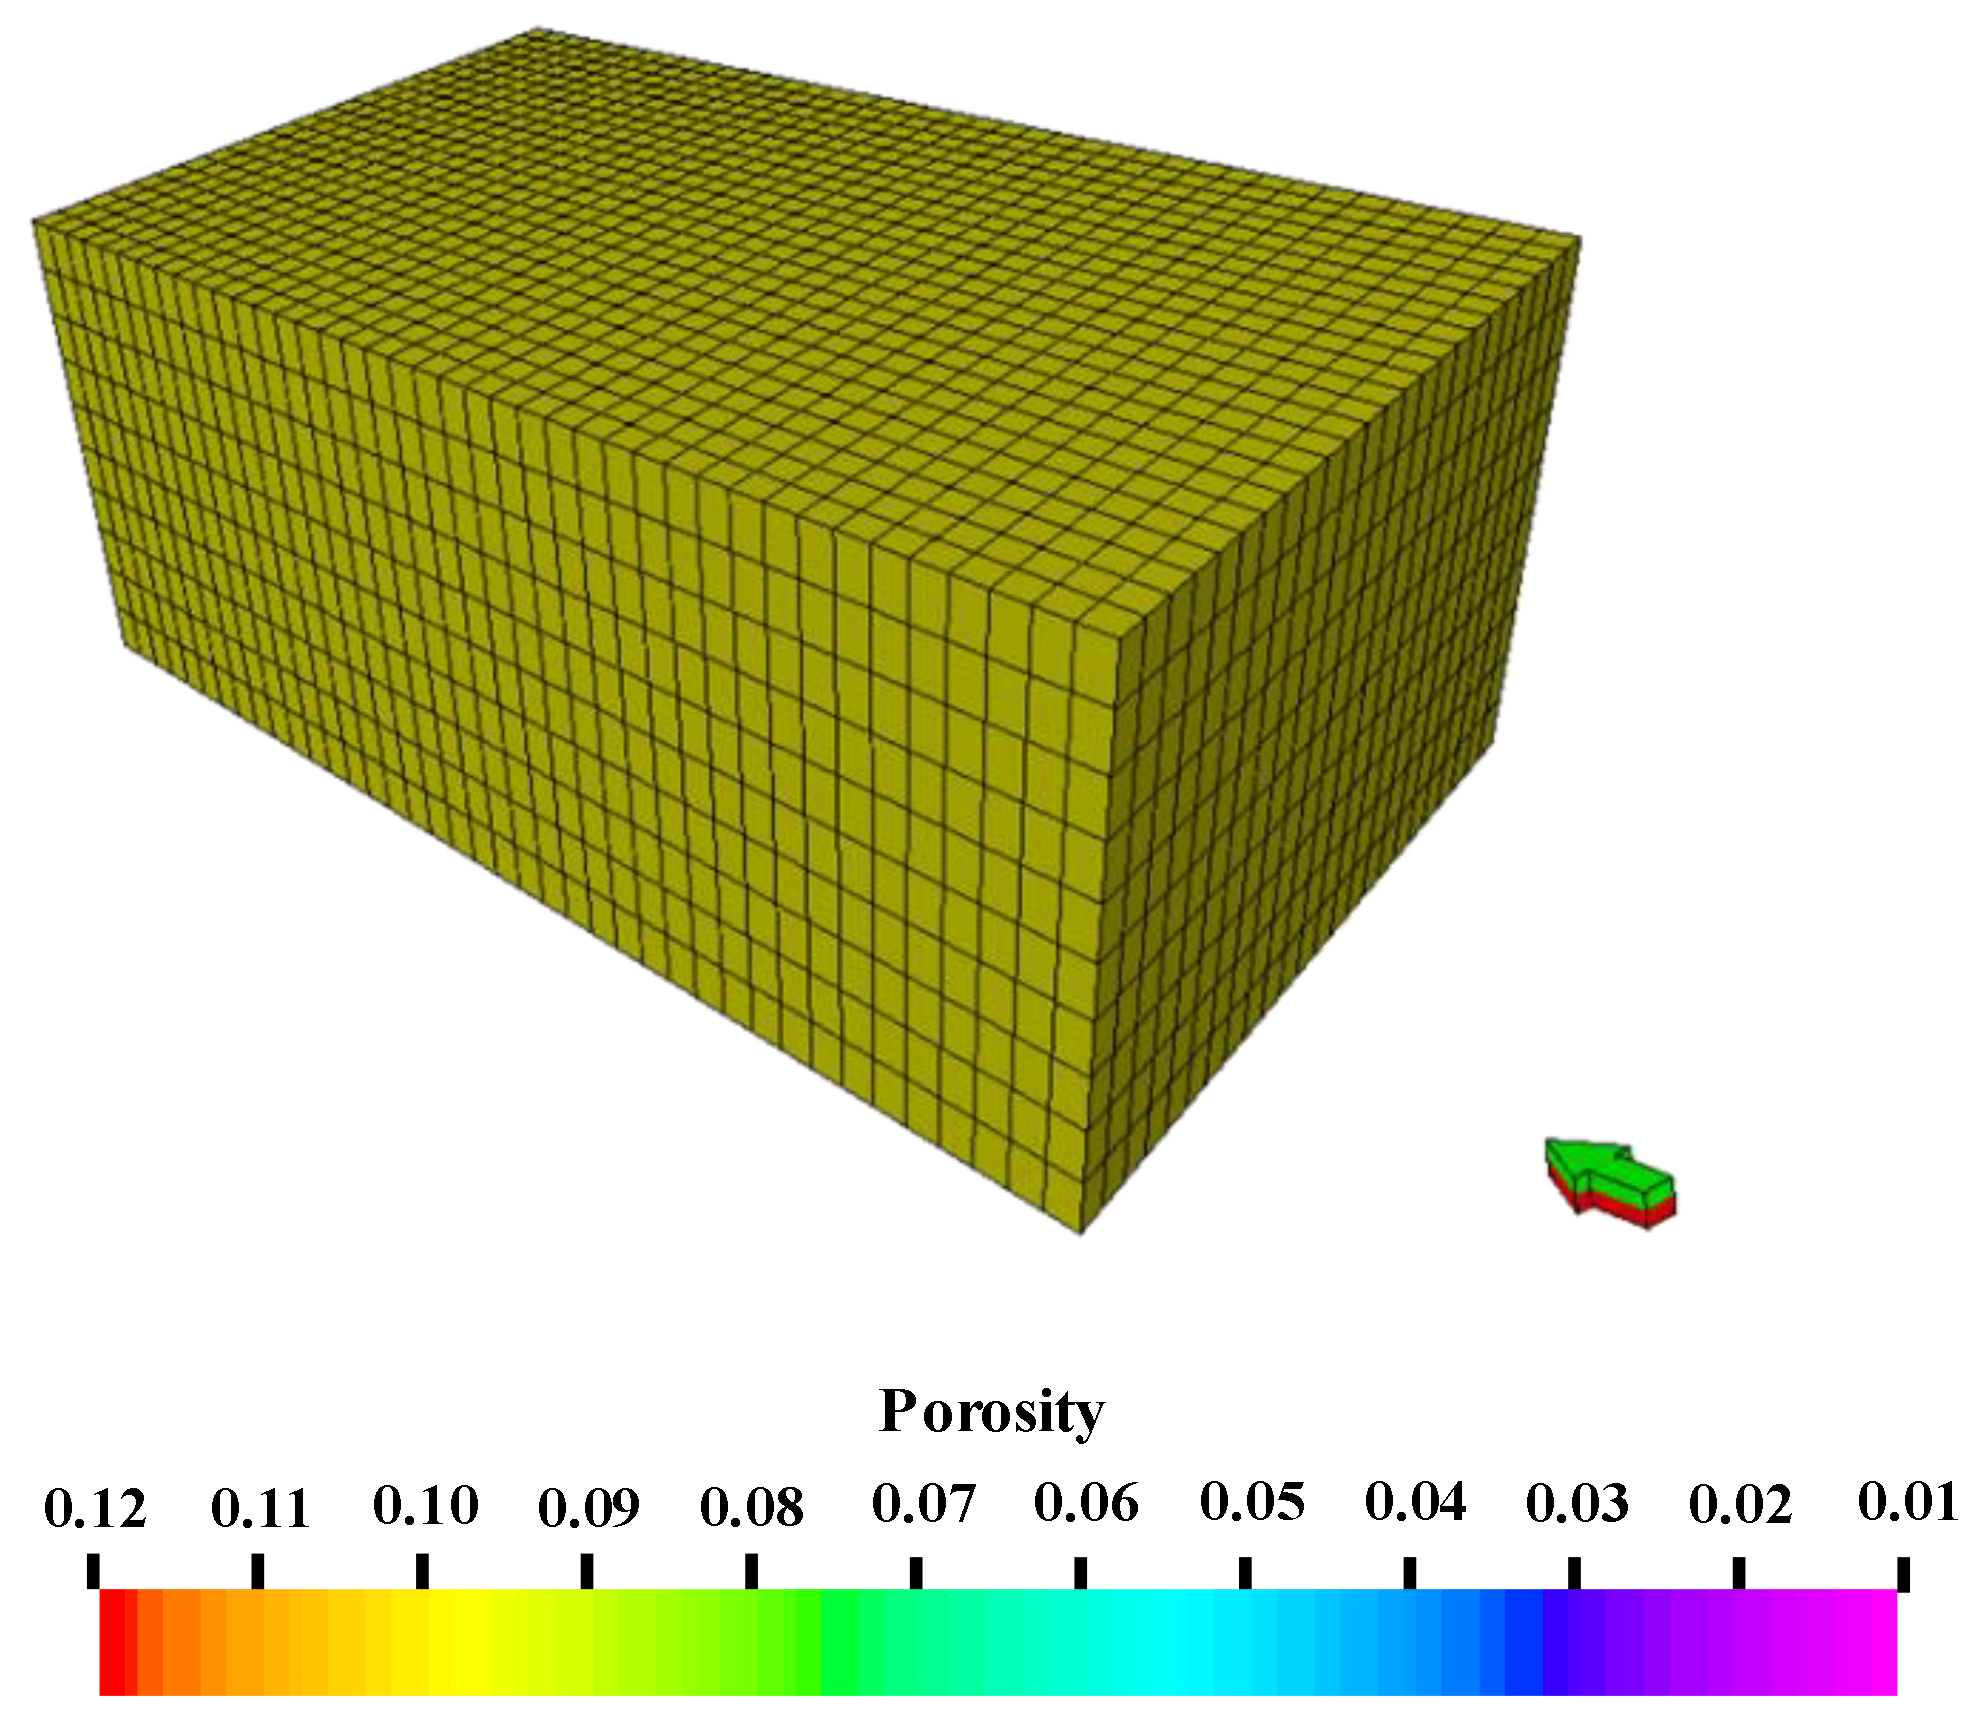
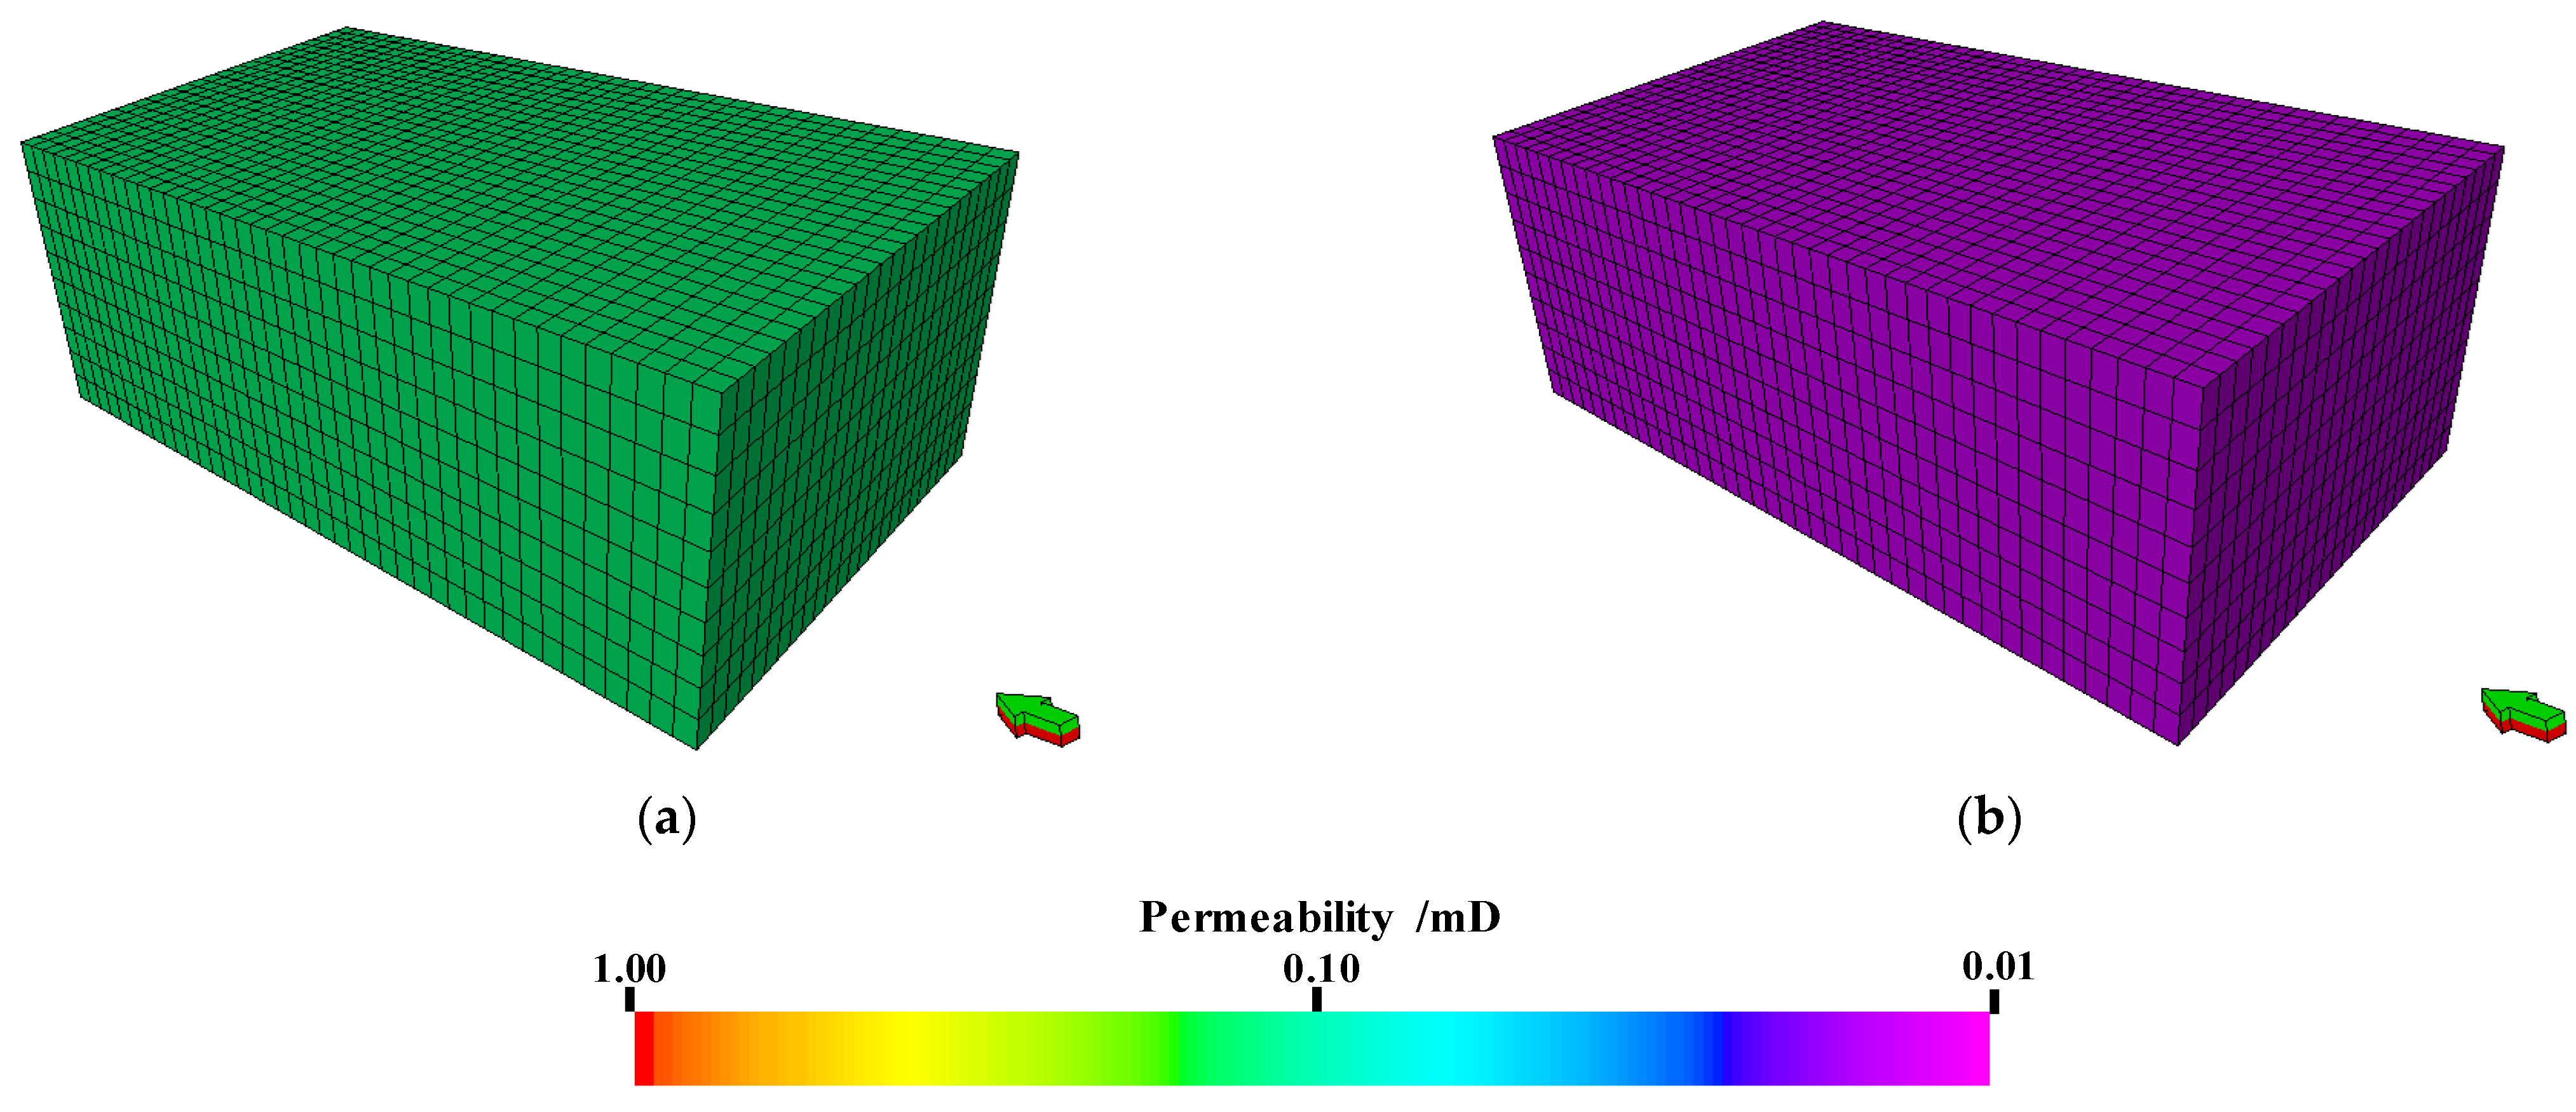
3. Integrated Model Establishment
The integrated model includes a geological model of the target block, a hydraulic fracture extension model, a shut-in and production model. The modeling workflow is shown in Figure 3. First, data on the target block need to be collected, and geological modeling and well construction need to be performed as required. Then, a hydraulic fracturing simulation can be performed after completion of a perforation and pumping program design. Before shutting in well, it is necessary to divide the grid to display the fracture extension simulation results. A well shut-in simulation can be performed after completion of the shut-in system design. Finally, for production, the output can be calculated according to the production system.
Figure 3.
Numerical simulation workflow.
The geological model is a simple theoretical model, considering only oil and water phases, without complex structures such as faults and folds. The model only describes the porosity and permeability characteristics of tight oil reservoirs. Assume that the reservoir in the target block is a regular cubic reservoir with 720 m × 1200 m × 100 m in X, Y and Z directions, respectively, and porosity of the model Poro = 0.099, permeability in X and Y directions PermX = PermY = 0.13 mD, permeability in Z direction PermZ = 0.013 mD. The reservoir porosity and permeability models in the target block are shown in Figure 4 and Figure 5.
Figure 4.
The reservoir porosity model.
Figure 5.
The reservoir permeability model. (a) Permeability model in X and Y directions. (b) Permeability model in Z-direction.
Target well A1 is a horizontal well with a depth of 4281 m and a horizontal section length of 2237 m. The basic data such as well head data, well trajectory data, and well attribute data of the target well are imported into the platform, and the target well is displayed inside the geological model as shown in Figure 6.
Figure 6.
Display of the target well inside the geological model.
The rock physical parameters and fluid physical parameters of the model are designed based on the actual data of the target block, and the specific data are shown in Table 1. The relative permeability curve used were obtained from the core experiments, and the oil–water relative permeability curves are shown in Figure 7. The matrix capillary pressure used was obtained from the core mercury injection experiment, and the matrix capillary pressure curve is shown in Figure 8.
Table 1.
Table of reservoir and fluid properties parameters.
Figure 7.
Oil–water relative permeability curve.
Figure 8.
Capillary pressure curve.
Based on the geological model for the fracture extension simulation, the unconventional fracture model (UFM model) is used as follows:
(1) Well construction. The target well A1 created in the geological model is converted into a horizontal well to be fractured in the Kinetix module. The well structure design of well A1 is shown in Table 2.
Table 2.
The well structure design of well A1.
(2) Reservoir layering. Set the oil layer and interlayer parameters based on the electrical interpretation data of the oil formation in the target block. The physical and rock mechanics parameters of the model are shown in Table 3.
Table 3.
The physical and rock mechanics parameters.
(3) Perforation design. Perforation design based on field completion data. The target well A1 is 4281 m deep with a horizontal section length of 2237 m, designed to be fractured in 10 sections, with 3 clusters in each section. Table 4 shows perforation data.
Table 4.
Perforation data of well A1.
(4) Natural fractures design. Keeping the length of natural fractures unchanged, a model of hydraulic fracture expansion under different angles is established. Specific parameters of natural fractures are shown in Table 5.
Table 5.
Parameters of natural fracture.
(5) Pumping schedules design. The same pumping schedules are used for all sections regardless of the presence of natural fractures, with a single section fracturing fluid volume of 1200 m3. Specific pumping schedule for a single section is shown in Table 6.
Table 6.
Pumping schedule for a single section.
(6) Hydraulic fracturing simulation. After completing parameter input and design, hydraulic fracturing simulation can be performed. The distribution of fractures without natural fractures is shown in Figure 9. When there are natural fractures, take the natural fracture FN1 as an example, and the distribution of fractures is shown in Figure 10.
Figure 9.
The distribution of fractures without natural fractures. (a) Fracture propagation simulation results (No natural fractures). (b) Top view of fractures distribution (3D diagram (left), 2D diagram (right)).
Figure 10.
Distribution of hydraulic fractures when the natural fracture angle is 0°. (a) Fracture propagation simulation results (0°). (b) Top view of fractures distribution (3D diagram (left), 2D diagram (right)).
The shut-in and production simulation based on the fracture extension model is performed as follows:
(1) Grid division. The fracture extension simulation results are displayed in the grid, and the reservoir matrix pore pressure changes can be observed in the grid when simulating shut-in well. Figure 11 shows the fracture grid in both cases of no natural fracture and 0° natural fracture. The purple area in the figure represents the reservoir matrix and the thick black line represents the fracture network of the reservoir.
Figure 11.
Fracture network in two cases.
(2) Shut-in system development. Part of the fracturing fluid entering the reservoir flows back, while the other part stays in the reservoir. Keeping the fracture network parameters constant, the amount of fracturing fluid used to shut-in well is calculated by the ratio to the total fracturing fluid volume. The ratio is shown in Table 7.
Table 7.
Ratio of retained fluid volume to total fracturing fluid volume.
(3) Shut-in well simulation. While pressure changes within the fracture network during shutting in well cannot be directly monitored, the bottom hole pressure can reflect the flow of fracturing fluid into the reservoir matrix and pressure propagation. Therefore, it is necessary to monitor and analyze the bottom hole pressure.
(4) Production simulation. All production models were produced for 3 years at a constant bottom hole flow pressure as the original formation pressure in order to compare the effect of production increase. The 0.5% increase in cumulative oil production is taken as the threshold value for the optimal design of well shut-in. When the increase in production is less than 0.5%, the effect of shutting in well on production is considered insignificant.
The integrated fracturing, shut-in and production model established in this paper can directly observe the change in reservoir matrix pore pressure on the one hand, and reflect the fluid flow and pressure transfer in the fracture network from the bottom hole pressure on the other hand. It can well-characterize the pressure change during shutting in well of tight reservoirs.
4. Simulation Result Analysis
4.1. Fracturing Fluid Volume
The total amount of fracturing fluid is kept constant at 12,000 m3 and different injection volumes are set to simulate well shut-in.
The pore pressure distribution of the reservoir matrix in 90 days of shutting in well with different retention volumes is shown in Figure 12. It can be seen that the fracturing fluid trapped in the fracture during shutting in well slowly diffuses into the matrix. The near-fracture matrix pore pressure increases first, then the fracturing fluid slowly enters the distant matrix whose pore pressure increases, but the increase is small. The more retained fluid in the reservoir, the greater the pore pressure of the near-fracture matrix under the same shut-in time, and the greater the diffusion area of fracturing fluid to the distant matrix. However, retained fluid cannot be increased indefinitely. When the ratio of retained fluid volume to total fracturing fluid volume is greater than 80%, that is, when the retained fluid volume exceeds 9600 m3, the diffusion area of fracturing fluid hardly expands anymore. This indicates that only increasing retention fluid has a limited effect on increasing production after shutting in well.


Figure 12.
Reservoir matrix pore pressure distribution with different fluid volumes.
The variation in bottom hole pressure at different fluid volumes is shown in Figure 13. It can be seen that the more retained fluid, the higher the initial pressure at the bottom of the well. The rapid flow of fracturing fluid in the fracture network at the beginning of shutting in well causes a rapid drop in bottom hole pressure. The less fracturing fluid is retained, the greater the reduction rate. In the later period, fracturing fluid diffused into the reservoir matrix and the rate of bottom hole pressure reduction slowed. The more retained fluid, the higher the bottom hole pressure at the end of well shut-in.
Figure 13.
The variation of bottom hole pressure at different fluid volumes.
To determine the optimal retained fluid volume, production is performed after shutting in well. The changes in cumulative oil production and cumulative water production under different fluid volumes are shown in Figure 14 and Figure 15. It can be seen that the cumulative production all showed a trend of rapid increase in the early stage and a gradual, slowdown increase in the later stage. The more retained fluid, the more cumulative oil production, but the increase in cumulative oil production gradually decreases.
Figure 14.
The change in cumulative oil production under different fluid volumes.
Figure 15.
The change in cumulative water production under different fluid volumes.
According to the above results, the relationship of cumulative oil production and its increase under different fluid volumes is shown in Figure 16. It can be seen that the cumulative oil production increases with the increase in retained fluid. When the ratio of retained fluid volume to total fracturing fluid volume equals 30%, the increase of cumulative oil production starts to decrease, but the cumulative oil production is still relatively significant. When the ratio of retained fluid volume to total fracturing fluid volume is greater than 80%, that is, when the retained fluid volume exceeds 9600 m3, the increase in cumulative oil production has been reduced to 0.36%. When the increase of cumulative oil production is less than 0.5%, increasing retained fluid has little effect on increasing production. According to the model, the optimal fluid volume is 9600 m3.
Figure 16.
The relationship of cumulative oil production and its increase under different fluid volumes.
4.2. Shut-in Time
Keeping the fracture network parameters unchanged, the simulated fluid volume is 9600 m3, and different shut-in times are set to simulate well shut-in.
The pore pressure distribution of the reservoir matrix in different shut-in times is shown in Figure 17. It can be seen that the fracturing fluid gradually diffuses to the distant matrix with the increase in shut-in time, the near-fracture matrix pore pressure gradually decreases, and the distant matrix pore pressure has increased. The longer the well is shut-in, the farther and wider the diffusion distance of fracturing fluid to the distant matrix. When the shut-in time exceeds 90 days, the diffusion area of fracturing fluid hardly expands anymore. This indicates that only increasing shut-in time has a limited effect on increasing production after shutting in well.

Figure 17.
Reservoir matrix pore pressure distribution with different shut-in times.
The variation in bottom hole pressure at different shut-in times is shown in Figure 18. The rapid flow of fracturing fluid in the fracture network at the beginning of shutting in well causes a rapid drop in bottom hole pressure. The bottom hole pressure of the well shut-in for 5 days was reduced by about 6 MPa, compared to that of the initial period. In the later period, fracturing fluid diffused into the reservoir matrix and the rate of bottom hole pressure reduction slowed. The bottom hole pressure of the well shut-in for 150 days was reduced by about 12 MPa, compared to that of the initial period.
Figure 18.
The variation of bottom hole pressure at different shut-in times.
To determine the optimal shut-in time, the changes in cumulative oil production and cumulative water production under different shut-in times are shown in Figure 19 and Figure 20. It can be seen that when producing immediately after fracturing, the cumulative oil production continues to increase but the total amount is small and almost no water is produced. The cumulative oil production of the well shut-in for 5 days increased by about 4000 m3, compared to the immediate production after fracturing. For long-term production, with the increase in shut-in time, the greater the cumulative oil production and the better the stimulation effect.
Figure 19.
The change in cumulative oil production under different shut-in times.
Figure 20.
The change in cumulative water production under different shut-in times.
According to the above results, the relationship of cumulative oil production and its increase under different shut-in times is shown in Figure 21. It can be seen that the cumulative oil production increases with the increase in shut-in times. When the shut-in time reaches 30 days, the increase of cumulative oil production starts to decrease, but the cumulative oil production is still relatively significant. When the shut-in time exceeds 90 days, the increase in cumulative oil production is reduced to 0.43%. When the increase of cumulative oil production is less than 0.5%, increasing shut-in time has little effect on increasing production. According to the mode, the optimal shut-in time is 90 days.
Figure 21.
The relationship of cumulative oil production and its increase under different shut-in times.
4.3. Original Formation Pressure
Set abnormal low pressure formation with original formation pressure coefficient of 0.6 and 0.8 (p = 12.2 MPa, 15.8 MPa), normal pressure formation with original formation pressure coefficient of 1.0 and 1.2 (p = 20.3 MPa, 24.4 MPa), and abnormal high pressure formation with original formation pressure coefficient of 1.4 and 1.6 (p = 28.4 MPa, 32.5 MPa), respectively. The simulation uses the preferred results of Section 4.1 and Section 4.2, that is, the effect of different original formation pressures on the shut-in effect when the simulated fluid volume is 9600 m3 and the shut-in time is 90 days.
The variation in bottom hole pressure at different original formation pressures is shown in Figure 22. It can be seen that the declining curve pattern of bottom hole pressure at different original formation pressures is similar. The rapid flow of fracturing fluid in the fracture network at the beginning of shutting in well causes a rapid drop in bottom hole pressure. In the later period, fracturing fluid diffused into the reservoir matrix and the rate of bottom hole pressure reduction slowed. Low bottom hole pressure at the end of shutting in well results in abnormal low pressure.
Figure 22.
The variation of bottom hole pressure at different original formation pressures.
The change and increase ratios in formation pressure under different original formation pressures are shown in Figure 23. It can be seen that the smaller the original formation pressure coefficient, the better the supplement effect of formation pressure after shutting in well. The energy supplement effect of shutting in well on abnormal low pressure formation is the best, on normal pressure formations the second, and on abnormal high pressure formations the worst.
Figure 23.
The change and increase ratios in formation pressure under different original formation pressures.
The changes in cumulative oil production and cumulative water production under different original formation pressures are shown in Figure 24 and Figure 25. It can be seen that the lower the formation pressure coefficient, the higher the cumulative oil production and the lower the cumulative water production. The abnormal low pressure formation with a formation pressure coefficient of 0.6 increased cumulative oil production by about 700 m3, compared to the abnormal high pressure formation with a formation pressure coefficient of 1.6 after shutting in well. It indicates that well shut-in is more effective in supplementing the energy of abnormal low pressure formations and can produce more tight oil compared to normal pressure formations and abnormal high pressure formations.
Figure 24.
The change in cumulative oil production under different original formation pressures.
Figure 25.
The change in cumulative water production under different original formation pressures.
4.4. Complexity of Fracture Network
Natural fractures are an important factor in the complexity of the hydraulic fracture network [,,,,,,,,]. Based on the optimal fluid volume of 9600 m3 and the optimal shut-in time of 90 days, the natural fracture angle was changed to simulate well shut-in.
The fracture network formed by hydraulic fracturing at different natural fracture angles is shown in Figure 26. Take the example of Figure 27 when the natural fracture angle is 0° (partial enlargement of Figure 26a). A large number of second fractures with a relatively short length and nearly uniform angle are formed by the main fractures communicating with natural fractures during the expansion. The second fractures reduce the length of the main fractures, but make the network more complex. The complexity of the fracture network changes as the angle of the natural fractures changes. As can be seen from Figure 26, the larger the natural fractures angle, the fewer natural fractures are communicated, the longer the main fracture length and the less complex the fracture network. When the natural fractures angle increases to 80°, as shown in Figure 28 (partial enlargement of Figure 26e), only a small number of natural fractures are communicated during hydraulic fracturing and a simple fracture network is formed.
Figure 26.
Fracture network under different natural fracture angles.
Figure 27.
Fracture network of 0° natural fracture.
Figure 28.
Fracture network of 80° natural fracture.
The pore pressure distribution of the reservoir matrix in different natural fracture angles is shown in Figure 29. It can be seen that the matrix pore pressure around the fracture network exhibits a non-uniform variation. The smaller the natural fracture angle, the more complex the fracture network and the more obvious the non-uniform variation in pore pressure. Take the pore pressure variation when the natural fracture angle is 0° in Figure 30 as an example (partial enlargement of Figure 29a). The denser the fracture network, the faster the fracturing fluid diffuses into the matrix, and the faster the pore pressure decreases, as the light-colored area in the figure. The thinner the fracture network, the slower the fracturing fluid diffuses into the matrix, and the slower the pore pressure decreases, as the dark-colored area in the figure. The matrix pore pressure around the fracture network tends to vary uniformly when the natural fracture angle exceeds 40°.

Figure 29.
Reservoir matrix pore pressure distribution with different natural fracture angles.
Figure 30.
Reservoir matrix pore pressure distribution with 0° natural fracture.
The variation in bottom hole pressure at different natural fracture angles is shown in Figure 31. It can be seen that the smaller the natural fracture angle and the more complex the fracture network, the more rapid the flow of fracturing fluid and the greater the decline in bottom hole pressure at the early stage of shutting in well. As the fracturing fluid gradually diffuses into the reservoir matrix, the rate of bottom hole pressure reduction slowed. The minimum bottom hole pressure of the fracture network formed by the 0° natural fracture at the end of shutting in well was 29.0 MPa.
Figure 31.
The variation in bottom hole pressure at different natural fracture angles.
The changes in cumulative oil production and cumulative water production under different natural fracture angles are shown in Figure 32 and Figure 33. It can be seen that the cumulative production under each natural fracture angle shows a trend of rapid increase at the early stage and a slowdown increase at the later stage. The smaller the natural fracture angle is, the more oil is produced cumulatively and the less water is produced cumulatively after shutting in well. Compared with the natural fracture angle of 80°, the 0° natural fracture increases oil production by about 600 m3, and compared with no natural fracture, the oil production increases by about 900 m3 after shutting in well. This indicates that natural fractures can improve the shut-in effect.
Figure 32.
The change in cumulative oil production under different natural fracture angles.
Figure 33.
The change in cumulative water production under different natural fracture angles.
5. Conclusions
- (1)
- The amount of retained fluid increases, the pore pressure of the near-fracture matrix increases, the diffusion distance of fracturing fluid to the distant matrix increases and the pore pressure decreases with the increase in diffusion distance; the bottom hole pressure after shutting in well is proportional to the amount of retained fluid; during production, the cumulative oil production is proportional to the amount of retained fluid, but the increment of oil production decreases with the increase of the amount of retained fluid.
- (2)
- The pore pressure of the near-fracture matrix decreases as the shut-in time increases, the diffusion distance of fracturing fluid to the distant matrix increases, and the pore pressure decreases with the increase in diffusion distance; bottom hole pressure after shutting in well is inversely proportional to shut-in time; for long-term production, cumulative oil production is proportional to the shut-in time, but the increment of oil production decreases with shut-in time.
- (3)
- The curve of the bottom hole pressure at different original formation pressures has a similar pattern and the magnitude is proportional to the original formation pressure; the increase of formation pressure on abnormal low pressure formation is larger, and more tight oil can be produced after shutting in well.
- (4)
- The smaller the natural fracture angle and the more complex the fracture network, the more obvious the non-uniform variation in matrix pore pressure, and the lower the bottom hole pressure after shutting in well. During production, the smaller the angle of the natural fracture formed by the fracture network, the more oil is produced after shutting in well.
Author Contributions
T.G.: language and revision. L.Y.: writing—original draft. T.F.: Model building and debugging. X.G.: conceptualization and numerical simulation. F.F.: conceptualization and revision. Y.Z.: handling data. All authors have read and agreed to the published version of the manuscript.
Funding
This research received no external funding.
Data Availability Statement
Datasets related to this article can be found by contacting the corresponding author.
Conflicts of Interest
The authors declare no conflict of interest.
References
- Zhang, K.; Sebakhy, K.; Wu, K.; Jing, G.; Chen, N.; Chen, Z.; Hong, A.; Torsæter, O. Future Trends for Tight Oil Exploitation. In Proceedings of the SPE North Africa Technical Conference and Exhibition, Cairo, Egypt, 14 September 2015. [Google Scholar]
- Zhang, F.; Jiang, Z.; Sun, W.; Li, Y.; Zhang, X.; Zhu, L.; Wen, M. A multiscale comprehensive study on pore structure of tight sandstone reservoir realized by nuclear magnetic resonance, high pressure mercury injection and constant-rate mercury injection penetration test. Mar. Pet. Geol. 2019, 109, 208–222. [Google Scholar]
- Wang, L.; Chen, W.; Zhang, Y.; Zhang, X.D.; Vuik, C. Investigating effects of heterogeneity and fracture distribution on two-Phase flow in fractured reservoir with adaptive time strategy. Trans Porous Media 2022, 9, 1–29. [Google Scholar]
- Wang, D.; Dong, Y.; Sun, D.; Yu, B. A three-dimensional numerical study of hydraulic fracturing with degradable diverting materials via CZM-based FEM. Eng. Fract. Mech. 2020, 237, 107251. [Google Scholar]
- Wang, D.; Zlotnik, S.; Diez, P.; Ge, H.; Zhou, F.; Yu, B. A Numerical Study on Hydraulic Fracturing Problems via the Proper Generalized Decomposition Method. Comput. Model. Eng. Sci. 2020, 122, 703–720. [Google Scholar]
- Li, M.; Chen, Z.; Ma, X.; Cao, T.; Qian, M.; Jiang, Q.; Tao, G.; Li, Z.; Song, G. Shale oil resource potential and oil mobility characteristics of the Eocene-Oligocene Shahejie Formation, Jiyang Super-Depression, Bohai Bay Basin of China. Int. J. Coal Geol. 2019, 204, 130–143. [Google Scholar]
- Gao, H.; Wang, C.; Cheng, Z.; Li, T.; Dou, L.; Zhao, K.; Xue, J.; Luo, K. Effect of pressure pulse stimulation on imbibition displacement within a tight sandstone reservoir with local variations in porosity. Geoenergy Sci. Eng. 2023, 226, 211811. [Google Scholar]
- Liang, T.; Guo, J.; Zhou, X.; Kitaeva, A.; Zeng, J. A New Productivity Prediction Hybrid Model for Multi-Fractured Horizontal Wells in Tight Oil Reservoirs. In Proceedings of the SPE Russian Petroleum Technology Conference 2018, Moscow, Russia, 15–17 October 2018. [Google Scholar]
- Liu, K.; Ostadhassan, M. The impact of pore size distribution data presentation format on pore structure interpretation of shales. Adv. Geo Energy Res. 2019, 3, 187–197. [Google Scholar]
- Sun, M.; Yu, B.; Hu, Q.; Yang, R.; Zhang, Y.; Li, B.; Melnichenko, Y.B.; Cheng, G. Pore structure characterization of organic-rich Niutitang shale from China: Small angle neutron scattering (SANS) study. Int. J. Coal Geol. 2018, 186, 115–125. [Google Scholar]
- Meng, M.; Ge, H.; Shen, Y.; Ji, W.; Wang, Q. Rock fabric of tight sandstone and its influence on irreducible water saturation in Eastern Ordos Basin. Energy Fuels 2023, 37, 3685–3696. [Google Scholar]
- Meng, M.; Ge, H.; Shen, Y.; Ji, W.; Li, Z. Insight into water occurrence and pore size distribution by nuclear magnetic resonance in marine shale reservoirs southern China. Energy Fuels 2023, 37, 319–327. [Google Scholar]
- Zhang, Y.; Zou, Y.; Zhang, Y.; Wang, L.; Liu, D.; Sun, J.; Ge, H.; Zhou, D. Experimental Study on Characteristics and Mechanisms of Matrix Pressure Transmission Near the Fracture Surface During Post-Fracturing Shut-In in Tight Oil Reservoirs. J. Pet. Sci. Eng. 2022, 219, 111133. [Google Scholar]
- Wang, D.; Ge, H.; Wang, X.; Wang, J.; Meng, F.; Suo, Y.; Han, P. A novel experimental approach for fracability evaluation in tight-gas reservoirs. J. Nat. Gas Sci. Eng. 2015, 23, 239–249. [Google Scholar] [CrossRef]
- Wang, D.; Qin, H.; Zheng, C.; Sun, D.; Yu, B. Transport mechanism of temporary plugging agent in complex fractures of hot dry rock: A numerical study. Geothermics 2023, 111, 2714. [Google Scholar] [CrossRef]
- Zhao, X.; Liu, X.; Yang, Z.; Wang, F.; Zhang, Y.; Liu, G.; Lin, W. Experimental study on physical modeling of flow mechanism in volumetric fracturing of tight oil reservoir. Phys. Fluids 2021, 33, 107118. [Google Scholar]
- Zhang, L.J.; Tan, X.H.; Jiao, Y.J.; Wang, S. Study on Influencing Factors and Prediction Methods of Initial Productivity of Volumetric Fracturing Wells. In Proceedings of the International Field Exploration and Development Conference 2021; Lin, J., Ed.; IFEDC 2021. Springer Series in Geomechanics and Geoengineering; Springer: Singapore, 2021. [Google Scholar]
- Maxwell, S.C.; Urbancic, T.I.; Steinsberger, N.; Zinno, R. Microseismic imaging of hydraulic fracture complexity in the barnett shale. In Proceedings of the SPE Annual Technical Conference and Exhibition, San Antonio, TX, USA, 29 September–2 October 2002; p. SPE77440. [Google Scholar]
- Fisher, M.K.; Heinze, J.R.; Harris, C.D.; Davidson, B.M.; Wright, C.A.; Dunn, K.P. Optimizing Horizontal Completion Techniques in the Barnett Shale Using Micro-Seismic Fracture Mapping. In Proceedings of the Spe Annual Technical Conference and Exhibition, Houston, TX, USA, 26–29 September 2004; p. SPE90051. [Google Scholar]
- Mayerhofer, M.J.; Lolon, E.P.; Youngblood, J.E.; Heinze, J.R. Integration of micro-seismic fracturemapping results with numerical fracture network production modeling in the barnett shale. In Proceedings of the SPE Annual Technical Conference and Exhibition, San Antonio, TX, USA, 24–27 September 2006; p. SPE102103. [Google Scholar]
- Esmail, E.; Fabio, B.R.; Wei, Y.; Kamy, S. Impact of well shut-in after hydraulic-fracture treatments on productivity and recovery of tight oil reservoirs. J. Pet. Sci. Eng. 2021, 203, 108592. [Google Scholar]
- Wang, J.; Hu, J.; Zhang, Y.; Xie, Q.; Shi, Y. Investigation of imbibition areas during well shut-in based on mercury injection experiment and BP neural network. Fuel 2019, 254, 115621. [Google Scholar]
- Perapon, F.; Mehmet, T.; Hossein, K. Effect of shut-in time on gas flow rate in hydraulic fractured shale reservoirs. J. Nat. Gas Sci. Eng. 2016, 32, 109–121. [Google Scholar]
- Iraji, S.; Soltanmohammadi, R.; Munoz, E.R.; Basso, M.; Vidal, A.C. Core scale investigation of fluid flow in the heterogeneous porous media based on X-ray computed tomography images: Upscaling and history matching approaches. Geoenergy Sci. Eng. 2023, 225, 211716. [Google Scholar]
- Iraji, S.; Soltanmohammadi, R.; De Almeida, T.R.; Munoz, E.R.; Basso, M.; Vidal, A.C. Laboratory and numerical examination of oil recovery in Brazilian Pre-salt analogues based on CT images. In Proceedings of the 3rd EAGE Conference on Pre Salt Reservoirs, Rio de Janeiro, Brazil, 23–25 November 2022; European Association of Geoscientists & Engineers: Amsterdam, The Netherlands, 2022; pp. 1–6. [Google Scholar]
- Meng, M.; Ge, H.; Ji, W.; Shen, Y.; Su, S. Monitor the process of shale spontaneous imbibition in co-current and counter-current displacing gas by using low field nuclear magnetic resonance method. J. Nat. Gas Sci. Eng. 2015, 27, 336–345. [Google Scholar]
- Gupta, A.; Xu, M.; Dehghanpour, H.; Bearinger, D. Experimental Investigation for Microscale Stimulation of Shales By Water Imbibition During the Shut-in Periods. In Proceedings of the SPE Unconventional Resources Conference, Calgary, AL, Canada, 15–16 February 2017. [Google Scholar]
- Fan, L.; Thompson, J.W.; Robinson, J.R. Understanding Gas Production Mechanism and Effectiveness of Well Stimulation in the Haynesville Shale Through Reservoir Simulation. In Proceedings of the Canadian Unconventional Resources and International Petroleum Conference, Calgary, AB, Canada, 19–21 October 2010. [Google Scholar]
- Meng, M.; Ge, H.; Ji, W.; Wang, X. Research on the auto-removal mechanism of shale aqueous phase trapping using low field nuclear magnetic resonance technique. J. Pet. Sci. Eng. 2016, 137, 63–73. [Google Scholar]
- Wijaya, N.; Sheng, J.J. Shut-In Effect in Removing Water Blockage in Shale-Oil Reservoirs With Stress-Dependent Permeability Considered. SPE Res. Eval. Eng. 2020, 23, 81–94. [Google Scholar]
- Cheng, Y. Impact of Water Dynamics in Fractures on the Performance of Hydraulically Fractured Wells in Gas Shale Reservoirs. J. Can. Pet. Technol. 2012, 51, 143–151. [Google Scholar]
- Mahadevan, J.; Le, D.; Hoang, H. Impact of Capillary Suction on Fracture Face Skin Evolution in Waterblocked Wells. In Proceedings of the SPE Hydraulic Fracturing Technology Conference and Exhibition, Woodlands, TX, USA, 19–21 January 2009. [Google Scholar]
- Jinhu, D.U.; He, L.I.; Desheng, M.A.; Jinhua, F.U.; Yuhua, W.A.; Tiyao, Z.H. Discussion on effective development techniques for continental tight oil in China. Pet. Explor. Dev. 2014, 2, 217–224. [Google Scholar]
- Li, G.X.; Luo, K.; Shi, D.Q. Key technologies, engineering management and important suggestions of shale oil/gas development: Case study of a Duvernay shale project in Western Canada Sedimentary Basin. Pet. Explor. Dev. 2020, 4, 791–802. [Google Scholar]
- Soeder, D.J. The successful development of gas and oil resources from shales in North America. J. Pet. Sci. Eng. 2018, 163, 399–420. [Google Scholar]
- Todd, H.B.; Evans, J.G. Improved oil recovery IOR pilot projects in the Bakken Formation. In Proceedings of the SPE Low Perm Symposium, Denver, CO, USA, 5–6 May 2016. [Google Scholar]
- Chaudhary, A.S.; Eilig, C.A.; Wat, R. Shale oil production performance from a stimulated reservoir volume. In Proceedings of the SPE Annual Technical Conference and Exhibition, Denver, CO, USA, 30 October–2 November 2011. [Google Scholar]
- Lolon, E.P.; Cipolla, C.L.; Weijers, L.; Hesketh, R.E.; Grigg, M.W. Evaluating horizontal well placement and hydraulic fracture spacing conductivity in the Bakken Formation, North Dakota. In Proceedings of the SPE Annual Technical Conference and Exhibition, New Orleans, LA, USA, 4–7 October 2009. [Google Scholar]
- Sennhauser, E.S.; Wang, S.; Liu, M. A practical numerical model to optimize the productivity of multistage fractured horizontal wells in the Cardium tight oil resource. In Proceedings of the Canadian Unconventional Resources Conference, Alberta, AB, Canada, 15–17 November 2011. [Google Scholar]
- Islam, A.; Settari, A.; Sen, V. Productivity Modeling of Multifactored Horizontal Wells Coupled with Geomechanics-Comparison of Various Methods. In Proceedings of the SPE Canadian Unconventional Resources Conference, Calgary, AB, Canada, 30 October–1 November 2012. [Google Scholar]
- Zou, J.; Jiao, Y.Y.; Tan, F.; Lv, J.; Zhang, Q. Complex hydraulic-fracture-network propagation in a naturally fractured reservoir. Comput. Geotechnol. 2021, 135, 104165. [Google Scholar]
- Zhang, J.; Li, Y.; Pan, Y.; Wang, X.; Yan, M.; Shi, X.; Zhou, X.; Li, H. Experiments and analysis on the influence of multiple closed cemented natural fractures on hydraulic fracture propagation in a tight sandstone reservoir. Eng. Geol. 2021, 281, 105981. [Google Scholar]
- Iraji, S.; Ayatollahi, S. Experimental investigation on asphaltene biodegradability using microorganism: Cell surface properties’ approach. J. Pet. Explor. Prod. Technol. 2018, 9, 1–10. [Google Scholar]
Disclaimer/Publisher’s Note: The statements, opinions and data contained in all publications are solely those of the individual author(s) and contributor(s) and not of MDPI and/or the editor(s). MDPI and/or the editor(s) disclaim responsibility for any injury to people or property resulting from any ideas, methods, instructions or products referred to in the content. |
© 2023 by the authors. Licensee MDPI, Basel, Switzerland. This article is an open access article distributed under the terms and conditions of the Creative Commons Attribution (CC BY) license (https://creativecommons.org/licenses/by/4.0/).