Abstract
Health is the basis of human survival and development. It is not only related to quality of life but also guarantees national security and social stability. Under the combined influence of various factors, large regional differences exist with regard to the health levels of residents in the Yellow River Basin (YRB). Here, we took 73 prefecture-level cities (leagues and prefectures) in the YRB as our research object. We constructed an index system and a measurement model and applied geographical information system (GIS) technology and quantitative analysis methods to make comprehensive spatial and temporal measurements of the health index of residents in the YRB and further analyzed the influencing factors. Overall, the health index of residents in the YRB showed a steady upward trend. However, some differences exist across various regions with regard to residents’ health index. The YRB resident health index displayed positive spatial autocorrelation; spatial clustering showed an initial decrease, followed by an increase, suggesting notable fluctuations. With the increase in per capita GDP, urbanization rate, and household size, the health index of residents in the YRB has improved. However, increased wastewater and waste gas discharge has led to a decrease in the health index of residents in the YRB.
1. Introduction
Health is the basis of human survival and development and is not only related to quality of life but also a guarantee of national security and social stability [1]. In recent years, the health problems of individuals have increasingly become one of the main global challenges [2]. Globally and nationally, there are often considerable regional differences in the health levels of individuals due to the uneven distribution of power, goods, and services [3,4]. In 2015, the United Nations World Sustainable Development Summit formally adopted the 2030 Agenda for Sustainable Development, which sets out the global Sustainable Development Goals (SDGs) Each goal has the premise of achieving good health and well-being, which is also the overall goal of the SDGs [5]. In 2017, the World Health Organization (WHO) summarized the top ten global health inequalities, with health problems listed as a global issue [6]. Since 2020, the novel coronavirus has spread widely around the world, threatening the lives and health of people globally. The issue of public health has once again become a global concern [7].
In 2019, the Bloomberg Global Health Index ranked 169 of the healthiest economies worldwide. China was ranked 52nd, which was in the upper-middle level among all economies. However, major regional differences still exist with regard to the health levels of citizens in China, which seriously affects the process of building a harmonious society. In 2016, the Chinese government outlined the Healthy China 2030 plan, which advocated the integration of health considerations in all government policies, more rapid transformation of health improvements among citizens, and the equalization of basic public health services [8]. In 2017, Xi Jinping, the General Secretary of the Chinese Communist Party (CPC), proposed “to implement the healthy China strategy” in his report to the 19th National Congress of the CPC, emphasizing that people’s health is an important symbol of national prosperity and wealth [9]. In the face of the new coronavirus, a common challenge for all of humanity, Xi Jinping advocated the building of a global community of health for all, putting people’s safety and physical health first [10].
The Yellow River is the second largest river in China. It flows through nine provinces/autonomous regions, including Henan, Shanxi, Inner Mongolia, Shandong, Shaanxi, Gansu, Qinghai, Ningxia, and Sichuan; spans three major geographic units and three economic terraces in China; and connects developed coastal regions with the central regions undergoing revitalization and the western regions that have great potential [11]. The Yellow River Basin (YRB) is characterized by complex and diverse topography (high topography in the western regions but low in the eastern regions), major climatic differences, and uneven population distribution. Under the combined influence of various factors, large regional differences exist with regard to the health levels of residents in the YRB [12]. The per capita life expectancy of people living in Haixi Prefecture in the western region of the YRB is less than 72 years, whereas the per capita life expectancy of people living in Jinan City in the eastern region of the YRB exceeds 82 years. The YRB is currently facing the issue of how to improve its residents’ health while at the same time reducing health disparities. In the present study, 73 prefecture-level cities (leagues and prefectures) in the YRB were selected as the study object, taking into account the importance of regional socioeconomic development in the YRB. We tried our best to maintain the integrity of all administrative units. As the YRB straddles three major zones (the east, central, and west zones), to some extent it represents the projection of China’s regional development in the YRB. Therefore, the YRB was also divided into three regions (the east, central, and west zones) in the present study, corresponding to the way our country is divided into east, central, and west regions (Figure 1).
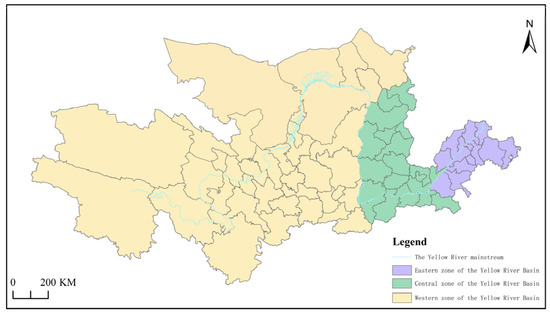
Figure 1.
The location and scope of the study area.
The research questions, research ideas, and research significance are as follows. We took 73 prefecture-level cities (leagues and prefectures) in the YRB as the research object and constructed an index system and measurement model based on SDG objectives and the health production function proposed by Grossman. We applied geographical information system (GIS) technology and quantitative analysis methods, such as the entropy value method, exploratory spatial analysis, and multiple linear regression. We made comprehensive spatial and temporal measurements of the health index of residents in the YRB and further analyzed the influencing factors. The present study offers several benefits. One, it will add both theoretical and practical knowledge to health geography research, human geography, and sustainable development. Two, this study will provide a scientific grounding for further improving the health level of residents in the YRB and reducing regional differences in residents’ health. Three, the present study can help provide a theoretical underpinning on which to base decisions to facilitate the implementation of the Health China strategy, which is of great practical importance.
2. Literature Review
Research into people’s health levels dates back to the 1970s, when the WHO’s global strategic goal of “Health for All by the Year 2000” initiated research in this area. Early on, researchers believed that differences in people’s health levels were very common [13], and they conducted qualitative research to describe differences in people’s health levels [14,15,16,17,18]. As this research progressed and measurement methods improved, researchers began to focus on the measurement of people’s health index and to analyze factors that influenced this index.
When selecting an index system, researchers tend to select indicators such as self-rated health indices, composite health indices, population mortality rates, and per capita life expectancy of citizens. For example, Chen et al. used a self-rated health index to study the relationship between people’s health levels and the quality of their living environment [19]. Murray et al. analyzed the differences in people’s level of health, in different parts of the world, by combining various health indicators collected by WHO in the past decade [20]. Miao et al. used data collected by the China Health and Nutrition Survey to evaluate the health levels of citizens in China [21]. Li et al. used mortality data and chronic disease data to evaluate the health levels of citizens in China [22]. Li et al. used life expectancy per capita as a key indicator to reflect the health levels of residents [23].
Commonly applied measurement methods include the Gini index, the coefficient of variation, and the concentration index. For example, Harvey et al. used the Gini index to study income-related health inequalities in Canada [24]. Davis et al. used the coefficient of variation to analyze health inequalities among the elderly in Russia [25]. Park et al. used the concentration index to measure and analyze the health levels of non-Latino whites and Asians [26].
Initially, researchers tended to study single factors that influenced the health index of people, such as income or education. For example, Hong et al. found that income inequality in Korea led to an imbalance in the health levels of Korean citizens [27]. Niu et al. discovered that regional income disparity had a significant effect on people’s health levels [28]. Grossman pointed out that education could function as a productive force in improving public health [29].
Later, researchers increasingly began to consider the impact of combined factors on the health index of residents. Tobollik et al. found that people’s health levels were influenced by their level of clinical care, the natural environment, and their socioeconomic status [30]. Brown et al. showed that living conditions, learning, work, faith, and recreation were some important determinants of health disparities [31]. Yu et al. found that people’s health levels were influenced by public health conditions, as well as family and economic status [32].
Overall, the studies outlined above have obtained rich results, although some shortcomings remain. First, there have been few studies with spatially and temporally integrated measurements of the evolution pattern and characteristics of the health index of residents in the YRB that have used GIS technology, spatial analysis models, and combined SDGs. Second, a comprehensive analysis of the factors that influence the health index of residents in the YRB, from an economic, social, and environmental perspective, has yet to be performed. Those studies that have been conducted are in the early, exploratory phase. Therefore, with this study, we sought to address this omission.
The difference in the health index of residents is the result of a combination of factors. Therefore, we comprehensively considered economic, social, and environmental factors, and combined a variety of mathematical methods. We then explored the dynamic changes and internal driving mechanisms of the residents’ health index in the YRB. This took into account the dual dimensions of time and space, which allowed us to capture intra-regional differences and spatial associations and also enabled us to explore in detail the mechanism by which regional differences in the residents’ health index arise.
3. Material and Methods
3.1. Comprehensive Index System and Data Sources Used
Based on a synthesis of existing research [33,34], this study followed the principles of being comprehensive, effective, systematic, representative, and independent; it also included the SDG goals and comprehensively considered the actual situations and characteristics of the study area. Three frequently used and representative indicators–health quality, health environment, and healthcare structure–were selected to construct a comprehensive evaluation index system that was used to assess the health levels of residents in the YRB (Table 1).

Table 1.
Comprehensive index system for evaluating the health index of residents in the YRB.
We developed an evaluation index system, employing the health production function developed by Grossman, incorporating our review and synthesis of current research findings [35,36,37], and considering the specific characteristics of the study area. The system reflects the factors affecting the health index of residents in the YRB, based on economic, social, and environmental aspects, and was used to explore the main factors affecting the health index of residents in the YRB (Table 2).
Table 2.
The index system of factors affecting the health index of residents in the YRB.
We took the years between 2000 and 2020 as the research period. The data mainly came from two types of sources. The first type included national statistical yearbooks, such as the China Health and Health Statistical Yearbook, the China Urban Statistical Yearbook, the China Environmental Statistical Yearbook, and the China Statistical Yearbook. The second type included the statistical yearbooks of provinces (autonomous regions) and prefecture-level cities (leagues and prefectures), statistical bulletins reporting the development of health undertakings, statistical bulletins reporting on national economic and social development; where relevant, other statistical materials and literature were used as data sources.
3.2. Research Methods
3.2.1. Measurement and Index Weight Determination
The methods used to determine index weights included the subjective weighting method and the objective weighting method. The present study applied the entropy method to determine the index weight and measure the health index of residents. The main steps were as follows [38]:
- (1)
- Data standardization:
Positive indicators:
Negative indicators:
- (2)
- Proportional coefficient:
- (3)
- Calculations of information entropy:
- (4)
- Calculations of entropy redundancy:
- (5)
- Indexes value weighted:
- (6)
- Calculations of composite scores:
3.2.2. Spatial Pattern Analysis
Moran’s I index is an important indicator to study the potential interdependence between observation data in the same distribution area. The global Moran’s I index was applied to analyze the overall spatial correlations and differences among the health index of residents in the YRB. The formula is as follows [39]:
In this formula: , , is the number of evaluation objects, and are the attribute values of and , respectively, and is the spatial weight matrix.
To further explore the dependence and heterogeneity of the health index of residents at a local scale, the present study used the Hot Spot Analysis (local Getis-Ord spatial statistics tool). Its formula is as follows [40]:
In this formula, the values of are significantly positive, suggesting relatively high values around region , which is a hotspot. Otherwise, it is a coldspot. is the observed value of region , and is the spatial weight matrix.
3.2.3. Analysis of Influencing Factors
A multiple linear regression model is commonly used to study the changing relationship between a dependent variable and multiple independent variables. Thus, we used a multiple linear regression model, and independent variables were selected by stepwise regression to explore the influencing factors affecting the health index of residents in the YRB. The formula is as follows [41]:
In this formula: is the response variable, suggesting that the health index. are explanatory variables. is a constant coefficient, and are regression coefficients.
4. Results and Discussion
4.1. Comprehensive Evaluation of Residents’ Health Levels
The health index of residents in the YRB between 2000 and 2020 was quantified based on the entropy method (Table 3). Overall, the values of the average health index of residents in the YRB showed an upward trend; this can be roughly categorized into four periods of time. ① The period between 2000 and 2005 represented a slow growth stage, during which the health index of residents slightly but steadily improved. ② The period between 2005 and 2010 represented a rapid growth stage, during which the health index of residents greatly improved. ③ During the 2010 to 2015 period, the growth rate leveled off, and the health index of residents continued to steadily increase. ④ During the 2015 to 2020 period, the growth rate remained stable, and the health index of residents again continued to steadily increase. Overall, the health index of residents in the YRB has been steadily increasing. This is closely related to the implementation of the Health China strategy and the rapid economic and social development throughout the same period.
Table 3.
Mean health index values of residents in the YRB.
In terms of prefecture-level cities (or prefectures and leagues), the top six cities with the highest mean health index of residents were Taiyuan, Hohhot, Zhengzhou, Jinan, Yinchuan, and Xi’an (Table 4). These six prefecture-level cities are the provincial capitals of Shanxi, Inner Mongolia, Henan, Shandong, Ningxia, and Shaanxi, respectively. Among the remaining three provinces in the YRB, Xining, the capital city of Qinghai Province, ranked 9th; and Lanzhou, the capital city of Gansu Province, ranked 12th. Chengdu, the capital city of Sichuan Province, was not included in the study. The capital cities of the YRB had relatively high values of health index for their residents, suggesting that their residents are in good health. This is due to the superior economic foundation of these cities, the relatively complete public service infrastructure, and the high level of medical development.
Table 4.
The mean values and ranking of the health index of residents (for prefecture-level cities) in the YRB.
Based on the mean health index of residents in individual prefecture-level cities (leagues and prefectures) in the YRB, the natural breakpoint method was used to classify them into five categories, using ArcGIS software; these categories were the high-level zone, relatively high-level zone, medium-level zone, relatively low-level zone, and low-level zone (Figure 2).
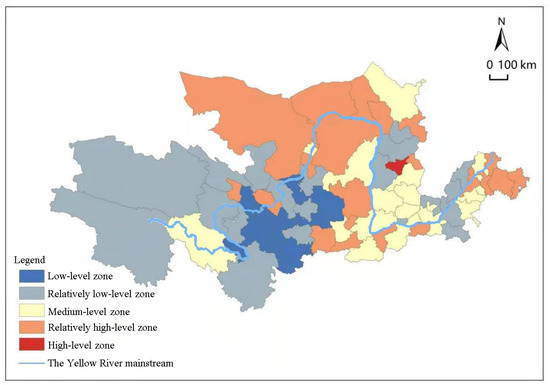
Figure 2.
Health index of residents in the YRB.
The eastern region of the YRB is dominated by zones in the relatively high-level category, which account for the largest share, at 41.7%. These zones have a higher level of economic and social development and enjoy better healthcare systems. Therefore, residents from these zones have relatively high levels of health. Medium-level zones are widely distributed within the central region of the YRB, which accounts for the largest proportion, at 45.5%. These zones have an average level of economic and social development, and the healthcare system is relatively underdeveloped. Consequently, residents from these zones generally have a medium level of health. By contrast, the western part of the YRB is dominated by low-level zones. These zones have experienced slow economic and social development, as well as poor healthcare systems. As a result, residents from these zones generally have low levels of health. Overall, the health index of residents from different zones of the YRB varies considerably, with the health index gradually decreasing from the eastern toward the western zones.
4.2. Residents’ Health Levels—Spatial Patterns
The global value for Moran’s I that was used to measure the health index of residents in the YRB was calculated for the years 2000, 2005, 2010, 2015, and 2020 (Table 5). The index values for all years were positive; this was statistically significant in each case. Residents’ health levels in the YRB showed positive spatial autocorrelation and displayed clustering characteristics. In other words, the health levels of residents are not randomly distributed. Rather, these health levels exhibit spatial patterns of high- and low-attribute clusters. In particular, prefecture-level cities with high health levels among their residents tend to be located next to other prefecture-level cities with similarly high health levels, whereas prefecture-level cities with low health levels among their residents tend to be adjacent to other prefecture-level cities that also have low levels of health. The global Moran’s I index shows a trend that first decreases and then increases, suggesting that its spatial clustering distribution follows a similar trajectory with fluctuations.
Table 5.
The global Moran’s I value of the health index of residents in the YRB.
For the present study, we selected the years 2000, 2005, 2010, 2015, and 2020 to further quantify the values and generate a spatial evolution map displaying both coldspots and hotspots, based on which the local spatial relationship of the health index of residents in the YRB could be further analyzed (Figure 3). In 2000, the hotspots were mainly distributed in the eastern and central regions of the YRB, the sub-hotspots were mainly distributed in the central and western regions of the YRB, and the sub-coldspots and coldspots were mainly distributed in the western region of the YRB. In 2005, the number of hotspots had decreased significantly, and hotspots had moved to the middle and western regions of the YRB. The number of sub-hotspots was the highest, and they were also the most widely distributed. The sub-coldspots and coldspots were mainly distributed in the western part of the YRB. In 2010, the number of hotspots continued to increase, and these hotspots were mainly distributed in the eastern region of the YRB. The number of sub-hot spots was the highest, and these sub-hot spots were mainly distributed in the central and western parts of the YRB. The sub-coldspots and coldspots were mainly distributed in the western region of the YRB. In 2015, the number of hotspots had decreased, and a large range of hotspot clusters appeared in the middle and western regions of the YRB, such as Inner Mongolia and Shanxi province. The number of sub-hotspots was the highest and were also the most widely distributed, and the sub-coldspots had expanded to the middle and eastern regions of the YRB. The coldspots were mainly distributed in the western part of the YRB. In 2020, the number of hotspots remained unchanged, whereas the number of sub-hotspots had decreased slightly. Meanwhile, both of them were mainly distributed in the central and western regions of the YRB, while the sub-coldspots and coldspots continued to expand to the middle and eastern regions of the YRB. Overall, the spatial distribution of the health index of residents from prefecture-level cities in the YRB displayed clear clustering characteristics. The number of hotspots showed a fluctuating trend, which suggests that the clustering range of high-value areas was not stable and gradually shifted from the eastern region toward the central and western regions of the YRB. The number of sub-hotspots was the highest, and were also the most widely distributed. The sub-coldspots and coldspots gradually expanded from the western region toward the central and eastern regions of the YRB.
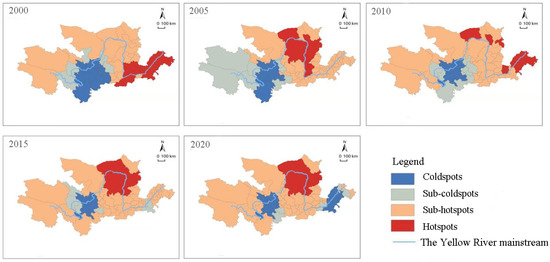
Figure 3.
The spatial evolution of coldspots and hotspots of the health index of residents in the YRB.
4.3. Analysis of Factors That Affect Residents’ Health Levels
In our study, the health index between 2000 and 2020 was taken as the response variable (the residuals satisfied the normal distribution), and various indicators of the influencing factors were treated as explanatory variables. To ensure the stability and accuracy of the model, before the regression analysis, all explanatory variables were tested. It was found that the respective variables passed the multicollinearity test (the VIF values of the respective variables were <10), indicating that each variable could be brought into the regression model for analysis, and stepwise regression was applied for variable selection. All selected explanatory variables were statistically significant and passed the F test. The final model included five indicators: GDP per capita (X1), urbanization rate (X5), household size (X6), wastewater discharge (X8), and exhaust gas emission (X9). A further analysis of these factors that significantly affected the health levels of residents was then performed (Table 6).
Table 6.
Stepwise regression modeling results.
GDP per capita (X1), urbanization rate (X5), and household size (X6) each had a positive impact and helped to improve residents’ health. They therefore represent three factors that lead to improvements in residents’ health. Of these, for every percentage point increase in per capita GDP, the residents’ health index increased by 0.0039%, urbanization rate increased by 0.0029%, and every percentage point increase in household size increases by 0.0530%. This showed that the positive effect of household size on the improvement in residents‘ health level was the largest, followed by per capita GDP, while the urbanization rate was the smallest. Household size refers to the number of persons in a private household; with an increase in family size, family members can help each other, facilitate coordination of health resources, cope with various health risks, and therefore promote the improvement of residents’ health. GDP per capita is an important indicator that reflects the level of economic development and can enhance the living standards of residents and improve medical conditions, thus promoting improvements in residents’ health. The urbanization rate represents the percentage of the urban population in the total population. Acceleration of the urbanization process tends to promote population migration and thus lead to a reduction in the average family size. However, improvements in medical services and security resulting from increased urbanization significantly promotes improvements in residents’ health.
Wastewater discharge (X8) and exhaust gas discharge (X9) negatively impacted the improvements in residents’ health and are therefore two important factors that hinder improvements in of residents’ health. The residents’ health index decreases by 0.0019% for every percentage point increase in wastewater discharge and by 0.0014% for every percentage point increase in waste gas discharge. The negative impact of wastewater discharge is greater than that of exhaust gas discharge. Environmental degradation in general has a pronounced negative impact on the health of residents, and water pollution in particular is closely related to the health of residents. According to a WHO survey, a high proportion (80%) of human diseases are linked to water pollution; it follows that wastewater discharge significantly and negatively impacts any improvements in residents’ health. According to an International Energy Agency (IEA) survey, air pollution has a similar significant and negative impact on residents’ health, especially those who are immunocompromised. Therefore, exhaust gas emissions also have a significant negative impact on any improvements in residents’ health levels.
More importantly, the Engel coefficient (X2) represents the amount of food expenditure as a percentage of the total amount of expenditure. An increase in Engel’s coefficient means that the proportion of households’ food consumption increases, which inevitably outcompetes other spending. This can lead to insufficient investment in medical and health management and as a consequence affects the health of residents. However, the health index of residents in the YRB was not significantly affected, which may also be related to the relatively low level of local development.
4.4. Discussion
In recent years, some similar research to ours, focusing on residents’ health levels and the factors that influence these levels, has been carried out, but studies conducted in the YRB remain very limited. Of these previous studies, Zhu and colleagues investigated the health of individuals living in rural areas of Henan Province and concluded that there were differences in health services and residents’ health levels across different regions [42]. Xin et al. conducted research into the health levels of residents in China and found that some spatial differences existed, which formed spatial distribution patterns in a relatively stable manner [43]. Zhao et al. studied the spatial correlation characteristics of the health levels of residents in China and found that they exhibited clustering characteristics. Coldspots were also consistently found in the western region [1]. Qu et al. concluded that factors such as economic level, urbanization rate, sex ratio, health resources, education, and living conditions are all key factors that affect the health levels of residents in China [44]. Addison et al. found that in the UK and other high-income countries, factors such as income, education, and health and medical conditions all have a significant impact on people’s health levels [45]. Xu et al. showed that family income, education level, and family size all promoted the improvement of residents’ health levels [46].
We conducted a comprehensive analysis of the social, economic, and environmental factors in the YRB, measured these factors, and investigated how they influenced the residents’ health index. We included the dual dimensions of time and space, to address the shortcomings of research conducted in this field to date. However, due to the difficulty of obtaining indicators, we could only conduct our research at the prefecture-level city scale, not at the more detailed county scale. At the same time, due to a lack of data, this study had shortcomings in the construction of the index system, and the selection of indicators must be further improved in the future.
5. Conclusions
Overall, the health index of residents in the YRB showed a steady upward trend. From the perspective of prefecture-level cities (leagues and prefectures), some differences exist across various regions with regard to the residents’ health index, with the health index of residents of provincial capital cities being generally high. The eastern region of the YRB is dominated by residents with higher levels of health, accounting for the largest proportion of people living in that region. The central region of the YRB is characterized by residents with medium levels of health and accounts for the largest proportion of people living in that region. In contrast, the western region is characterized by residents with low levels of health. Overall, the health index of residents from different regions of the YRB varied considerably, with the index of health gradually decreasing from the eastern moving toward the western region.
The YRB residents’ health index displayed positive spatial autocorrelation, and the overall spatial distribution showed some clustering characteristics. Prefecture-level cities with high levels of resident health tended to be located near to other prefecture-level cities where residents had high levels of health, while prefecture-level cities with low levels of resident health were often adjacent to other prefecture-level cities with low levels of resident health. Spatial clustering showed an initial decrease, followed by an increase, suggesting notable fluctuations. The hotspots formed by the clustering of high-level zones showed a fluctuating trend, which gradually shifted from the eastern region toward the central and western regions of the YRB. The range of coldspots formed by the clustering of low-level zones was not stable, gradually expanding from the western region toward the central and eastern regions of the YRB.
The impacts of GDP per capita, urbanization rate, household size, wastewater emission, and exhaust gas emission on the health levels of residents in the YRB were significant, with GDP per capita, urbanization rate, and household size having a positive impact on the improvement in residents’ health in the YRB, helping to promote the improvement of health levels among residents in the YRB. Household size had the largest positive impact, followed by GDP per capita, while urbanization rate had the smallest impact. Wastewater emissions and exhaust gas emissions had a negative impact on the improvement of residents’ health in the YRB, significantly hindering improvements in residents’ health. Due to the particularity of the YRB and the close relationship between human diseases and water pollution, the negative impact of wastewater emissions was greater than that of exhaust gas emissions.
Author Contributions
C.L. and S.J. designed the study and wrote the paper. T.Z. contributed to data collection and processing. All authors have read and agreed to the published version of the manuscript.
Funding
This study was funded by the National Natural Science Foundation of China (Grant Nos. 42061054 and 41561110) and by the Science and Technology program of Gansu Province (Grant Nos. 21JR1RA234 and 20CX4ZA039).
Institutional Review Board Statement
Not applicable.
Informed Consent Statement
Not applicable.
Data Availability Statement
The data presented in this study are available on request from the corresponding author.
Acknowledgments
Thanks to the anonymous reviewers and all the editors in the process of revision.
Conflicts of Interest
The authors declare no conflict of interest.
References
- Zhao, X.Y.; Wang, W.J.; Wan, W.Y. Regional inequalities of residents’ health level in China: 2003–2013. Acta Geogr. Sin. 2017, 72, 685–698. (In Chinese) [Google Scholar]
- Xiao, L.; Ma, Y.; Li, Y.H.; Hu, J.F.; Cheng, Y.L.; Chen, G.Y.; Tao, M.X. Study on the health literacy status and its influencing factors of urban and rural residents in China. Chin. J. Health Educ. 2009, 25, 323–326. (In Chinese) [Google Scholar]
- Sun, M.; Lu, X.S. Air Pollution, SES and Residents’ Health Inequality—Micro Evidence Based on CGSS. Popul. J. 2019, 41, 103–112. (In Chinese) [Google Scholar]
- Smyth, F. Medical geography: Understanding health inequalities. Prog. Hum. Geogr. 2008, 32, 119–127. [Google Scholar] [CrossRef]
- Lucinda, C.; Diego, F.R.; Juan, M.P.; Joan, B. Inequalities in global health inequalities research: A 50-year bibliometric analysis (1966–2015). PLoS ONE 2018, 13, e0191901. [Google Scholar] [CrossRef]
- De Marchis, E.H.; Doekhie, K.; Willard-Grace, R.; Olayiwola, J.N. The Impact of the Patient-Centered Medical Home on Health Care Disparities: Exploring Stakeholder Perspectives on Current Standards and Future Directions. Popul. Health Manag. 2019, 22, 99–107. [Google Scholar] [CrossRef]
- Meng, L.J.; He, J.J.; Wu, S.C.; Li, Y.T. Ethical Considerations of Public Health Caused by the COVID-19 Outbreak. Chin. Med. Ethics 2020, 33, 438–441. (In Chinese) [Google Scholar]
- Yu, C.H.; Hou, Y.Y. The concept and thinking for “One Health”. J. Public Health Prev. Med. 2018, 29, 1–5. (In Chinese) [Google Scholar]
- WHO. 10 Facts on Health Inequities and Their Causes. Available online: https://www.who.int/news-room/facts-in-pictures/detail/health-inequities-and-their-causes (accessed on 24 February 2023).
- Hu, A.G.; Li, Z.C. China’s Actions, Initiatives and Plans in the Context of a Community of Common Health for Mankind. J. Xinjiang Norm. Univ. (Ed. Philos. Soc. Sci.) 2020, 41, 54–63. (In Chinese) [Google Scholar]
- Li, X.J.; Wen, Y.Z.; Li, Y.Z.; Yang, H.M. High-Quality Development of the Yellow River Basin from a Perspective of Economic Geography: Man-Land and Spatial Coordination. Econ. Geogr. 2020, 40, 1–10. (In Chinese) [Google Scholar]
- Qin, C.L.; Zhou, E.H. The Patterns of Spatial Differentiation of Economies in Yellow River Basin. J. Henan Univ. (Nat. Sci.) 2010, 40, 40–44. (In Chinese) [Google Scholar]
- Smith, D.B.; Kaluzny, A.D. Inequality in Health Care Programs: A Note on Some Structural Factors Affecting Health Care Behavior. Med. Care 1974, 12, 860–870. [Google Scholar] [CrossRef]
- Grand, J.L. Inequalities in health: Some international comparisons. Eur. Econ. Rev. 1987, 31, 182–191. [Google Scholar] [CrossRef]
- Deaton, A.S.; Paxson, C.H. Aging and inequality in income and health. Am. Econ. Rev. 1998, 88, 248–253. [Google Scholar]
- Wagstaff, A.; Van Doorslaer, E.; Watanabe, N. On decomposing the causes of health sector inequalities with an application to malnutrition inequalities in Vietnam. J. Econom. 2003, 112, 207–223. [Google Scholar] [CrossRef]
- Vladeck, B.C. Equity, access, and the costs of health services. Med. Care 1981, 19, 69–80. [Google Scholar] [CrossRef]
- O’Donnell, O.; Wagstaff, A.; Doorslaer, E.V. Income-related inqualities in health: Some international comparisons. J. Health Econ. 1997, 16, 93–112. [Google Scholar] [CrossRef]
- Chen, H.S.; Liu, Y.; Zhu, Z.J.; Li, Z.G. Does where you live matter to your health? Investigating factors that influence the self-rated health of urban and rural Chinese residents: Evidence drawn from Chinese General Social Survey data. Health Qual. Life Outcomes 2017, 15, 78–89. [Google Scholar] [CrossRef]
- Murray, C.J.; Salomon, J.A.; Mathers, C.D. A critical examination of summary measures of population health. Bull. World Health Organ. 2000, 78, 981–994. [Google Scholar] [CrossRef]
- Miao, J.; Wu, X.G. Urbanization socioeconomic status and health disparity in China. Health Place 2016, 42, 87–95. [Google Scholar] [CrossRef]
- Li, X.H.; Wang, C.P.; Zhang, G.Q.; Xiao, L.S.; Dixon, J. Urbanisation and human health in China: Spatial features and a systemic perspective. Environ. Sci. Pollut. Res. 2012, 19, 1375–1384. [Google Scholar] [CrossRef]
- Li, R.B.; Wang, W.Y.; Tan, J.A.; Li, H.R. The Health Index of Chinese And its Regional Difference. Hum. Geogr. 2004, 19, 64–68. (In Chinese) [Google Scholar]
- Harvey, J.; Hynes, G.; Pichora, E. Trends in Income-Related Health Inequalities in Canada. Healthc. Q. 2016, 18, 12–14. [Google Scholar] [CrossRef] [PubMed]
- Davis, C.M. The Changing Capabilities of Cohorts of the Elderly in Russia during 1990–2020: Measurement using a Quantitative Index. J. Popul. Ageing 2018, 11, 153–208. [Google Scholar] [CrossRef] [PubMed]
- Park, S.; Chen, J.; Roby, D.H.; Ortega, A.N. Differences in health care expenditures among non-Latino whites and Asian subgroups vary along the distribution of the expenditures. Med. Care Res. Rev. 2021, 78, 432–440. [Google Scholar] [CrossRef] [PubMed]
- Hong, E.J.; Ahn, B.C. Income-related health inequalities across regions in Korea. Int. J. Equity Health 2011, 10, 1–11. [Google Scholar] [CrossRef]
- Niu, J.L. Migration and Its Impact on the Differences in Health between Rural and Urban Residents in China. Soc. Sci. China 2013, 34, 46–63+205. (In Chinese) [Google Scholar]
- Grossman, M. On the concept of health capital and the demand for health. J. Political Econ. 1972, 80, 223–255. [Google Scholar] [CrossRef]
- Tobollik, M.; Keuken, M.; Sabel, C.; Cowie, H.; Tuomisto, J.; Sarigiannis, d.; Künzli, N.; Perez, L.; Mude, P. Health impact assessment of transport policies in Rotterdam: Decrease of total traffic and increase of electric car use. Environ. Res. 2016, 146, 350–358. [Google Scholar] [CrossRef]
- Brown, A.F.; Ma, G.X.; Miranda, J.; Eng, E.; Castille, D.; Brockie, T.; Jones, P.; Airhihenbuwa, C.; Farhat, T.; Zhu, L.; et al. Structural Interventions to Reduce and Eliminate Health Disparities. Am. J. Public Health 2019, 109, 72–78. [Google Scholar] [CrossRef]
- Yu, X.W.; Hu, H.W.; Wu, Z.H.; Shi, J. The Health Status of Citizens in China and Its Influencing Factors. China Popul. Resour. Environ. 2010, 20, 151–156. (In Chinese) [Google Scholar]
- Ma, H.T.; Xu, X.F. High-Quality Development Assessment and Spatial Heterogeneity of Urban Agglomeration in the Yellow River Basin. Econ. Geogr. 2020, 40, 11–18. (In Chinese) [Google Scholar]
- Chen, M.X.; Lu, D.D.; Zhang, H. Comprehensive Evaluation and the Driving Factors of China’s Urbanization. Acta Geogr. Sin. 2009, 64, 387–398. (In Chinese) [Google Scholar]
- Gu, H.J.; Cao, Y.X.; Elahi, E.; Jha, S.K. Human health damages related to air pollution in China. Environ. Sci. Pollut. Res. 2019, 26, 13115–13125. [Google Scholar] [CrossRef]
- Wang, J.W. Health Condition and Its Affecting Factors of Tibetan Residents: A Research Based on Data Collected in Six Cities. Tibet. Stud. 2019, 8, 72–80. (In Chinese) [Google Scholar]
- Wei, Y.; Zheng, C.Q.; Chen, R.B. Study on the Spatial Pattern of Population Health and Influencing Factors in Shaanxi Province: Based on Spatial Econometrics Analysis of 107 Counties. J. Stat. Inf. 2019, 34, 121–128. (In Chinese) [Google Scholar]
- Yang, Y.C.; Yu, J.L.; Xia, M.F. Study on Coordination Degree Between Residents’Health Level and Medical and Health Resources Input. Stat. Decis. 2021, 37, 53–57. (In Chinese) [Google Scholar]
- Yuan, C.G.; Liang, L.T.; Tang, L.H.; Chen, C.Y.; Ma, J.F. Land Economic Density Spatial Differences in Henan Industrial Cluster Area. Areal Res. Dev. 2019, 38, 25–29+40. (In Chinese) [Google Scholar]
- Shen, W.; Lu, F.X.; Qin, Y.C.; Xie, Z.X.; Li, Y. Analysis of temporal-spatial patterns and influencing factors of urban ecosystem carrying capacity in urban agglomeration in the middle reaches of the Yangtze River. Acta Ecol. Sin. 2019, 39, 3937–3951. (In Chinese) [Google Scholar]
- Liu, R.G.; Li, J.J.; Wang, J. Self-rated health and its influencing factors among adult rural residents in China. Chin. J. Public Health 2016, 32, 488–492. (In Chinese) [Google Scholar]
- Zhu, W.; Tian, Q.F.; Zhu, H.B. Studying on equity in rural health service in Henan province. Health Econ. Res. 2001, 18, 27–29. (In Chinese) [Google Scholar]
- Xin, Y.; Li, Z.; Wang, X.P.; Liu, C.P. Analysis on the Regional Health Differences for Residents Based on Multidimensional Indicators. Chin. Health Econ. 2020, 39, 73–76. (In Chinese) [Google Scholar]
- Qu, W.H.; Yan, Z.J. The Influence of Environmental Pollution, Economic Growth and Healthcare Services to Public Health Based on China’s Provincial Panel Data. Chin. J. Manag. Sci. 2015, 23, 166–176. (In Chinese) [Google Scholar]
- Addison, M.; Kaner, E.; Johnstone, P.; Hillier-Brown, F.; Moffatt, S.; Russell, S.; Barr, B.; Holland, P.; Salway, S.; Whitehead, M.; et al. Equal North: How can we reduce health inequalities in the North of England? A prioritization exercise with researchers, policymakers and practitioners. J. Public Health 2019, 41, 652–664. [Google Scholar] [CrossRef]
- Xu, W.D.; Li, C.; Shao, W.Y. Study on the impact of commercial insurance purchase behavior on health residents. J. Qingdao Univ. (Nat. Sci. Ed.) 2022, 35, 117–124. (In Chinese) [Google Scholar]
Disclaimer/Publisher’s Note: The statements, opinions and data contained in all publications are solely those of the individual author(s) and contributor(s) and not of MDPI and/or the editor(s). MDPI and/or the editor(s) disclaim responsibility for any injury to people or property resulting from any ideas, methods, instructions or products referred to in the content. |
© 2023 by the authors. Licensee MDPI, Basel, Switzerland. This article is an open access article distributed under the terms and conditions of the Creative Commons Attribution (CC BY) license (https://creativecommons.org/licenses/by/4.0/).