Abstract
This study developed a vulnerability evaluation framework for earthquake and flood disasters targeting water treatment facilities. The vulnerability evaluation framework of a water treatment facility determines vulnerability evaluation factors such as exposure, sensitivity, and adaptive capacity in consideration of the characteristics of an environmental facility. At this time, vulnerability evaluation items are derived in consideration of topography, natural environment, hydraulic, structural, and non-structural characteristics by analyzing the facility. The vulnerability evaluation items consist of 24 for earthquake disasters, and for the flood disaster derived 20 indicators. Then the final vulnerability of disaster is determined by considering the impact of each item. To verify the vulnerability evaluation framework proposed in this study, the technology was applied to a real water treatment facility in Korea. The proposed technique would be able to make a plan to prevent natural disasters damage and minimize such damage to the environmental facility.
1. Introduction
Water purification and treatment plants are two of the most essential environmental facilities necessary for comfortable living and sanitation, and if these infrastructures are damaged by natural disasters (e.g., earthquakes and flooding), it will cause serious harm to many people. For this reason, extensive studies have been conducted on prevention and damage countermeasures against earthquake and flood disasters, and to predict damage and respond to natural disasters, the concept of vulnerability has been applied [1].
Some studies have evaluated vulnerability to flooding disasters by considering the physical and social aspects. Han et al. [2] analyzed the vulnerability of local government infrastructure to flooding, not only in the present but also in the future, using three assessment indicators: climate exposure, infrastructure sensitivity, and adaptive capacity. Son et al. [3] developed a flood vulnerability index (FVI) and applied it to six mid-regions of the Bukhangang River basin. Also, several studies demonstrate the difference in factors according to the target area or structure compared to the vulnerability factor considered in the existing urban flood by applying the developed index to the natural basin (New reference). Moreover, Hwang et al. [4] developed the flood vulnerability index (pressure state response, PSR) based on the urban basin (25 districts in Seoul), and it determined the vulnerability factors through the analytic hierarchy process (AHP) method. In addition, some studies developed the system resilience assessment technique, which understands the damage scenarios and consequences and identifies resiliency plans and mitigation strategies for the wastewater treatment plants in a coastal area [5,6].
Most of the previous studies considered flood vulnerability were related to the development of the flood vulnerability index, and those applied to focus the macroscopic area such as the watersheds, river embankments, and urban areas, which included various infrastructures. Because these studies consider various vulnerability factors, the vulnerability of environmental facilities that are directly related to people’s lives is relatively underestimated. Therefore, it is necessary to determine vulnerability factors and develop indicators for environmental facilities.
As for vulnerability to earthquake disasters, after an earthquake of magnitude 5.8 occurred in Gyeongju (South Korea) in September 2016, the need to secure safety against earthquake disasters for environmental facilities was evident, and measures in the event of an earthquake disaster, and the correlations between the damage and the facilities’ conditions were analyzed [7]. In the case of an earthquake disaster in urban areas where the population and industrial facilities are concentrated, the scale of damage can easily increase, and the resulting ripple effect can severely affect the economy in the long term. Some countries in Asia and the USA have quantitatively analyzed their vulnerability to earthquake disasters, developed probabilistic earth-quake hazard maps to prepare for such disasters, and periodically update them based on new methodologies [8,9]. Japan’s Headquarters for Earthquake Research Promotion update the National Earthquake Hazard Chart through continuous research and the addition of new data [10]. In the case of Korea, the Earthquake Disaster Countermeasures Act was enacted in 2008, and a national earthquake risk map was drawn up as part of seismic countermeasures. Moreover, some studies considered not only the evaluation of earthquake vulnerability but also the restoration strategies such as optimal restoration process, and water supply routes according to the priority of the facility (e.g., evacuation shelters, hospitals) using an optimization approach [11]. The existing earthquake disaster vulnerability assessment provides an overview of the overall risk level by region; however, it is unsuitable for evaluating the risk for cities, countries, district units, and specific structures and facilities.
As the summary of the above literature related vulnerability of floods or earthquakes, the previous studies are effective when making decisions such as national policies or guidelines considering the overall vulnerability of the application area, but the vulnerability of independent facilities is underestimated. Especially in the case of environmental infrastructure, damage to natural disasters such as floods and earthquakes is directly related to people’s lives, and such damage can spread to secondary damage. Therefore, it is necessary the determination of appropriate vulnerability factors and evaluates the vulnerability of environmental facilities. Moreover, because the damage caused by an earthquake or flood disaster occurs owing to the action of complex elements (e.g., buildings and social factors) as well as the effects of physical characteristics, the evaluation of the vulnerability of environmental facilities needs to consider various factors.
Therefore, this study developed an evaluation framework for the vulnerability of environmental facilities, focusing on water and wastewater treatment systems. The proposed vulnerability assessment indicators were determined to consider various lateral factors (e.g., topography, natural environment, and hydraulic, structural, and non-structural factors). Moreover, using the determined indicators, vulnerability is calculated, and according to the importance of the systems values with more weight are considered as vulnerability factors. The proposed technique is applied to actual water and wastewater treatment systems, and a plan could be designed to prevent and minimize such damage.
2. Evaluation of Vulnerability to Earthquake and Flooding Disasters
The concept of vulnerability to earthquakes and floods was first investigated in research fields such as natural disaster [12]. The concept of vulnerability has slightly different meanings in various fields, for example, famine, natural disasters, disaster risk management, public health, and climate change. Timmermann [13] mentioned that the term “vulnerability” is now used in such a broad sense that it has almost no specific meaning other than the rhetorical meaning of “areas of greatest concern.” Furthermore, Kelly and Adger [14] pointed out that the meaning of vulnerability is mixed with resilience, adaptability, fragility, and risk. Terms such as exposure, sensitivity, and adaptive capacity are also related to vulnerability, further complicating the concept of vulnerability.
As vulnerability is conceptually ambiguous, several conceptual models exist. Some technical papers consider vulnerability within a risk–hazard framework. This is viewed from the perspective of the dose–response relationship of external hazards to the system and their negative impacts. In addition, among the concepts of vulnerability in the field of natural disaster research, Lim et al. [12] defines risk according to the hazard to a system by combining the hazard to climate impact and the vulnerability of the systems. Moreover, Petersen et al. [9] demonstrated vulnerability as a function of the sensitivity and adaptive capacity of a system and defined it as follows:
The Intergovernmental Panel on Climate Change (IPCC) defines vulnerability as the residual impact of climate change after adaptation measures have been taken and is expressed as follows [15]: Vulnerability is the remainder of the negative impacts of climate change minus adaptation. Vulnerability is based on climate scenarios originating from projections of future emission trends. This indicates a series of evaluation results that reveal how responsive the physical system is and the corresponding adaptation options.
In this regard, vulnerability is potentially influenced by the degree of exposure of the system and, accordingly, the system’s sensitivity, and is determined by the adaptive capacity to cope with such variations [16]. Therefore, in this study, the concept of vulnerability from McCarthy et al. [16] was introduced to calculate the vulnerability of environmental facilities to earthquakes and flood disasters, as shown in Figure 1.
Based on the determined formulation of vulnerability, this study developed a framework for assessing the vulnerability of environmental facilities (i.e., water and wastewater treatment plants) to earthquake and flood disasters, following the procedure shown in Figure 2. The framework consists of four steps, and the information of the single (individual) facility is considered, such as exposure to geology and topographical conditions, the degree of urbanization, and the disaster experience in which the facility is located. There are four steps in developing an approach for assessing the vulnerability of environmental facilities to earthquakes and floods: (1) determination of vulnerability evaluation items, (2) calculation of vulnerability evaluation factors, (3) calculation of the weight factors for each item, and (4) calculation of the vulnerability index considering the weight.
First, by examining cases involving the implementation of existing vulnerability assessment techniques, previously applied vulnerability evaluation items and factors were investigated and analyzed for earthquake and flood disasters targeting environmental facilities. Appropriate evaluation factors for actual earthquakes and flood disasters were derived in terms of exposure, sensitivity, and adaptive capacity to construct the vulnerability evaluation. Standardization of items was then performed to calculate factors with different units for each evaluation item. For the standardization of data, the Z-score, scale readjustment [12], difference from baseline [17], and characteristics of evaluation items were considered to determine the sign according to the degree of influence of standardization and evaluation items. In the third step, the weight of the vulnerability evaluation item was calculated by combining the AHP [18] or entropy weight calculation method [19] to the value of the previously derived standardized evaluation item. Finally, each vulnerability index (i.e., exposure, sensitivity, and adaptive capacity) was calculated considering the weight and final vulnerability index.

Figure 1.
Concept of vulnerability [16].

Figure 2.
Earthquake and flood disaster vulnerability evaluation approach [18,19].
2.1. Determination of Vulnerability Evaluation Items
Vulnerability evaluation items for earthquake and flood disasters in environmental facilities were determined. Because the characteristics of earthquakes and flood disasters are different, among the vulnerability evaluation items are applied as common indicators (i.e., the degree of urbanization, damage history, and nonstructural factors). Exposure and structural factors were selected as evaluation items based on their characteristics.
For the earthquake vulnerability evaluation items, 24 evaluation items comprising 5 exposures, 3 sensitivity, and 16 adaptive capacities were considered as shown in Table 1. Among the major classifications, exposure is an indicator of geological and topographical conditions; sensitivity is classified into the degree of urbanization, damage experience, earthquake-resistant design, and so on; and adaptive capacity is classified into structural and non-structural factors. The geological and topographical conditions of the exposure index to earthquake disasters are the most influential factors that increase the vulnerability of environmental facilities in the event of an earthquake and are essential for assessing earthquake disaster vulnerability [20].

Table 1.
Evaluation items for vulnerability to earthquake disasters.
This study examined five geologic and topographical factors (ground condition, possibility of slope activity on the main surface, distance between the structure and fault zone, irregularity of the cross-section, and imbalanced earth pressure, such as flat earth pressure and earthquake zone). The degree of urbanization, disaster damage experience, and seismic design were considered as sensitivity indices of earthquake disasters. It is an index that shows the sensitivity to damage aggravation. Environmental facilities in areas with disaster damage experience are known to be more sensitive to disaster damage, and seismic design is an evaluation item that can indicate sensitivity when deriving vulnerability.
The adaptive capacity indicators for earthquake disasters are divided into structural and non-structural factors. The eight structural factors include the construction method, size of the section, whether the structure is continuously deformed, type of wall structure, state of damage to the structure, shape of the structure, structure durability, and the number of floors in the building. These are used to evaluate the environmental facilities’ size, construction method, and deterioration state.
Nonstructural factors can evaluate the state of restoration and damage spread in the state of operation and the inoperability of environmental facilities. There are eight items which include emergency preparedness training, emergency response plans and manuals (documents), emergency generator operation status, recovery time, the existence of alternative facilities, secondary disasters, direct supply to critical facilities, and costs of restoring the performance of a structure.
The selected flood disaster vulnerability evaluation items are shown in Table 2; the 20 evaluation items consisted of 3 exposures, 7 sensitivities, and 10 adaptive capacities. The hydraulic and hydrological conditions of the flood disaster exposure index are fundamental factors that increase the vulnerability of environmental facilities in the event of a flood disaster and are essential factors for flood disaster vulnerability assessment. This study investigated three hydraulic and hydrological conditions: daily maximum precipitation, days with a daily precipitation of 80 mm or more, and channel slope. Among the applied factors, ‘Days with daily precipitation of 80 mm or more’ was determined based on the items of the World Meteorological Organization (WMO) meteorological observations. In WMO [21], there are introduced 50 factors for extreme Meteorological index, and this study applied ‘Days with daily precipitation of 80 mm or more’ as a factor of exposure to flood disasters.
Table 2.
Flood disaster vulnerability assessment items.
The degree of urbanization, disaster damage, and natural topographical factors were considered in the sensitivity index for flood disasters. It is an indicator of vulnerability to damage in the event of a flood disaster owing to operational limitations and system performance reduction caused by the destruction of environmental facilities. Environmental facilities in areas selected as flood damage and disaster risk areas are known to be more sensitive to disaster damage based on the history of flood damage. Natural topographical factors include distance from the river for inland drainage performance, altitude of the facility, impervious basin area, and soil drainage.
The adaptive capacity indicators for flood disasters are divided into structural and non-structural factors. The structural factors for environmental facilities included the installation status of flood prevention facilities (i.e., grit and inflow pumping stations, collecting wells, and detention ponds) and other facilities (i.e., emergency shut-off valves, screens, and earth leakage blocking facilities). Non-structural factors are items that can evaluate the state of restoration and damage spread in the state of operation or inoperability of environmental facilities and are configured in the same manner as non-structural factors considered in the event of an earthquake disaster.
2.2. Calculation of Vulnerability Evaluation Factors
As the objective of this study was to calculate the vulnerability of environmental facilities to earthquakes and floods, it was necessary to consider the influence of the items derived in Section 2.1, as well as the evaluation factors. Generally, it is important to effectively analyze and express the characteristics of indicators, such as different units, different ranges of indicator values, and positive (+) or negative (−) effects on the final vulnerability [22]. These indicators can be divided into several types based on their usage and complexity [23].
- -
- Specific indicators: Indicators that represent the data to be analyzed as it is.
- -
- Key indicators: Indicators that represent data with high correlation by considering the final influence.
- -
- Composite indicators: Indicators derived using two or more data to derive a specific indicator [24].
Among these indicators, composite indicators represent multiple factors with different units and characteristics as one indicator; therefore, when using simple statistical values (e.g., arithmetic mean, standard deviation) of multiple indicators, composite indicators that need to consider the characteristics of multiple factors may have ambiguous values or may not represent values properly. Therefore, to derive a specific indicator using two or more data points, this study standardized each evaluation item (using the z-score, re-scaling, and distance to the reference country) and calculated the evaluation factors (i.e., exposure, sensitivity, and adaptive capacity) considering the impact of the vulnerability evaluation items.
2.2.1. Standardization of Vulnerability Evaluation Items
The standardization method applied in the study was standardized using the Z-score, re-scaling, and difference from the baseline method, and as a result, the technique that most closely matched the characteristics of the evaluation item was applied.
The Z-score technique is the most commonly used standardization method (Equation (3)). In this method, all data are adjusted to have a mean of 0 and a standard deviation of 1, and the standardized random variable Z value indicates the number of times the value of the data deviates from the mean of the distribution by the standard deviation.
where X is the given value, Xmean is the mean of the given data, σ is the standard deviation
Re-scaling is a standardization technique (Equation (4)) that can be quantitatively compared when the ranges of several factors are different, and each factor is transformed to have the same range (0 to 1). However, the re-scaling technique is used when the extreme values are reliable because the extreme values (highest and lowest values) of the data can distort the re-scaled data when outliers occur.
where X is a given value, and Xmin and Xmax are the minimum and maximum values of the given data, respectively.
The distance to reference country (DRC) technique (Equation (5)) is a technique that uses the ratio of a measurement index to a surrogate index as a reference.
2.2.2. Consideration of the Impact of Vulnerability Evaluation Items
The impact of the vulnerability evaluation item is influenced according to the vulnerability, and especially as the evaluation items increase or decrease, the tendency to positively (+) or negatively (−) affect the vulnerability is different. Therefore, it is necessary to apply the appropriate sign (e.g., positive (+) or negative) considering the degree of influence and convert the value to calculate a composite indicator, such as vulnerability. However, if standardization is performed using relative differences, such as distance to the reference country and Z-score, a positive number will be assigned if it is greater than the standard or a negative number if it is smaller. However, if the standardization procedure is standardized as an unsigned percentile value, such as re-scaling, it is necessary to assign a sign or convert the value according to the degree of influence of the vulnerability evaluation items.
Therefore, in this study, when the item value has no sign, such as re-scaling, considering the influence (+/−) of each vulnerability evaluation item, it was converted into a reciprocal number (1/x) if it had a negative impact.
2.2.3. Calculation of Main Vulnerability Indicators
In this step, the main indicators of vulnerability (i.e., exposure, sensitivity, and adaptive capacity) are calculated using the average, assuming that these indicators are all equally important. In the next step, the weights of items for the main vulnerability indicators are calculated by applying the AHP and Entropy methods, and the weights are taken into account when deriving the total vulnerability of disaster. There were 5 evaluation items for exposure, 3 items for sensitivity, and 16 adaptive capacities (Equations (6)–(8)).
where EDiaster is the exposure value for earthquake and flood disasters (earthquake disaster: five items, flood disaster: three items), SDiaster is the sensitivity value for earthquake and flood disasters (earthquake disaster: three items, flood disaster: seven items), and ADiaster is the adaptive capacity value for earthquake and flood disasters (earthquake disaster: 16 items, flood disaster: 10 items).
2.3. Weight Calculation of Vulnerability Evaluation Items
For vulnerability evaluation, it is important to determine the importance, that is, the weight of evaluation items, to prioritize factors. Weight calculation determines the hierarchy among evaluation items, and the quantitatively calculated results are used as one of the processes to increase reliability because they may not reflect reality and may be distorted. When evaluating disaster vulnerability, calculations should not be complex because it is important to assign appropriate weights to derive efficient results [25]. This study introduces the analytic hierarchy process (AHP), which calculates weights based on surveys and expert opinions, and the entropy method, which calculates weights using the attribute information of evaluation items. Considering the characteristics of the earthquake and flood disaster evaluation items, the importance of vulnerability evaluation items was determined by applying a combined weight calculation method.
2.3.1. Analytic Hierarchy Process
AHP [18] is a method of subjectively calculating the weight through the judgment of decision-makers based on a survey. It is a multicriteria decision-making technique that quantifies and stratifies importance through priorities when there are multiple evaluation criteria in the decision-making process.
Generally, the process of calculating weights using the AHP method is divided into three steps. For the AHP, a hierarchical structure is formed, and the objective of the ultimate goal and the criteria for each step are determined. The first step involves defining a problem, setting a goal, and conducting a survey (Figure 3). Second, based on the formed hierarchical structure, several evaluation items and elements were classified, and the weight was calculated through a pairwise comparison between the main index and sub-indicators. In the last step, weights were verified using the Consistency Index (CI) (Equation (9)), which can determine the consistency between respondents, and priorities were determined for each item [26].
where Xmean is the mean of given data, N is the number of criteria
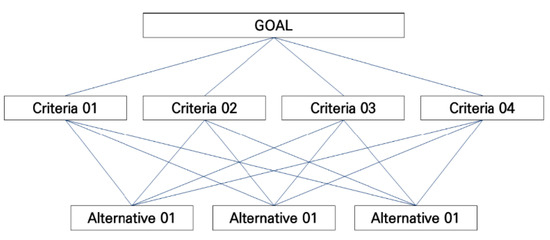
Figure 3.
Hierarchy formation of AHP.
2.3.2. Entropy Weight Method
Entropy weight methods (EWM) are classified into three types based on thermodynamic theory: thermodynamics, statistics, and information entropy [27]. In this study, an information theory entropy weight calculation method was applied. EWM was introduced by Shannon and Weaver [19]. Unlike AHP analysis, which reflects the subjective opinions of surveys and experts, EWM is an objective weight calculation method that applies information theory based on the data attribute information of evaluation items.
In general, EWM is determined by the concentrated distribution of evaluation item values; the more dispersed the value, the smaller is the weight [28]. EWM calculates weights in four steps. First, for weight calculation, a representative matrix is constructed based on the values of the evaluation items (Equation (10)), and the attribute information of the constructed matrix is extracted and normalized (Equation (11)). The entropy is calculated using normalized data (Equation (12)). Finally, the weight () and diversity () (Equation (13)) are calculated.
where M is a matrix consisting of evaluation items; m and n are the number of areas and items, pij is the normalized value; Ej is the entropy value; wi is the weight of each item.
2.3.3. Combined Weight Calculation Method
As mentioned in the previous chapter, AHP method is a method of calculating the weight between each effect measure through a survey of expert groups. This can express the importance between the effect scales based on the expert’s experience but has the disadvantage that subjective opinions may be included because the result is derived through a survey. The weight calculated through the entropy method is a method of selecting the optimal alternative by increasing the discrimination power between each variable by applying the entropy theory of information theory. This has the advantage that the decision maker’s subjective opinion is not included, and it is possible to select the optimal alternative using only the given data. However, all effectiveness measures contain the error of having the same importance. Therefore, in this study, a combined weight calculation (CWC) approach [28] that combines the two weights methods (i.e., AHP and Entropy) was applied in order to improve the disadvantages of each technique and to consider both the importance of the effect scale.
In the CWC method, when Sj is the weight reflecting the expert opinion, the combined weight is calculated as shown in Equation (14) in which the weight Sj is considered in Equation (13). In this study, weights were derived and applied through the AHP method to derive the expert’s opinion Sj.
2.4. Calculation of Vulnerability of Disasters (VoD) Considering Weight
The last step in calculating the Vulnerability of Disasters (VoD) involves applying the weights derived by Section 2.3.2, to calculate the vulnerability to earthquake and flood disasters considering all the vulnerability indicators (i.e., sensitivity, exposure, and adaptation capacity) (Equation (15)).
According to the VoD formula, among the key indicators, the sensitivity and exposure appear to have a lower weight than the adaptivity index, which results in a potential impact due to the combination of the exposure and sensitivity of the system, and the potential impact is combined with the adaptivity to calculate VoD. The VoD formula was applied to the concept of McCarthy et al. [16], as shown in Figure 1. This index represents a value between 0 and 1; if the VoD value is closer to 1, the facility is considered more vulnerable.
3. Application and Results
In this study, to develop a vulnerability evaluation framework for environmental facilities focused on water and wastewater treatment systems against earthquakes and flood disasters, vulnerability indices were generated and then applied to Gongchon Water Treatment Facility (Figure 4) in South Korea.
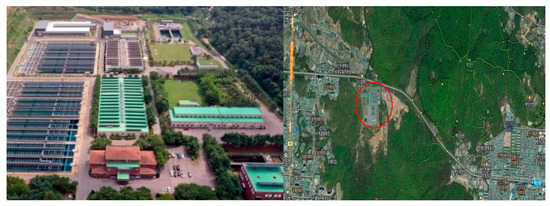
Figure 4.
Gongchon water treatment facility.
The Gongchon Water Treatment Facility is located in Incheon and has the treatment capacity of 413,000 m3/day. The facility consists of civil structures (two-stage purification facilities) and architectural structures (12 buildings). The capacity of the entire facility includes the capacity of the two-stage purification facilities. One of the purification facilities was constructed in 1996 and the other in 2011. The regular structural safety diagnosis performed in March 2020 evaluated the facility as [B grade (good)], which means that there are no impediments to its function, and only a few repairs are required to improve durability.
The vulnerability evaluation framework is illustrated in Figure 2. First, the vulnerability evaluation items for earthquake and flood disasters are derived in Section 3.1. In Section 3.2, the vulnerability evaluation factors (i.e., exposure, sensitivity, and adaptive capacity) are calculated, and the impact of the vulnerability evaluation items is considered (Section 3.3). Finally, the vulnerability to disaster (VoD) was determined by considering vulnerability evaluation factors.
3.1. Derivation of Vulnerability Evaluation Items
The selected earthquake disaster vulnerability evaluation items are shown in Table 2; 24 evaluation items comprising 5 exposures, 3 sensitivities, and 16 adaptivity capacities were considered to derive earthquake disaster vulnerability.
3.2. Calculation of Vulnerability Evaluation Factors
3.2.1. Standardization of Vulnerability Evaluation Items
In this study, information such as the Special act on the safety control and maintenance of establishments, the national statistics portal, and the river maintenance basic plan were used to determine the values of the evaluation items and conduct standardization. Especially, the Special act on the safety control and maintenance of establishments [29] is a law for safety diagnosis and maintenance of the major infrastructure including environmental facilities. The evaluation criteria for the main factors of this study are based on the 2021 Special act on the safety control and maintenance of establishments and the references considering the vulnerability of earthquakes and flooding disasters in South Korea [30,31,32,33]. For earthquake and flood disasters, Table A1, Table A2, Table A3, Table A4, Table A5, Table A6, Table A7, Table A8, Table A9, Table A10, Table A11, Table A12, Table A13, Table A14, Table A15, Table A16, Table A17, Table A18, Table A19, Table A20, Table A21, Table A22, Table A23, Table A24, Table A25, Table A26, Table A27, Table A28, Table A29, Table A30, Table A31, Table A32, Table A33, Table A34, Table A35, Table A36, Table A37, Table A38, Table A39, Table A40, Table A41, Table A42, Table A43 and Table A44 (Appendix A) show the standard for quantifying values for each vulnerability category, deriving the value of the relevant item, and standardizing the evaluation score. Table 3 and Table 4 show the standardization results for each item for the earthquake and flood disasters. The Gongchon Water Purification Plant consists of eight structures (filter pond, water purification tank, chemical tank, recovery tank, enrichment tank, distribution tank, mixing pond, and utility duct), and the mean of the eight structures was used for each evaluation item.
Table 3.
[Earthquake Disaster] Standardization results for the evaluation items.
Table 4.
[Flood Disaster] Standardization results for the evaluation items.
3.2.2. Consideration of the Impact of Vulnerability Evaluation Items
Table 5 and Table 6 show the results when considering the influence of each item on earthquake and flood disasters. When the impact is considered in the standardized results of each evaluation item of the Gongchon Water Purification Plant, all earthquake disaster vulnerability evaluation items showed a positive (+) impact (*positive (+) impact: The closer the standardized evaluation result is to 1, the more vulnerable is the disaster), except for the exposure evaluation items (earthquake zone, seismic design, emergency response plan and manual, emergency generator operation status). Therefore, the evaluation item value was modified through the reciprocal (1/x) of the standard score of the evaluation item, showing a negative (−) impact on the earthquake disaster vulnerability evaluation items.
Table 5.
[Earthquake Disaster] Consideration of the impact of vulnerability evaluation items.
Table 6.
[Flood Disaster] Consideration of the impact of vulnerability evaluation items.
In the case of a flood disaster, all exposure evaluation items, except for daily maximum precipitation, average daily precipitation of 80 mm or more, flow path slope, sensitive natural disaster risk zone, impervious area ratio, flood prevention facilities of adaptive capacity, and emergency response plan, showed a positive (+) impact. Therefore, the value of the evaluation items was modified through the reciprocal (1/x) of the standard score of the evaluation items, showing a negative (−) impact among the flood disaster vulnerability evaluation items.
3.3. Calculation of Weight for Each Vulnerability Evaluation Factor
In this section, after the weight was determined using the combined weight calculation method for the evaluation score of each item among the weight calculation techniques, each key index of vulnerability (exposure, sensitivity, and adaptive capacity) was calculated. Table 7 and Table 8 present the results of calculating each vulnerability evaluation factor by assigning weights to the values of the earthquake and flood disaster evaluation items using the entropy weight calculation method.
Table 7.
[Earthquake Disaster] Calculation of vulnerability indicators considering weights.
Table 8.
[Flood Disaster] Calculation of vulnerability indicators considering weights.
3.4. Calculation of Vulnerability of Disasters
The vulnerability of disasters (VoD) was calculated through Equation (15) for the vulnerability to earthquake and flood disasters. In terms of vulnerability to disasters, vulnerability to flood disasters (0.33) can be evaluated as low compared to earthquake disasters (0.36) in Table 9. In the case of the Gongchon water treatment facility, the vulnerability to earthquake and flood disasters was considered low in terms of evaluation items; however, the vulnerability to earthquake disasters was evaluated as relatively high because an earthquake-resistant design was not considered.
Table 9.
Vulnerability to earthquake and flood disasters at Gongchon Water Purification Plant.
4. Conclusions and Future Studies
In this study, previous vulnerability evaluation techniques were analyzed and vulnerability evaluation items were derived to develop flood and earthquake disaster vulnerability evaluation frameworks for environmental facilities. Then, a vulnerability evaluation indicator (i.e., vulnerability to disaster) was developed. In addition, an evaluation score was derived by applying the evaluation index to actual facility cases, and future supplementary directions based on the fragility of the facilities were presented. The results of this study can be summarized as follows.
- (1)
- Previous vulnerability evaluation techniques have mainly considered various evaluation factors to identify potential vulnerabilities, such as watersheds, river embankments, infrastructure, and urban areas. Although a vulnerability assessment for environmental facilities is required, the vulnerability evaluation is at a basic level.
- (2)
- The water treatment facility, an environmental facility, was investigated, and vulnerability evaluation items were derived by dividing them into exposure, sensitivity, and adaptive capacity aspects, considering the characteristics of the facility. In the items derived for earthquake disasters, four exposure factors, three sensitivity factors, eight structural factors, and eight nonstructural factors in terms of adaptive capacity were derived. In addition, for the flood disaster, the exposure factors were set to 3, sensitivity to 7, and adaptive capacity to 10.
- (3)
- The flood and earthquake vulnerability of a disaster (VoD) (Equation (14)) is presented through a vulnerability evaluation list of water treatment facilities among environmental facilities. It can be used to evaluate environmental facilities and will be used as basic data for projects related to disaster vulnerability assessment for environmental facilities in the future.
- (4)
- Environmental facility flood and earthquake disaster vulnerability was applied to the actual facility, the Gongchon water treatment facility, and it was confirmed that the classification of vulnerability evaluation factors (exposure, sensitivity, and adaptivity capacity) was appropriate, implying the possibility of application to other environmental facilities as well as water treatment facilities.
However, this study had some limitations that should be addressed in future studies. Since, the objective of this study is not to prioritize or evaluate the importance of vulnerability but to develop the vulnerability evaluation technology/framework for environmental facilities, this study assumed the importance of the items of vulnerability indicators as equal, and the total vulnerability index was calculated by McCarthy et al. [16]. However, the priority and importance will differ depending on the characteristics of various environmental facilities or social infrastructure, it needs to apply in various fields of research if only the equation of the total vulnerability index is changed for considering various importance. Moreover, although this study applied real environmental facilities to verify the proposed technique, the characteristics of the vulnerability evaluation factors were different according to the facilities. Therefore, this analysis has to be extensively validated and applied to various sizes and types of facilities.
Author Contributions
Conceptualization—Y.H.C. and D.G.Y.; Data curation—P.J.K. and Y.Y.; Methodology—Y.H.C. and P.J.K.; Supervision—D.G.Y. and Y.Y.; Writing—original draft, Y.H.C. All authors have read and agreed to the published version of the manuscript.
Funding
This work was supported by the Korean Ministry of Environment (MOE) (2022002870001).
Institutional Review Board Statement
Not applicable.
Informed Consent Statement
Not applicable.
Data Availability Statement
Not applicable.
Acknowledgments
This work was supported by Korea Environment Industry&Technology Institute(KEITI) through Environmental R&D Project on the Disaster Prevention of Environmental Facilities Program (or Project), funded by Korea Ministry of Environment(MOE).
Conflicts of Interest
The authors declare no conflict of interest.
Appendix A
Table A1.
[Earthquake Disaster: Exposure] Ground conditions [29].
Table A1.
[Earthquake Disaster: Exposure] Ground conditions [29].
| Soil Profile Type | Soil Profile Description | Average Soil Property for Top 30.48 m | Standardized Score [0-1] | ||
|---|---|---|---|---|---|
| Shear Wave Velocity (m/s) | Standard Penetration Test N (Blow/Foot) | Undrained Shear Strength (kPa) | |||
| SA | Hard rock | >1500 | N/A | N/A | 0.2 |
| SB | Rock | 700–1500 | |||
| SC | Very dense soil and soft rock stiff | 360–760 | >50 | >100 | 0.5 |
| SD | Soil profile | 180–360 | 15–50 | 50–100 | 0.8 |
| SE | Soft soil profile | <180 | <15 | <50 | 1 |
Table A2.
[Earthquake Disaster: Exposure] Experience of slope activity [29].
Table A2.
[Earthquake Disaster: Exposure] Experience of slope activity [29].
| History of Slope Activity (Y/N) | Standardized Score [0-1] |
|---|---|
| Y | 1 |
| N | 0.2 |
Table A3.
[Earthquake Disaster: Exposure] Distance between the facility and the fault zone [29].
Table A3.
[Earthquake Disaster: Exposure] Distance between the facility and the fault zone [29].
| Distance between the Facility and Fault Zone (m) | Standardized Score [0-1] |
|---|---|
| >50 m | 1 |
| 50–500 m | 0.8 |
| <500 m | 0.5 |
Table A4.
[Earthquake Disaster: Exposure] Irregularity of the cross-section or imbalanced earth pressure [29].
Table A4.
[Earthquake Disaster: Exposure] Irregularity of the cross-section or imbalanced earth pressure [29].
| Imbalanced Earth Pressure (Y/N) | Standardized Score [0-1] |
|---|---|
| Y | 1 |
| N | 0.4 |
Table A5.
[Earthquake Disaster: Exposure] Earthquake zone [29].
Table A5.
[Earthquake Disaster: Exposure] Earthquake zone [29].
| Earthquake Zone (in South korea) | Standardized Score [0-1] |
|---|---|
| Except northern Gangwon-do and Jeju-do | 1 |
| Northern Gangwon-do and Jeju-do | 0 |
Table A6.
[Earthquake Disaster: Sensitivity] Degree of urbanization [30].
Table A6.
[Earthquake Disaster: Sensitivity] Degree of urbanization [30].
| Degree of Urbanization (%) | Standardized Score [0-1] |
|---|---|
| Rate of urban area 80 | 1 |
| Rate of urban area 80 | 1-urban area (m2)/rural area (m2) |
Table A7.
[Earthquake Disaster: Sensitivity] Disaster damage experience [29].
Table A7.
[Earthquake Disaster: Sensitivity] Disaster damage experience [29].
| Disaster Damage Experience(Y/N) | Standardized Score [0-1] |
|---|---|
| Y | 1 |
| N | 0.4 |
Table A8.
[Earthquake Disaster: Sensitivity] Seismic design based on Modified Mercalli intensity scale (MMI) [29].
Table A8.
[Earthquake Disaster: Sensitivity] Seismic design based on Modified Mercalli intensity scale (MMI) [29].
| Disaster Damage Experience (MMI) | Standardized Score [0-1] |
|---|---|
| I | 1 |
| II-III | 0.4 |
| IV-V | 0.4 |
| VI-VII | 0.6 |
| VIII-IX | 0.8 |
| X-XII | 1 |
Table A9.
[Earthquake Disaster: Adaptivity capacity] Construction method [29].
Table A9.
[Earthquake Disaster: Adaptivity capacity] Construction method [29].
| Construction Method | Standardized Score [0-1] |
|---|---|
| Open-cut construction | 1 |
| Excavation construction | 0.4 |
Table A10.
[Earthquake Disaster: Adaptivity capacity] Size of the section for each building in facility [29].
Table A10.
[Earthquake Disaster: Adaptivity capacity] Size of the section for each building in facility [29].
| Size of the Section | Standard of Stanardize Score | Standardized Score [0-1] |
|---|---|---|
| Large | Width < 30 m, higher < 20 m | 1 |
| Mediem–Large | Width < 20 m, higher < 15 m | 0.8 |
| Medium | Width < 10 m, higher < 10 m | 0.5 |
| Small | Width > 20 m, higher > 15 m | 0.2 |
Table A11.
[Earthquake Disaster: Adaptivity capacity] Structure deformation [29].
Table A11.
[Earthquake Disaster: Adaptivity capacity] Structure deformation [29].
| Structure Deformation (Y/N) | Standardized Score [0-1] |
|---|---|
| Y | 0.5 |
| N | 0.2 |
Table A12.
[Earthquake Disaster: Adaptivity capacity] Type of wall structure [29].
Table A12.
[Earthquake Disaster: Adaptivity capacity] Type of wall structure [29].
| Whether Structure Deformed (Y/N) | Standardized Score [0-1] |
|---|---|
| Masonry | 1 |
| Some masonry | 0.8 |
| Plain concrete | 0.5 |
| Reinforced concrete | 0.2 |
Table A13.
[Earthquake Disaster: Adaptivity capacity] State of damage to the structure [29].
Table A13.
[Earthquake Disaster: Adaptivity capacity] State of damage to the structure [29].
| Damage to the Structure Grade | Standardized Score [0-1] |
|---|---|
| D, E | 1 |
| C | 0.4 |
| B | 0.7 |
| A | 0.1 |
Table A14.
[Earthquake Disaster: Adaptivity capacity] Shape of building structure [29].
Table A14.
[Earthquake Disaster: Adaptivity capacity] Shape of building structure [29].
| Shape of Building Structure | Standardized Score [0-1] |
|---|---|
| Atypical (asymmetric) structure | 1 |
| Regular (symmetrical) structure | 0.5 |
Table A15.
[Earthquake Disaster: Adaptivity capacity] Structure durability [29].
Table A15.
[Earthquake Disaster: Adaptivity capacity] Structure durability [29].
| Structure Durability (Year) | Standardized Score [0-1] |
|---|---|
| Structure durability 50 | 1 |
| 30–49 | 0.8 |
| 10-29 | 0.5 |
| 10 < Structure durability | 0.2 |
Table A16.
[Earthquake Disaster: Adaptivity capacity] The number of floors of the building [29].
Table A16.
[Earthquake Disaster: Adaptivity capacity] The number of floors of the building [29].
| The Number of Floors of the Building | Standardized Score [0-1] |
|---|---|
| 1~2 | 1 |
| 3~5 | 0.75 |
| 6~9 | 0.5 |
| 10~ | 0.25 |
Table A17.
[Earthquake Disaster: Adaptivity capacity] Emergency preparedness training [31].
Table A17.
[Earthquake Disaster: Adaptivity capacity] Emergency preparedness training [31].
| Number of Emergency Preparedness Training (per Year) | Standardized Score [0-1] |
|---|---|
| Number of training 5 | 1 |
| 1–4 | 0.5 |
| N | 0 |
Table A18.
[Earthquake Disaster: Adaptivity capacity] Emergency plans and manuals (documents) [31].
Table A18.
[Earthquake Disaster: Adaptivity capacity] Emergency plans and manuals (documents) [31].
| Emergency Plans and Manuals | Standardized Score [0-1] |
|---|---|
| ALL | 1 |
| Only manual | 0.75 |
| Only Plan | 0.5 |
| None | 0.25 |
Table A19.
[Earthquake Disaster: Adaptivity capacity] Status of emergency generator operation [31].
Table A19.
[Earthquake Disaster: Adaptivity capacity] Status of emergency generator operation [31].
| Status of Emergency Generator Operation (Y/N) | Standardized Score [0-1] |
|---|---|
| Y | 1 |
| N | 0 |
Table A20.
[Earthquake Disaster: Adaptivity capacity] Recovery time [29].
Table A20.
[Earthquake Disaster: Adaptivity capacity] Recovery time [29].
| Recovery Time (Days) | Standardized Score [0-1] |
|---|---|
| Recovery time > 10 | 1 |
| 1–10 | 0.8 |
| 1 < Recovery time | 0.6 |
Table A21.
[Earthquake Disaster: Adaptivity capacity] Existence of alternative facilities [29].
Table A21.
[Earthquake Disaster: Adaptivity capacity] Existence of alternative facilities [29].
| Alternative Facilities (Y/N) | Standardized Score [0-1] |
|---|---|
| Y | 0.5 |
| N | 01 |
Table A22.
[Earthquake Disaster: Adaptivity capacity] Secondary disasters [29].
Table A22.
[Earthquake Disaster: Adaptivity capacity] Secondary disasters [29].
| Probability of Secondary Disasters | Example of Secondary Disasters | Standardized Score [0-1] |
|---|---|---|
| Major | Hospital, Power plants, Labortory etc. | 1 |
| Moderate | Emergency water shortage for the lack of water supply | 0.8 |
| Minor | Water shortage for the lack of water supply | 0.6 |
Table A23.
[Earthquake Disaster: Adaptivity capacity] Direct supply to important facilities [29].
Table A23.
[Earthquake Disaster: Adaptivity capacity] Direct supply to important facilities [29].
| Supply to Important Facilities | Standardized Score [0-1] |
|---|---|
| Large hospical or Mojor infrastructure | 1 |
| Supply to large cities without water tanks | 0.8 |
| Supply to small and medium-sized citizen | 0.6 |
Table A24.
[Earthquake Disaster: Adaptivity capacity] Difficulty level of structural restoration [29].
Table A24.
[Earthquake Disaster: Adaptivity capacity] Difficulty level of structural restoration [29].
| Difficulty Level of Structural Restoration | Description | Standardized Score [0-1] |
|---|---|---|
| High | Re-construction is required, and difficult | 1 |
| Middium | Repair and reinforcement are required | 0.8 |
| Low | Reconstruction and repair measures are economical | 0.6 |
Table A25.
[Flood Disaster: Exposures] Daily maximum precipitation [32].
Table A25.
[Flood Disaster: Exposures] Daily maximum precipitation [32].
| Daily Maximum Precipitation (mm) | Standardized Score [0-1] |
|---|---|
| 103–139 | 1 |
| 140–158 | 0.9 |
| 159–179 | 0.8 |
| 180–198 | 0.7 |
| 199–217 | 0.6 |
| 218–236 | 0.5 |
| 237–253 | 0.4 |
| 254–268 | 0.3 |
| 269–293 | 0.2 |
Table A26.
[Flood Disaster: Exposures] Days with daily precipitation of 80 mm or more [32].
Table A26.
[Flood Disaster: Exposures] Days with daily precipitation of 80 mm or more [32].
| Days with Daily Precipitation of 80 mm or more | Standardized Score [0-1] |
|---|---|
| 0~5 | 1 |
| 6~10 | 0.9 |
| 11~15 | 0.8 |
| 16~20 | 0.7 |
| 21~25 | 0.6 |
| 26~30 | 0.5 |
| 31~35 | 0.4 |
| 36~40 | 0.3 |
| 41~45 | 0.2 |
Table A27.
[Flood Disaster: Exposures] Channel slope [29].
Table A27.
[Flood Disaster: Exposures] Channel slope [29].
| Channel Slope (º) | Standardized Score [0-1] |
|---|---|
| 0~5 | 1 |
| 6~10 | 0.9 |
| 11~15 | 0.8 |
| 16~20 | 0.7 |
| 21~25 | 0.6 |
| 26~30 | 0.5 |
| 31~35 | 0.4 |
| 36~40 | 0.3 |
| 41~90 | 0.2 |
Table A28.
[Flood Disaster: Sensitivity] Degree of urbanization [30].
Table A28.
[Flood Disaster: Sensitivity] Degree of urbanization [30].
| Degree of Urbanization (%) | Standardized Score [0-1] |
|---|---|
| Rate of urban area 80 | 1 |
| Rate of urban area 80 | 1-urban area (m2)/rural area (m2) |
Table A29.
[Flood Disaster: Sensitivity] Disaster damage experience [29].
Table A29.
[Flood Disaster: Sensitivity] Disaster damage experience [29].
| Disaster Damage Experience (Y/N) | Standardized Score [0-1] |
|---|---|
| Y | 1 |
| N | 0.4 |
Table A30.
[Flood Disaster: Sensitivity] Natural Disaster Hazard District [33].
Table A30.
[Flood Disaster: Sensitivity] Natural Disaster Hazard District [33].
| Natural Disaster Hazard District (Y/N) | Standardized Score [0-1] |
|---|---|
| Y | 1 |
| N | 0.4 |
Table A31.
[Flood Disaster: Sensitivity] Distance from the river [33].
Table A31.
[Flood Disaster: Sensitivity] Distance from the river [33].
| Distance from the River | Standardized Score [0-1] |
|---|---|
| ~115 m | 0 |
| ~255 m | 0.25 |
| ~380 m | 0.5 |
| ~567 m | 0.75 |
| 567 m~ | 1 |
Table A32.
[Flood Disaster: Sensitivity] Facility’s altitude [32].
Table A32.
[Flood Disaster: Sensitivity] Facility’s altitude [32].
| Facility’s Altitude (m) | Standardized Score [0-1] |
|---|---|
| 0~5 | 0.1 |
| 6~10 | 0.2 |
| 11~15 | 0.3 |
| 16~20 | 0.4 |
| 21~25 | 0.5 |
| 26~30 | 0.6 |
| 31~50 | 0.7 |
| 51~100 | 0.8 |
| 101~300 | 0.9 |
| 301~800 | 1 |
Table A33.
[Flood Disaster: Sensitivity] Impervious basin area [33].
Table A33.
[Flood Disaster: Sensitivity] Impervious basin area [33].
| Impervious Basin Area (%) | Standardized Score [0-1] |
|---|---|
| ~25 | 1 |
| 25~ | 25/x |
Table A34.
[Flood Disaster: Sensitivity] Soil drainage [33].
Table A34.
[Flood Disaster: Sensitivity] Soil drainage [33].
| Soil Drainage | Standardized Score [0-1] |
|---|---|
| AMC-I | 1 |
| AMC-II | 0.5 |
| AMC-III | 0 |
Table A35.
[Flood Disaster: Adaptivity capacity] Flood prevention facilities (i.e., inflow pumping stations, collecting wells, detention ponds [33].
Table A35.
[Flood Disaster: Adaptivity capacity] Flood prevention facilities (i.e., inflow pumping stations, collecting wells, detention ponds [33].
| Flood Prevention Facilities | Standardized Score [0-1] |
|---|---|
| ALL | 1 |
| 2 | 0.5 |
| 1 | 0.2 |
| 0 | 0 |
Table A36.
[Flood Disaster: Adaptivity capacity] Flood prevention equipment (i.e., emergency shut-off valves, screens, and earth leakage blocking equipment). [33].
Table A36.
[Flood Disaster: Adaptivity capacity] Flood prevention equipment (i.e., emergency shut-off valves, screens, and earth leakage blocking equipment). [33].
| Flood Prevention Equipment | Standardized Score [0-1] |
|---|---|
| ALL | 1 |
| 2 | 0.5 |
| 1 | 0.2 |
| 0 | 0 |
Table A37.
[Flood Disaster: Adaptivity capacity] Emergency preparedness training [31].
Table A37.
[Flood Disaster: Adaptivity capacity] Emergency preparedness training [31].
| Number of Emergency Preparedness Training (per Year) | Standardized Score [0-1] |
|---|---|
| Number of training 5 | 1 |
| 1–4 | 0.5 |
| N | 0 |
Table A38.
[Flood Disaster: Adaptivity capacity] Emergency plans and manuals (documents) [31].
Table A38.
[Flood Disaster: Adaptivity capacity] Emergency plans and manuals (documents) [31].
| Emergency Plans and Manuals | Standardized Score [0-1] |
|---|---|
| ALL | 1 |
| Only manual | 0.75 |
| Only Plan | 0.5 |
| None | 0.25 |
Table A39.
[Flood Disaster: Adaptivity capacity] Status of emergency generator operation [31].
Table A39.
[Flood Disaster: Adaptivity capacity] Status of emergency generator operation [31].
| Status of Emergency Generator Operation (Y/N) | Standardized Score [0-1] |
|---|---|
| Y | 1 |
| N | 0 |
Table A40.
[Flood Disaster: Adaptivity capacity] Recovery time [29].
Table A40.
[Flood Disaster: Adaptivity capacity] Recovery time [29].
| Recovery Time (Days) | Standardized Score [0-1] |
|---|---|
| Recovery time > 10 | 1 |
| 1–10 | 0.8 |
| 1 < Recovery time | 0.6 |
Table A41.
[Flood Disaster: Adaptivity capacity] Existence of alternative facilities [29].
Table A41.
[Flood Disaster: Adaptivity capacity] Existence of alternative facilities [29].
| Alternative Facilities (Y/N) | Standardized Score [0-1] |
|---|---|
| Y | 0.5 |
| N | 01 |
Table A42.
[Flood Disaster: Adaptivity capacity] Secondary disasters [29].
Table A42.
[Flood Disaster: Adaptivity capacity] Secondary disasters [29].
| Probability of Secondary Disasters | Example of Secondary Disasters | Standardized Score [0-1] |
|---|---|---|
| Major | Hospital, Power plants, Labortory etc. | 1 |
| Moderate | Emergency water shortage for the lack of water supply | 0.8 |
| Minor | Water shortage for the lack of water supply | 0.6 |
Table A43.
[Flood Disaster: Adaptivity capacity] Direct supply to important facilities [29].
Table A43.
[Flood Disaster: Adaptivity capacity] Direct supply to important facilities [29].
| Supply to Important Facilities | Standardized Score [0-1] |
|---|---|
| Large hospical or Mojor infrastructure | 1 |
| Supply to large cities without water tanks | 0.8 |
| Supply to small and medium-sized citizen | 0.6 |
Table A44.
[Flood Disaster: Adaptivity capacity] Difficulty level of structural restoration [29].
Table A44.
[Flood Disaster: Adaptivity capacity] Difficulty level of structural restoration [29].
| Difficulty Level of Structural Restoration | Description | Standardized Score [0-1] |
|---|---|---|
| High | Re-construction is required, and difficult | 1 |
| Middium | Repair and reinforcement are required | 0.8 |
| Low | Reconstruction and repair measures are economical | 0.6 |
References
- Park, H.N.; Song, J.M. Empirical study on environmental justice through correlation analysis of the flood vulnerability indicator and the ratio of the poor population. J. Korea Plan. Assoc. 2014, 49, 169–186. [Google Scholar] [CrossRef]
- Han, W.S.; Sim, O.B.; Lee, B.J.; Yoo, J.H. The proposal of evaluation method for Local Government infrastructure vulnerability relating to climate change driven flood. Clim. Change Res. 2012, 3, 25–37. [Google Scholar]
- Son, M.W.; Sung, J.Y.; Chung, E.S.; Jun, K.S. Development of flood vulnerability index considering climate change. J. Korea Water Resour. Assoc. 2011, 44, 231–248. [Google Scholar] [CrossRef]
- Hwang, N.H.; Park, H.S.; Chung, G.H. Flood vulnerability analysis in Seoul, Korea. J. Korea Water Resour. Assoc. 2019, 52, 729–742. [Google Scholar] [CrossRef]
- Report on the 9.12 Earthquake and Countermeasures, Seoul, Korea; Ministry of Public Safety and Security (MPSS): Seoul, Republic of Korea, 2017. (In Korean)
- Nazari, R.; Vasiliadis, H.; Karimi, M.; Fahad, M.G.R.; Simon, S.; Zhang, T.; Sun, Q.; Peters, R. Hydrodynamic study of the impact of extreme flooding events on wastewater treatment plants considering total water level. Nat. Hazards Rev. 2022, 23, 04021056. [Google Scholar] [CrossRef]
- Karamouz, M.; Olyaei, M.A. A quantitative and qualitative framework for reliability assessment of waste water treatment plants under coastal flooding. Int. J. Environ. Res. 2019, 13, 21–33. [Google Scholar] [CrossRef]
- Frankel, A.D.; Petersen, M.D.; Mueller, C.S.; Haller, K.M.; Wheeler, R.L.; Leyendecker, E.; Wesson, R.L.; Harmsen, S.C.; Cramer, C.H.; Perkins, D.M. Documentation for the 2002 Update of the National Seismic Hazard Maps; Open-File Report, No. 33; US Geological Survey: Richmond, VA, USA, 2002; Volume 420, p. 2.
- Petersen, M.; Moschetti, M.; Powers, P.; Mueller, C.; Haller, K.; Frankel, A.; Zeng, Y.; Rezaeian, S.; Harmsen, S.; Boyd, O. Documentation for the 2014 Update of the National Seismic Hazard Maps; Open-File Report; US Geological Survey: Richmond, VA, USA, 2014; Volume 1091, 243p.
- Kyung, J.B.; Kim, M.J.; Lee, S.J.; Kim, J.K. An analysis of probabilistic seismic hazard in the Korean Peninsula. J. Korean Earth Sci. Soc. 2016, 37, 52–61. [Google Scholar] [CrossRef]
- Song, Z.; Liu, W.; Shu, S. Resilience-based post-earthquake recovery optimization of water distribution networks. Int. J. Disaster Risk Reduct. 2022, 74, 102934. [Google Scholar] [CrossRef]
- Lim, B.; Huq, S.; Malone, E. Adaptation Policy Frameworks for Climate Change: Developing Strategies, Policies, and Measures; Cambridge University Press: Cambridge, UK, 2005. [Google Scholar]
- Timmermann, P. Vulnerability, resilience and the collapse of society, No. 1. In Environmental Monograph; Institute for Environmental Studies, University of Toronto: Toronto, ON, Canada, 1981; pp. 1–42. [Google Scholar]
- Kelly, P.M.; Adger, W.N. Theory and practice in assessing vulnerability to climate change and facilitating adaptation. Clim. Change 2000, 47, 325–352. [Google Scholar] [CrossRef]
- IPCC. The Science of Climate Change; Houghton, J.T., Meira Filho, L.G., Callander, B.A., Harris, N., Kattenberg, A., Maskell, K., Eds.; Cambridge University Press: Cambridge, UK, 1996.
- McCarthy, J.J.; Canziani, O.F.; Leary, N.A.; Dokken, D.J.; White, K.S. Climate Change 2001: Impacts, Adaptation and Vulnerability; Third Assessment Report; McCarthy, J.J., Ed.; Cambridge University Press: Cambridge, UK, 2001; Volume 18, pp. 33–42. [Google Scholar]
- Moss, R.H.; Brenkert, A.L.; Malone, E.L. Vulnerability to Climate Change: A Quantitative Approach Prepared for the US Department of Energy; U.S. Department of Energy: Washington, DC, USA, 2001. [Google Scholar]
- Saaty, T.L. Fundamentals of Decision Making and Priority Theory with the Analytic Hierarchy Process; RWS Publications: Pittsburgh, PA, USA, 2000; p. 478. [Google Scholar]
- Shannon, C.E.; Weaver, W. The Mathematical Theory of Information; University of Illinois Press: Urbana, OH, USA, 1949; p. 117. [Google Scholar]
- Panahi, M.; Rezaie, F.; Meshkani, S. Seismic vulnerability assessment of school buildings in Tehran city based on AHP and GIS. Nat. Hazards Earth Syst. Sci. 2014, 14, 969–979. [Google Scholar] [CrossRef]
- Oke, T.R. Initial Guidance to Obtain Representative Meteorological Observations at Urban Sites; Instruments and Observing Methods Rep. 81, WMO/TD 1250; World Meteorological Organization: Geneva, Switzerland, 2006; 51p. [Google Scholar]
- Kim, H.S.; Song, Y.I.; Kim, E.J.; Lim, Y.S. A Study on Environmental Assessment and Sustainable Development Indicator Linkage Management Plan; Korea Environment Institute: Sejong, Republic of Korea, 2007; pp. 1–210. [Google Scholar]
- Aall, C. The Concept of Indicators. In a Seminar within the EU Project Capacity Building to Enable the in Corporation of Urban Sustainability Parameters in Spatial Urban Development and Planning Policy Practices through the Use of Indicators; European Urban Initiative: Nicosia, Cyprus, 2005; pp. 8–9. [Google Scholar]
- Nardo, M.; Saisana, M.; Saltelli, A.; Taranta, S. Tools for Composite Indicators Building, European Communities. Eur. Com. Ispra 2005, 15, 19–20. [Google Scholar]
- Park, H.S.; Kim, J.B.; Um, M.J.; Kim, Y.J. Assessment of water use vulnerability in the unit watersheds using TOPSIS approach with subjective and objective weights. J. Korean Water Res. Assoc. 2016, 49, 685–692. [Google Scholar] [CrossRef]
- Rezaie, F.; Panahi, M. GIS modeling of seismic vulnerability of residential fabrics considering geotechnical, structural, social and physical distance indicators in Tehran using multi-criteria decision-making techniques. Nat. Hazards Earth Syst. Sci. 2015, 15, 461–474. [Google Scholar] [CrossRef]
- Lee, K.S.; Kim, T.H.; Kang, H.G.; Jung, J.K. A study on selection of the risk factors for urban disaster of Daejeon metropolitan city using Delphi and AHP. J. Saf. Crisis Manag. 2015, 11, 69–84. [Google Scholar]
- Jee, D.H.; Kang, K.J. A method for optimal material selection aided with decision making theory. Mater. Des. 2000, 21, 199–206. [Google Scholar] [CrossRef]
- The National Law Information Center. Special Act on the Safety Control and Maintenance of Establishments. 2021. Available online: http://www.law.go.kr/LSW/eng/engMain.do (accessed on 19 June 2023).
- KOSIS KOrean Statistical Information Service. Current Status of Urban Population. Available online: https://kosis.kr/eng/ (accessed on 19 June 2023).
- Lee, S.H.; Kang, J.E.; Bae, H.J.; Yoon, D.K. Vulnerability assessment of the air pollution using entropy weights: Focused on ozone. J. Korean Assoc. Reg. Geogr. 2015, 21, 751–763. [Google Scholar]
- Kang, J.E.; Lee, M.J. Assessment of flood vulnerability to climate change using fuzzy model and GIS in Seoul. J. Korean Assoc. Geogr. Inf. Stud. 2012, 15, 119–136. [Google Scholar] [CrossRef]
- Kim, S.J.; Suh, K.; Kim, S.M.; Lee, K.D.; Jang, M.W. Mapping of inundation vulnerability using geomorphic characteristics of flood-damaged farmlands-a case study of Jinju City. J. Korean Soc. Rural. Plan. 2013, 19, 51–59. [Google Scholar] [CrossRef]
Disclaimer/Publisher’s Note: The statements, opinions and data contained in all publications are solely those of the individual author(s) and contributor(s) and not of MDPI and/or the editor(s). MDPI and/or the editor(s) disclaim responsibility for any injury to people or property resulting from any ideas, methods, instructions or products referred to in the content. |
© 2023 by the authors. Licensee MDPI, Basel, Switzerland. This article is an open access article distributed under the terms and conditions of the Creative Commons Attribution (CC BY) license (https://creativecommons.org/licenses/by/4.0/).