


“Future Compass”, a Tool That Allows Us to See the Right Horizon—Integration of Topic Modeling and Multiple-Factor Analysis


Abstract
1. Introduction
2. Materials and Methods
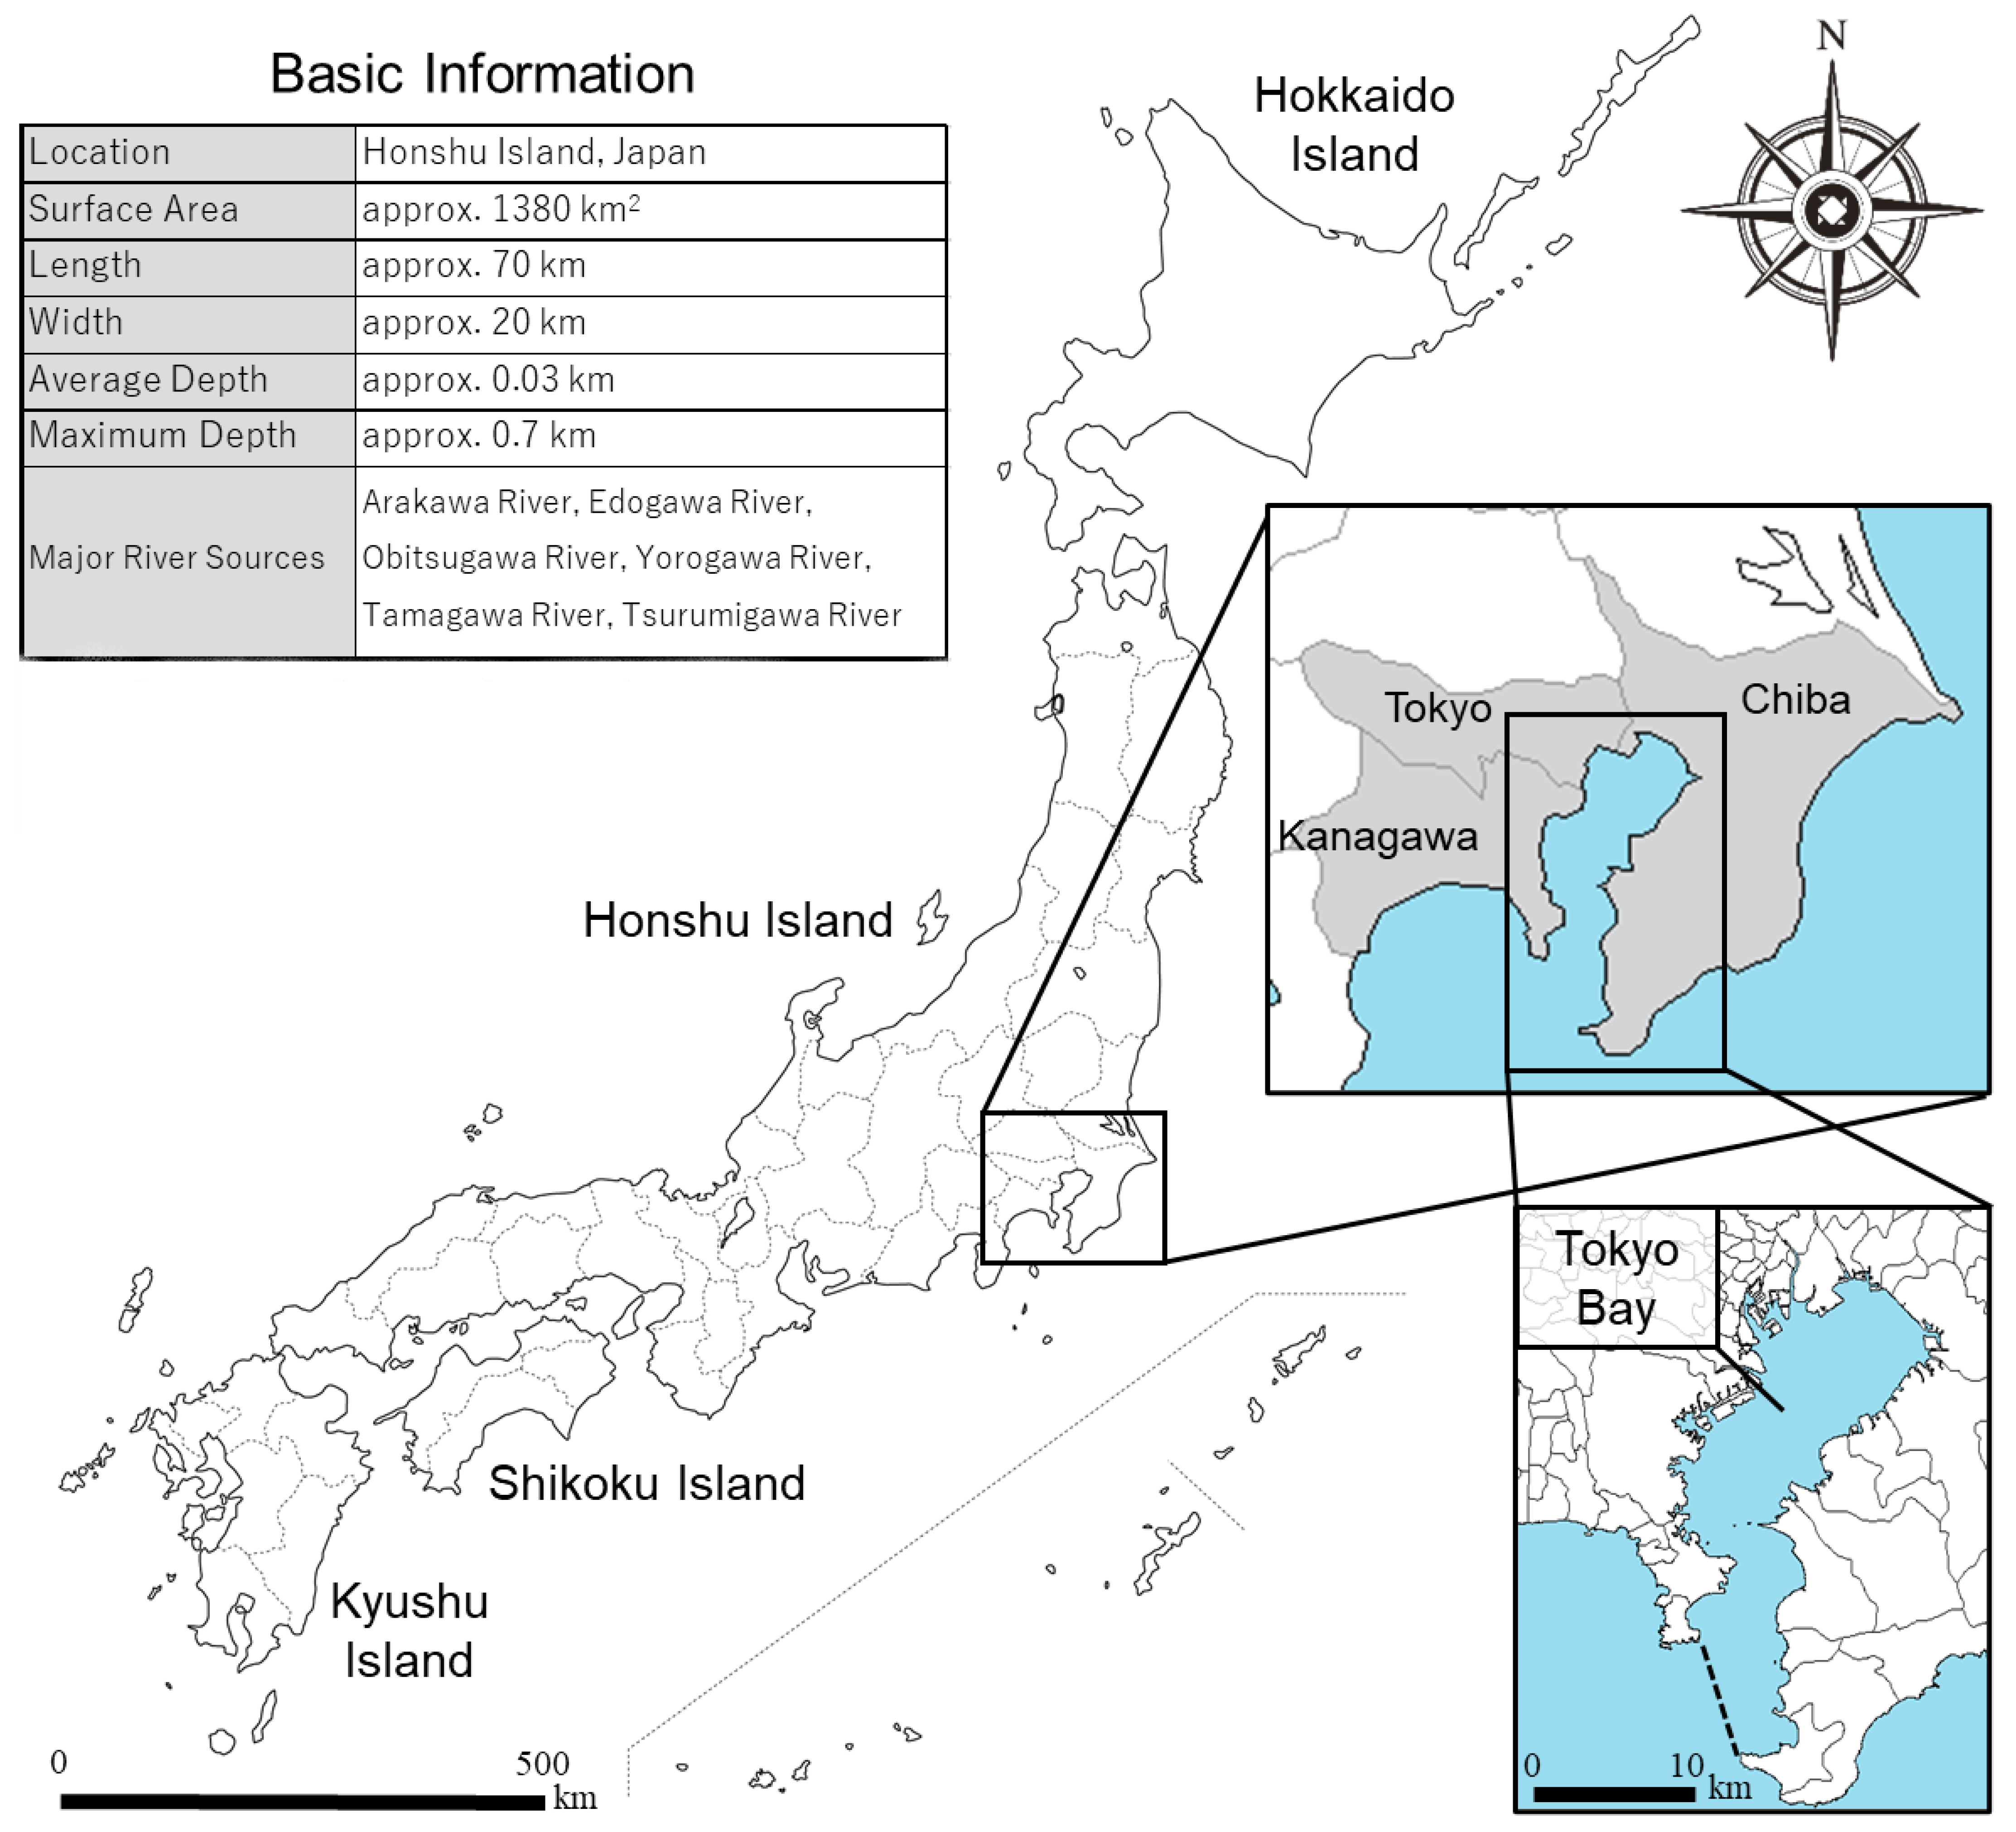
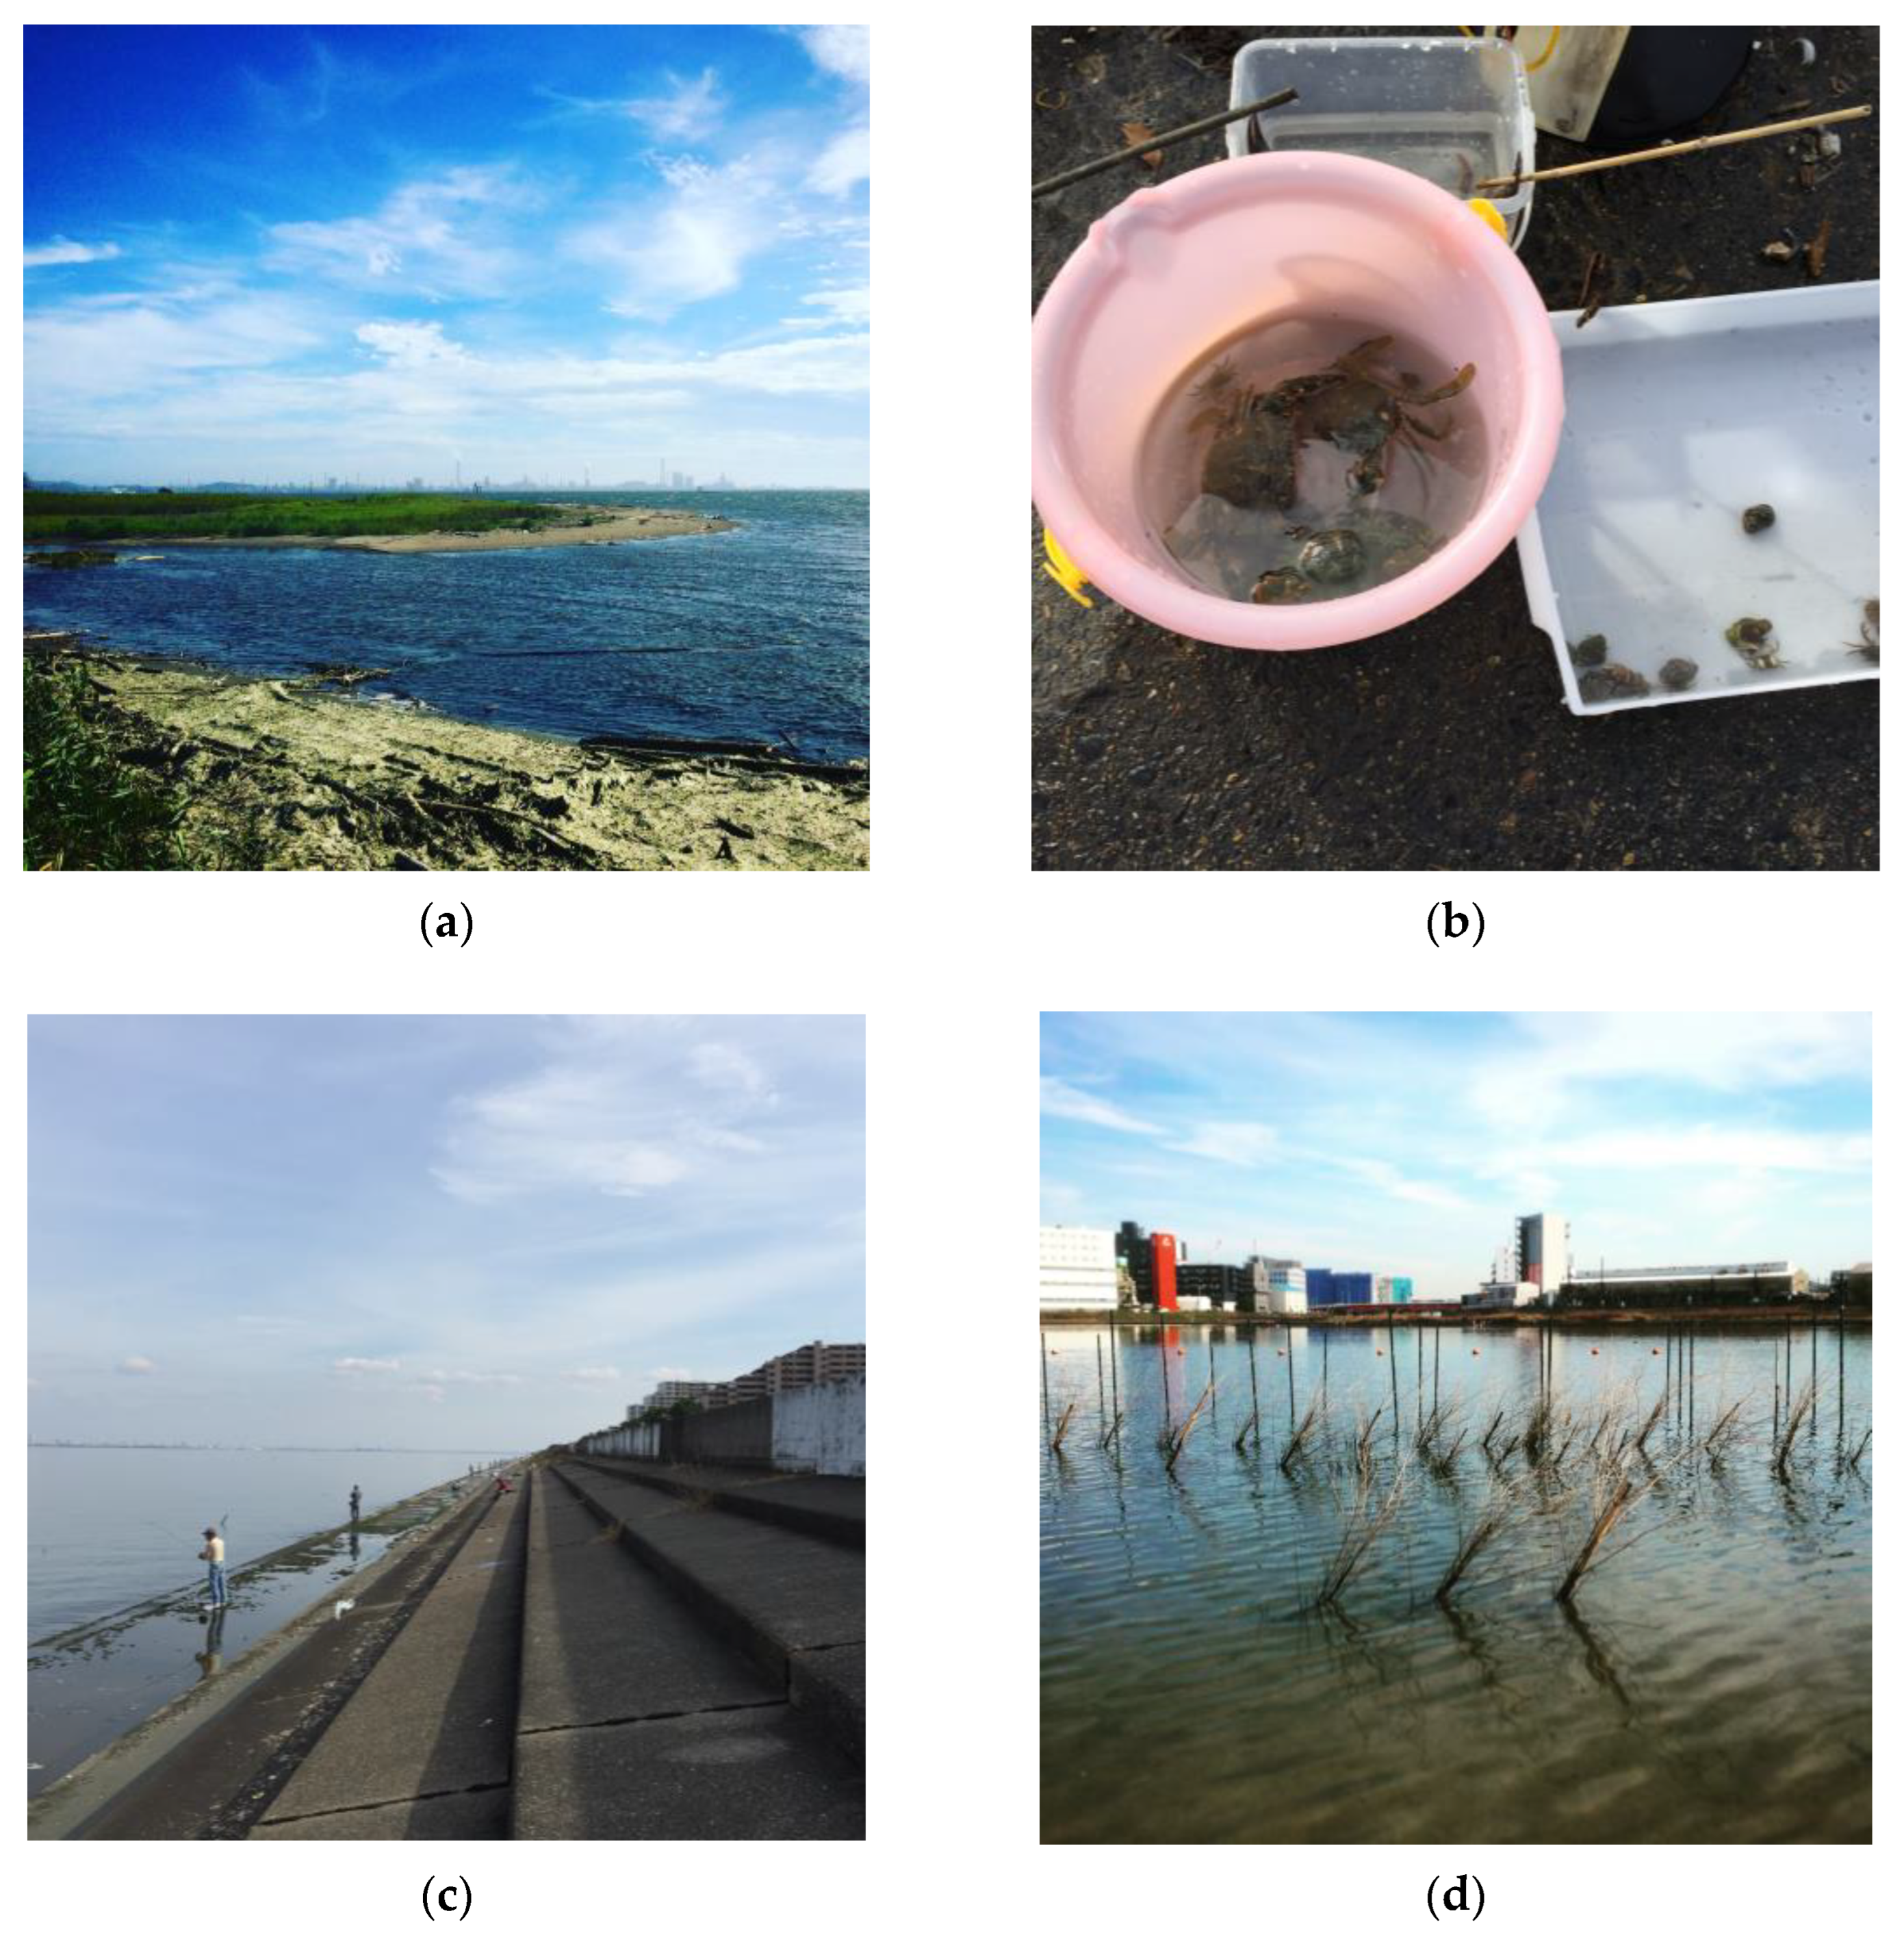
2.1. Study Target
2.2. Data Acquisition
2.3. Data Analysis
2.3.1. Pre-Analysis Distribution Check and Data Cleaning
2.3.2. Preparation of Annotation Data and Biterm List Creation
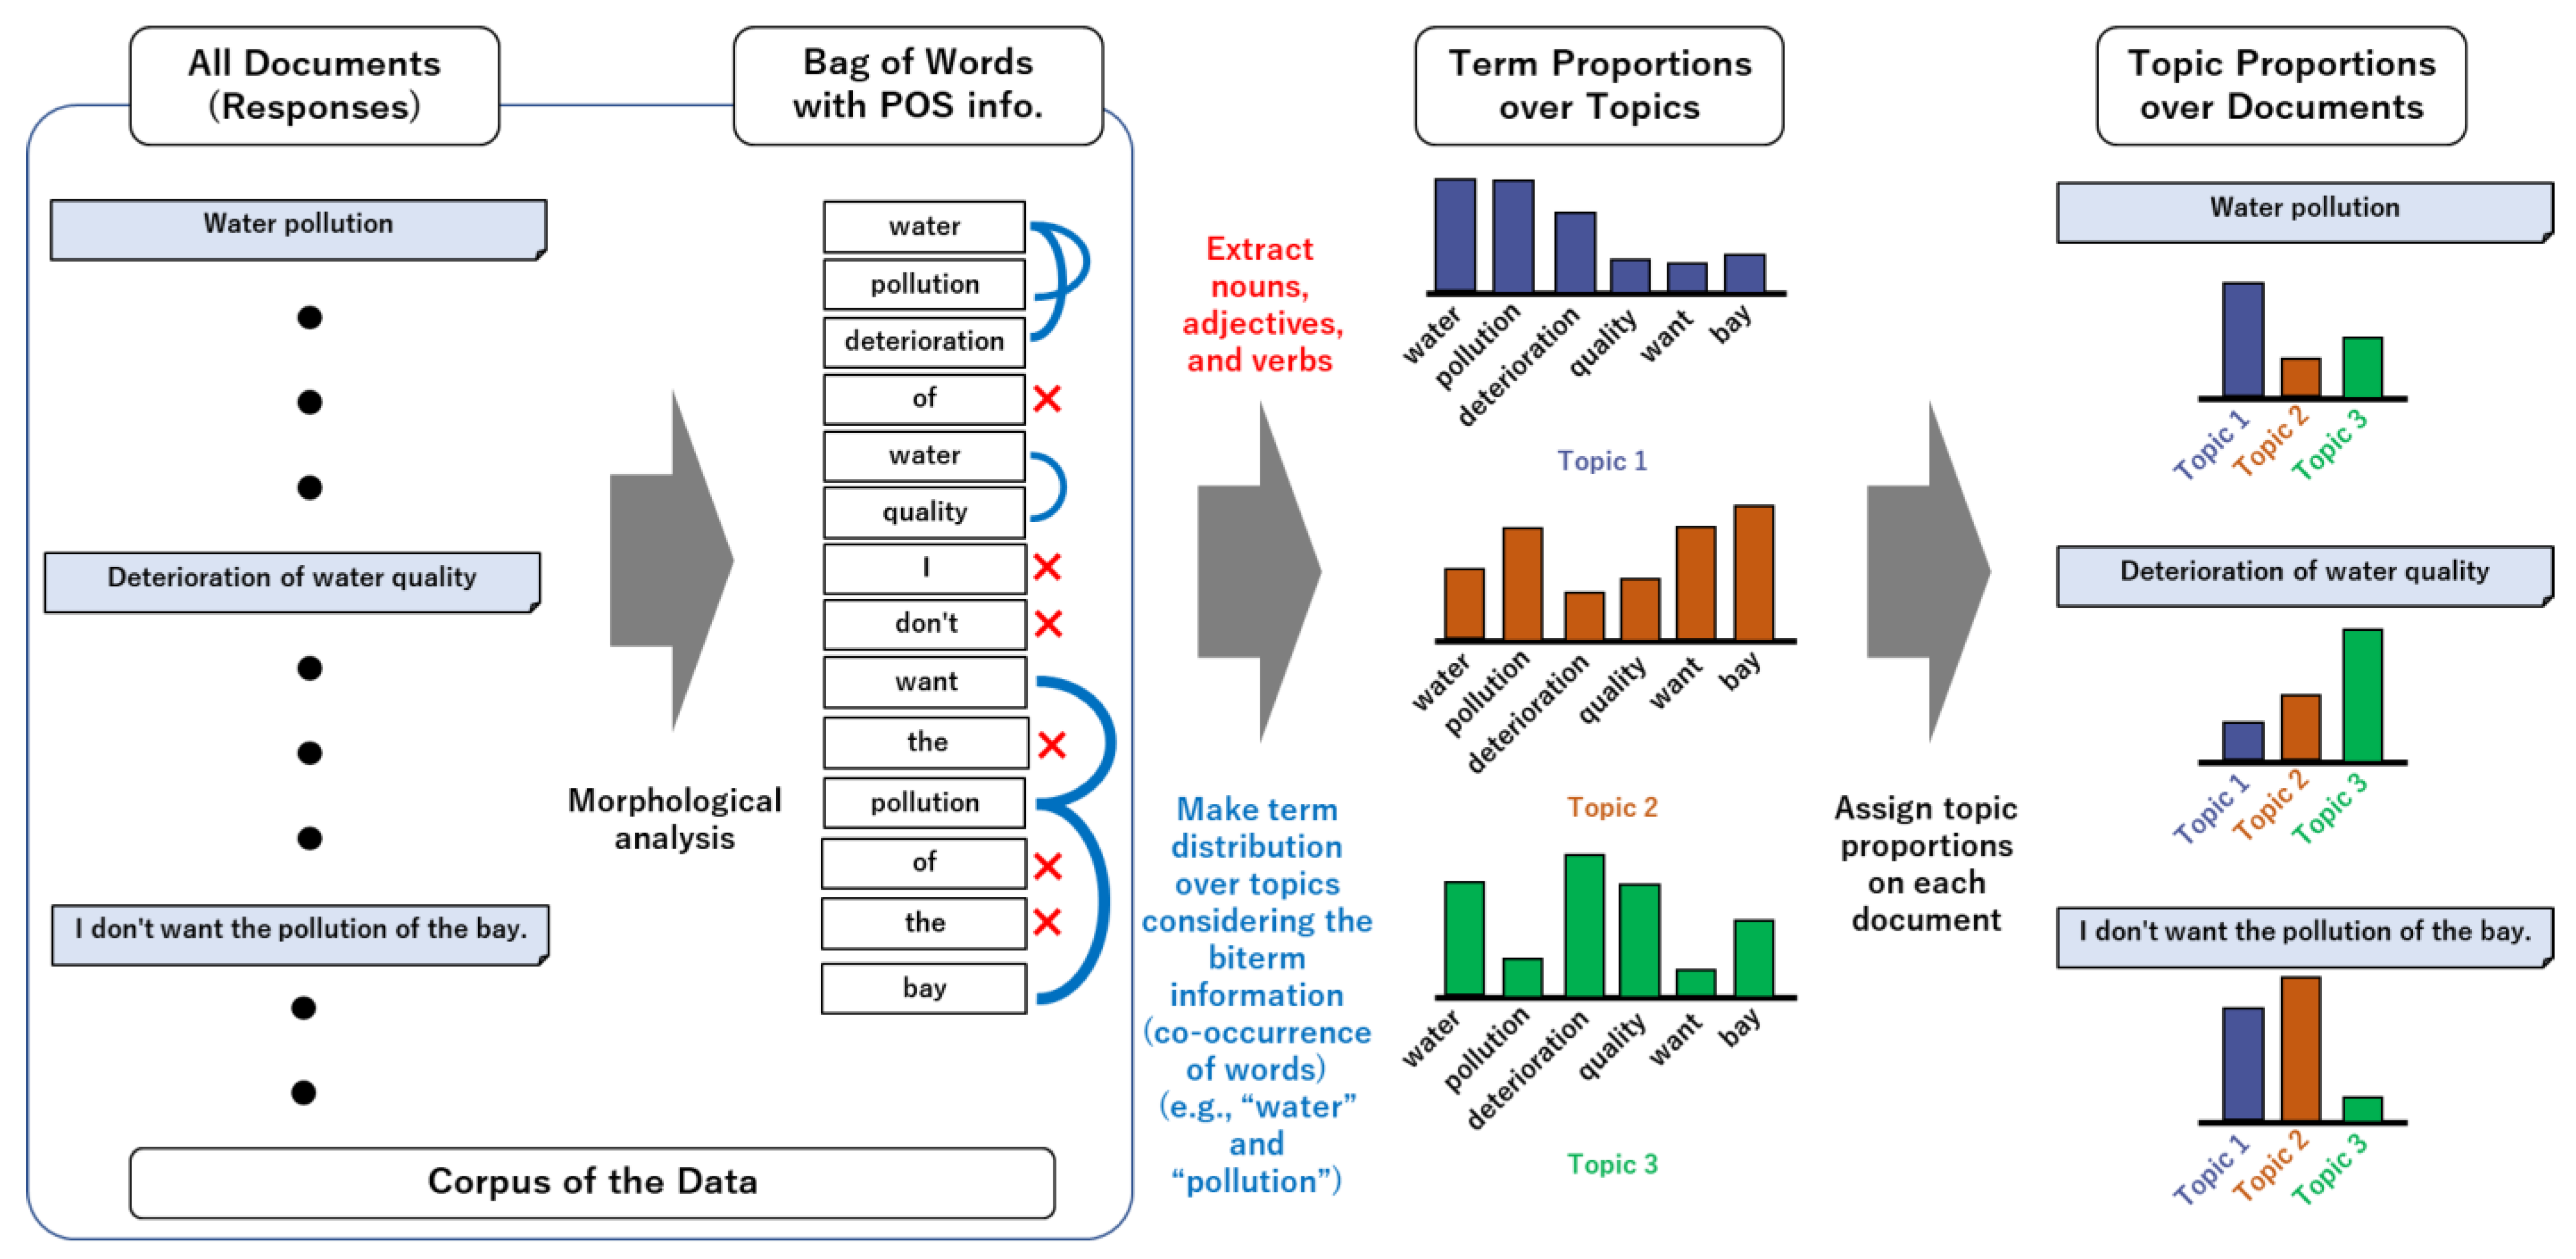
2.3.3. Biterm Topic Models (BTMs) Creation
2.3.4. Multiple-Factor Analysis (MFA) on Topics
3. Results
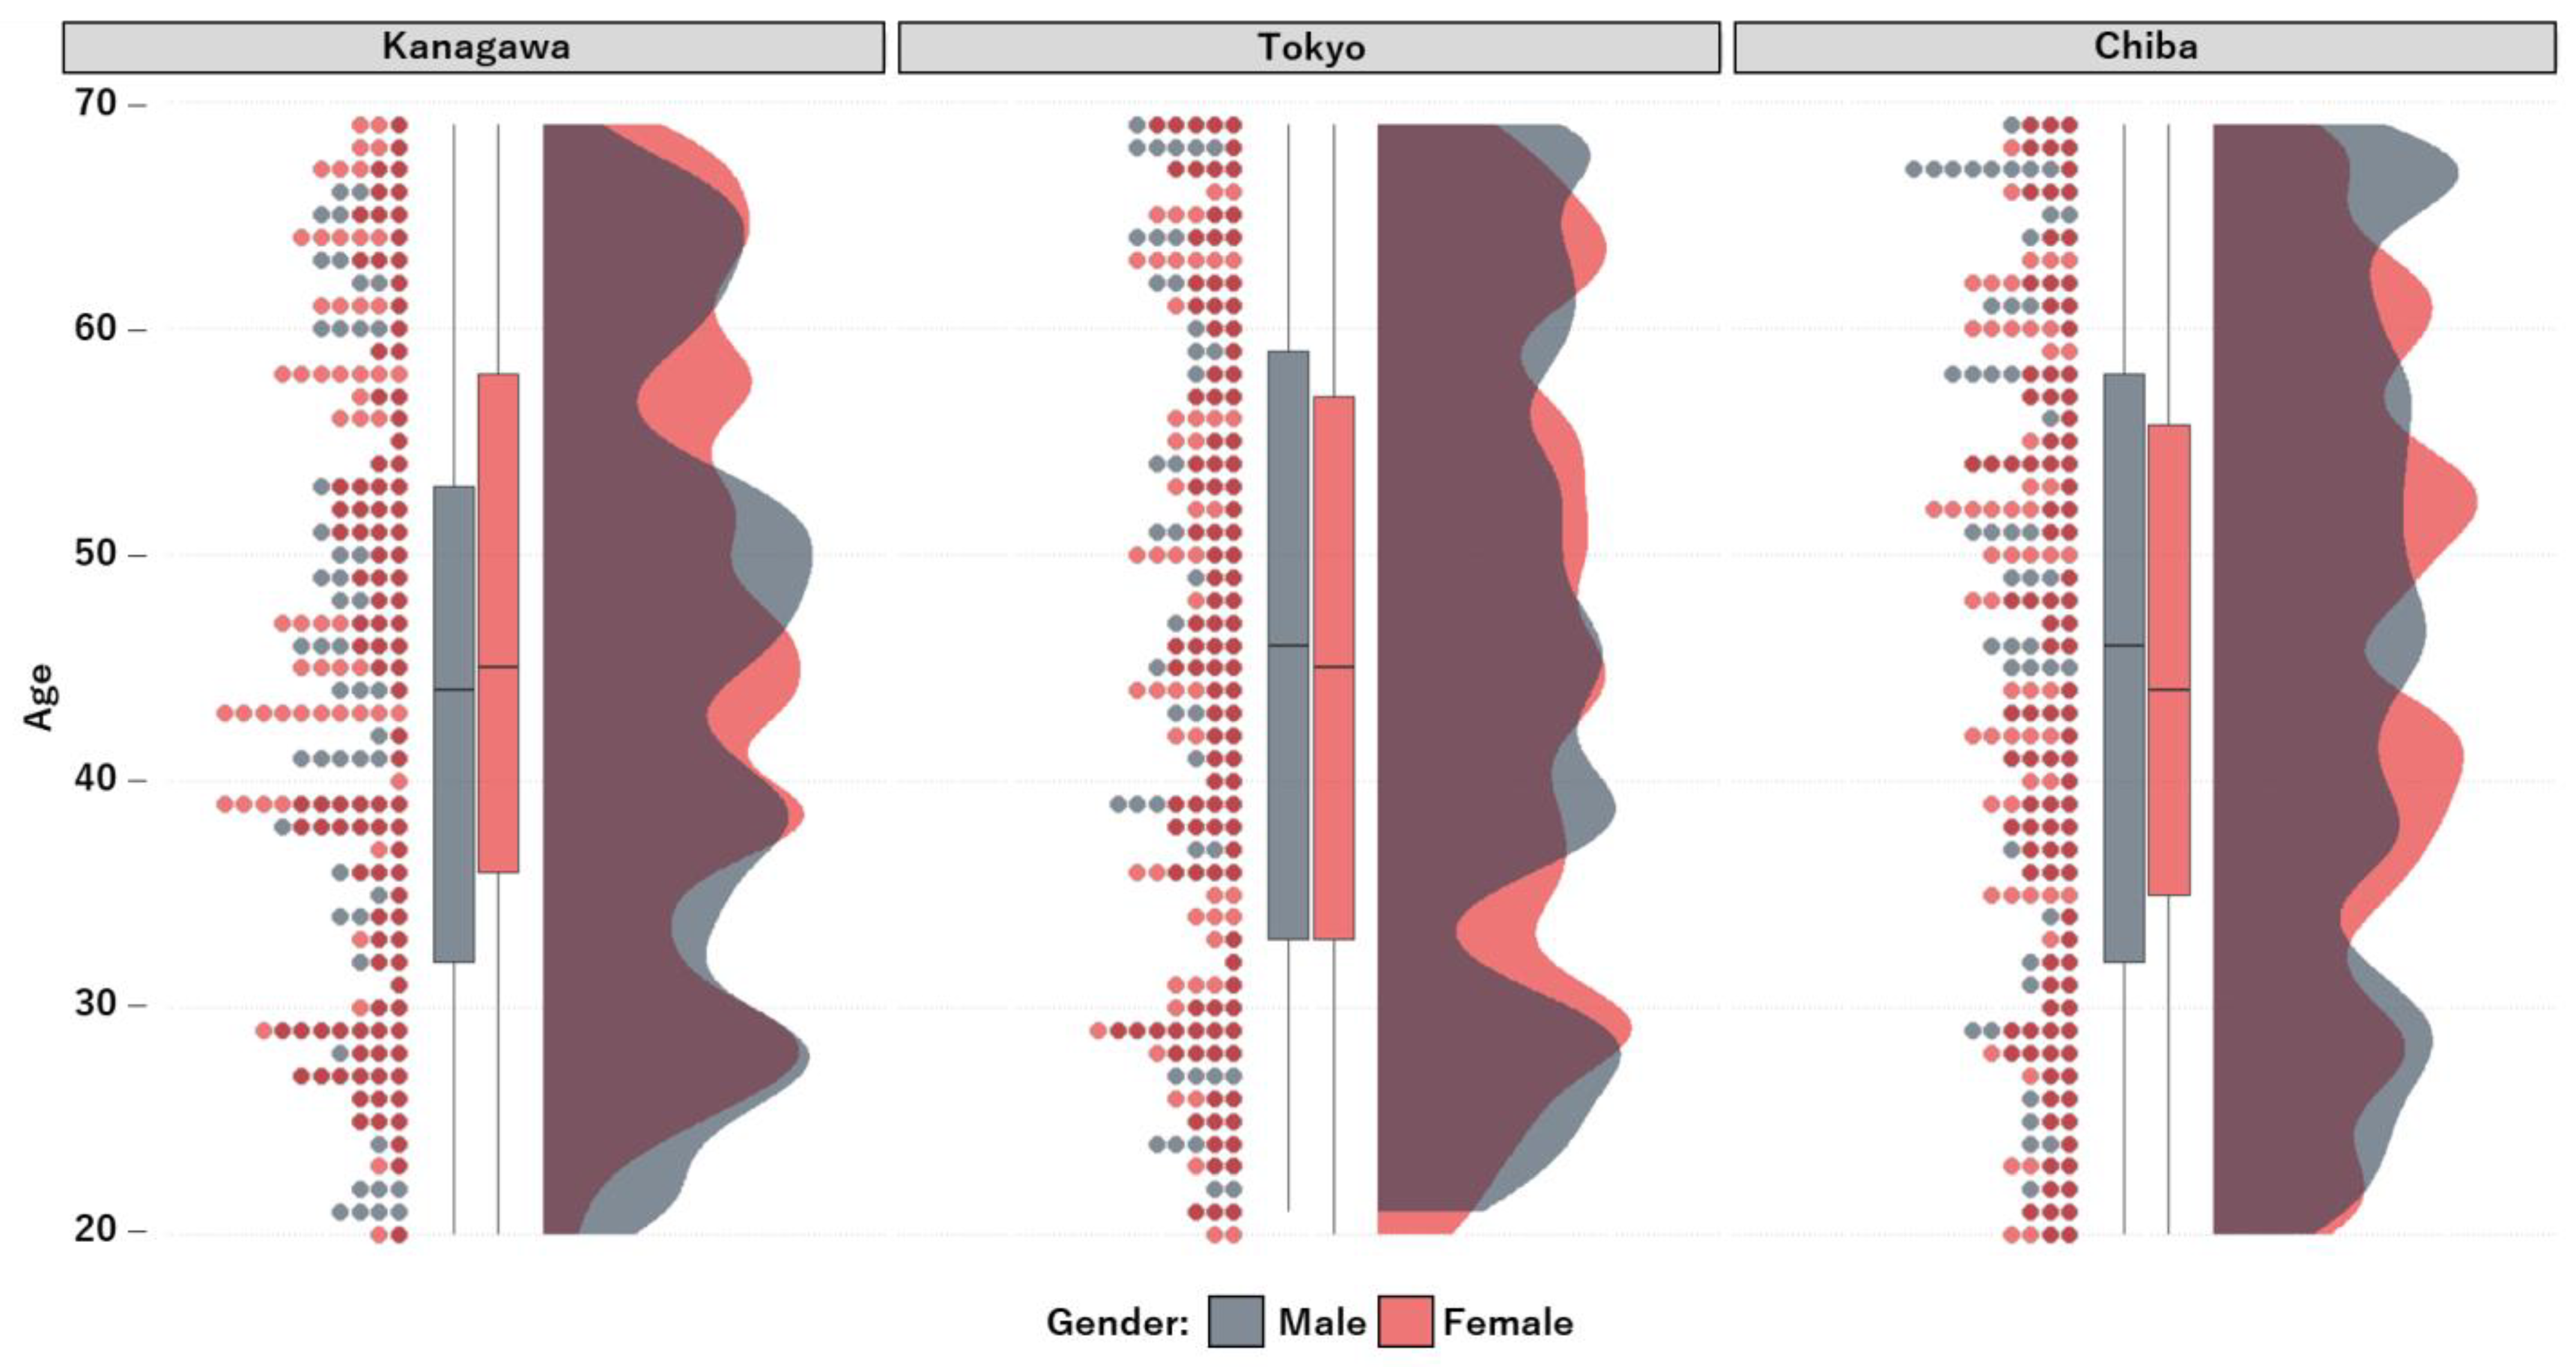
3.1. Pre-Analysis Distribution Check and Data Cleaning
3.2. Extracting Topics of Future Visions by Biterm Topic Models (BTMs)
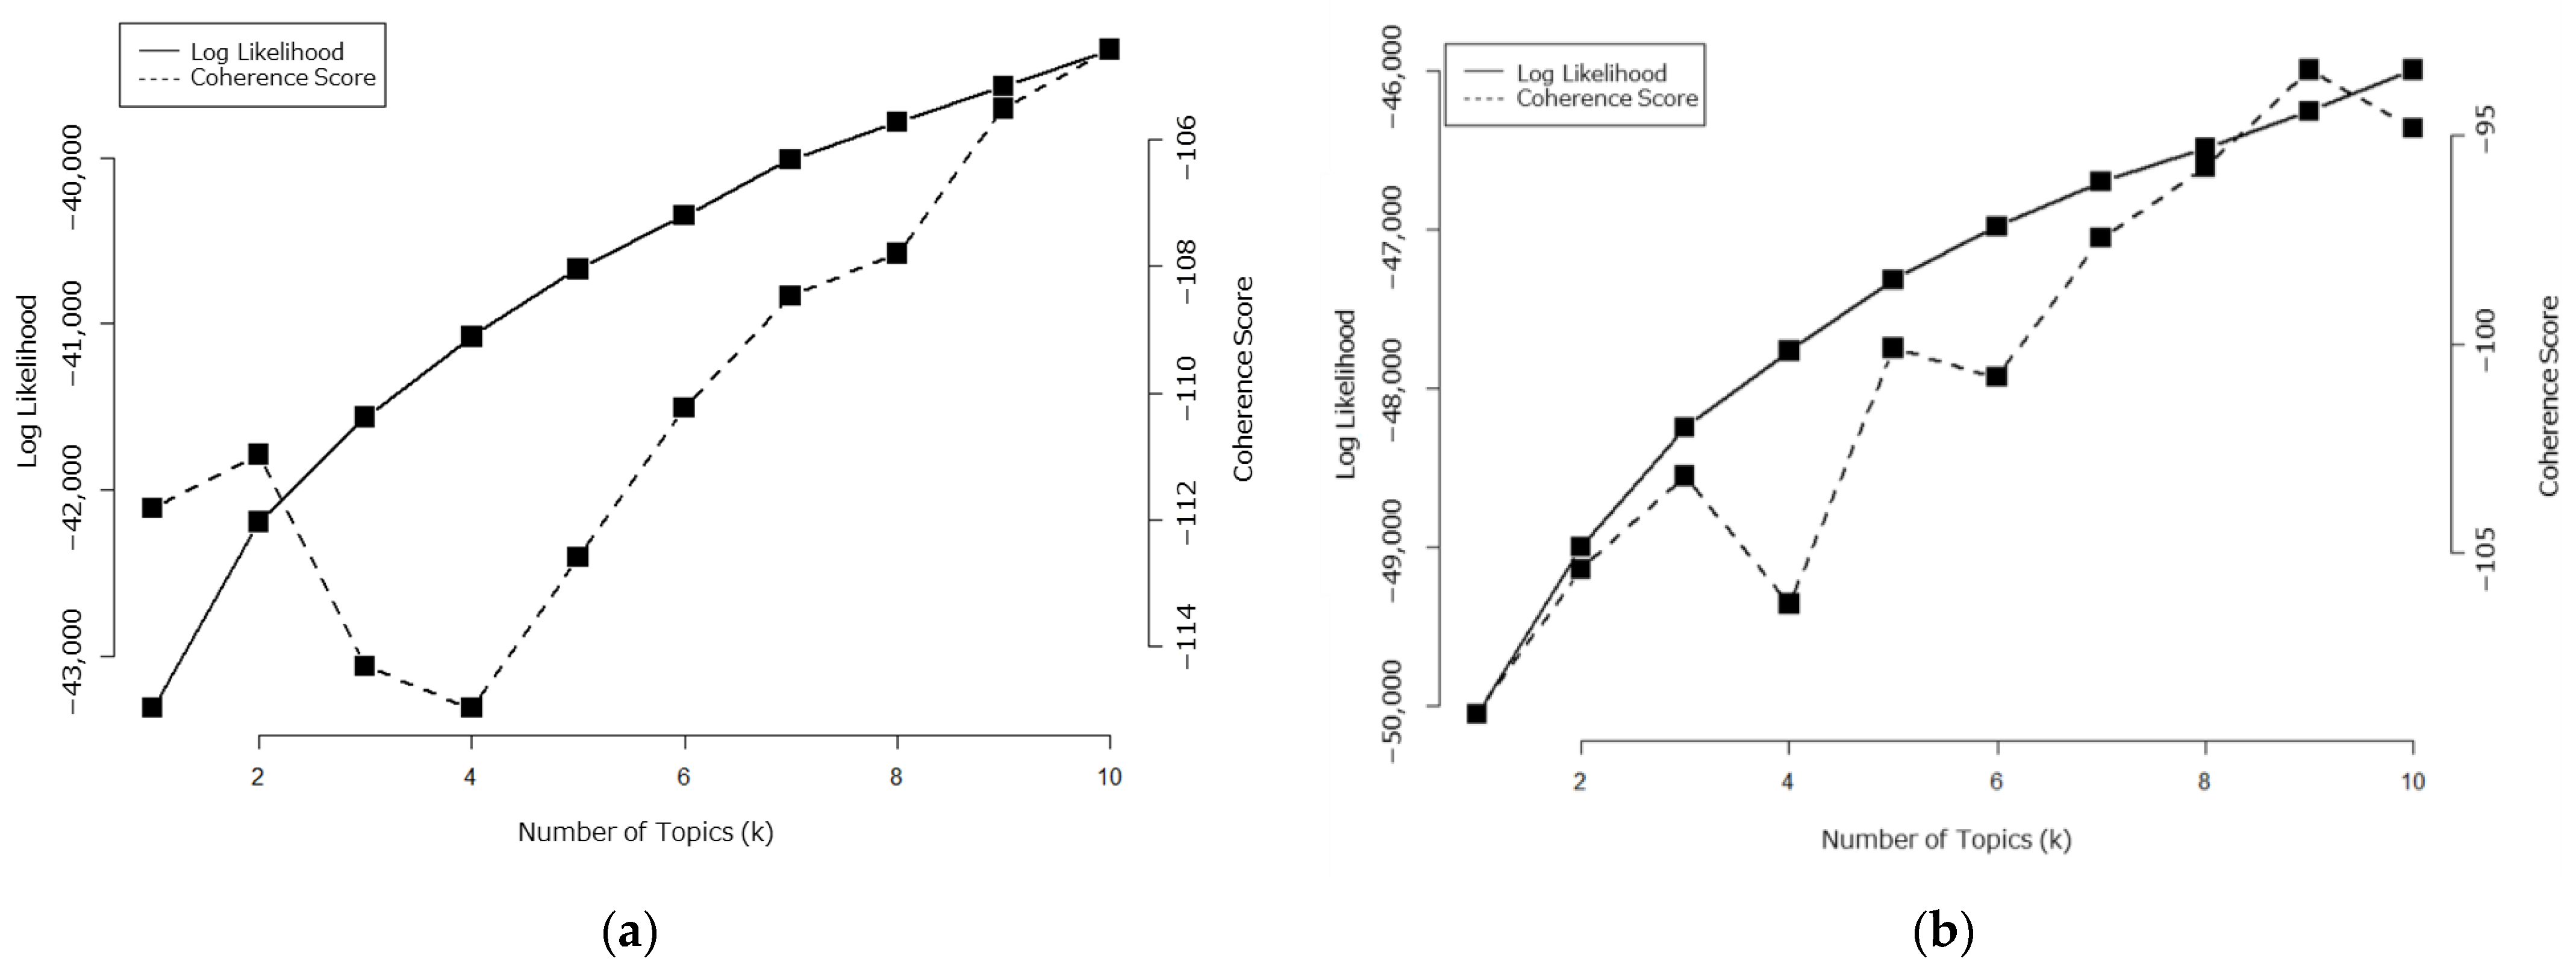
3.2.1. Number of Topics Determined
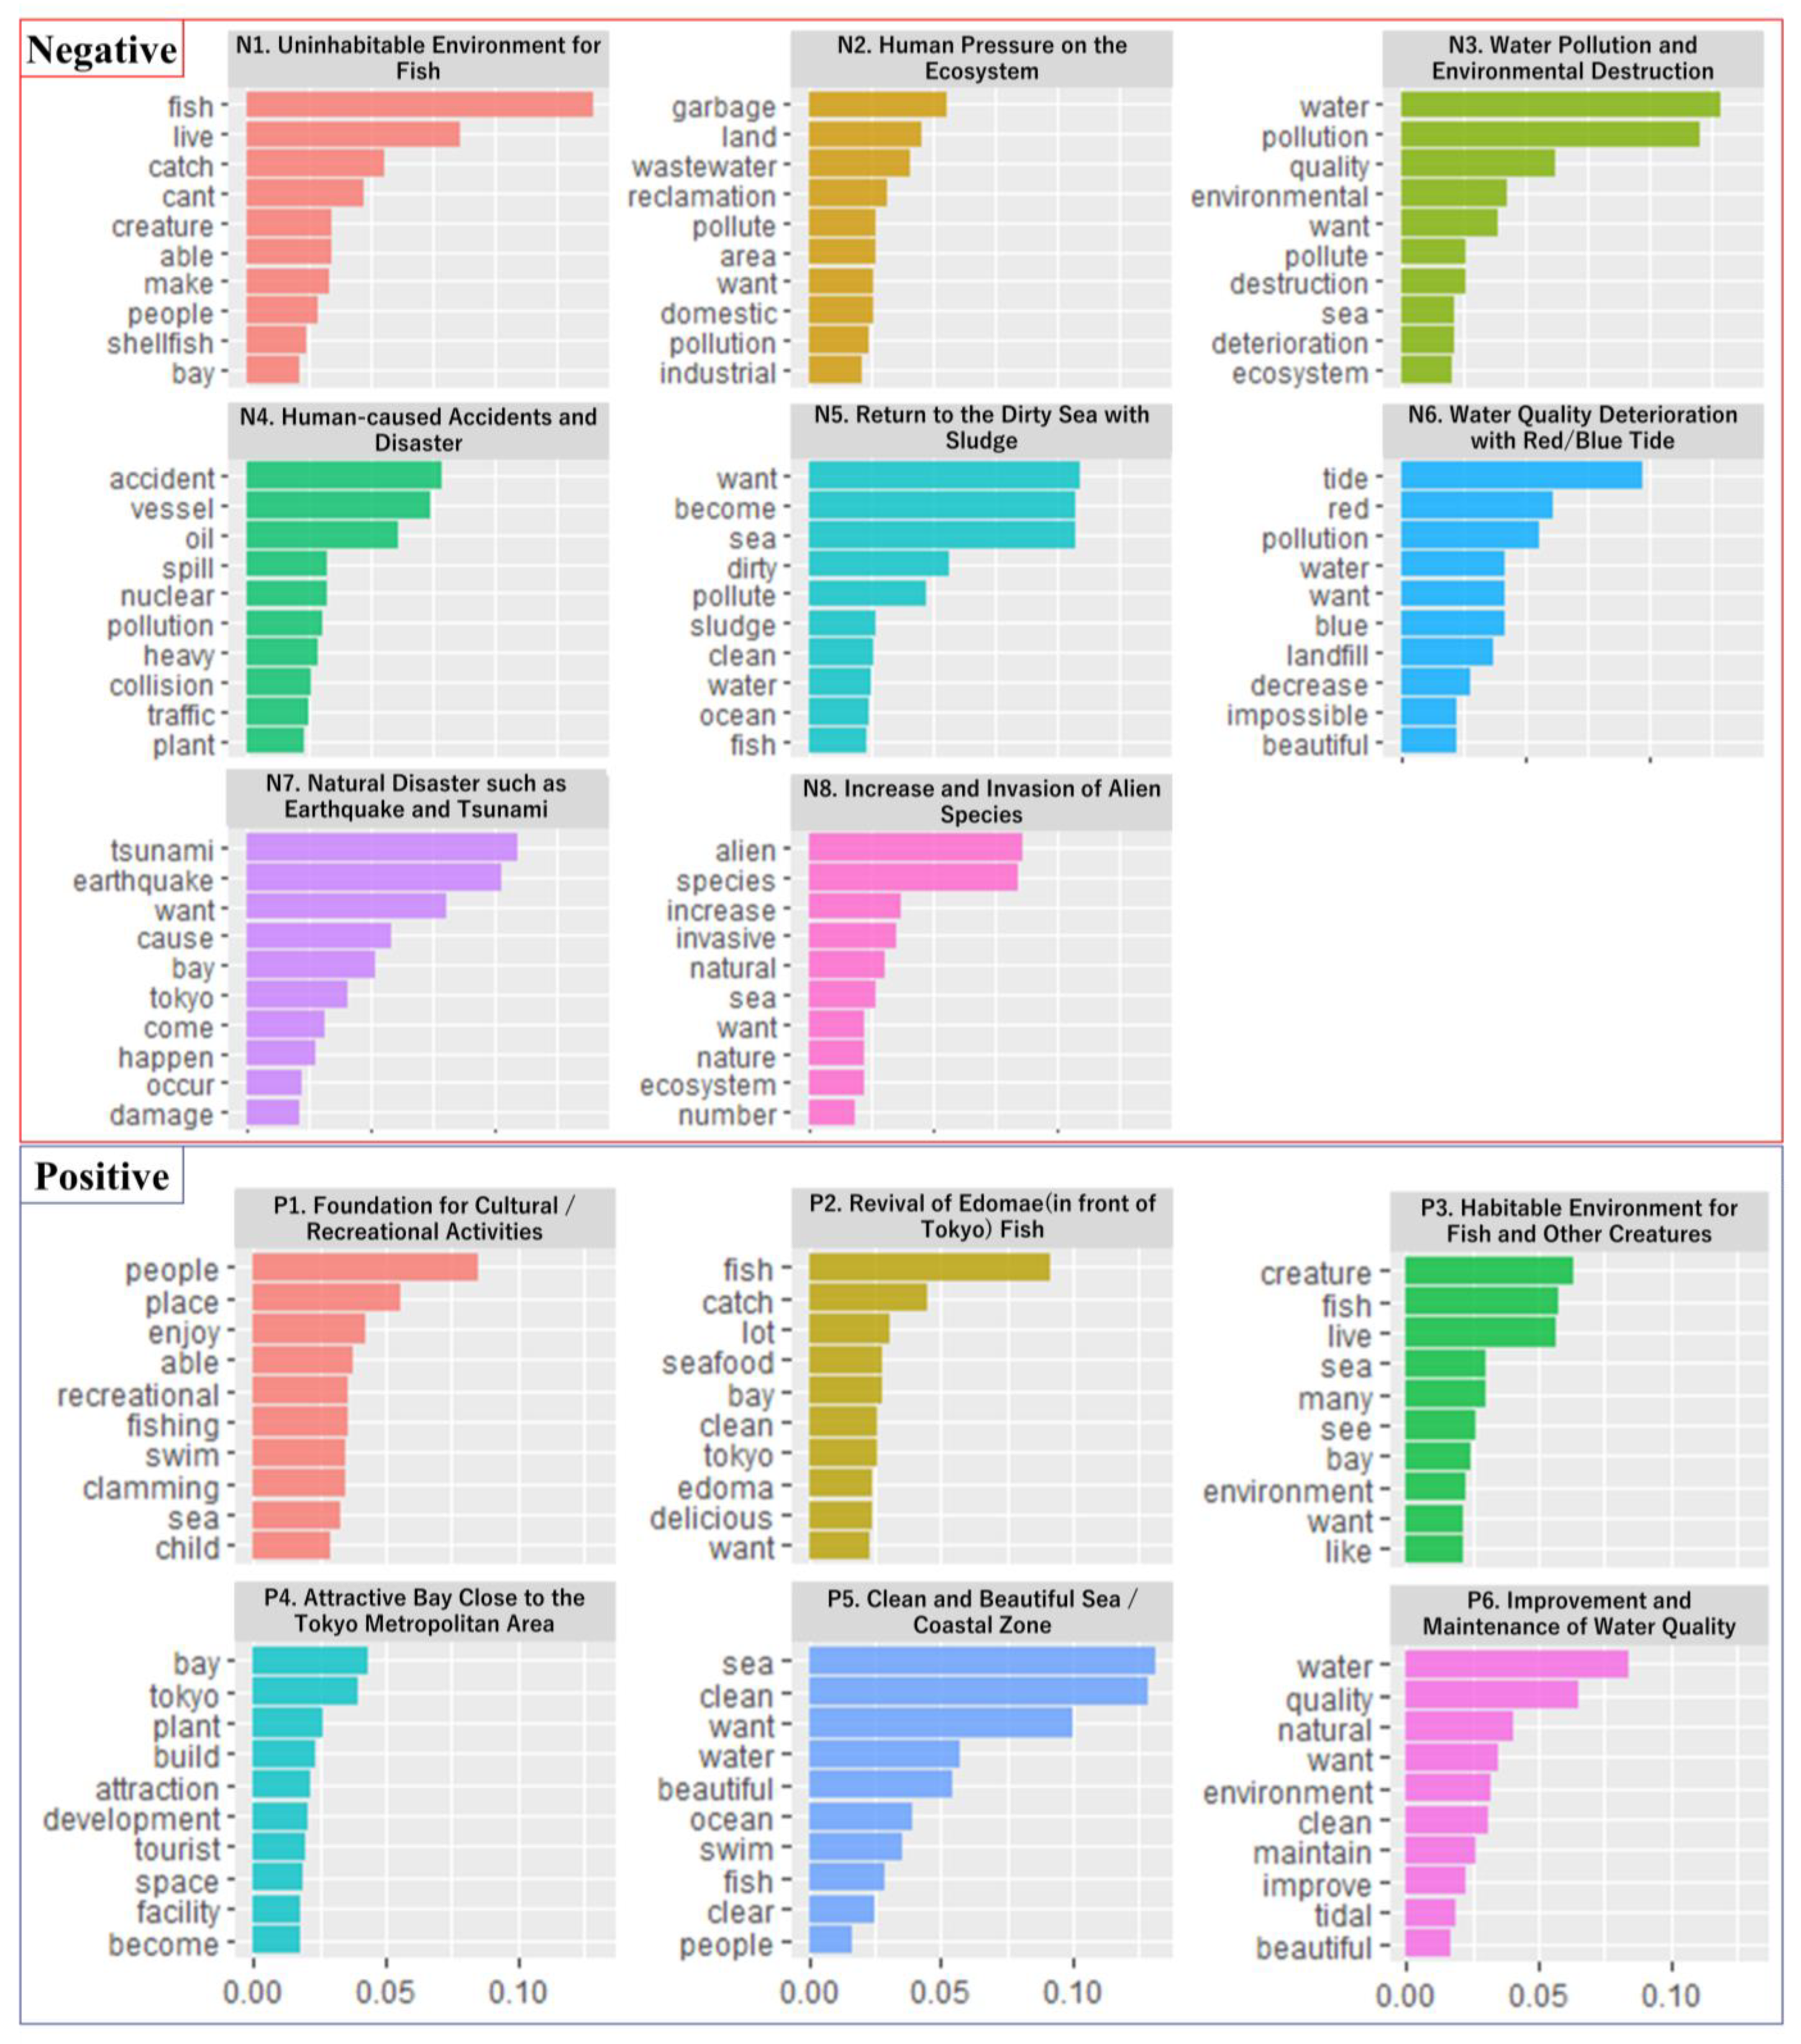
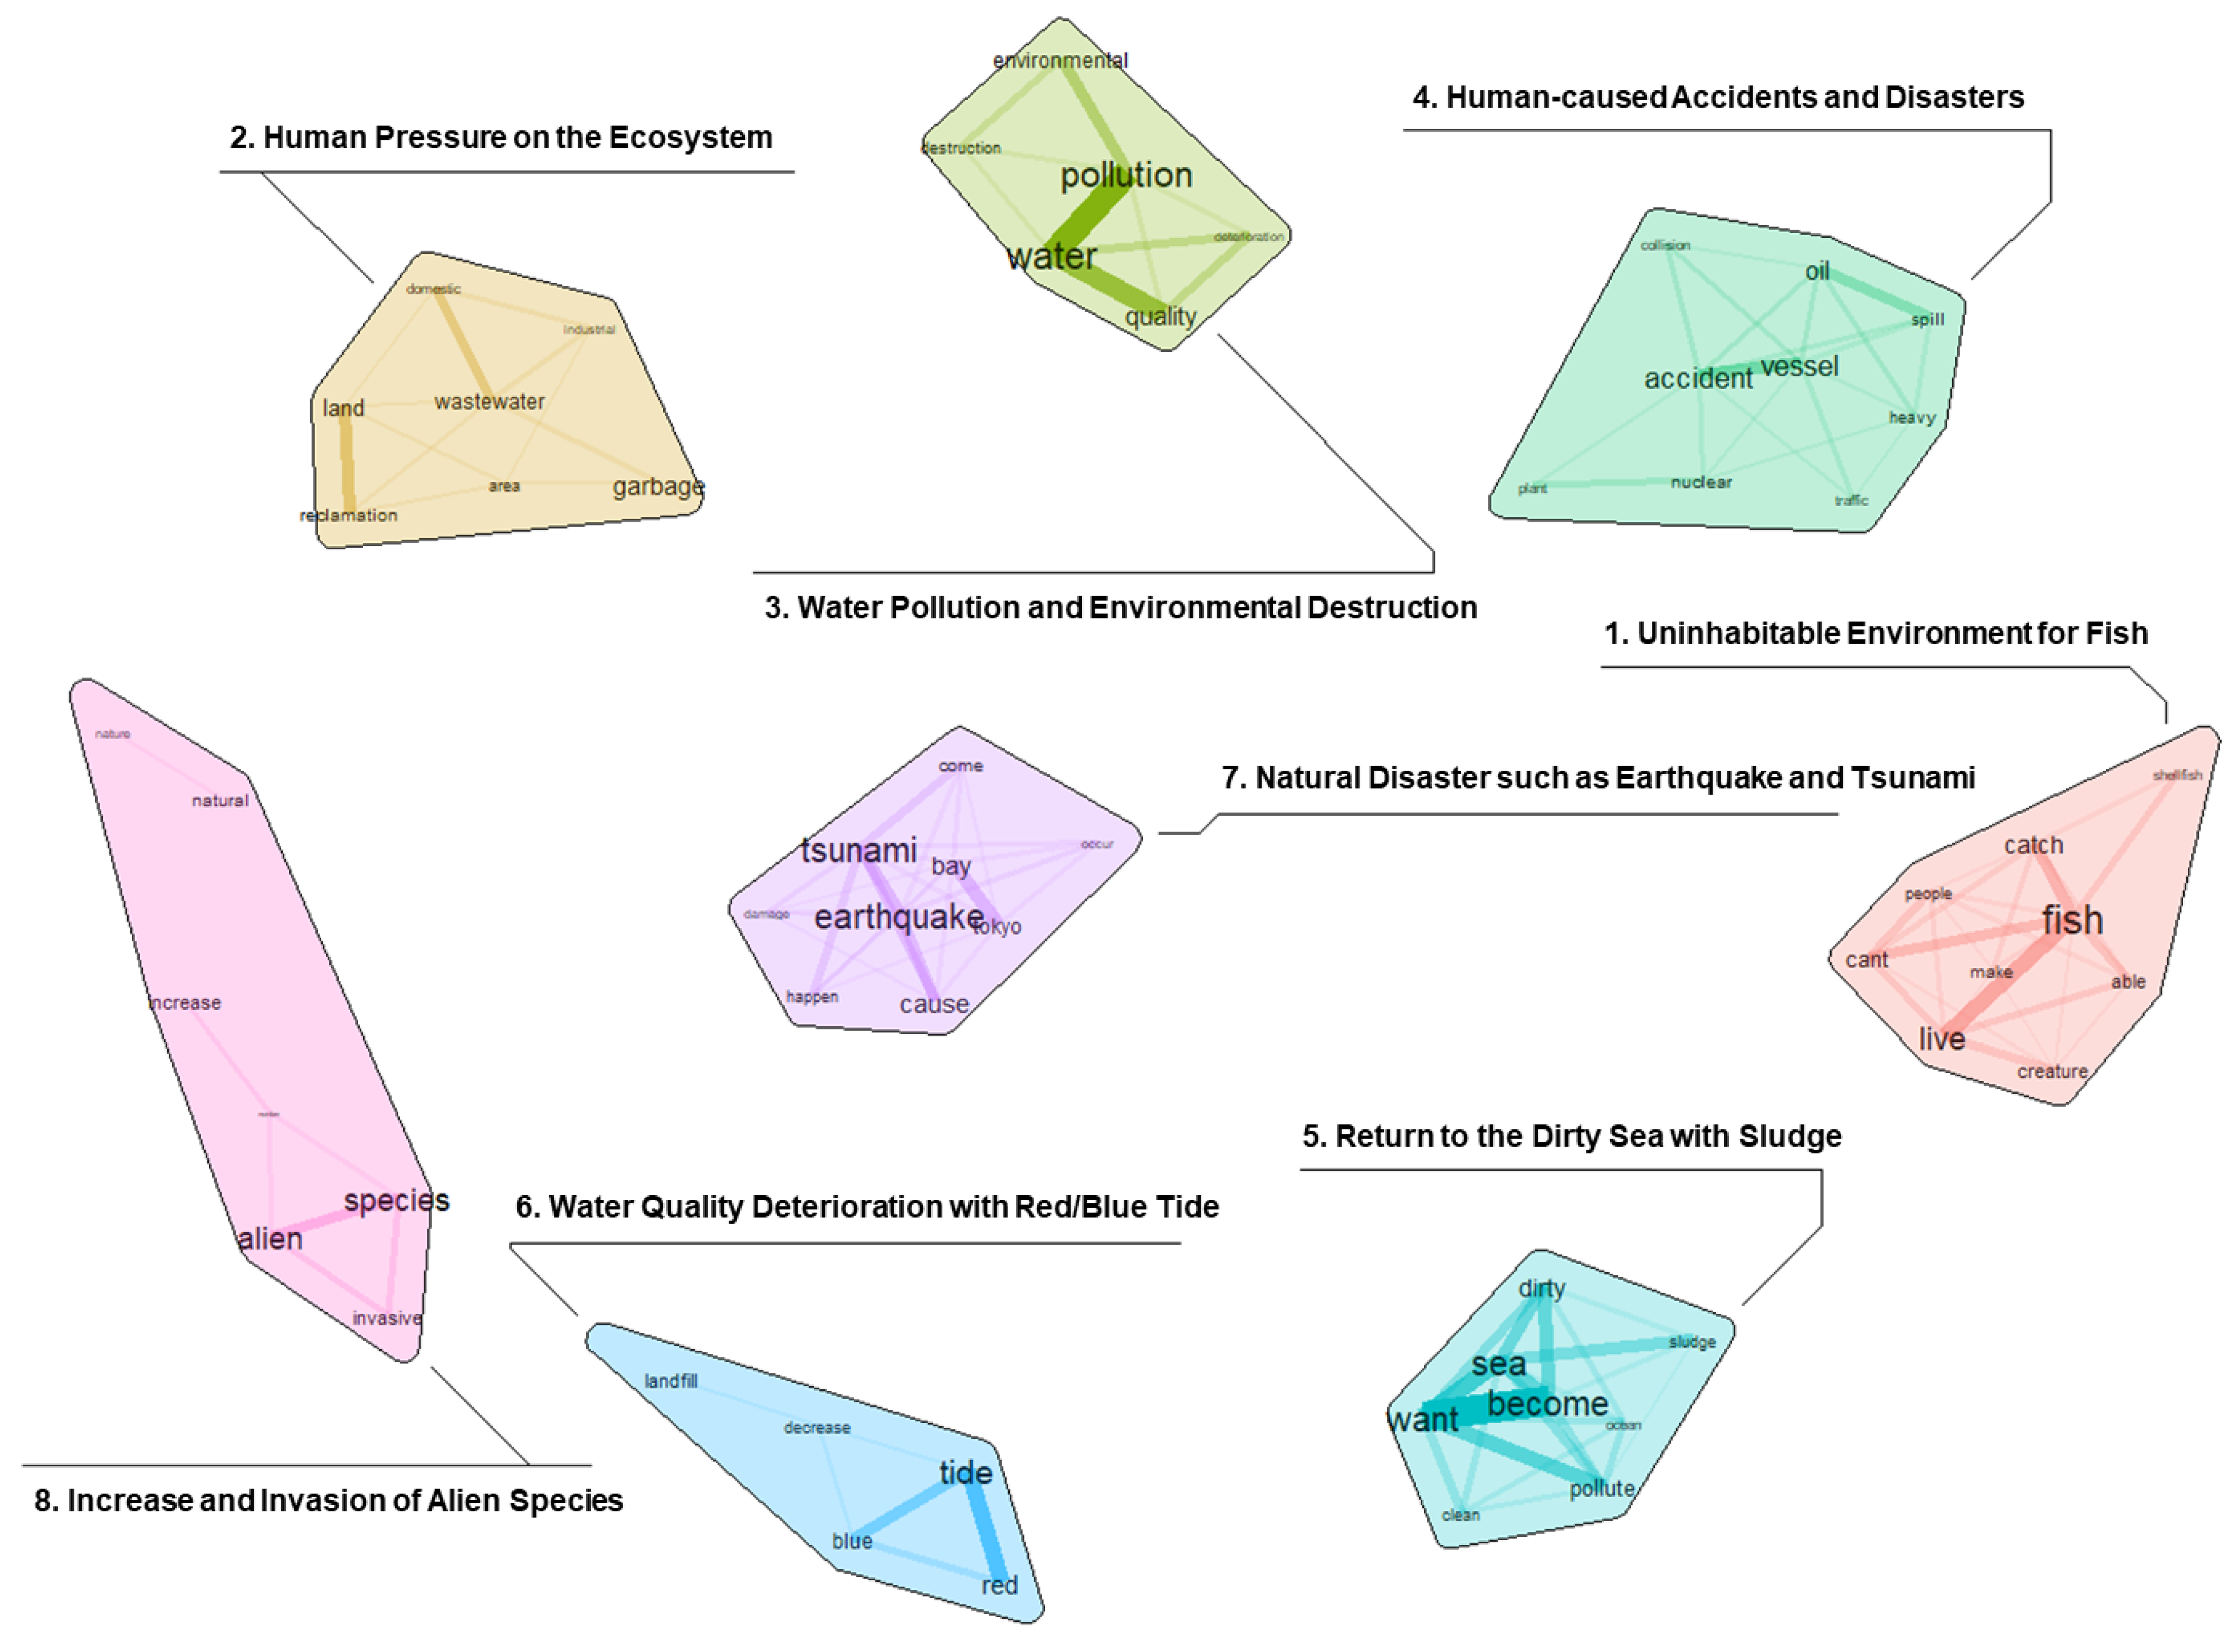
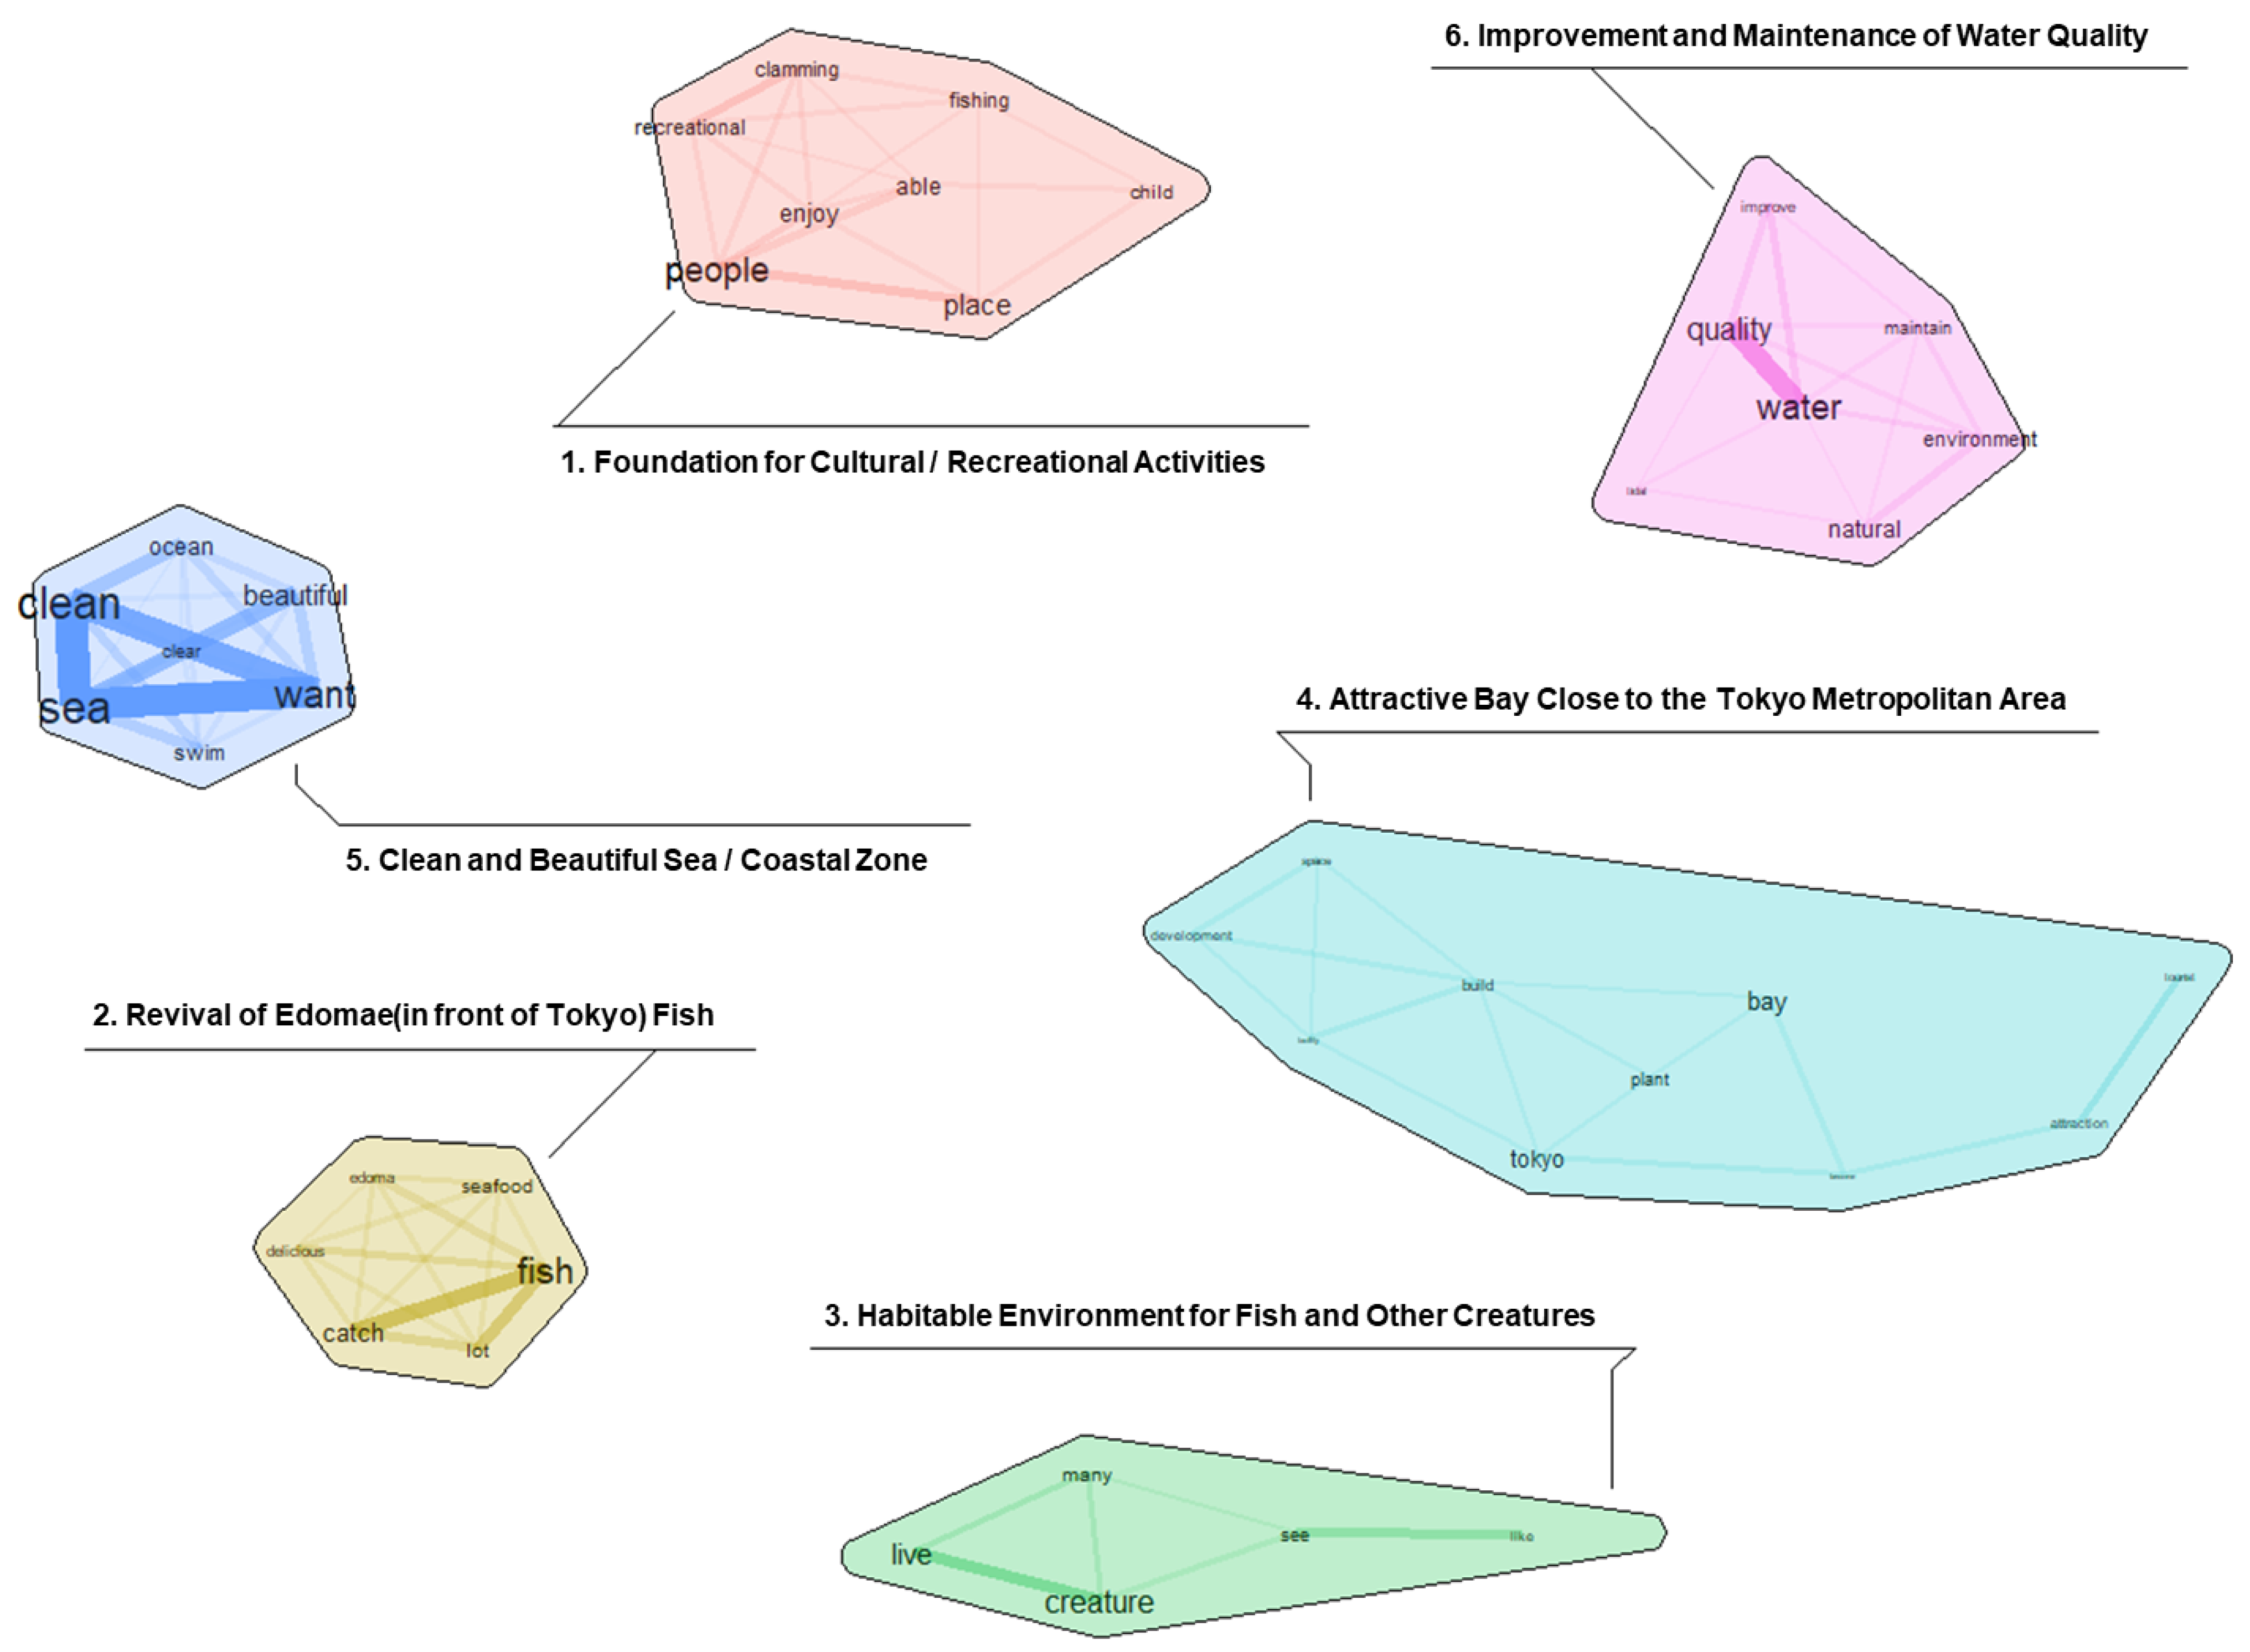
3.2.2. Word Probabilities and Topic Maps for Two Future Visions
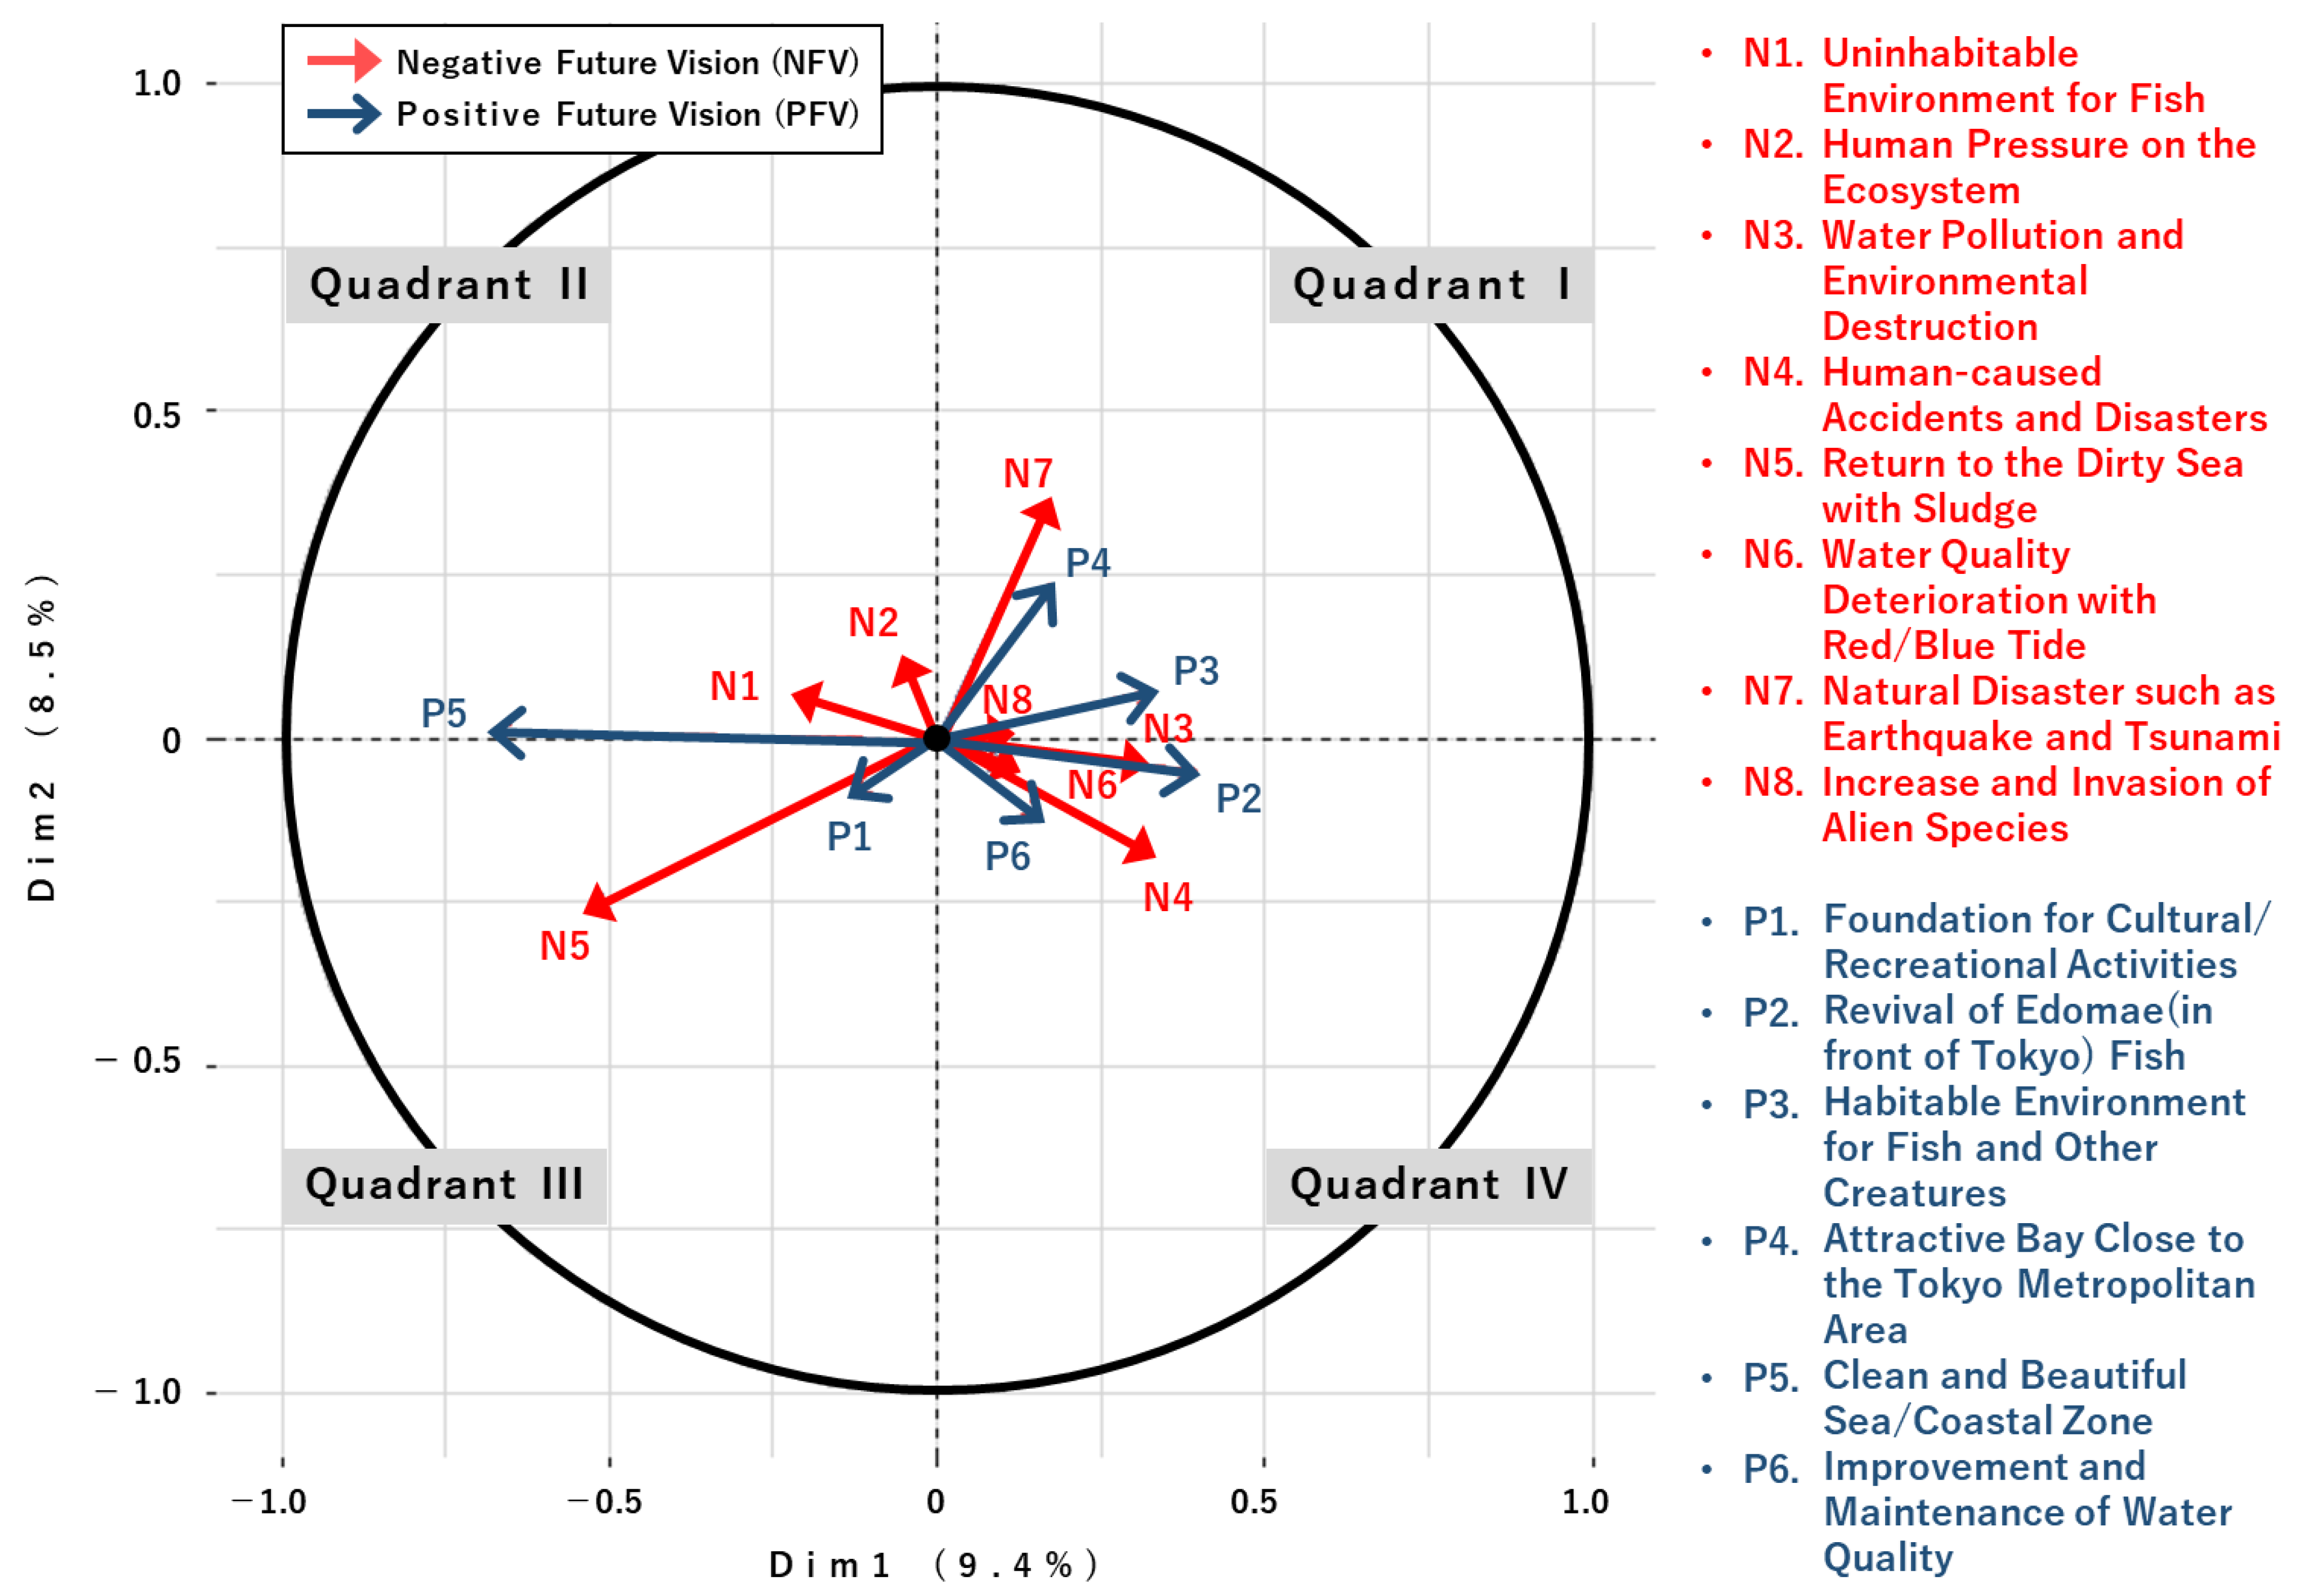
3.2.3. “Future Compass” Provided by Multiple-Factor Analysis
4. Discussion
5. Conclusions
Supplementary Materials
Author Contributions
Funding
Institutional Review Board Statement
Informed Consent Statement
Data Availability Statement
Acknowledgments
Conflicts of Interest
References
- Barbier, E.B. Progress and Challenges in Valuing Coastal and Marine Ecosystem Services. Rev. Environ. Econ. Policy 2012, 6, 1–19. [Google Scholar] [CrossRef]
- Ehler, C.; Douvere, F. Marine spatial planning: A step-by-step approach. In IOC Manuals and Guides 53; (ICAM Dossier 6); UNESCO: Paris, France, 2009; 99p. [Google Scholar]
- Makino, M.; Hori, M.; Nanami, A.; Hori, J.; Tajima, H. Mapping the Policy Interventions on Marine Social-Ecological Systems: Case Study of Sekisei Lagoon, Southwest Japan. In Managing Socio-Ecological Production Landscapes and Seascapes for Sustainable Communities in Asia; Science for Sustainable Societies; Saito, O., Subramanian, S., Hashimoto, S., Takeuchi, K., Eds.; Springer: Singapore, 2020. [Google Scholar]
- Elliott, M.; Whitfield, A.K. Challenging paradigms in estuarine ecology and management. Estuar. Coast. Shelf Sci. 2011, 94, 306–314. [Google Scholar] [CrossRef]
- Thia-Eng, C. Essential elements of integrated coastal zone management. Ocean. Coast. Manag. 1993, 21, 81–108. [Google Scholar] [CrossRef]
- Wakita, K.; Yagi, N. Evaluating Integrated Coastal Management planning policy in Japan: Why the Guideline 2000 has not been implemented. Ocean. Coast. Manag. 2013, 84, 97–106. [Google Scholar] [CrossRef]
- Gopnik, M.; Fieseler, C.; Cantral, L.; McClellan, K.; Pendleton, L.; Crowder, L. Coming to the Table: Early Stakeholder Engagement in Marine Spatial Planning. Mar. Policy 2012, 36, 1139–1149. [Google Scholar] [CrossRef]
- Harashina, S. Issues of Public Involvement in Public Planning. In Citizen Participation and Consensus Building, 1st ed.; Harashina, S., Ed.; Gakugei Shuppansha: Kyoto, Japan, 2005; pp. 11–40. [Google Scholar]
- Voyer, M.; Gollan, N.; Barclay, K.; Gladstone, W. ‘It’s Part of Me’; Understanding the Values, Images and Principles of Coastal Users and Their Influence on the Social Acceptability of MPAs. Mar. Policy 2015, 52, 93–102. [Google Scholar] [CrossRef]
- Susskind, L. An Alternative to Robert’s Rules of Order for Groups, Organizations, and Ad Hoc Assemblies That Want to Operate by Consensus. In The Consensus Building Handbook: A Comprehensive Guide to Reaching Agreement, 1st ed.; Susskind, L., MacKearnan, S., Thomas-Larmer, J., Eds.; Sage Publications, Inc.: Thousand Oaks, CA, USA, 1999; pp. 3–58. [Google Scholar]
- Matsuura, M.; Schenk, T. TIntroduction: The theory and practice of joint fact-finding. In Joint Fact-Finding in Urban Planning and Environmental Disputes, 1st ed.; Matsuura, M., Schenk, T., Eds.; Routledge: New York, NY, USA, 2016; pp. 1–13. [Google Scholar]
- Costanza, R.; d’Arge, R.; de Groot, R.; Farber, S.; Grasso, M.; Hannon, B.; Limburg, K.; Naeem, S.; O’Neill, R.V.; Paruelo, J.; et al. The value of the world’s ecosystem services and natural capital. Ecol. Econ. 1998, 25, 3–15. [Google Scholar] [CrossRef]
- Halpern, B.S.; Longo, C.; Hardy, D.; McLeod, K.L.; Samhouri, J.F.; Katona, S.K.; Kleisner, K.; Lester, S.E.; O’Leary, J.; Ranelletti, M.; et al. An index to assess the health and benefits of the global ocean. Nature 2012, 488, 7413. [Google Scholar] [CrossRef] [PubMed]
- Okada, T.; Mito, Y.; Iseri, E.; Takahashi, T.; Sugano, T.; Akiyama, Y.B.; Watanabe, K.; Tanaya, T.; Sugino, H.; Tokunaga, K.; et al. Method for the quantitative evaluation of ecosystem services in coastal regions. PeerJ 2019, 6, e6234. [Google Scholar] [CrossRef]
- Okada, T.; Mito, Y.; Tokunaga, K.; Sugino, H.; Kubo, T.; Akiyama, Y.B.; Endo, T.; Otani, S.; Yamochi, S.; Kozuki, Y.; et al. A comparative method for evaluating ecosystem services from the viewpoint of public works. Ocean. Coast. Manag. 2021, 212, 105848. [Google Scholar] [CrossRef]
- Millennium Ecosystem Assessment. Ecosystems and Human Well-Being: General Synthesis; Island Press: Washington, DC, USA, 2005. [Google Scholar]
- Chan, K.M.A.; Satterfield, T.; Goldstein, J. Rethinking ecosystem services to better address and navigate cultural values. Ecol. Econ. 2012, 74, 8–18. [Google Scholar] [CrossRef]
- Ishihara, H. Relational values from a cultural valuation perspective: How can sociology contribute to the evaluation of ecosystem services? Curr. Opin. Environ. Sustain. 2018, 35, 61–68. [Google Scholar] [CrossRef]
- Sugimoto, A.; Sugino, H.; Hori, J. How bountiful is the ocean? Participatory valuation of human-nature relationships in Yaeyama Islands, Okinawa, Japan. Sustain. Sci. 2021, 17, 879–898. [Google Scholar] [CrossRef]
- Suga, S.; Oi, K.; Harasawa, H. Study of the Awareness of Local Residents on an Expanse of Water by a Free Association Test and Cluster Analysis. Doboku Gakkai Ronbunshu 1993, 458, 91–100. [Google Scholar] [CrossRef]
- Moore, C.W.; Woodrow, P.J. Collaborative Problem Solving within Organizations. In The Consensus Building Handbook: A Comprehensive Guide to Reaching Agreement, 1st ed.; Susskind, L., MacKearnan., S., Thomas-Larmer, J., Eds.; Sage Publications, Inc.: Thousand Oaks, CA, USA, 1999; pp. 591–630. [Google Scholar]
- Hara, K.; Kitakaji, Y.; Sugino, H.; Yoshioka, R.; Takeda, H.; Hizen, Y.; Saijo, T. Effects of experiencing the role of imaginary future generations in decision-making: A case study of participatory deliberation in a Japanese town. Sustain. Sci. 2021, 16, 1001–1016. [Google Scholar] [CrossRef]
- Takemura, S.; Tajima, H.; Hori, J.; Makino, M.; Matewere, J.B.; Rampisela, D.A.; Sato, T. Autonomous Innovations in Rural Communities of Developing Countries II—Causal Network and Leverage Point Analyses of Transformations. Sustainability 2022, 14, 12054. [Google Scholar] [CrossRef]
- Higuchi, K. Quantitative Text Analysis for Social Researchers: A Contribution to Content Analysis, 2nd ed.; Nakanishiya Shuppan: Kyoto, Japan, 2020; pp. 79–91. [Google Scholar]
- Tokyo Bay Renaissance Promotion Council. Action Plan towards the Tokyo Bay Restoration (2nd Phase). 2013. Available online: https://www1.kaiho.mlit.go.jp/KANKYO/TB_Renaissance/action_program_2nd.pdf (accessed on 2 February 2023).
- Tokunaga, K.; Sugino, H.; Nomura, H.; Michida, Y. Norms and the willingness to pay for coastal ecosystem restoration: A case of the Tokyo Bay intertidal flats. Ecol. Econ. 2020, 169, 106423. [Google Scholar] [CrossRef]
- Kudo, T. Satoumi has been fostered by spiritual relation with local residents. Nippon. Suisan Gakkaishi 2014, 80, 66–68. [Google Scholar] [CrossRef]
- Furota, T. Visual Power to Understand the Environment of Tokyo Bay. J. Inst. Image Electron. Eng. Jpn. 2006, 35, 428–433. [Google Scholar]
- Furukawa, K.; Atsumi, M.; Okada, T. Importance of citizen science application for integrated coastal management—Change of Gobies’ survival strategies in Tokyo Bay, Japan. Estuar. Coast. Shelf Sci. 2019, 228, 106388. [Google Scholar] [CrossRef]
- Tokyo Bay Restoration Public-Private Partnership Forum. Policy Proposals from the Tokyo Bay Restoration Public-Private Partnership Forum for the Third Phase of the Tokyo Bay Restoration Plan. 2022. Available online: http://tbsaisei.com/report/PDF/R03/teian3ki.pdf (accessed on 24 February 2023).
- Oishi, T. Economic Analysis of Green Consumerism: Theory and Evidence, 1st ed.; Gakubunsha: Tokyo, Japan, 2015; p. 123. [Google Scholar]
- Andrews, D.; Nonnecke, B.; Preece, J. Electronic survey methodology: A case study in reaching hard-to-involve Internet users. Int. J. Hum.-Comput. Interact. 2003, 16, 185–210. [Google Scholar] [CrossRef]
- Wright, B.K. Researching Internet-based populations: Advantages and disadvantages of online survey research, online questionnaire authoring software packages, and web survey services. J. Comput.-Mediat. Commun. 2005, 10, 185–210. [Google Scholar] [CrossRef]
- MIC (Ministry of Internal Affairs and Communications, Japan). Statistical Handbook of Japan 2018. 2018. Available online: https://www.stat.go.jp/english/data/handbook/pdf/2018all.pdf (accessed on 15 March 2023).
- Sugino, H.; Hayashi, N.; Sekiguchi, T.; Terada, Y. Understanding the Image of Sea for Japanese People by Free Association Questionnaire. J. Coast. Zone Stud. 2017, 30, 29–40. [Google Scholar]
- Suga, S.; Oi, K. A Survey of the image of Sea through a Free Association Method. F-73-‘95/NIES(National Institute for Environmental Studies). 1995; (In Japanese). Available online: https://www.nies.go.jp/kanko/gyomu/pdf/f073-1995.pdf (accessed on 29 March 2023).
- Muro, K.; Sunaga, N.; Ito, N. Primary Considerations for Choosing the Appropriate Words for Questionnaires in the Evaluation of Living Environments: Method for Evaluation in Human-Environment System Part 3. J. Archit. Plan. (Trans. AIJ) 1999, 64, 61–68. [Google Scholar] [CrossRef]
- Sugino, H.; Michida, Y.; Shiroyama, H.; Yagi, N.; Kubo, M.; Tokunaga, K. Sustainable Consensus Building in Public Projects Related to Coastal Management with Environmental Recovery: Case Study of the Omori Furusato-no-hamabe Beach Park. J. Jpn. Soc. Civ. Eng. Ser. B3 2016, 72, I_838–I_843. [Google Scholar]
- Yan, X.; Guo, J.; Lan, Y.; Cheng, X. A biterm topic model for short texts. In Proceedings of the 22nd International Conference on World Wide Web, Rio de Janeiro, Brazil, 13–17 May 2013; pp. 1445–1456. [Google Scholar]
- Cheng, X.; Yan, Y.; Lan, Y.; Guo, J. BTM: Topic Modeling over Short Texts. IEEE Trans. Knowl. Data Eng. 2014, 26, 2928–2941. [Google Scholar] [CrossRef]
- Blei, D.M.; Ng, A.Y.; Jordan, M.I. Latent Dirichlet Allocation. J. Mach. Learn. Res. 2003, 3, 993–1022. Available online: https://dl.acm.org/doi/10.5555/944919.944937 (accessed on 15 March 2023).
- Deerwester, S.; Dumais, S.T.; Furnas, G.W.; Landauer, T.K.; Harshman, R. Indexing by latent semantic analysis. J. Am. Soc. Inf. Sci. 1990, 41, 391–407. [Google Scholar] [CrossRef]
- Hofman, T. Probabilistic latent semantic indexing. In Proceedings of the 22nd Annual International ACM SIGIR Conference on Research and Development in Information Retrieval, SIGIR ’99, New York, NY, USA, 15–19 August 1999; pp. 50–57. [Google Scholar]
- Escofier, B.; Pagès, J. Multiple factor analysis (AFMULT package). Comput. Stat. Data Anal. 1994, 18, 121–140. [Google Scholar] [CrossRef]
- R Core Team. R: A Language and Environment for Statistical Computing; R Foundation for Statistical Computing: Vienna, Austria, 2021; Available online: https://www.R-project.org/ (accessed on 2 April 2023).
- Wickham, H.; Averick, M.; Bryan, J.; Chang, W.; McGowan, L.D.; Francois, R.; Grolemund, G.; Hayes, A.; Henry, L.; Hester, J.; et al. Welcome to the tidyverse. J. Open Source Softw. 2019, 4, 1686. [Google Scholar] [CrossRef]
- Wijffels, J. udpipe: Tokenization, Parts of Speech Tagging, Lemmatization and Dependency Parsing with the ‘UDPipe’ ‘NLP’ Toolkit. R Package Version 0.8.11. 2023. Available online: https://CRAN.R-project.org/package=udpipe (accessed on 2 April 2023).
- Wijffels, J. BTM: Biterm Topic Models for Short Text. R Package Version 0.3.7. 2023. Available online: https://CRAN.R-project.org/package=BTM (accessed on 2 April 2023).
- Le, S.; Josse, J.; Husson, F. FactoMineR: An R Package for Multivariate Analysis. J. Stat. Softw. 2008, 25, 1–18. [Google Scholar] [CrossRef]
- Fries, C.C. The Structure of English; Harcourt, Brace: New York, NY, USA, 1952. [Google Scholar]
- Newman, D.; Lau, J.H.; Grieser, K.; Baldwin, T. Automatic evaluation of topic coherence. In Human Language Technologies, Proceedings of the 2010 Annual Conference of the North American Chapter of the Association for Computational Linguistics (HLT ’10), Los Angeles, CA, USA, 2–4 June 2010; Association for Computational Linguistics: Stroudsburg, PA, USA, 2010; pp. 100–108. [Google Scholar]
- Mimno, D.; Wallach, H.M.; Talley, E.; Leenders, M.; McCallum, A. Optimizing semantic coherence in topic models. In Proceedings of the Conference on Empirical Methods in Natural Language Processing, Edinburgh, UK, 27–31 July 2011; Association for Computational Linguistics: Edinburgh, UK, 2011; pp. 262–272. Available online: https://aclanthology.org/D11-1024.pdf (accessed on 26 March 2023).
- Alteras, N.; Stevenson, M. Evaluating Topic Coherence Using Distributional Semantics. In Proceedings of the 10th International Conference on Computational Semantics (IWCS 2013)—Long Papers, Potsdam, Germany, 19–22 March 2013; Association for Computational Linguistics: Stroudsburg, PA, USA, 2013; pp. 13–22. [Google Scholar]
- Griffiths, T.L.; Steyvers, M. Finding scientific topics. Proc. Natl. Acad. Sci. USA 2004, 101 (Suppl. S1), 5228–5235. [Google Scholar] [CrossRef]
- Stevens, K.; Kegelmeyer, P.; Andrzejewski, D.; Buttler, D. Exploring Topic Coherence over Many Models and Many Topics. In Proceedings of the 2012 Joint Conference on Empirical Methods in Natural Language Processing and Computational Natural Language Learning, Jeju Island, Korea, 12–14 July 2012; Association for Computational Linguistics: Stroudsburg, PA, USA, 2012; pp. 952–961. [Google Scholar]
- Marashi, E.; Davis, J.P. An argumentation-based method for managing complex issues in design of infrastructural systems. Reliab. Eng. Syst. Saf. 2006, 91, 1535–1545. [Google Scholar] [CrossRef]
- Inohara, T. Consensus and Consensus Mathematics—Efficiency, Stability, and Existence. In Consensus Building—Theory, Methods, and Practice; Inohara, T., Ed.; Keiso Shobo: Tokyo, Japan, 2011; pp. 103–122. [Google Scholar]
- Saaty, T.L.; Ozdemir, M. Negative priorities in the analytic hierarchy process. Math. Comput. Model. 2003, 37, 1063–1075. [Google Scholar] [CrossRef]
- Hamada, Y.; Maruyama, T.; Shoji, H. Characteristics of Consensus Building Process Model in Case of Multiple-choice. Trans. Jpn. Soc. Kansei Eng. 2018, 17, 357–364. [Google Scholar] [CrossRef]
- Elliot, A.J.; Gable, S.L.; Mapes, R.R. Approach and avoidance motivation in the social domain. Personal. Soc. Psychol. Bull. 2006, 32, 378–391. [Google Scholar] [CrossRef] [PubMed]
- Dweck, C.S.; Elliott, E.S. Achievement motivation. In Handbook of Child Psychology: Vol. 4. Socialization, Personality, and Social Development; Mussen, P.H., Hetherington, E.M., Eds.; Wiley: New York, NY, USA, 1983; pp. 643–691. [Google Scholar]
- Norgaard, R.B. Ecosystem services: From eye-opening metaphor to complexity blinder. Ecol. Econ. 2010, 69, 1219–1227. [Google Scholar] [CrossRef]
- Díaz, S.; Pascual, U.; Stenseke, M.; Martín-López, B.; Watson, R.T.; Molnár, Z.; Hill, R.; Chan, K.M.A.; Baste, I.A.; Brauman, K.A.; et al. Assessing nature’s contributions to people. Science 2018, 359, 270–272. [Google Scholar] [CrossRef]
- Wakita, K.; Shen, Z.; Oishi, T.; Yagi, N.; Kurokura, H.; Furuya, K. Human utility of marine ecosystem services and behavioural intentions for marine conservation in Japan. Mar. Policy 2014, 46, 53–60. [Google Scholar] [CrossRef]
- Minami, H. New Appearance of Environmental Psychology; Seishin Shobou: Tokyo, Japan, 2006; pp. 3–44. [Google Scholar]
- Wicker, A.W. Ecological psychology: Historical contexts, current conception, prospective directions. In Handbook of Environmental Psychology; Bechtel, R.B., Churchman, A., Eds.; John Wiley & Sons, Inc.: New York, NY, USA, 2002; pp. 114–126. [Google Scholar]


| Major Sections | No. of Questions | Details |
|---|---|---|
| Demographic Information Part | 2 |
|
| Free Association Survey Part | 2 | (Instruction Text) What do you associate with the following questions? Please be as specific as possible and write down as many associations as you can think of, whether they are individual words, groups of words, or sentences.
|
| Gender | Overall (N = 929) | Kanagawa (N = 313) | Tokyo (N = 310) | Chiba (N = 306) |
|---|---|---|---|---|
| Male | 449 (48%) | 152 (49%) | 149 (48%) | 148 (48%) |
| Female | 480 (52%) | 161 (51%) | 161 (52%) | 158 (52%) |
Disclaimer/Publisher’s Note: The statements, opinions and data contained in all publications are solely those of the individual author(s) and contributor(s) and not of MDPI and/or the editor(s). MDPI and/or the editor(s) disclaim responsibility for any injury to people or property resulting from any ideas, methods, instructions or products referred to in the content. |
© 2023 by the authors. Licensee MDPI, Basel, Switzerland. This article is an open access article distributed under the terms and conditions of the Creative Commons Attribution (CC BY) license (https://creativecommons.org/licenses/by/4.0/).
Share and Cite
Sugino, H.; Sekiguchi, T.; Terada, Y.; Hayashi, N. “Future Compass”, a Tool That Allows Us to See the Right Horizon—Integration of Topic Modeling and Multiple-Factor Analysis. Sustainability 2023, 15, 10175. https://doi.org/10.3390/su151310175
Sugino H, Sekiguchi T, Terada Y, Hayashi N. “Future Compass”, a Tool That Allows Us to See the Right Horizon—Integration of Topic Modeling and Multiple-Factor Analysis. Sustainability. 2023; 15(13):10175. https://doi.org/10.3390/su151310175
Chicago/Turabian StyleSugino, Hiroaki, Tatsuya Sekiguchi, Yuuki Terada, and Naoki Hayashi. 2023. "“Future Compass”, a Tool That Allows Us to See the Right Horizon—Integration of Topic Modeling and Multiple-Factor Analysis" Sustainability 15, no. 13: 10175. https://doi.org/10.3390/su151310175
APA StyleSugino, H., Sekiguchi, T., Terada, Y., & Hayashi, N. (2023). “Future Compass”, a Tool That Allows Us to See the Right Horizon—Integration of Topic Modeling and Multiple-Factor Analysis. Sustainability, 15(13), 10175. https://doi.org/10.3390/su151310175