Article

Study on Spatial and Temporal Characteristics and Influencing Factors of Carbon Emissions in the Urban Agglomeration of the Middle Reaches of the Yangtze River

Department of Environmental Science and Engineering, Fudan University, Shanghai 200438, China
*
Author to whom correspondence should be addressed.
Sustainability 2023, 15(13), 10176; https://doi.org/10.3390/su151310176
Submission received: 4 May 2023 / Revised: 20 June 2023 / Accepted: 21 June 2023 / Published: 27 June 2023

Abstract

:
The industrial transfer of heavy industries such as non-metallic mineral manufacturing, metal smelting and manufacturing from the eastern coast of China to the central region is beneficial to the economic development of the central region on the one hand, but increases carbon emissions in the central region on the other hand. In February 2022, the National Development and Reform Commission approved the “14th Five-Year Plan for the Development of the Urban Agglomeration in the Middle Reaches of the Yangtze River”. This indicates that the urban agglomeration of the middle reaches of the Yangtze River is an important region for implementing green development in the central area. The spatial and temporal evolution of carbon emissions and influencing factors in this region are the foundation for achieving carbon peaking and the carbon neutrality goal. This paper calculates the total carbon emissions of the cities in the urban agglomeration of the middle reaches of the Yangtze River and uses models such as spatial autocorrelation, geographically weighted regression, and Geodetector to explore the spatial–temporal pattern of carbon emissions. The results show the following: (1) The total carbon emissions of the middle reaches of the Yangtze River urban agglomeration showed fluctuations during 2010–2020, and the carbon emission reduction effect is unstable. Additionally, the carbon emissions of the middle reaches of the Yangtze River city cluster show obvious spatial variability, but the high carbon emission area is always concentrated in Wuhan, and this remains unchanged. (2) In 2010, 2014 and 2017, population size was the most important factor affecting carbon emission divergence, and in terms of interaction, the interaction between energy intensity and GDP and urbanization is the reason for the increasing carbon emissions. (3) The influence of population size on carbon emissions decreases from north to south, the influence of energy intensity on carbon emissions shows a spread from the most influential region in the northwest to the centre and then to the northeast, and the GDP per capita has little influence on the difference of carbon emissions spatial distribution.

1. Introduction

Since 2010, when the General Office of the State Council first issued the “Guidance Opinions of the State Council on Undertaking Industrial Transfer in Central and Western Regions”, the industrial transfer of heavy industries such as non-metallic mineral manufacturing, metal smelting, and manufacturing from the eastern coastal regions of China to the central region has benefited the economic development of the central region on the one hand, but has increased carbon emissions the central region on the other hand [1]. In 2015, the Chinese government proposed promoting the development of the urban agglomeration in the middle reaches of the Yangtze River, which was of great significance for accelerating the rise of central China and developing the Yangtze River Economic Belt [2]. In February 2022, the National Development and Reform Commission approved the “14th Five-Year Plan for the Development of the Urban Agglomeration in the Middle Reaches of the Yangtze River” [3]. However, most of the current research on urban agglomerations focuses on the most economically developed regions, such as the Yangtze River Delta and the Beijing–Tianjin–Hebei region [4,5,6], or regions with concentrated coal resources, such as Shanxi, Shaanxi, and Inner Mongolia [7,8]. There is a lack of research on urban agglomerations in the central region. Therefore, studying the carbon emissions of the urban agglomeration in the middle reaches of the Yangtze River is of great importance for promoting high-quality development and carbon reduction in the central region. Overall, the main contributions of this paper are as follows:
(1) It fills a gap in the study of carbon emissions in the middle reaches of the Yangtze River urban agglomeration. (2) The interaction between different factors influencing carbon emissions is considered, rather than treating the influencing factors in isolation. (3) For the first time, two spatially related methods are used to study the carbon emission influencing factors in the middle reaches of the Yangtze River urban agglomeration, taking into account the spatial heterogeneity of the region in the study to a greater extent.
The study of carbon emissions has been a popular research area. Carbon emission studies are mainly on the national [9], provincial [10,11], urban cluster [12,13], and occasionally county [14,15] scales. For the study of carbon emission influencing factors, most of them adopt the Kaya identity [16,17], the LMDI decomposition method [18,19,20,21], the IPAT model [22], the STIRPAT model [23,24,25], the spatial econometric model [26,27,28], the geographically weighted regression model [29,30,31], Geodetector [32,33], and so on. Huong [16] used Kaya identity and LMDI decomposition analysis to analyse carbon emission patterns in Vietnam and identify their critical drivers for the period 1990–2016. Behera and Dash [25] calculated the effects of urbanisation, energy consumption, and foreign direct investment on CO2 emissions in the South and Southeast Asian countries during the period 1980–2012. Usama Al-mulali [34] used econometric methodology to investigate the major factors that influence the CO2 emission in 12 Middle Eastern countries during the period 1990–2009. Zeng et al. [35] selected 30 provincial administrative units as spatial units and used the exploratory spatial data analysis (ESDA) method to study the spatial and temporal distribution patterns of transportation carbon emissions, while taking into account the differences in spatial units and constructed a GWR model to analyse the spatial and temporal heterogeneity of factors influencing transportation carbon emissions. However, current research on carbon emissions has only focused on the use of individual methods [36,37,38], each with different conditions of use and different emphases. The STIRPAT model, for example, does not take into account differences in the spatial distribution of data, and the spatial Durbin model generally requires spatial autocorrelation within the data, etc. There are also limitations regarding the research conclusions that can be drawn from individual research methods. A Geodetector model is a model used to explore non-linear relationships in spatial data, which can detect interactions and non-linear effects between spatial variables [39]. The geographically weighted regression model, on the other hand, is a local regression model that takes into account the spatial heterogeneity of the data. The main difference between the two models is that the Geodetector can explore the explanatory power of a single variable and the interaction between two variables, and is insensitive to multicollinearity, whereas the geographically weighted regression model can visualise the magnitude of the effect of a single variable on different geographical areas in space. The use of the two different models enables a better exploration of the strength of influencing factors in different spatial locations, as well as the interactions between the influences, leading to more comprehensive conclusions.
As for the research on the factors influencing carbon emissions, the current domestic and international studies generally agree that population factors [40,41], economic development level [42,43], industrial structure [44,45], energy intensity [46], urbanisation rate [47], etc., are important factors influencing carbon emissions, and foreign direct investment [48,49] and international trade [50,51] are also considered to have an impact on carbon emissions. For example, Birdasall [40] and Knapp et al. [41] studied the relationship between carbon emissions and total population, and the results showed that the growth in a global population is an important reason for the increase in carbon emissions. Douglas [42] studied the relationship between GDP and carbon emissions, and the results showed that as the economy grows, marginal carbon emissions show a decreasing trend. In a study on economic growth and carbon emissions in China, Tian et al. [43] found that the contribution of economic growth to per capita carbon emissions in China was exponential, with economic growth factors contributing 42.9% of the change in carbon emissions. In their study, Ang [44] and Sahu [45] found that the shift in industrial structure from heavy industries with high energy consumption to light industries with low energy consumption and the internal restructuring of industries would reduce the energy consumption intensity of the whole economy. Zhu et al. [46] categorised the change in CO2 emissions into five main influencing factors, namely the emission factor of fossil fuels, energy consumption structure, energy intensity, GDP per capita, and total population. The study shows that energy intensity is the main driver. Through their research, Bi [47] found that urbanisation affects carbon emissions in terms of three aspects: urban industrial structure, residents’ lifestyles, and urban spatial layout. However, in most studies, demographic factors, economic development level, industrial structure, energy intensity, and urbanisation rate are important factors affecting carbon emissions. Therefore, these five indicators were selected as the influencing factors of carbon emissions in this study [52,53,54].
In this paper, 27 cities in the middle reaches of the Yangtze River were selected as the research objects, and the carbon emissions of the middle reaches of the Yangtze River urban agglomeration were counted using the measurement method of IPCC. Through the comprehensive use of the spatial autocorrelation model, Geotector and geographically weighted regression model, the influencing factors of carbon emissions in the middle reaches of the Yangtze River urban agglomeration were studied in depth, providing a reference basis for the formulation of the regional differentiated carbon emission reduction policies.

2. Materials and Methods

2.1. Study Area Overview and Data Processing

The urban agglomeration in the middle reaches of the Yangtze River is located in the core area connecting the east and the west, running through the north and the south. It is one of the most important city clusters in the Yangtze River Economic Belt, and a key area for promoting the “Rise of Central China” strategy, comprehensive high-quality development and new urbanisation. It is a mega-city cluster consisting of three city clusters: the Poyang Lake city cluster, the Changzhutan city cluster, and the Wuhan city circle. It has a land area of about 317,000 km2 and includes 31 cities with a total population of 130 million in 2020.
The energy situation in the middle reaches of the Yangtze River urban agglomeration is that the three provinces are short of coal, oil, and natural gas, with insufficient energy self-sufficiency and high external dependence. Jiangxi province is rich in metal and mineral resources and its economy is highly dependent on high carbon emission industries. Hubei province is rich in hydropower resources due to the Three Gorges Dam, but relies almost entirely on external supplies of thermal power, while wind energy has large theoretical potential there but is under-exploited. Hunan province has large hydro energy reserves but is highly seasonal, and biomass has great potential there but is underutilised.
Considering the availability of data, the following 27 cities were selected to form the study area. The details are shown in Table 1.
The data sources used include the “Statistical Yearbook of Hubei Province”, “Statistical Yearbook of Jiangxi Province”, “Statistical Yearbook of Hunan Province”, “China Urban Statistical Yearbook” and statistical yearbooks of various cities such as “Statistical Yearbook of Wuhan” and “Statistical Yearbook of Changsha”, covering data on population, GDP per capita, energy consumption, and the proportion of secondary industry structure for each city from 2010 to 2020. Administrative boundary data were obtained from the Resource and Environment Science and Data Centre of the Chinese Academy of Sciences. Based on previous research [52,53,54], the five indicators of population size (pop), GDP per capita (p_gdp), the proportion of output value of secondary industry (gdp2), energy intensity (c_gdp), and urbanisation rate (ur) were selected as the independent variables, with carbon emissions as the dependent variable, in terms of population size, economic development level, industrial structure, energy intensity, and urban development level.
China currently lacks long-term real-time monitoring data on carbon emissions at the city level and a unified calculation standard for carbon emissions. Therefore, based on the data available at the city level, this study used the carbon emissions calculation formula proposed by the IPCC and calculated the carbon emissions of 27 cities in the urban agglomeration in the middle reaches of the Yangtze River. We considered eight types of energy sources including raw coal, coke, crude oil, gasoline, kerosene, diesel, fuel oil, and natural gas. The conversion factors for different energy sources and the carbon emission factors were obtained from the “China Energy Statistical Yearbook (2007–2016)” and the “National Greenhouse Gas Emissions Inventory Guidelines”. The calculation method is shown in Equation (1):
C O 2 = E i × S C × C F × 44 12
where CO2 is total carbon emissions, E is energy consumption, i is energy type, SC is the standard discount factor, and CF is the carbon emission factor.

2.2. Research Methods

The first measure of the interaction of carbon emissions within a region was through the use of global spatial autocorrelation analysis. If the spatial autocorrelation was weak, then intra-regional variation analysis using a Geodetector and geographically weighted regression model was appropriate.

2.2.1. Global Spatial Autocorrelation Analysis

Spatial autocorrelation analysis is usually used to reflect a correlation within a space. In this paper, Moran’s I index was used to measure the degree of spatial clustering of carbon emissions in adjacent areas. The formula for global autocorrelation is as follows:
I = n S 0 = i = 1 n j = 1 n W i j ( y i y ) ( y j y ) i = 1 n ( y i y ) 2
where S 0 = i = 1 n j = 1 n W i j , n is the total number of spatial units, yi and yj are the i-th and j-th spatial attributes, and Wij is the spatial weight value.
Using the global Moran’s I index, the clustering situation of the data in the region could be judged, that is, whether there was a spatial correlation. When the index is greater than or equal to 0, it indicates that the data in the region have positive autocorrelation, while when the index is less than or equal to 0, it indicates that the data in the region have negative autocorrelation. In addition, the numerical value of the global Moran’s I index could be used to measure the concentration of the data, and the Moran’s I index was ∈[−1, 1].
The spatial weight matrix is constructed using the spatial adjacency weight matrix, and its expression is:
w i j 1 , w h e n   r e g i o n   i   a n d   j   h a v e   a   c o m m o n   b o r d e r 0 , w h e n   r e g i o n   i   a n d   j   h a v e   n o   c o m m o n   b o r d e r
where i,j is the spatial region block number, i,j∈[1, n], n is the number of this spatial region. This paper sets up to use the rook adjacency matrix, i.e., only the spatial weight matrix of regions with common boundaries was assigned to 1, without considering the connection of regions with only common points.
For the results of global Moran’s I, a statistical test for z-significance was performed, calculated as
Z I = 1 E ( I ) V a r ( I ) ~ N ( 0,1 )
where Var(I) is the theoretical variance in Moran’s I index, and E(I) is the theoretical expectation. If the statistical test for the significance of the Z-value is passed, it indicates that the observations have been autocorrelated in terms of spatial distribution rather than randomly distributed.

2.2.2. Geodetector

Through the use of a Geodetector, not only the explanatory power of a single factor on the dependent variable can be explored, but the interaction between factors can also be examined, showing linear or non-linear enhancement features. The core idea of Geodetector is based on the assumption that if an explanatory variable has a significant impact on another dependent variable, then their spatial distributions should also be similar.
The advantages of Geodetector are as follows:
(1)
It can explore both quantitative and qualitative data.
(2)
It can detect the interaction between two factors on the dependent variable [39].
The degree of explanatory power of factor X on the spatial differentiation of the dependent variable Y is measured using the q-value.
q = 1 h = 1 L N h σ h 2 N σ 2
where h = 1,2,…K represents the layers of the carbon emission influencing factor X, N represents the number of cities in the study area, Nh represents the number of cities included in the m layer of the influencing factor X, and σ h 2 and σ 2 represent the variance in layer h and the variance in the entire carbon emission value of the region, respectively. Regarding q∈[0, 1], when q = 0, carbon emissions are randomly distributed. The larger the q-value, the greater the explanatory power of the influencing factor X on the carbon emissions, and the q-value indicates that X explains q × 100% of Y.

2.2.3. Geographically Weighted Regression Model

The geographically weighted regression model (GWR) has been a commonly used spatial analysis model in recent years for exploring the influencing factors of carbon emissions. The following gives a comparison of the advantages of global regression models:
  • In terms of analysis results, the global regression model can only obtain the overall status of the entire study area and may ignore the relationships between variables. The GWR model introduces the spatial geographic location of the data in the model, which can reflect the specific situation of the distribution of the relationships between variables in different geographic spaces.
  • In terms of visualisation, GWR can use ArcGIS to present the numerical values of various parameters on the map, making it easier to study the changes in parameters as the spatial geographic relationship changes.
The GWR model is expressed by the following function:
Z i = β 0 ( x i , y i ) + k = 1 p β k ( x i , y i ) θ i k + σ i
Y is the dependent variable, β0 is the intercept, (xi,yi) are the coordinates of the sampling point, β k ( x i , y i ) is the k-th fitting parameter on the sampling point i, which is a function related to the geographic location, θ i k is the value of the k-th explanatory variable at the i-th sample point, and σ i is the random error.

3. Results

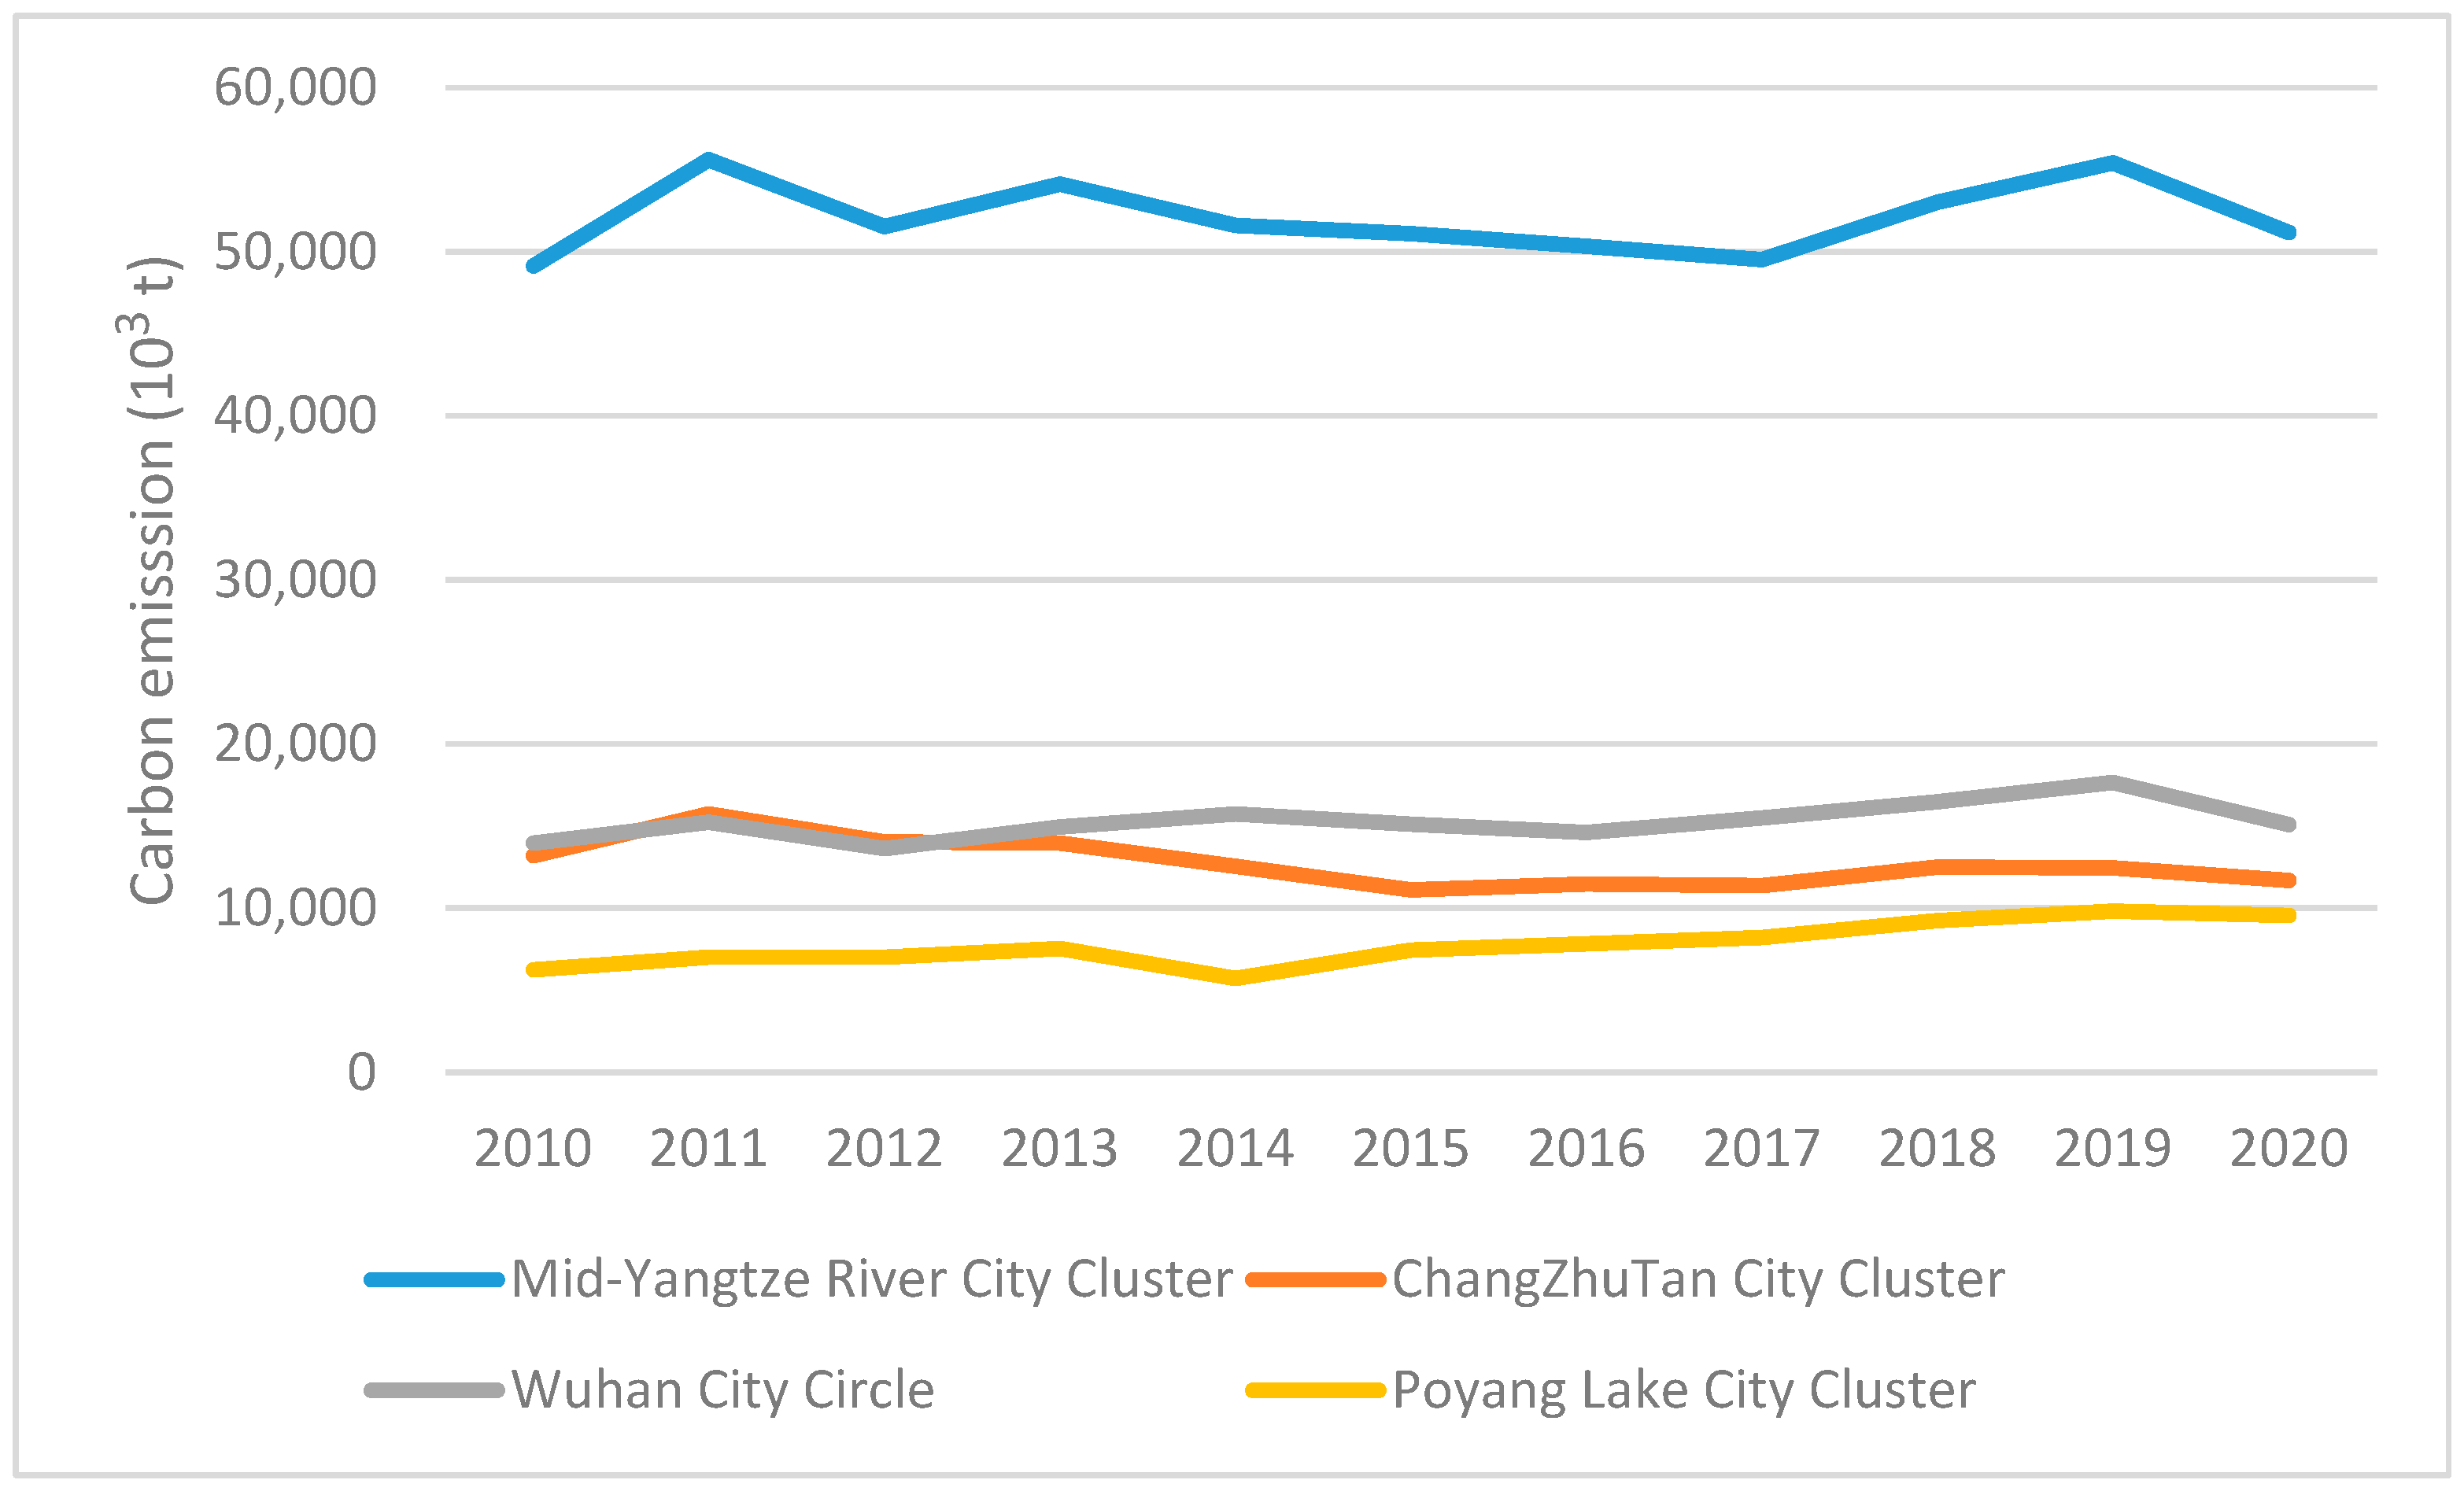
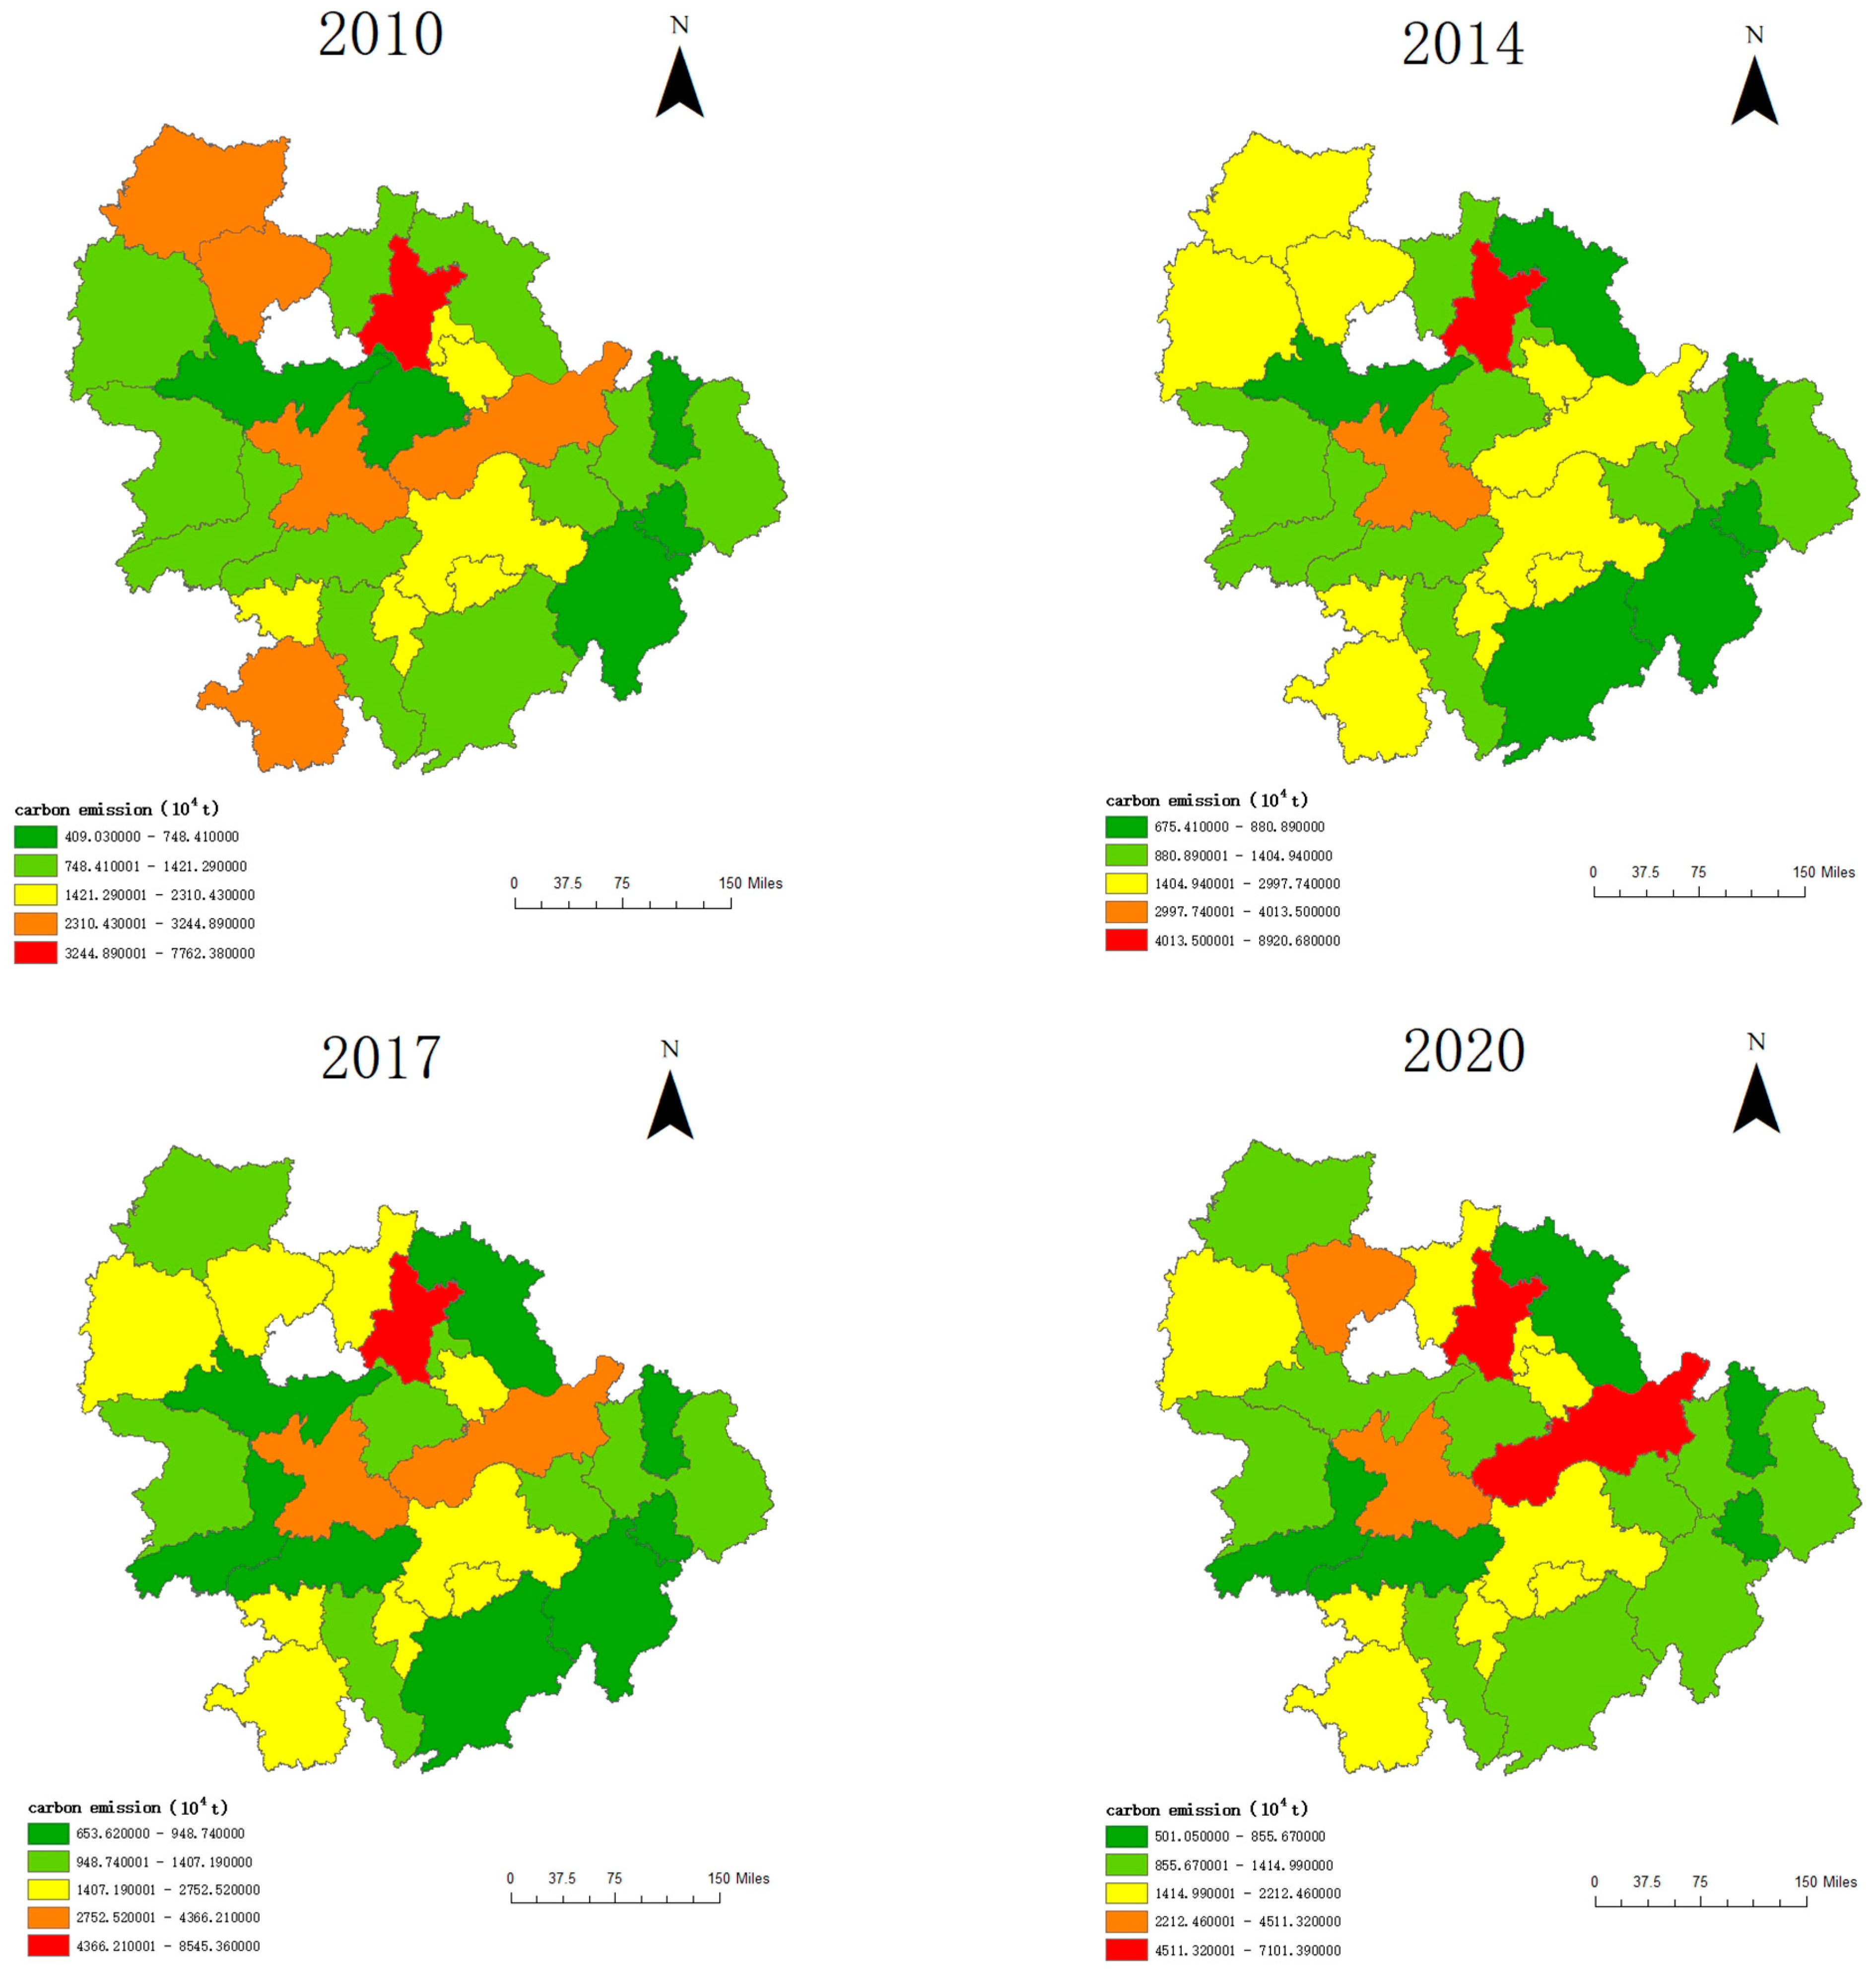
3.1. Spatiotemporal Characteristics of Carbon Emissions

The total carbon emissions of the Yangtze River midstream urban agglomeration have gradually increased from 49,141.30 million tonnes in 2010 to 51,162.98 million tonnes in 2020, but there have been fluctuations in the total carbon emissions between different years during the period of 2010–2020. From 2013 to 2017, the carbon emissions decreased from 54,121.37 tonnes to 49,525.63 tonnes, indicating a significant reduction in carbon emissions during this period. Similar time-series features were also observed in a study by Guangyao Deng [55] on the carbon emissions of the Lanxi urban agglomeration in Gansu province. The carbon emissions of the Yangtze River midstream urban agglomeration sharply declined from 2019 to 2020, possibly due to the outbreak of the COVID-19 pandemic in Wuhan at the end of 2019, leading to lockdowns in Wuhan and the surrounding cities, followed by a nationwide lockdown, resulting in reduced energy consumption and a decrease in carbon emissions (Figure 1).
From 2010 to 2020, the carbon emissions of each city in the Yangtze River midstream urban agglomeration showed a trend of initially increasing and then decreasing. Specifically, the high carbon emission area remained concentrated in Wuhan and did not change significantly, while the secondary high-emission area showed slight changes but remained stable overall. In 2010, the secondary high-emission areas were located in Xiangyang, Jingmen, Yueyang, Jiujiang, and Hengyang. The later secondary high-emission areas were mainly distributed in Yueyang, Jingmen, and Jiujiang. In 2020, the carbon emissions of Jiujiang surged to the same level as in Wuhan (Figure 2).

3.2. Global Spatial Autocorrelation

Global spatial autocorrelation analysis was conducted on the data from 2010 to 2020 to calculate Moran’s I index and perform significance tests (Table 2).
The results show that only 2011, 2012, and 2013 passed the significance test with p < 0.1, but not p < 0.05. This indicates that the carbon emissions in the Yangtze River midstream city cluster had relatively strong spatial autocorrelation in these three years, and Moran’s I index was negative, indicating negative spatial autocorrelation. For the other years, there was no significant spatial autocorrelation, and Moran’s I index decreased, indicating that the spatial correlation between carbon emission intensity among cities is becoming weaker and learning towards a random distribution.

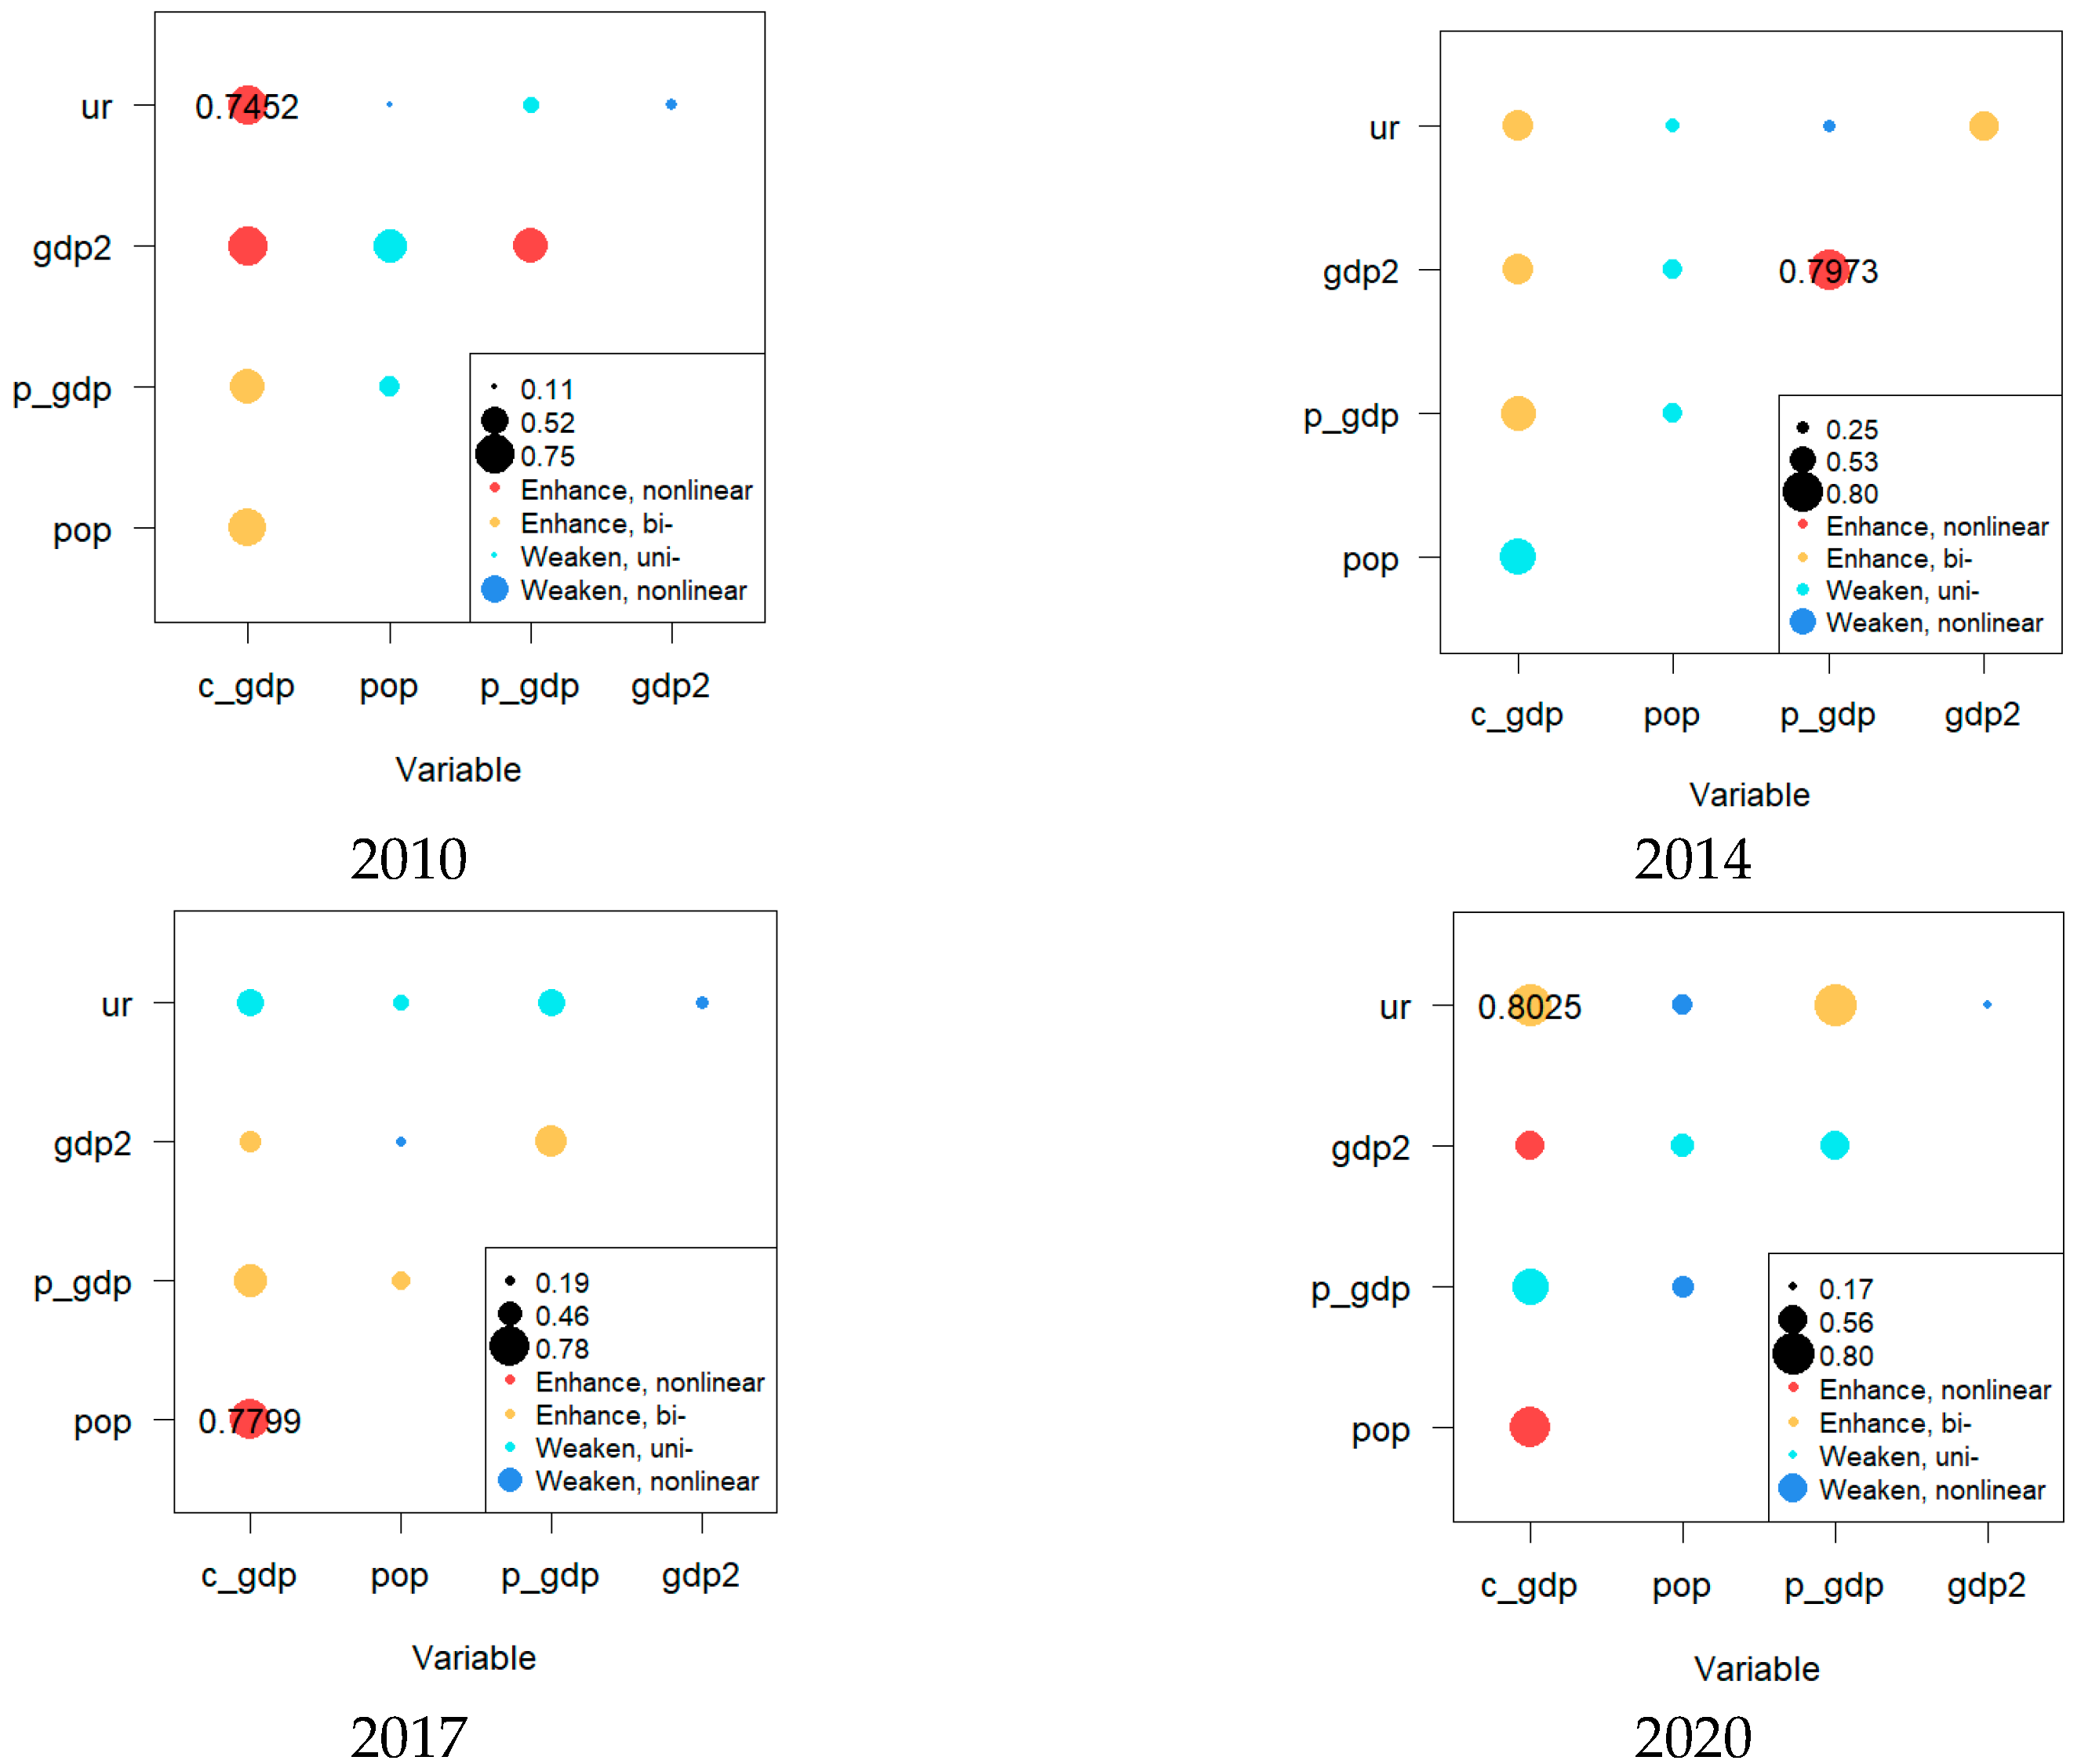
3.3. The Result of Geodetector

(1)
Single-factor detection results (Table 3).
The main factors affecting carbon emissions in the middle reaches of the Yangtze River urban agglomeration have changed significantly during the sample year period. In 2010, 2014, and 2017, the influence of population size on carbon emissions was the strongest, with q-values of 0.7012, 0.7315, and 0.7012, respectively; population size had strong explanatory power in terms of carbon emissions, but by 2020, its explanatory power had gradually decreased, with q value decreases to 0.4666.
The q-values of the urbanisation rate in 2010, 2014, 2017, and 2020 are 0.2430, 0.2693, 0.7408, and 0.7064, respectively, indicating that the explanatory power of urbanisation rate on the impact of carbon emissions has gradually become higher over time, and even dominated in 2017. This may be due to the fact that since the implementation of the Yangtze River Central River Urban Agglomeration Development Plan in 2015, the integrated network pattern of the middle reaches of the Yangtze River urban agglomeration has gradually strengthened, accelerating the urbanisation process, while the massive consumption of energy in the urbanisation process has increased the growth in carbon emissions.
The explanatory power of energy intensity and the share of secondary industry on carbon emissions is also weakening, with the q-value of the impact of energy intensity on carbon emissions gradually decreasing from 0.4019 in 2010 to 0.286, and the q-value of the impact of the share of secondary industry on carbon emissions rising from 0.2432 and then decreasing to 0.1727.
(2)
Interaction factor detection results (Figure 3).
The q-values obtained from the impact factor interactions for 2010, 2014, 2017, and 2020 were ranked separately and the top five factor combinations were collated with the results shown in Table 4.
The results show that the explanatory power of the two-by-two interactions of the impact factors has eithers enhanced or weakened compared to the individual impact factors. The specific linear or non-linear enhancement can be found in Figure 4. The impact factors after the two-by-two interaction, with q-values > 0.7 for 10 pairs, were namely energy intensity (c_gdp) and urbanisation rate (ur), energy intensity (c_gdp2) and share of output in the secondary sector (gdp2) in 2010, energy intensity (c_gdp) and population size (pop) in 2014, energy intensity (c_gdp) and GDP per capita (p_gdp), energy intensity (c_gdp) and urbanisation rate (ur), energy intensity (c_gdp) and population size (pop) in 2017, energy intensity (c_gdp) and urbanisation rate (ur) in 2020, energy intensity (c_gdp) and population size (pop) and energy intensity (c_gdp) and urbanisation rate (ur), energy intensity (c_gdp) and population size (pop) and energy intensity (c_ gdp) and urbanisation rate (ur). It can be seen that the urbanisation rate had a limited impact on carbon emissions in 2010 and 2014, but interacted with the energy intensity factor to leapfrog the explanatory power of carbon emissions, and the same for industrial structure (Table 4).
The interaction factors with the largest q-values have shown similarities across time, with the largest q-values in 2014 and 2017 being for energy intensity (c_gdp) and urbanisation rate (ur), and the largest q-values in 2010 and 2020 being for energy intensity (c_gdp) and population size (pop).The explanatory power of the interaction factor between energy intensity (c_gdp) and GDP per capita (p_gdp) rises and then falls, showing the same trend of change. The explanatory power of the interaction factor for the share of the secondary sector in total output (gdp2) and GDP per capita (p_gdp) also rises and then falls.

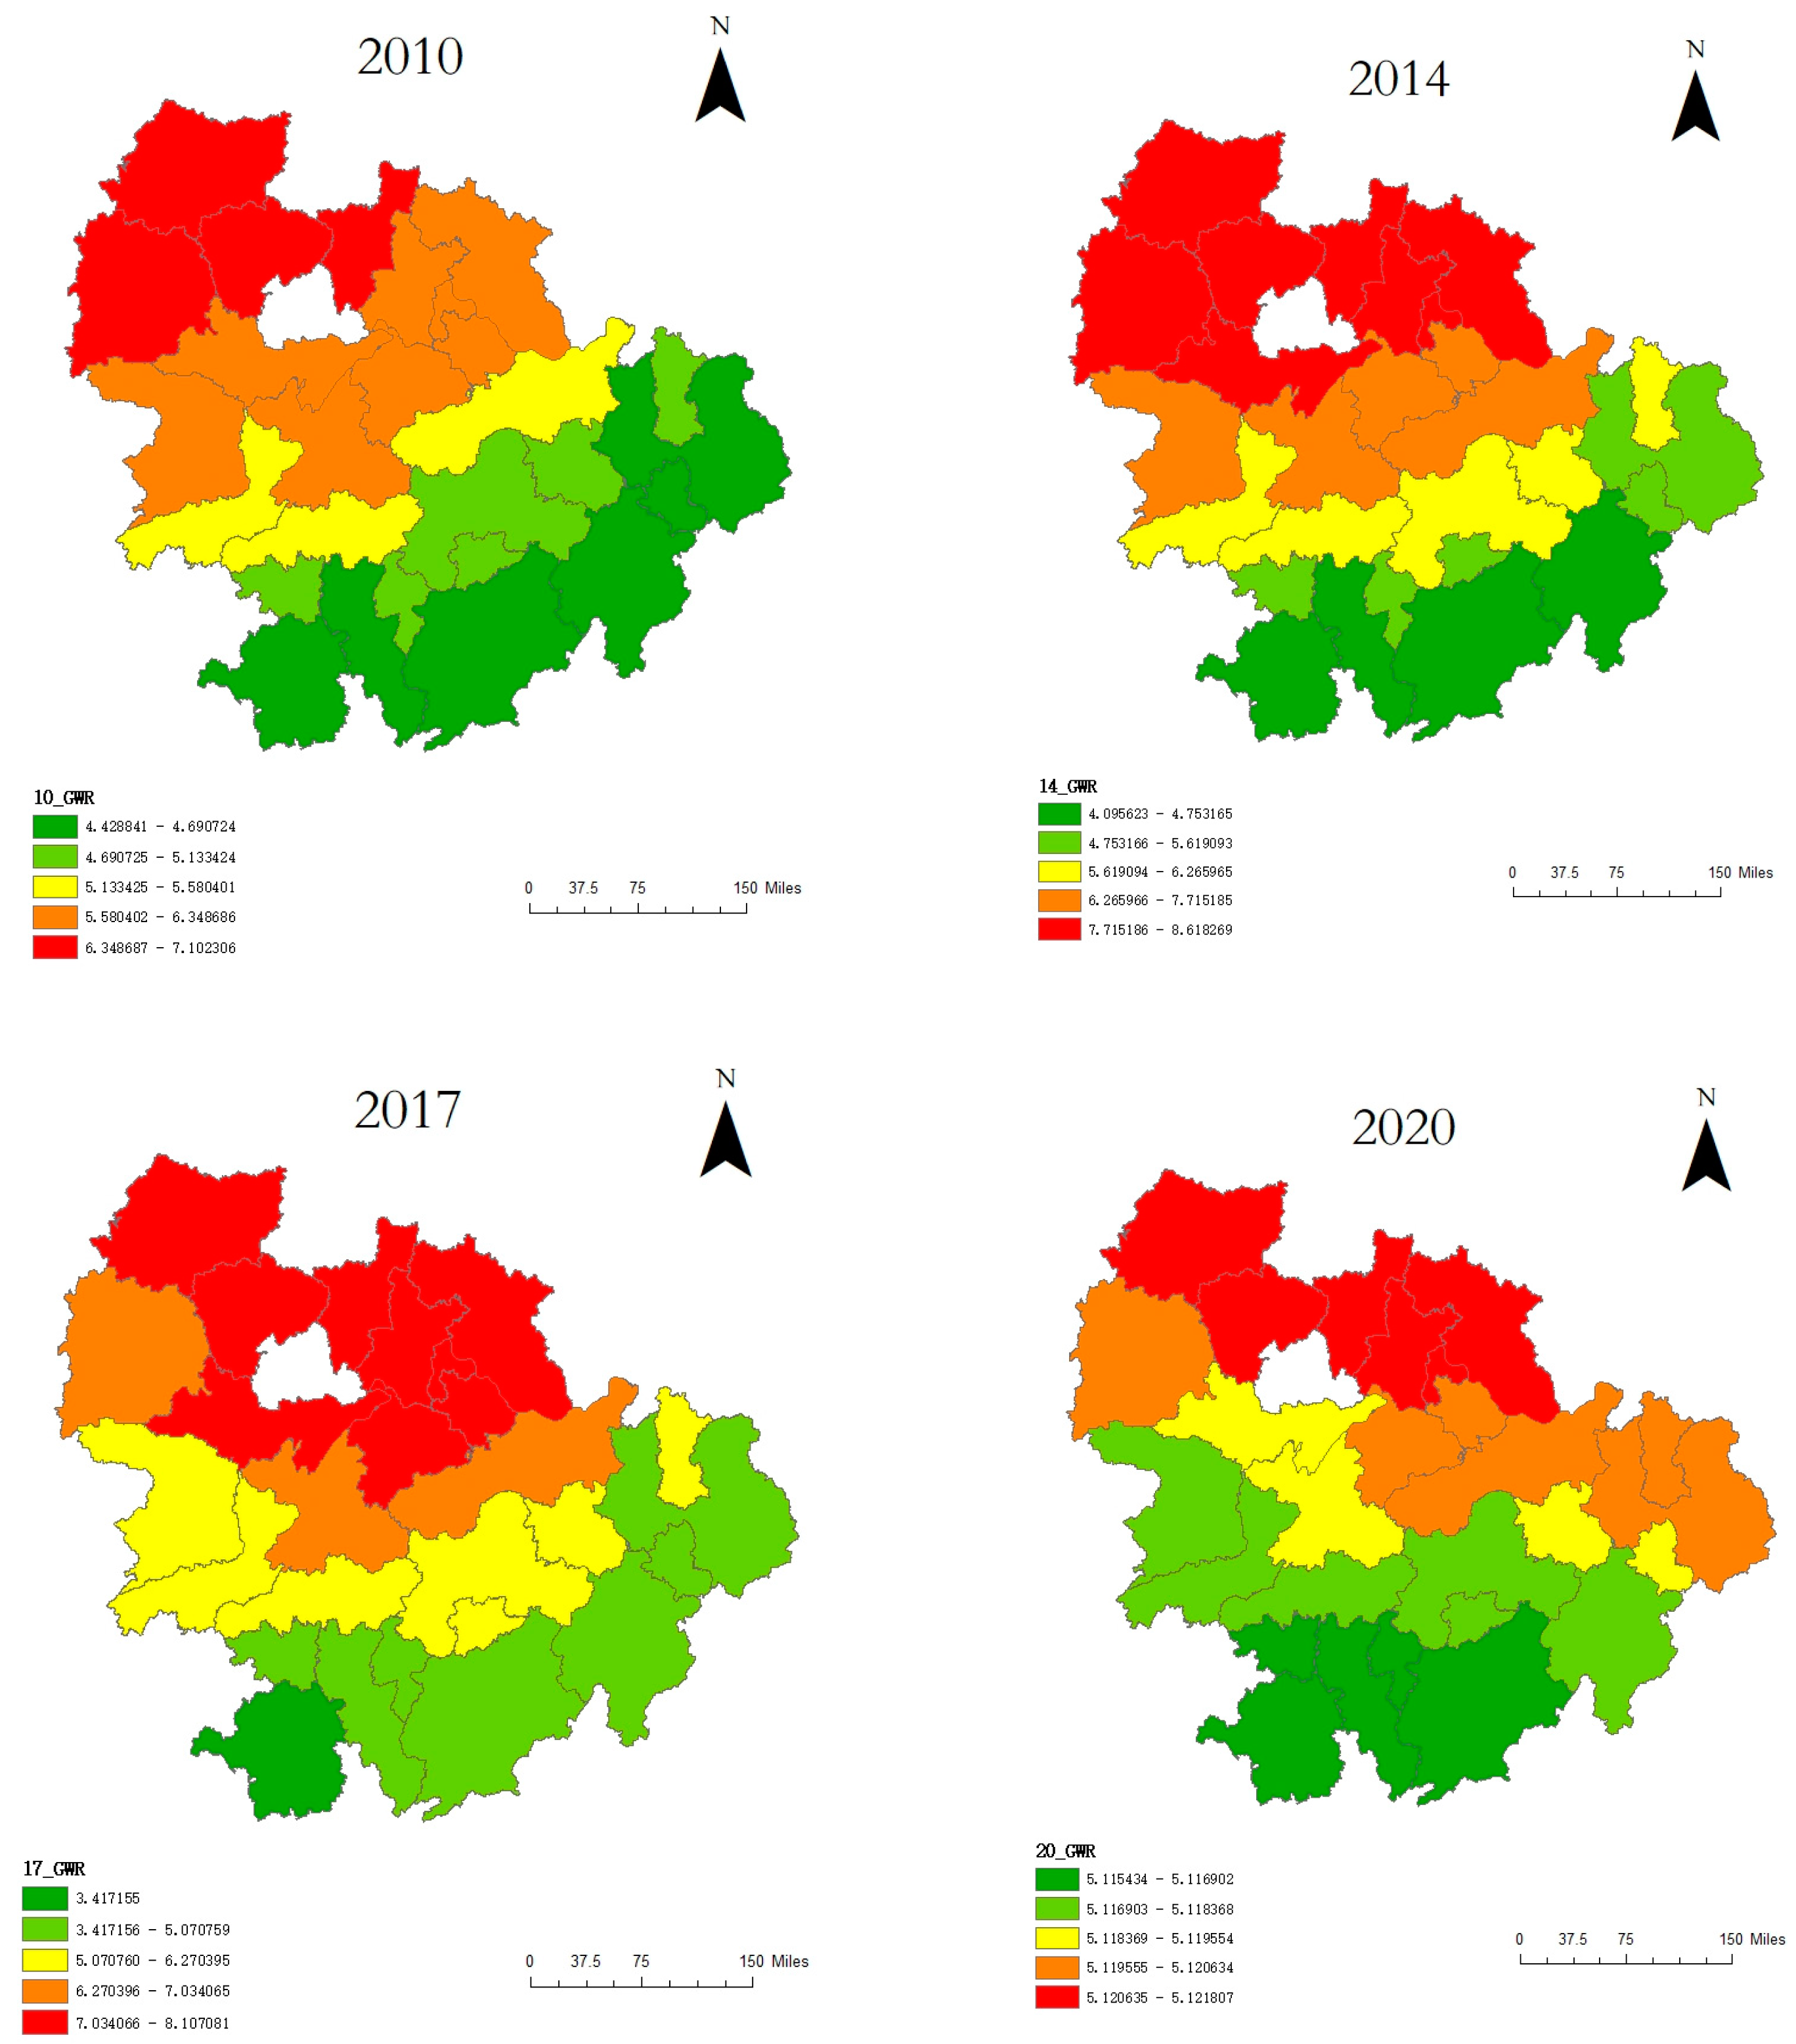
3.4. Geographically Weighted Regression Model

As the use of geographically weighted regression methods requires the exclusion of multicollinearity in the selected variables, a multicollinearity diagnosis was first performed on the selected impact factors. The magnitude of the variance inflation factor (VIF) is generally used to determine whether there is multicollinearity between factors. In Arcgis, a VIF > 7.5 is generally considered to be a problem of multicollinearity.
In this paper, with the help of SPSS, the independent variables were tested for covariance in 2010, 2014, 2017, and 2020, respectively. The variance inflation factor (VIF) values of all five independent variables were less than 7.5, and the share of output value accounted for by secondary industry (gdp2) and urbanisation rate (UR) failed the significance test in 2010, 2014, 2017, and 2020. Summing up the above results, population size (pop), GDP per capita (p_gdp), and energy intensity (c_gdp) were finally selected as the independent variables.
The following results were obtained via geographically weighted regression of Arcgis data for 2010, 2014, 2017, and 2020.

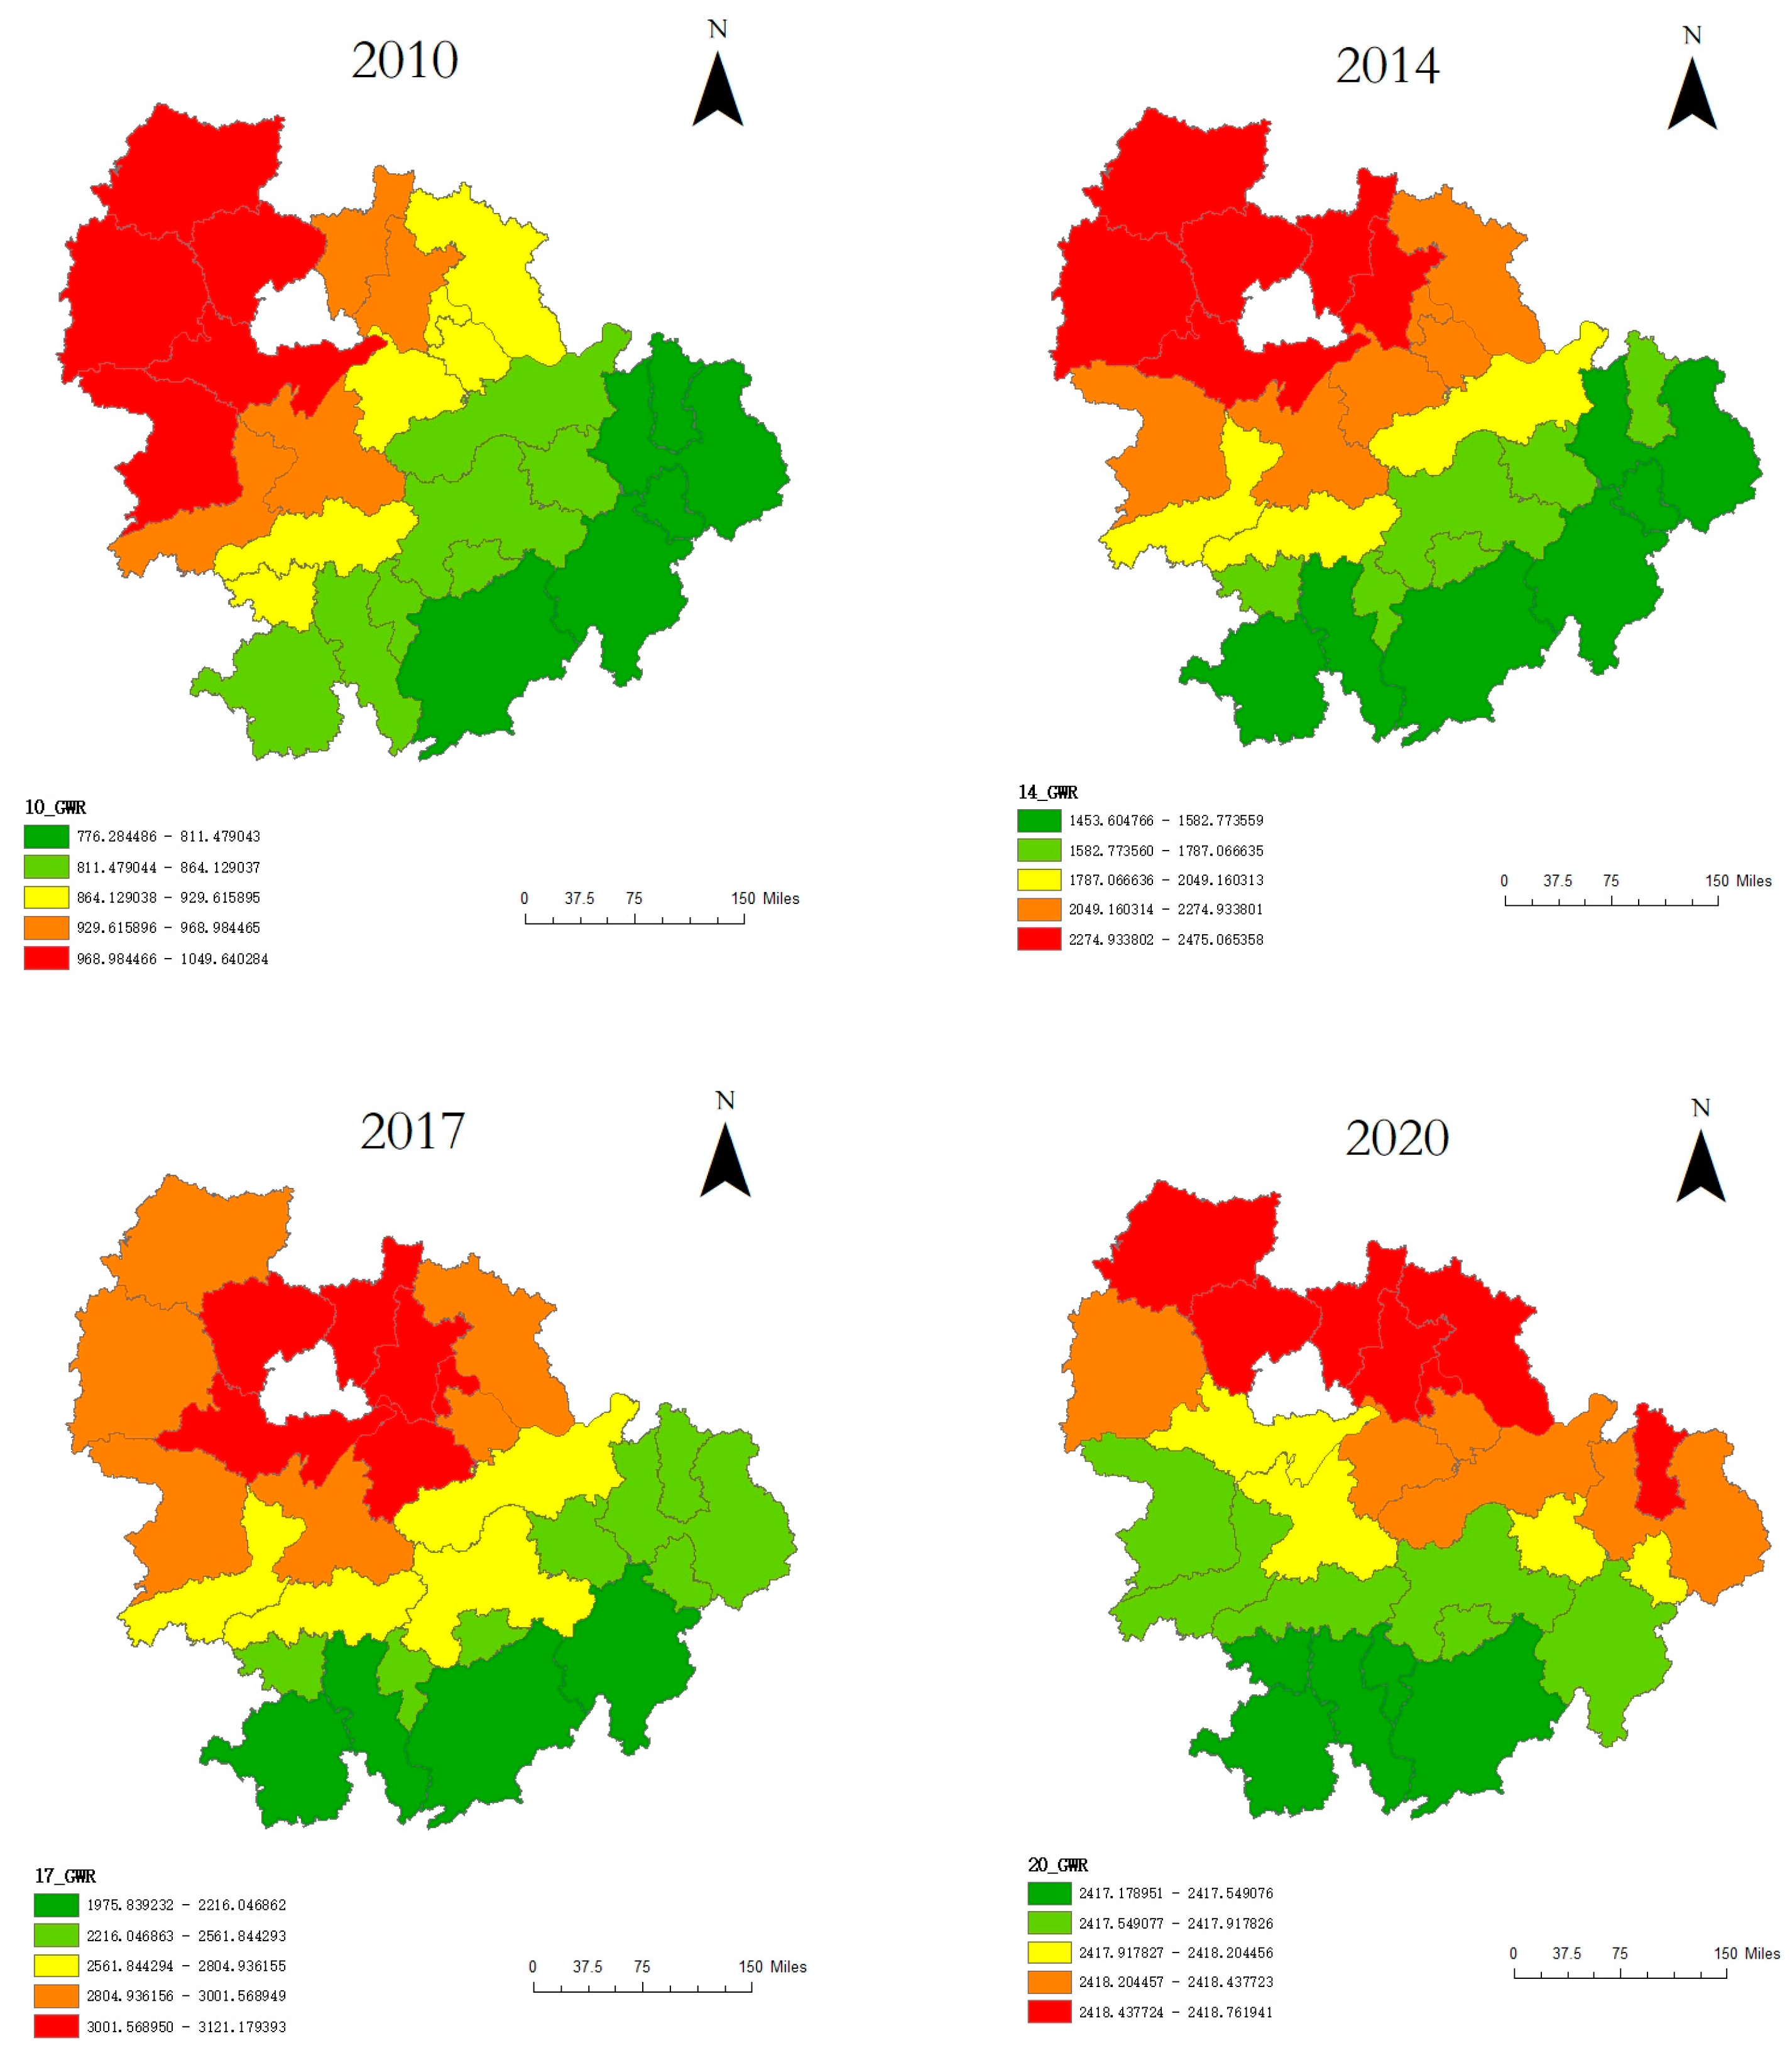
3.4.1. The Impact of Population on Carbon Emissions

According to Figure 5, it can be seen that, in 2010, 2014, 2017, and 2020, the regression coefficient of population size showed an increasing trend in spatial distribution from south to north. Moreover, there is a large intra-regional spatial distribution difference for 2010, 2014, and 2017. Comparing the differences in values for 2010, 2014, 2017, and 2020, the regression coefficient of population size generally shows a decreasing trend from 2010 to 2017 and then an increase in 2020 in terms of the absolute value of the data.
From 2010 to 2020, the spatial differences in the population size coefficients showed a trend of increasing and then decreasing, and by 2020, they narrowed to a smaller value, indicating that the contribution of population changes to carbon emissions basically converged, and the overall regression coefficient of population size has decreased. On the one hand, since the Yangtze River Central River Urban Agglomeration Development Plan came into effect in 2015, the coordinated development of cities has been vigorously promoted, gradually forming the pattern of the central river urban agglomeration, which has also led to the balanced development of the population. The impact of population size on carbon emissions is also gradually decreasing.

3.4.2. The Impact of GDP per Capita on Carbon Emissions

The spatial distribution pattern of GDP per capita regression coefficients from 2010 to 2020 shows little change, with a slight trend of high values shifting from the northeast to the northwest (Figure 6). The regression coefficient of GDP per capita shows a significant decrease in its impact on carbon emissions.
The GDP per capita regression coefficient has continued to fall, with a healthier and more sustainable increase in GDP, either due to there being more services and high-tech industries, or due to technological advances that have also reduced energy consumption in terms of output, and with all examples showing a trend of higher in the north and lower in the south.

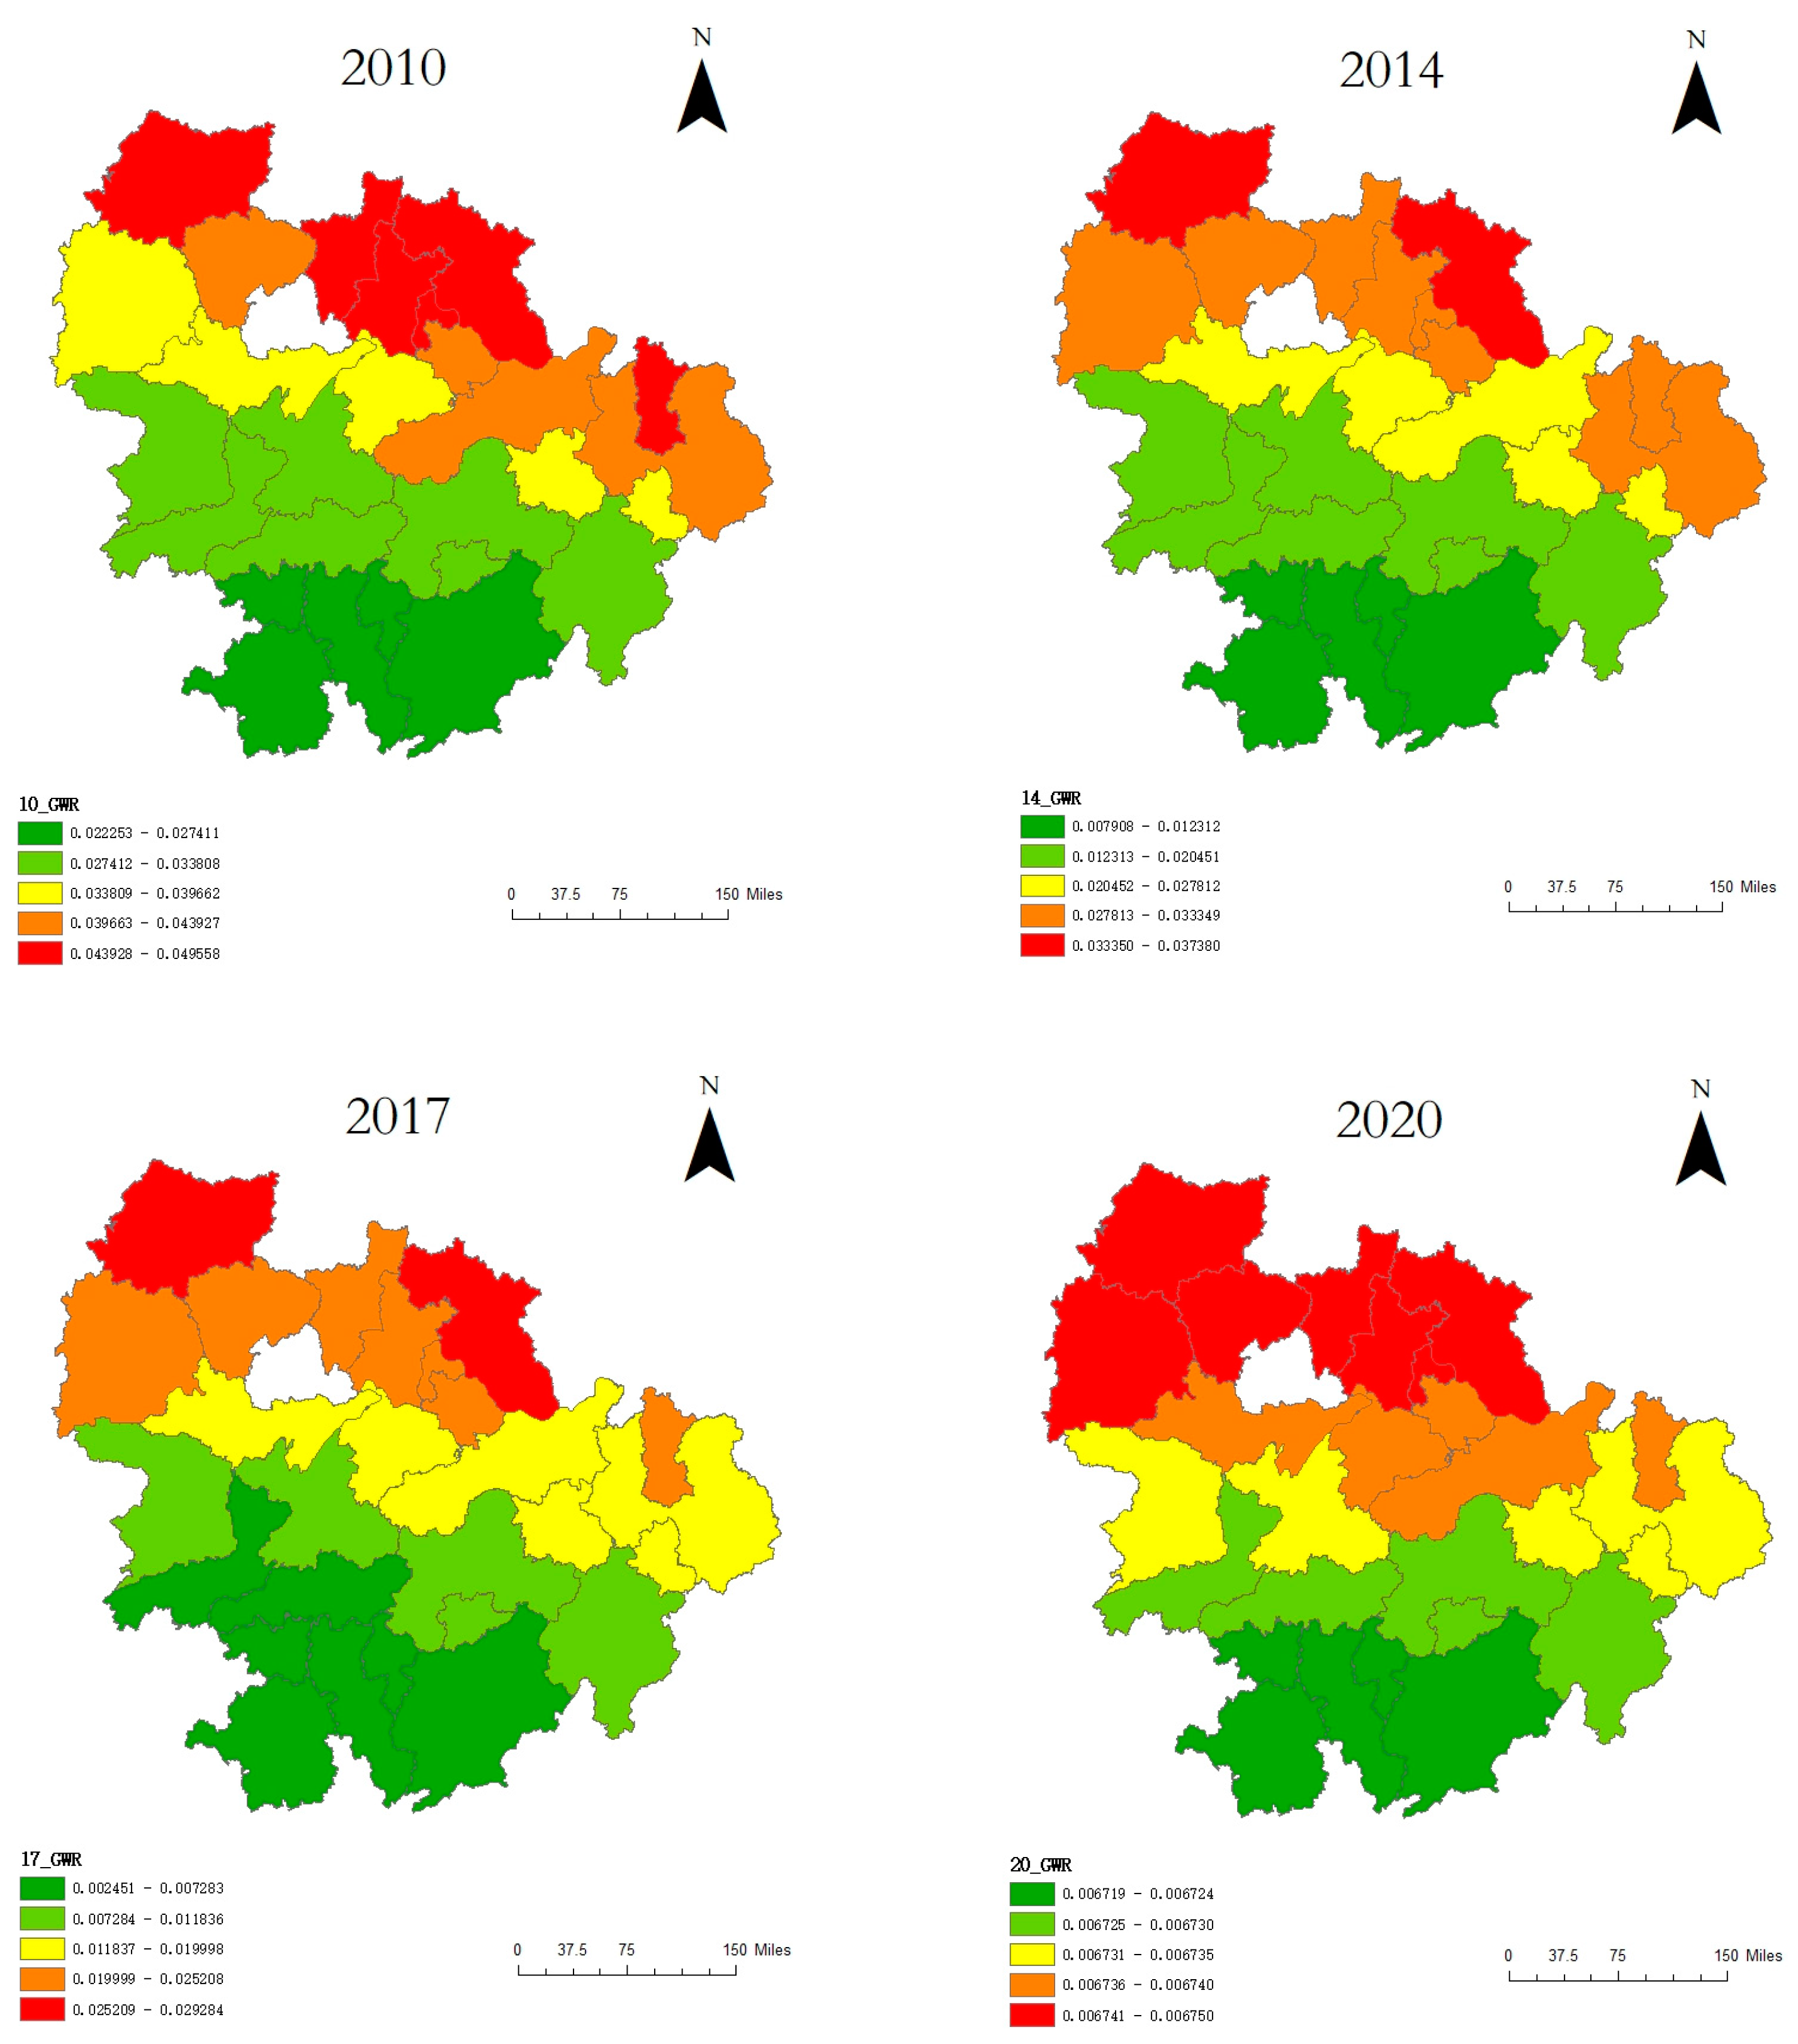
3.4.3. The Impact of Energy Intensity on Carbon Emissions

From 2010 to 2020, the regression coefficient of energy intensity in the urban agglomeration of the middle reaches of the Yangtze River showed a trend of high values spreading from the northwest towards the centre and then towards the northeast, and the spatial differences showed an increase followed by a decrease (Figure 6). This is mainly due to changes in the spatial distribution of the technological innovation capabilities within the urban agglomeration of the middle reaches of the Yangtze River. On the one hand, with technological progress, energy intensity is gradually decreasing, and its impact on carbon emissions is also decreasing. On the other hand, under the guidance of national policies such as the “Planning of the Urban Agglomeration of the Middle Reaches of the Yangtze River”, the development in technological innovation capabilities in the region is becoming more integrated. Although there is still a gap in the technological innovation capabilities within the urban agglomeration of the middle reaches of the Yangtze River, this gap is gradually narrowing as similar development plans are being implemented in the region.

4. Conclusions

(1)
In terms of total carbon emissions, the total carbon emissions of the middle reaches of the Yangtze River urban agglomeration show fluctuations between 2010 and 2020, the carbon emission reduction effect is unstable, and there is still room for more carbon emission reduction.
(2)
In terms of the spatial and temporal distribution of carbon emissions, those in the middle reaches of the Yangtze River urban agglomeration show obvious spatial variability, but the high carbon emission area is always concentrated in Wuhan and this remains unchanged.
(3)
In terms of the spatial distribution of factors influencing carbon emissions in the middle reaches of the Yangtze River urban agglomeration, in 2010, 2014, and 2017, population size was the most important factor influencing carbon emission divergence, and in terms of interaction, the interaction between energy intensity, GDP, and urbanisation was the cause of increasing carbon emissions. The impact of population size on carbon emissions has decreased from north to south, and the impact of energy intensity on carbon emissions has shown a spread from the most influential region from in the northwest to the centre and then to the northeast, while the GDP per capita has had little impact on the differences in the spatial distribution of carbon emissions.
(4)
In terms of the explanatory power of the factors influencing carbon emissions in the middle reaches of the Yangtze River urban agglomeration, given that the impact of population size on carbon emissions is weakening and will no longer be an important factor related to carbon emissions by 2020, and that the interaction between energy intensity, population size, urbanisation, and GDP capita gdp is the cause of increasing carbon emissions, carbon reduction strategies should focus on controlling energy intensity, and policies should be tailored to local conditions based on spatial differences in the degree of influence of different factors on carbon emissions.

5. Recommendations and Prospects

(1)
Strengthen technological innovation and improve energy use efficiency. The interaction between energy intensity and the level of economic development and urbanisation is the main driver of carbon emissions in the middle reaches of the Yangtze River urban agglomeration. The key factor influencing energy intensity is the development in the level of technology. The impact of energy intensity in the middle reaches of the Yangtze River urban agglomeration shows a distribution of high in the north and low in the south, and the high values are slowly shifting from the northwest to the northeast. this indicates that in the carbon emission control of the middle reaches of the Yangtze River urban agglomeration, the adjustment for Hubei cities should be prioritised more in the region, i.e., strengthening the technological innovation of Hubei cities and improving energy use efficiency, while allowing for more high-precision industries from the east coast to the central part, especially regarding the cities in the middle reaches of the Yangtze River cities in the northern part of the Yangtze River urban agglomeration.
(2)
Promote new urbanisation and build a green development city. This study also found that the urbanisation rate has been the main driver of carbon emissions in the middle reaches of the Yangtze River urban agglomeration since 2017 and 2020. Therefore, how to promote the intensive development of urban agglomeration and promote urban-rural integration and realise the promotion and popularisation of new green urbanisation in the middle reaches of the Yangtze River urban agglomeration in the process of urbanisation, are priority issues.
(3)
Based on resource endowment, optimise energy structure. The six high-energy-consuming industries in the middle reaches of the Yangtze River urban agglomeration account for a high proportion of industry and have still been on the rise in recent years. The consumption of fossil energy still accounts for a large proportion of the energy structure, and to achieve the goal of carbon peaking and carbon neutrality, it is necessary to adopt a variety of clean energy sources such as solar, wind, and geothermal energy according to local conditions. For example, Hubei province is not in a good position for photovoltaics; thus, the advantages of hydropower should be fully exploited, and wind power arrangements should be strengthened to adjust its energy structure. The economy of the Jiangxi province relies heavily on high carbon emission industries and it is difficult to adjust the industrial structure in the short term; thus, it should promote the conversion of coal to gas and coal to electricity and develop clean coal power where appropriate.

Author Contributions

Conceptualisation, methodology, validation, formal analysis, writing—original draft preparation, H.Z.; writing—review and editing, Y.L. All authors have read and agreed to the published version of the manuscript.

Funding

This research received no external funding.

Institutional Review Board Statement

Not applicable.

Informed Consent Statement

Not applicable.

Data Availability Statement

Data are available on request.

Conflicts of Interest

The authors declare no conflict of interest.

References

  1. Deng, R.; Li, Y. Measurement of carbon emission transfer in the process of undertaking domestic industrial transfer in central China. Ind. Econ. Rev. 2019, 18, 114–133. [Google Scholar]
  2. Zheng, X. Research on the construction and measurement of carbon emission accounting system for express delivery industry. Logist. Eng. Manag. 2018, 40, 103–104. [Google Scholar]
  3. Fang, C.; Zhang, G.; Xue, D. High-quality development of Chinese urban agglomerations and construction of science and technology collaborative innovation community. J. Geogr. 2021, 76, 2898–2908. [Google Scholar]
  4. Fang, C.; Ren, Y. Analysis of energy metabolic efficiency and environmental pressure of near- and long-range coupling between urbanization and ecological environment in the Beijing-Tianjin-Hebei urban agglomeration region. China Sci. Earth Sci. 2017, 47, 833–846. [Google Scholar]
  5. Fang, C.; Liang, L.; Wang, Z. Quantitative simulation and verification of the sustainable climbing law of the Beijing-Tianjin-Hebei urban agglomeration. China Sci. Earth Sci. 2020, 50, 104–121. [Google Scholar]
  6. Fang, C. The theoretical basis and regularity analysis of the synergistic development of Beijing-Tianjin-Hebei urban agglomeration. Adv. Geogr. Sci. 2017, 36, 15–24. [Google Scholar]
  7. Wei, X. Analysis of Land Use Carbon Emission Characteristics and Influencing Factors in Beijing-Tianjin-Hebei Region. Ph.D. Thesis, Xi’an University of Science and Technology, Xi’an, China, 2019. [Google Scholar]
  8. Wu, N.; Shen, R.; Zhong, S. Spatial and temporal patterns of carbon emissions from energy consumption in Jin, Shaanxi and Mongolia based on nighttime lighting data. J. Geoinf. Sci. 2019, 21, 1040–1050. [Google Scholar]
  9. Zhang, Y. Analysis of Global Regional Carbon Emission Influencing Factors Based on STIRPAT Model. Ph.D. Thesis, Northeast University of Finance and Economics, Dalian, China, 2021. [Google Scholar]
  10. Cheng, Y.; Zhang, Y.; Wang, J. Spatial and temporal evolution of China’s provincial carbon emission performance and technological innovation drivers. Geoscience 2023, 10, 1–11. [Google Scholar]
  11. Li, Z.; Ren, L.; Ma, R. Spatial and temporal patterns and drivers of carbon emissions in Zhejiang Province based on spatial and temporal geographically weighted regression models. J. Ningbo Univ. (Sci. Technol. Ed.) 2021, 34, 105–113. [Google Scholar]
  12. Xue, Y.; Xie, J.; Huai, C. Decomposition analysis of factors influencing energy carbon emissions in Beijing. Build. Energy Effic. 2022, 50, 128–132, (In Chinese and English). [Google Scholar]
  13. Zhou, A.; Wu, K. Analysis of the drivers of transportation carbon emissions in Shanghai. J. Hefei Univ. Technol. (Nat. Sci. Ed.) 2020, 43, 264–269. [Google Scholar]
  14. Cao, Z.; Zhang, X.; Zhan, X. Spatial and temporal variation of carbon emissions in counties of Shaanxi Province based on land use change and influencing factors. Soil Water Conserv. Bull. 2022, 42, 376–385. [Google Scholar]
  15. Liu, H.; Shao, M.; Ji, Y. Spatial pattern and dynamic evolution of carbon emissions in China: An empirical study based on county-level carbon emissions data. Geoscience 2021, 41, 1917–1924. [Google Scholar]
  16. Huong, T.T.; Shah, I.H.; Park, H.S. Decarbonization of Vietnam’s economy: Decomposing the drivers for a low-carbon growth. Environ. Sci. Pollut. Res. 2021, 28, 518–529. [Google Scholar] [CrossRef]
  17. Karakaya, E.; Bostan, A.; Özçağ, M. Decomposition and decoupling analysis of energy-related carbon emissions in Turkey. Environ. Sci. Pollut. Res. 2019, 26, 32080–32091. [Google Scholar] [CrossRef]
  18. Ang, B.W. LMDI decomposition approach: A guide for implementation. Energy Policy 2015, 86, 233–238. [Google Scholar] [CrossRef]
  19. Chen, F.; Zhang, J.; Ren, J. Spatial and temporal differences in carbon emissions in the Yellow River basin and the influencing factors based on LMDI model. J. Earth Environ. 2022, 13, 418–427. [Google Scholar]
  20. Zhou, Y.; Xu, Y.; Wang, X. Analysis of the change of industrial carbon emissions in Xinjiang and its influencing factors based on LMDI decomposition method. J. Xinjiang Norm. Univ. (Nat. Sci. Ed.) 2022, 41, 37–47. [Google Scholar]
  21. Ma, Y.; Shao, C. Analysis of factors influencing carbon emissions of energy consumption in the North-Shanghai-Tianjin region and study of decoupling effect based on LMDI. J. Gansu Sci. 2022, 34, 124–132. [Google Scholar]
  22. Li, J.; Huang, X.; Tui, X. Simulation of carbon emission scenarios in the Yangtze River Delta region under the background of “double carbon”. Ecol. Econ. 2022, 38, 13–18. [Google Scholar]
  23. Song, X.; Zhang, Y.; Wang, Y. Analysis of the impact of demographic factors on carbon emissions based on the IPAT extended model. Environ. Sci. Res. 2012, 25, 109–115. [Google Scholar]
  24. Wang, L.; Li, N.; He, J. Analysis of carbon emission influencing factors of transportation industry in Shaanxi Province based on STIRPAT model. Transp. Res. 2022, 8, 98–107. [Google Scholar]
  25. Behera, S.; Dash, D. The effect of urbanization, energy consumption, and foreign direct investment on the carbon dioxide emission in the SSEA (South and Southeast Asian) region. Renew. Sustain. Energy Rev. 2017, 70, 96–106. [Google Scholar] [CrossRef]
  26. Lv, Z.; Ling, D.; Chen, J. Study on the influence of energy eco-efficiency on carbon emission and spatial spillover effect–example of 110 cities in Yangtze River Economic Belt. J. Nanjing Univ. Technol. (Soc. Sci. Ed.) 2023, 22, 95–110+112. [Google Scholar]
  27. Liu, P.; Yuan, T.; Dong, H. Analysis of the spatial and temporal evolution of carbon emission intensity in “2+26” cities in Beijing, Tianjin, Hebei and surrounding areas and the influencing factors. Environ. Pollut. Prev. 2022, 44, 772–776+810. [Google Scholar]
  28. Wang, K.; Liu, Y.; Chang, G. Spatial spillover effects of tourism industry agglomeration on carbon emission efficiency of tourism. J. Ecol. 2022, 42, 3909–3918. [Google Scholar]
  29. Cheng, X.; Gai, W. Study on the spatial and temporal patterns of carbon emissions and influencing factors in five northwestern provinces. Environ. Sci. Technol. 2022, 45, 17–27. [Google Scholar]
  30. Yang, Q.; Peng, R.; Liu, X. A study on the influence of provincial carbon emissions based on geographical weighted regression. J. Environ. Eng. Technol. 2023, 13, 54–62. [Google Scholar]
  31. Wang, K.; Tang, S.; Gan, C. Spatial and temporal patterns of carbon emission intensity in China’s service sector and factors influencing it. China Popul.-Resour. Environ. 2021, 31, 23–31. [Google Scholar]
  32. Tian, J.; Zhang, J. Spatial and temporal distribution characteristics and drivers of carbon emissions in China based on geographic detectors. Ecol. Econ. 2022, 38, 13–20. [Google Scholar]
  33. Zhao, L.; Wu, D. Accounting for carbon emissions and spatial differentiation patterns on the energy supply side in China. China Popul.-Resour. Environ. 2018, 28, 48–58. [Google Scholar]
  34. Al-mulali, U. Factors affecting CO2 emission in the Middle East: A panel data analysis. Energy 2012, 44, 564–569. [Google Scholar] [CrossRef]
  35. Zeng, X.; Qiu, R.; Lin, D.; Hou, X.; Zhang, L.; Hu, X. Spatial and temporal heterogeneity of transportation carbon emissions and influencing factors in China. China Environ. Sci. 2020, 40, 4304–4313. [Google Scholar]
  36. Wang, X.; Zhou, B. Study on the influencing factors of carbon emission efficiency in BRICS countries. J. China Acad. Environ. Manag. Cadres 2018, 28, 55–58. [Google Scholar]
  37. Wang, Y.; Xie, L. Decomposition analysis of domestic carbon emission factors in Chinese cities and towns based on LMDI model and Q-type clustering. Environ. Sci. Res. 2019, 32, 539–546. [Google Scholar]
  38. Qi, H.; Shen, X.; Long, F. Spatial and temporal patterns and influencing factors of carbon emissions in Zhejiang counties. Yangtze River Basin Resour. Environ. 2023, 32, 821–831. [Google Scholar]
  39. Wang, J.; Xu, C. Geodetectors: Principles and perspectives. J. Geogr. 2017, 72, 116–134. [Google Scholar]
  40. Birdsall, N. Another Iook at Population and Global Warming Population, Health and Nutrition Policy Research; Working Paper, WPSl020; World Bank: Washington, DC, USA, 1992. [Google Scholar]
  41. Knapp, T.; Mookeriee, R.P. Growth and global CO2 Emissions. Energy Policy 1996, 24, 31–37. [Google Scholar] [CrossRef]
  42. Douglas, H.E.; Thomas, M.S. Stoking the fires? CO2 emissions and economic growth. J. Public Econ. 1995, 57, 85–101. [Google Scholar]
  43. Tian, L.; Zhang, B. Factor decomposition analysis of carbon emission changes in China. China Popul. Resour. Environ. 2011, 21, 1–7. [Google Scholar]
  44. Ang, B. Decomposition of industrial energy consumption: The energy intensity approach. Energy Econ. 1994, 16, 163–174. [Google Scholar] [CrossRef]
  45. Sahu, S.K.; Narayanan, K. Decomposition of industrial energy consumption in Indian manufacturing: The energy intensity approach. J. Environ. Manag. Tour. 2010, 1, 22–38. [Google Scholar]
  46. Zhu, C.; Ma, Z.; Wang, C.; Liu, Z. Analysis of the variance characteristics of CO2 emissions due to energy consumption in China. Ecol. Environ. 2006, 5, 1029–1034. [Google Scholar]
  47. Bi, X. Research on the mechanism of urbanization’s impact on carbon emissions. Shanghai Econ. Res. 2015, 325, 97–106. [Google Scholar]
  48. Hu, B.; Shao, J. The impact of FDI on China’s CO2 emissions—An empirical study based on spatial Durbin and multiple threshold models. J. Tianjin Univ. Commer. 2022, 42, 49–58. [Google Scholar]
  49. Wang, L. Foreign direct investment, economic growth and carbon dioxide emissions in China—An empirical study based on a biased linear additive panel model. Mod. Mark. (Low. J.) 2020, 8, 8–11. [Google Scholar]
  50. Rahman, M.M.; Alam, K. CO2 Emissions in Asia–Pacific Region: Do Energy Use, Economic Growth, Financial Development, and International Trade Have Detrimental Effects? Sustainability 2022, 14, 5420. [Google Scholar] [CrossRef]
  51. Wang, Q.; Song, X. Quantified impacts of international trade on the United States’ carbon intensity. Environ. Sci. Pollut. Res. Int. 2022, 29, 33075–33094. [Google Scholar] [CrossRef]
  52. Liu, X.; Gao, C.; Zhang, Y. Spatial heterogeneity of spatial dependence pattern of carbon intensity and its influencing factors in Chinese provinces. Geoscience 2018, 38, 681–690. [Google Scholar]
  53. Huang, R.; Wang, Z.; Ding, G. Influencing factors and trend prediction of carbon emissions from energy consumption in Jiangsu Province based on STIRPAT model. Geogr. Res. 2016, 35, 781–789. [Google Scholar]
  54. Du, L. Factors influencing carbon dioxide emissions in China: A study based on provincial panel data. South. Econ. 2010, 11, 20–33. [Google Scholar]
  55. Deng, G.; Chen, G. Characteristics of spatial and temporal distribution of carbon emissions from energy consumption and influencing factors in Lanxi urban agglomeration–based on DMSP/OLS and NPP/VIIRS nighttime lighting data. J. Xihua Univ. (Philos. Soc. Sci. Ed.) 2022, 41, 40–60. [Google Scholar]
Figure 1. Total carbon emissions of the Yangtze River midstream urban agglomeration and other internal urban agglomerations from 2010 to 2020.
Sustainability 15 10176 g001
Figure 2. Spatial distribution of total carbon emissions in 27 cities in the middle reaches of the Yangtze River in 2010, 2014, 2017 and 2020.
Sustainability 15 10176 g002
Figure 3. Explanatory power of interaction factors in 2010, 2014, 2017, and 2020.
Sustainability 15 10176 g003
Figure 4. Spatial distribution of population size regression coefficients in 2010, 2014, 2017, and 2020.
Sustainability 15 10176 g004
Figure 5. GDP per capita regression coefficient distribution by region in 2010, 2014, 2017, and 2020.
Sustainability 15 10176 g005
Figure 6. Spatial distribution of energy intensity regression coefficients in 2010, 2014, 2017, and 2020.
Sustainability 15 10176 g006
Table 1. Twenty-seven research cities in the middle reaches of the Yangtze River.
ProvinceCity
Hubei ProvinceWuhan, Jingmen, Huanggang, Xianning, Yichang, Xiangyang, Ezhou, Huangshi, Xiaogan, Jingzhou
Hunan ProvinceChangsha, Yueyang, Changde, Zhuzhou, Xiangtan, Hengyang, Yiyang
Jiangxi ProvinceNanchang, Jiujiang, Yichun, Fuzhou, Shangrao, Jingdezhen, Ji’an, Pingxiang, Yingtan
Table 2. Global Moran’s I of total carbon emissions of Yangtze River midstream urban agglomerations from 2010 to 2020.
Variable 20102011201220132014201520162017201820192020
Moran’I−0.19−0.20−0.22−0.20−0.17−0.17−0.15−0.15−0.11−0.07−0.09
Z-value−1.63−1.70−1.82−1.73−1.55−1.39−1.14−1.17−0.71−0.33−0.52
p-value 0.100.090.070.0840.120.160.260.2420.480.740.61
Table 3. Single factor detection results for 2010, 2014, 2017, and 2020.
Impact Factorq-Value
2010201420172020
Population size (pop)0.70120.70120.70130.4666
GDP per capita (p_gdp)0.37770.37740.36100.7225
Energy intensity (c_gdp)0.40190.40310.31120.2862
Share of secondary sector (gdp2)0.24320.24310.32460.1727
Urbanisation rate (ur)0.24300.26930.74080.7064
Table 4. Top five combinations for interaction factor detection in 2010, 2014, 2017, and 2020.
2010201420172020
Interaction FactorqInteraction FactorqInteraction FactorqInteraction Factorq
ur∩c_gdp0.7452pop∩c_gdp0.7087pop∩c_gdp0.7799ur∩c_gdp0.8025
c_gdp∩gdp20.7400c_gdp∩p_gdp0.7024c_gdp∩p_gdp0.6490ur∩p_gdp0.7947
pop∩c_gdp0.7215ur∩c_gdp0.7520p_gdp∩gdp20.6063pop∩c_gdp0.7688
c_gdp∩p_gdp0.6737p_gdp∩gdp20.6624ur∩c_gdp0.5401c_gdp∩p_gdp0.6868
p_gdp∩gdp20.6624ur∩c_gdp0.6121ur∩p_gdp0.5244p_gdp∩gdp20.5666
Disclaimer/Publisher’s Note: The statements, opinions and data contained in all publications are solely those of the individual author(s) and contributor(s) and not of MDPI and/or the editor(s). MDPI and/or the editor(s) disclaim responsibility for any injury to people or property resulting from any ideas, methods, instructions or products referred to in the content.

