1. Introduction
Energy consumption in the building sector has shown remarkable growth in recent years [
1] and is predicted to increase rapidly in the coming decades as well [
2]. Due to economic development and the increasing demand for indoor thermal comfort, space cooling has become the fastest-growing section of building energy consumption, which is expected to triple from 2010 to 2050 [
2,
3]. Hence, energy saving in buildings, particularly in space cooling is rather important. Improving the thermal insulation performance of the building envelope can contribute to the reduction of space cooling energy requirements [
4]. With the new generation of district heating and the increase in the proportion of renewable energy in the network, seasonal heat storage becomes crucial for the sustainable and stable operation of the system [
5]. Therefore, it is important to consider the energy efficiency of individual seasons. Luo et al. [
6] proposed a new idea to turn the building envelope into a multifunctional component that could shield the exterior heat flux while providing additional heating/cooling energy to the interior spaces.
In recent years, PCM has attracted much more attention from researchers due to its characteristics of high energy storage density and temperature variation attenuating capacity [
7]. Many studies have investigated the thermal performance of the building envelopes incorporated with PCM experimentally or numerically, in different climate regions. Khedher et al. [
8] studied the thermal performance of a combined three-layer PCM in a building envelope and used a program to analyze the thermal performance of a typical Tunisian city in summer. It was found that the octadecane layer with a thickness of 1 cm performed well in the test chamber. It was additionally noted that thickness is the key to the performance of PCM. Lei et al. [
9] applied PCM to the exterior and interior surfaces of walls, respectively, in tropical Singapore. The numerical simulation results showed that the walls installed with PCM reduced heat gains effectively throughout the whole year in the tropical region, and the walls showed a better performance when the PCM was applied to the exterior surfaces. He et al. [
10] proposed a novel wall combining PCM, micro-channel heat pipes and a radiative cooling plate, which could decrease the inner surface temperature of the wall and the cooling load of the room effectively, as indicated by the field testing results. Huakeer Wang et al. [
11] applied the PCM to the wallboards of different rooms in Shanghai. The simulation results showed that the optimal melting temperatures of PCM in the different rooms were 22~26 °C, which is the comfort temperature range for human beings. The economic results showed that the PCM integrated into the southern wall had the best economic benefit. Shilei Lu et al. [
12] integrated the PCM into a floor heating system to effectively reduce the mismatch between energy supply and demand and found that the system could provide a comfortable indoor thermal environment, while adjusting suitable operational strategies. Ben Khedher et al. [
13] combined PCM with nanomaterials to make an evaluation of nanomaterial enhancement using numerical simulation and experimental methods. The addition of nanomaterials was able to greatly improve the melting and curing rates of PCM.
In addition, a variety of novel roofs integrated with PCM were proposed, such as a roof coupled with PCM and cool materials [
11,
14] and a roof with outer-layer shape-stabilized PCM [
15]. These roofs showed a better thermal performance than ordinary roofs. The influencing factors were additionally investigated [
15,
16,
17,
18], such as the type of PCM, the thickness of the PCM, the phase transition temperature and so on. The economic benefit of the roof with PCM was taken into consideration by J. Xamán et al. [
19]. They studied a concrete roof with a PCM layer on its interior surface, in warm Mexican weather. The result showed that the roof would have a payback period of 12.18 years, less than the ordinary building service life of 30 years in Mexico. Several studies additionally gave the optimum design of the roof parameters, according to a simulation or experiment results. Bhamare et al. [
20] studied the thermal performance of a residential roof integrated with an inclined PCM layer, through the numerical model. The results indicated that the roof could maintain the ceiling temperature within a narrow range and decrease the peak heat load, and the roof showed a better thermal performance when the PCM layer was inclined at an angle of 2°. Meng et al. [
21] laid a PCM layer outside the common roof and a layer of high-reflectivity film outside the PCM layer, and the experiment results demonstrated that the new type of roof performed better than the PCM roof and common roof in the reduction of indoor air temperature, inner surface temperature and inner surface heat flux. Typically, PCMs are installed on the inside of the building envelope to regulate the indoor environment. Therefore, the PCM may not be fully cured at night because the insulation prevents heat loss to the external environment, and the heat stored in the PCM is discharged to the interior, thus not resulting in appreciable energy savings or higher energy consumption for space cooling [
22].
In addition to the application of PCM, ventilation is another efficient way to improve energy efficiency and reduce cooling loads. There are two main forms of ventilation, first including night ventilation, which could remove the heat gains during the daytime by introducing cool outdoor air to the room at night or enhance the cooling performance during the nighttime, including natural ventilation and mechanical ventilation [
23]. The other is using the hollow part of the building envelope as a ventilation duct to improve its thermal insulation performance [
24]. Regarding the former method, Ran et al. [
25] combined the nighttime ventilation with green roofs and found that when the night ventilation worked, the indoor temperature under the roof decreased as the air change rate increased, and the decrease was significant at night; Ji et al. [
26,
27] proposed a novel wall-mounted attached ventilation system for night cooling, which could generate a downward air jet that flowed over the inner surface of the west-external wall to improve the cooling performance at night. The experimental and numerical results indicated that decreasing the supply air temperature could improve the cooling performance, and the optimal air velocity was approximately 4 m/s. Another method comprising taking ventilation as a part of building envelopes was additionally a creative attempt to reduce energy consumption in buildings. A hollow block ventilation wall whose block cavity was used as a ventilation duct was proposed, and the experimental results showed that the air velocity in the cavity had a great influence on the thermal performance [
24]. In addition, hollow core slab systems were studied in the past three decades [
28,
29],and Benjamin Park et al. [
30] studied the optimal control strategies for energy savings.
Both PCM and ventilation can effectively save energy, and the experiment results of the PCM underlined the importance of coupling the PCM with ventilation to guarantee the efficacy of the PCM in reducing room loads [
16]. Therefore, the combination of PCM and ventilation came into being. Kang et al. [
31] placed the phase change boards between the ceiling and roof slab and conducted mechanical ventilation for the phase change boards at night to store the cooling energy. The results of the experiment showed that the use of the phase change board could improve the cooling potential of the roof and decrease the indoor temperature distinctly. Gunay et al. [
32] carried out a numerical investigation on the thermal response of the room equipped with a hollow core slab and found that the peak load of the room decreased obviously after adding the micro-capsuled PCMs into the hollow core. Faheem et al. [
33] integrated the microencapsulated PCM into the prefabricated hollow core slab for ventilation. The numerical simulation results showed that in a high thermal mass building, the slab’s cooling effect is better when the phase transition temperature is 20 °C, whereas the influence of ventilation speed contributed more to a low thermal mass building. Hu et al. [
34] presented a PCM-enhanced ventilated window for pre-cooling and pre-heating. The average energy savings were 0.7 MJ/day for ventilation pre-cooling and 1.6 MJ/day for ventilation pre-heating, compared to the normal ventilation window, respectively.
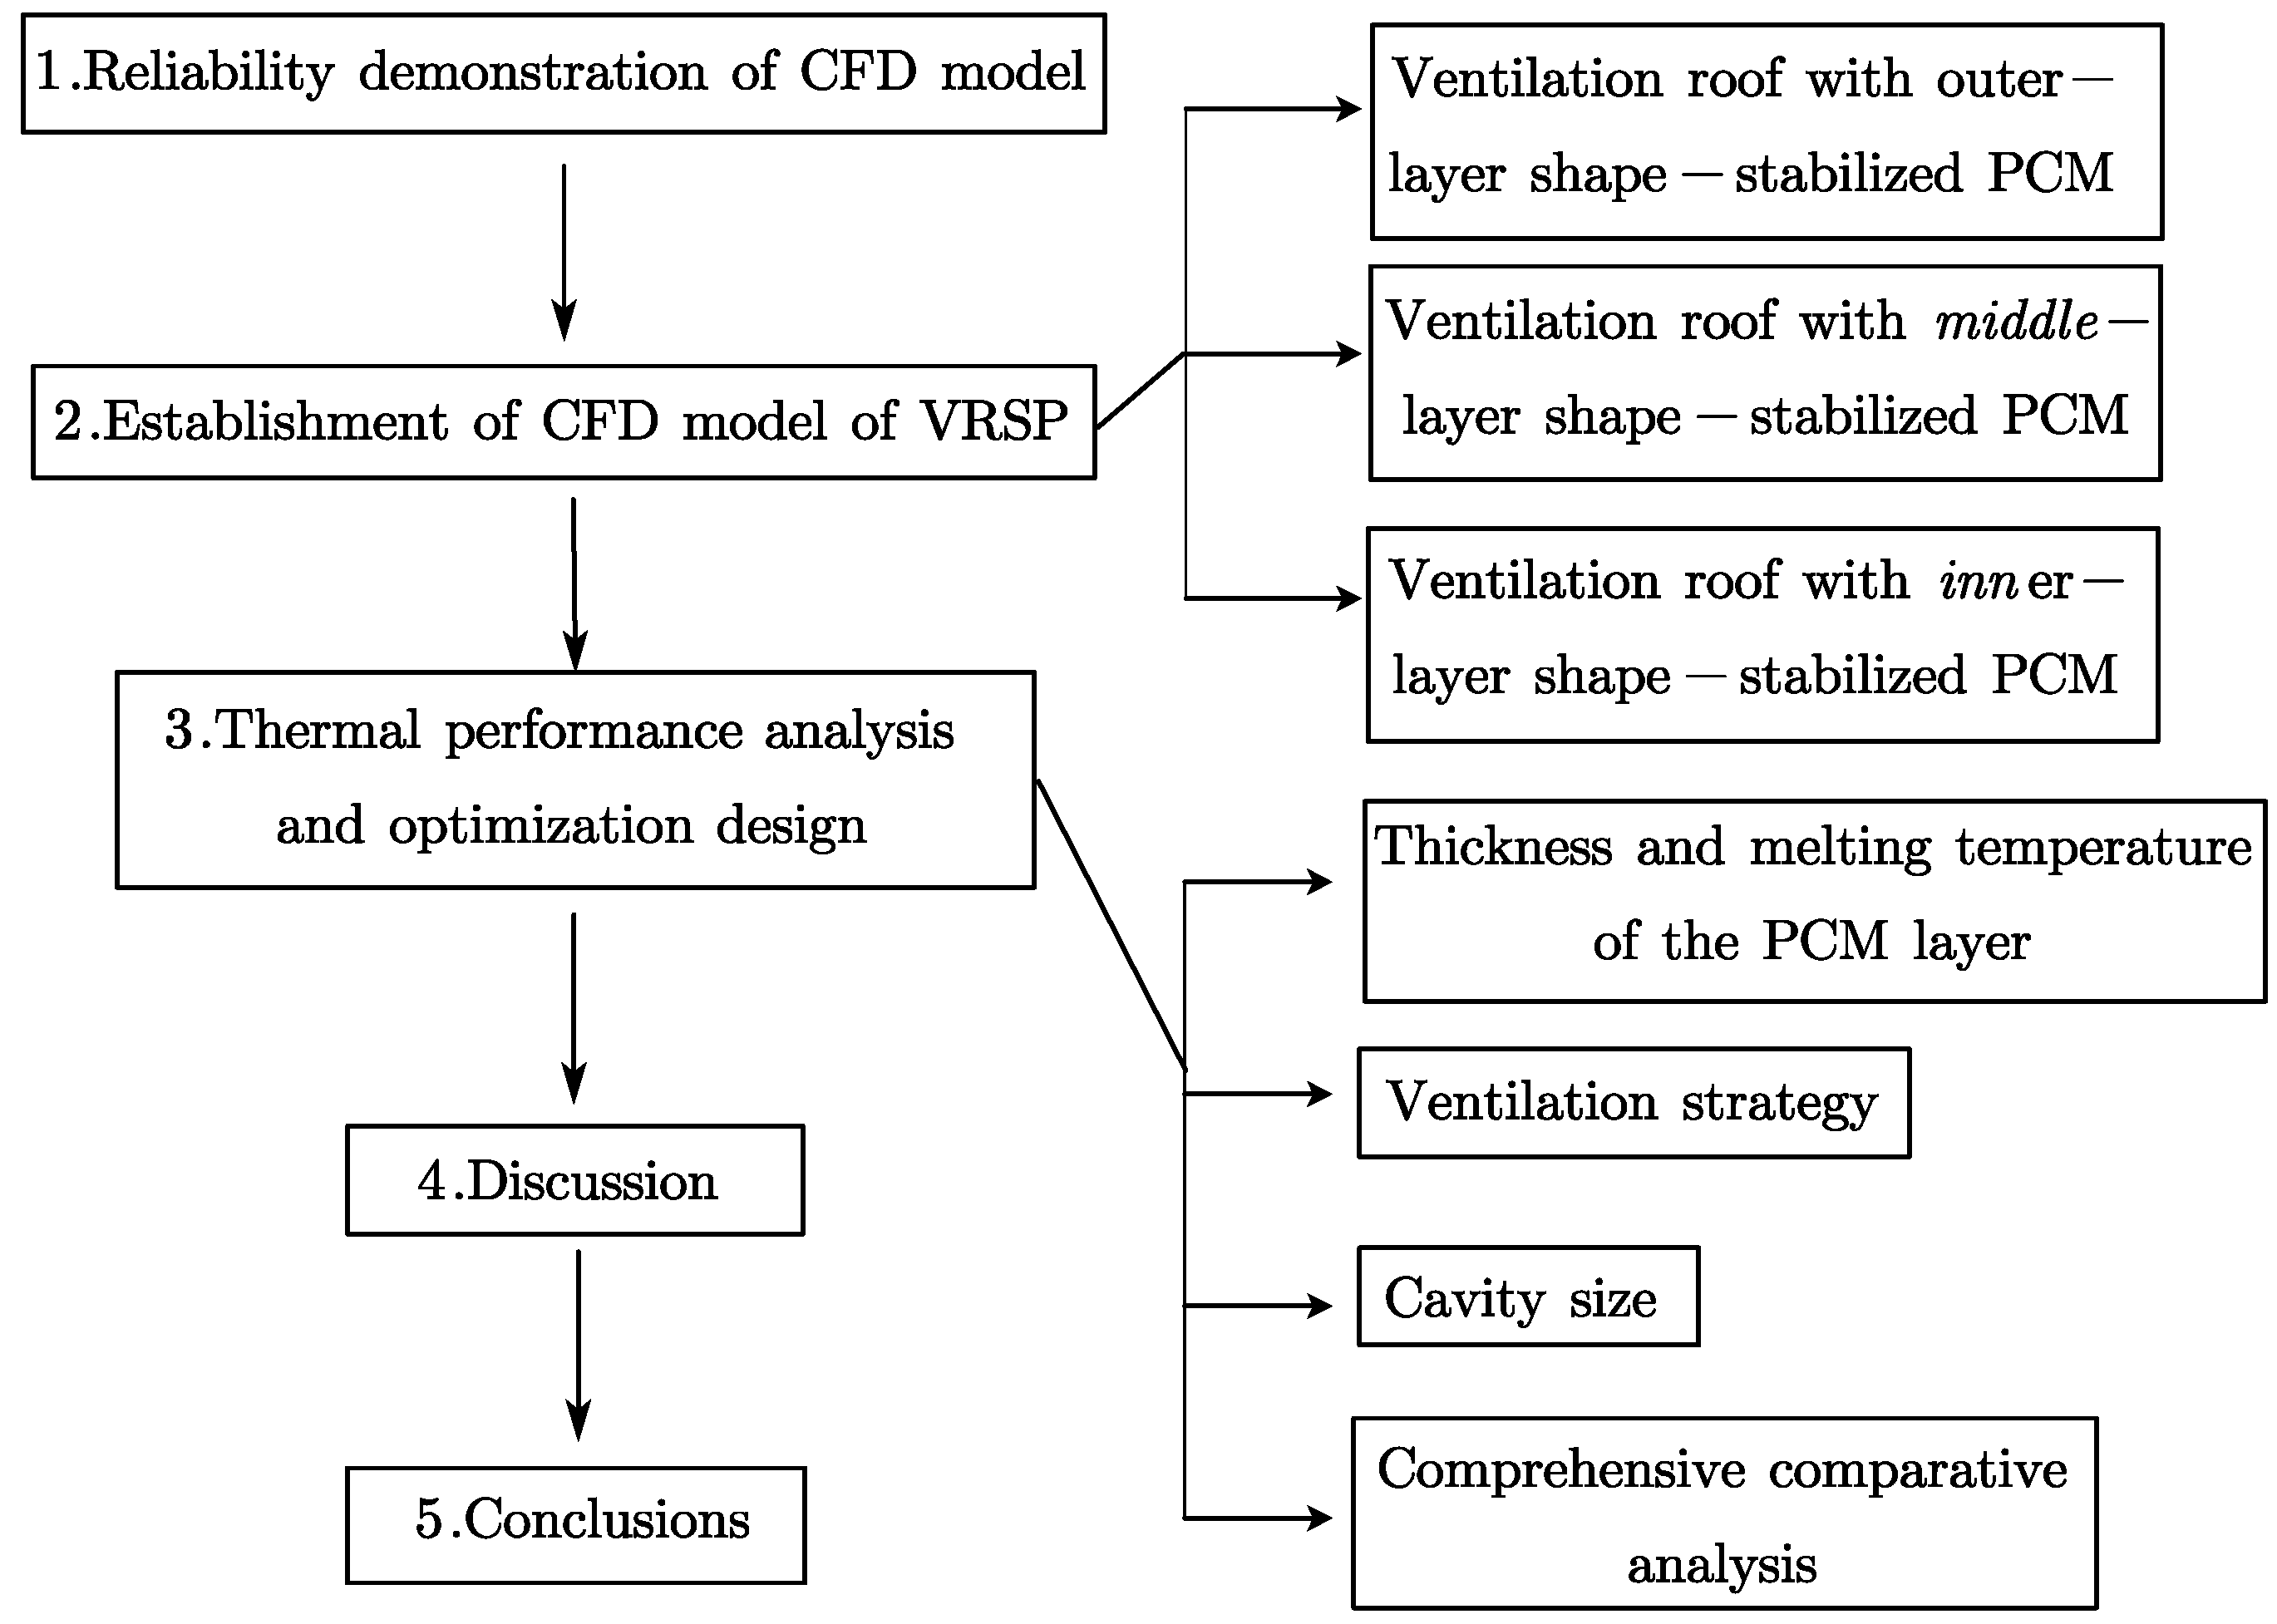
PCM is an economical and efficient building material. Latent heat storage in PCM is an efficient technology that can be applied to building envelopes and could effectively prevent over-heating in summer and decrease the indoor air temperature. Shape-stabilized PCM can be produced by immersing the porous materials of the envelope in melted PCM, or by adding PCMs to supporting materials directly. The advantage of shape-stabilized PCM is that there is no macroscopic change in the state of the composite before and after phase transition, and no container is required. The mass ratio of PCMs to supporting materials should be controlled to prevent PCMs from leaking the supporting materials during melting. This paper proposes a structure of a ventilation roof with shape-stabilized PCM. The prefabricated concrete hollow core slab is the roof’s main structure, which is used to bear the pressure of the roof to such an extent and needs to reach the strength required by the design; nighttime ventilation is carried out through the cavity of the slab to remove the solidification heat of PCM. Hollow core panels are commonly used in rural areas of China. They can be ventilated within their cavities to remove heat and are a common energy-saving technology for energy-saving buildings. Waterproof layer materials can be selected according to specific needs, and waterproof membranes are used in this study. The position of PCM has an important effect on the thermal insulation of the roof, because the thermal performance of the roof varies greatly when PCM is located in different positions. Existing studies usually place the PCM in the middle layer of the roof; however, few scholars have investigated the optimal location of PCM. The innovations of this study are as follows: (i) The coupling applications of PCM and ventilation to roofs are studied; (ii) the influences of different locations and the thermal properties of PCM on the VRSP are considered; and (iii) the effects of ventilation on roof thermal insulation and the improvement of the latent heat utilization ratio of PCM are investigated. The PCM placed at three positions is studied, namely, below the ventilation layer, between the screed coat and the ventilation layer and above the screed coat layer. The thermal performance of the structure, the optimum PCM layer thickness and melting temperature and the cavity’s ventilation strategy under the different positions of the PCM layer are studied by computational fluid dynamics (CFD) numerical simulation, and the best position of the PCM and the best ventilation speed are determined.
There are five sections in this study. Section One introduces the background and the literature review. Section Two presents the research methodology, theoretical basis, research content and boundary conditions. Section Three shows the results of the study and provides analysis. Section Four develops the discussion of this roof structure and related studies. Section Five concludes the whole article.
Figure 1 shows the flow diagram of the study.
3. Results and Analysis
3.1. Thermal Performance Influencing Factors Analysis of Different VRSPs
The thermal performance of VRSP depends on the material properties and physical dimensions of each layer and the ventilation control method. The effects of the thickness and melting temperature of PCM, ventilation control method and cavity size on the thermal performance of the three kinds of VRSP were studied with the CFD simulation software, respectively. Time lag and decrement factor (the ratio of the inner surface temperature amplitude to the outer surface temperature amplitude during a day) were used for the thermal performance evaluation of VRSP.
To access the suitable PCM thickness, the liquid fraction
and utilization rate of latent heat
are used to evaluate the PCM and determine the thickness of the PCM. The liquid fraction
is defined as follows:
In this equation, and are the solid temperature and liquid temperature, respectively (K). When the temperature is between the and , the phase transition process will occur, which is defined as the phase transition temperature.
PCM was divided into several sub-layers every 5 mm to investigate the application of PCM. The utilization rate of latent heat in a certain sub-layer is the difference between the maximum liquid fraction and the minimum liquid fraction during a day. The value ranges from 0 to 1.0, where 0 means the solid state for liquid phase rate, 0–1 is the solid–liquid coexistence, i.e., melting state and 1 is the liquid state, i.e., completely melted state. The average utilization rate of latent heat in PCM is the mean value of . The maximum liquid fraction appears during the daytime. If the 1, it means that part of the PCM is not melted and is too thick. The minimum liquid fraction appears at night. If the , it means that part of the PCM is not solidified, and the temperature of the PCM is too high to solidify completely.
3.1.1. Thickness and Melting Temperature of PCM
The influence of the thickness and melting temperature of PCM on the thermal performance of the VRSPs on a typical summer day in Wuhan was simulated and analyzed. The ventilation speed in the ventilation duct is usually 0–3 m/s, considering the noise problem. In the case study on thickness and melting temperature analysis of PCM, the cavity radius of the slab is 40 mm, ventilation speed is 1.0 m/s and the ventilation time at night is automatically controlled by comparing the ambient air temperature and the bottom surface temperature in the middle cross-section of the cavity. Different types of paraffin can produce PCMs with different melting temperatures. The thermal properties with similar phase transition temperatures show little change. Here, it is assumed that the thermal properties including density, thermal conductivity and latent heat remain constant when the phase change temperature is changed, to analyze the influence of the phase change temperature on the thermal characteristics of the structure. When the PCM is located at different positions, the temperature and heat transfer of the PCM are different. The temperature of PCM is higher at the upper layer and lower at the middle layer. Therefore, in roofs with different PCM positions, there are different optimal phase change temperatures and PCM thicknesses. Therefore, different values are simulated for comparative analysis to achieve the best performance of the structure.
- (1)
VRSPM
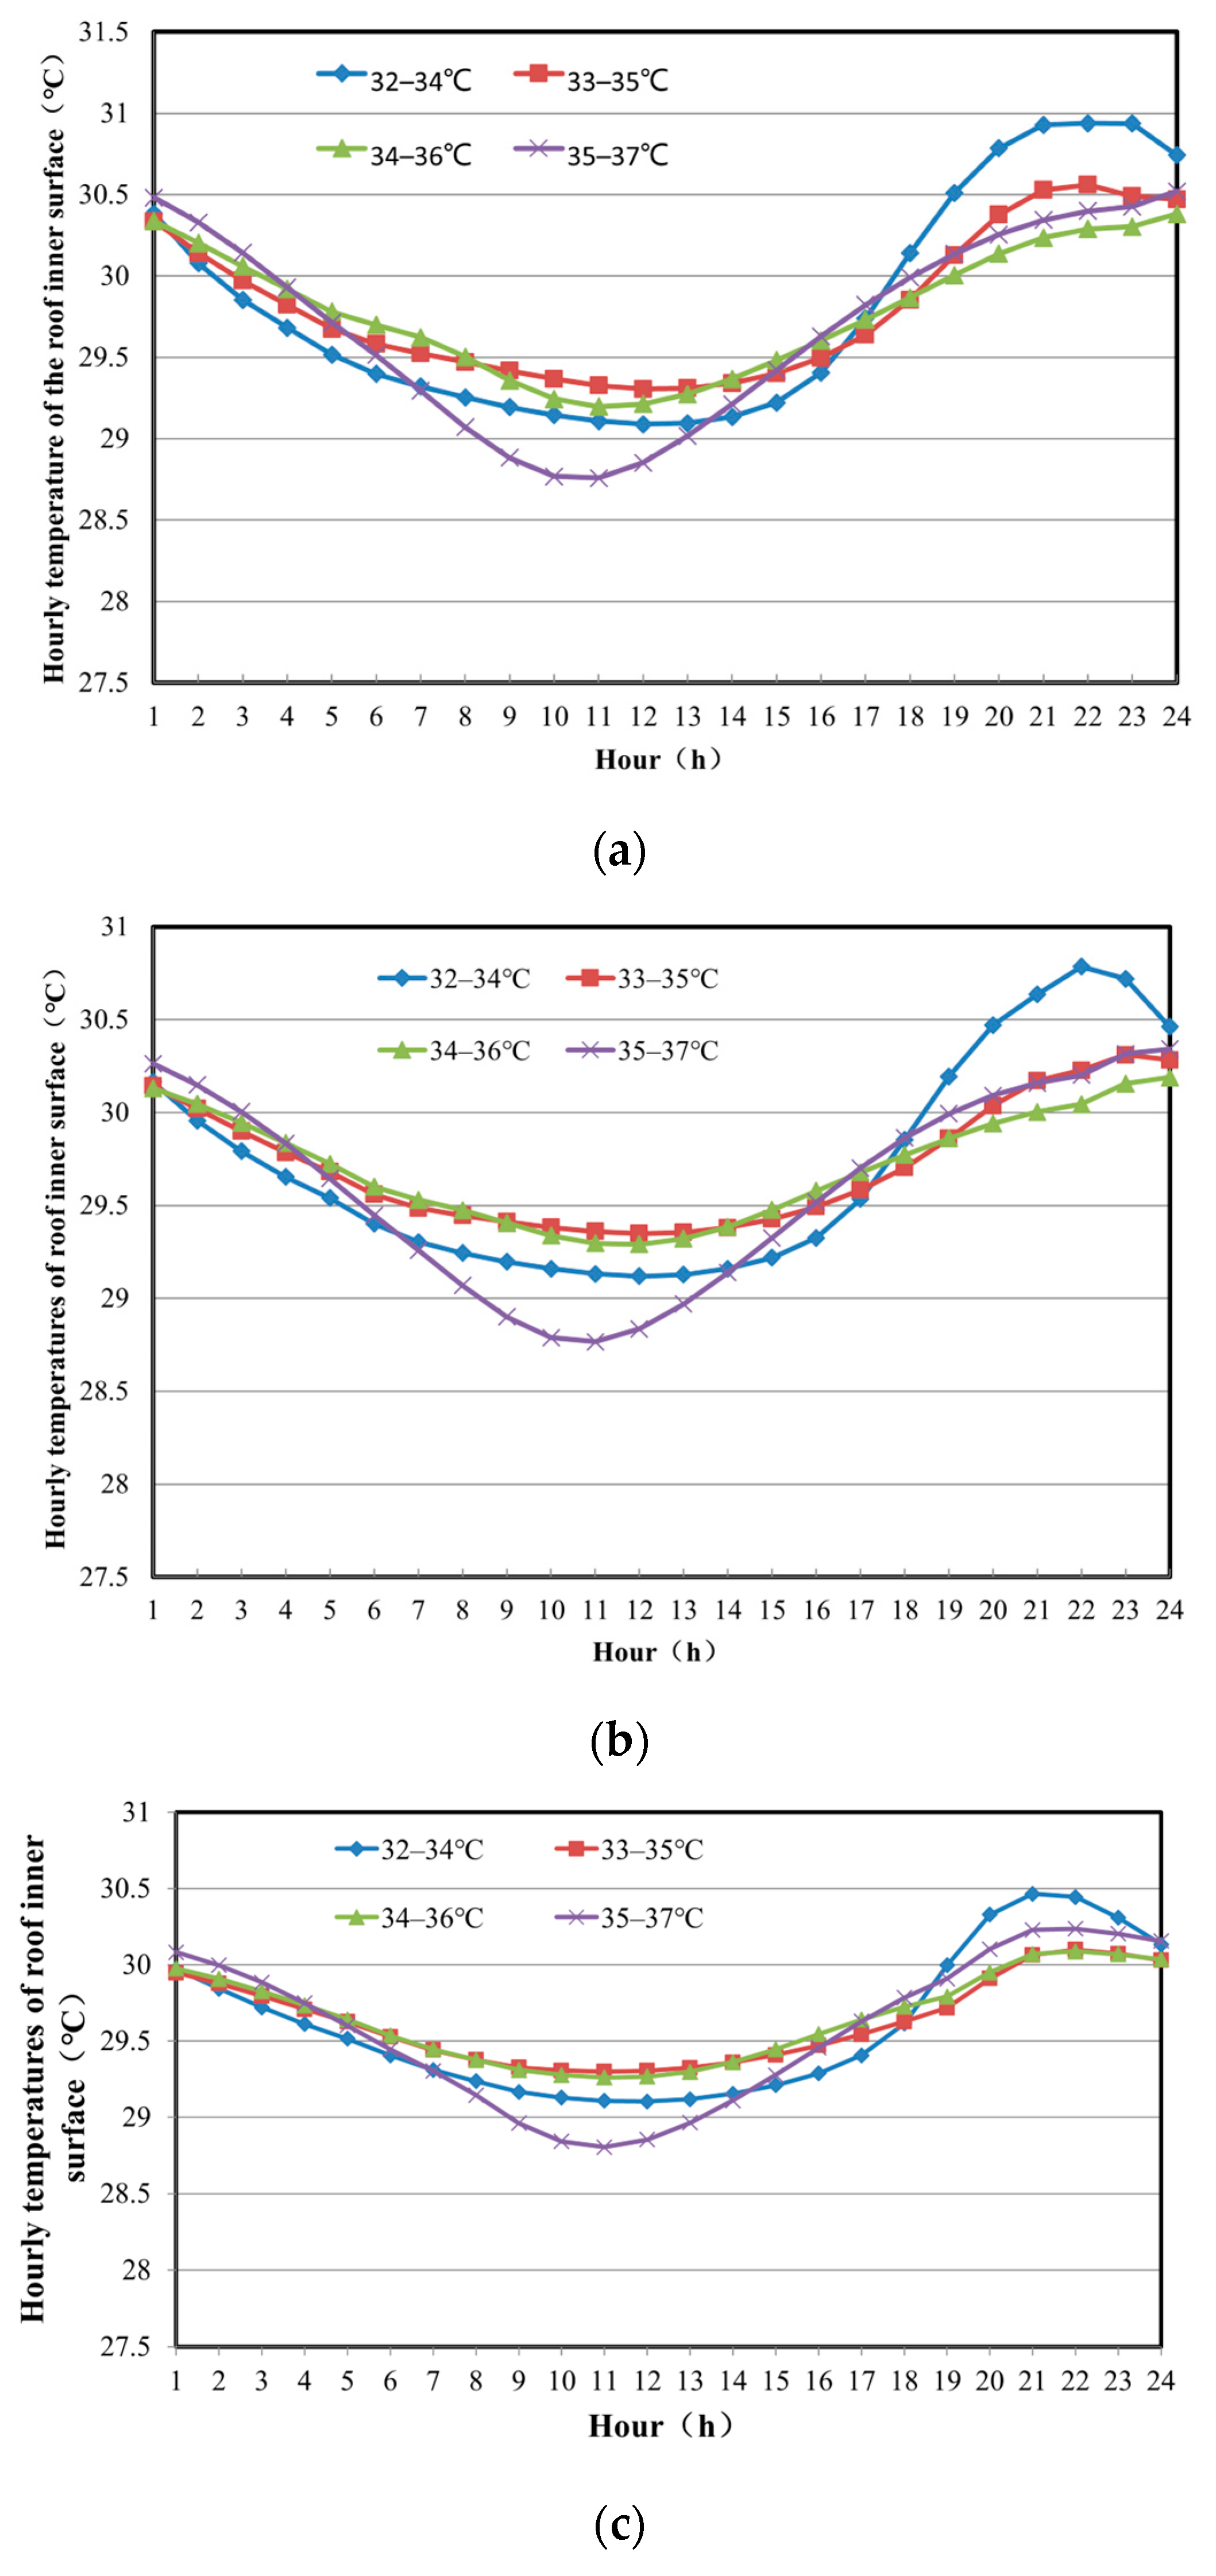
With the shape-stabilized PCM placed in the middle layer, the inner surface hourly temperature and thermal performance of the roof with different thicknesses (20 mm, 25 mm and 30 mm) and melting temperatures (32~34 °C, 33~35 °C, 34~36 °C and 35~37 °C) are shown as
Figure 11 and
Table 5.
As is shown in
Figure 11 and
Table 5, with the increase in PCM layer thickness, the peak temperature and temperature amplitude of the roof’s inner surface as well as the decrement factor gradually decrease, and the time lag increases, indicating that the thicker the PCM layer, the better the insulation effect. With the increase in PCM layer thickness, the average utilization rate of latent heat in PCM (UR) decreases. That is because the PCM cannot melt or solidify completely in the phase transition cycle throughout the day as the thickness grows. Consequently, when the thickness of PCM is 20 mm, the UR is up to 100%, whereas it does not happen when the thickness exceeds 20 mm. Therefore, the PCM layer thickness should be properly determined to achieve high thermal performance and a high utilization rate of latent heat at the same time.
Figure 12 shows the liquid fraction of 25 mm PCM with different melting temperatures. When the phase transition temperatures are 32–34 °C, 33–35 °C, 34–36 °C and 35–37 °C, the URs are 60.3%, 81.9%, 84.6% and 64.6%, respectively. As the melting temperature increases, the UR first increases and then decreases, reaching its highest at a melting temperature range of 34–36 °C. When the phase transition temperature is 32–34 °C, the maximum liquid fraction of each layer is 100%, the minimum liquid fraction of each layer is 27.8~49.0% and the average UR of all layers is 60.31%. As the melting temperature increases (here the melting temperature is assumed to be the same as solidification temperature), the minimum liquid fractions of all layers and the maximum liquid fractions of some layers decrease; therefore, the average UR first increases and then decreases. From
Figure 12a,b, it can be seen that at low melting temperatures, the liquid phase ratio of PCM sub-layers can reach 1 however not 0. That is, the phase change temperature is low; the PCM layers can be completely melted however not completely solidified. From
Figure 12c,d, it can be seen that at higher melting temperatures, the liquid phase ratio of PCM sub-layers can reach 0 however not 1. That is, the PCM layers can be completely solidified however not completely melted; they can only be partially melted. We can additionally conclude that when the melting temperature is low, it is difficult to reach the solidification temperature at night, which leads to a low UR; when the melting temperature is high, the PCM cannot melt completely during the daytime, which additionally leads to a low UR. Thus, there is an optimal melting temperature range. The liquid fractions of PCM with different melting temperatures are shown in
Figure 13.
As the melting temperature increases, the minimum temperature and average temperature of the inner surface reduce slightly, whereas the peak temperature, temperature amplitude and DF first decrease and then increase. The optimum melting temperature is 34~36 °C at different thicknesses of PCM, because the average utilization rate of latent heat is the highest, and the average temperature of the inner surface is the lowest. When the thickness of PCM is 20 mm, the average utilization rate of PCM is up to 100%; however, the thickness is too small to decrease the roof inner surface temperature effectively. However, when the thickness of PCM is 30 mm, the average utilization rate of the latent heat of PCM is only 75.32%. Consequently, a large part of PCM is not utilized effectively, leading to a poor economy. Therefore, 25 mm is the appropriate thickness.
- (2)
The VRSPo
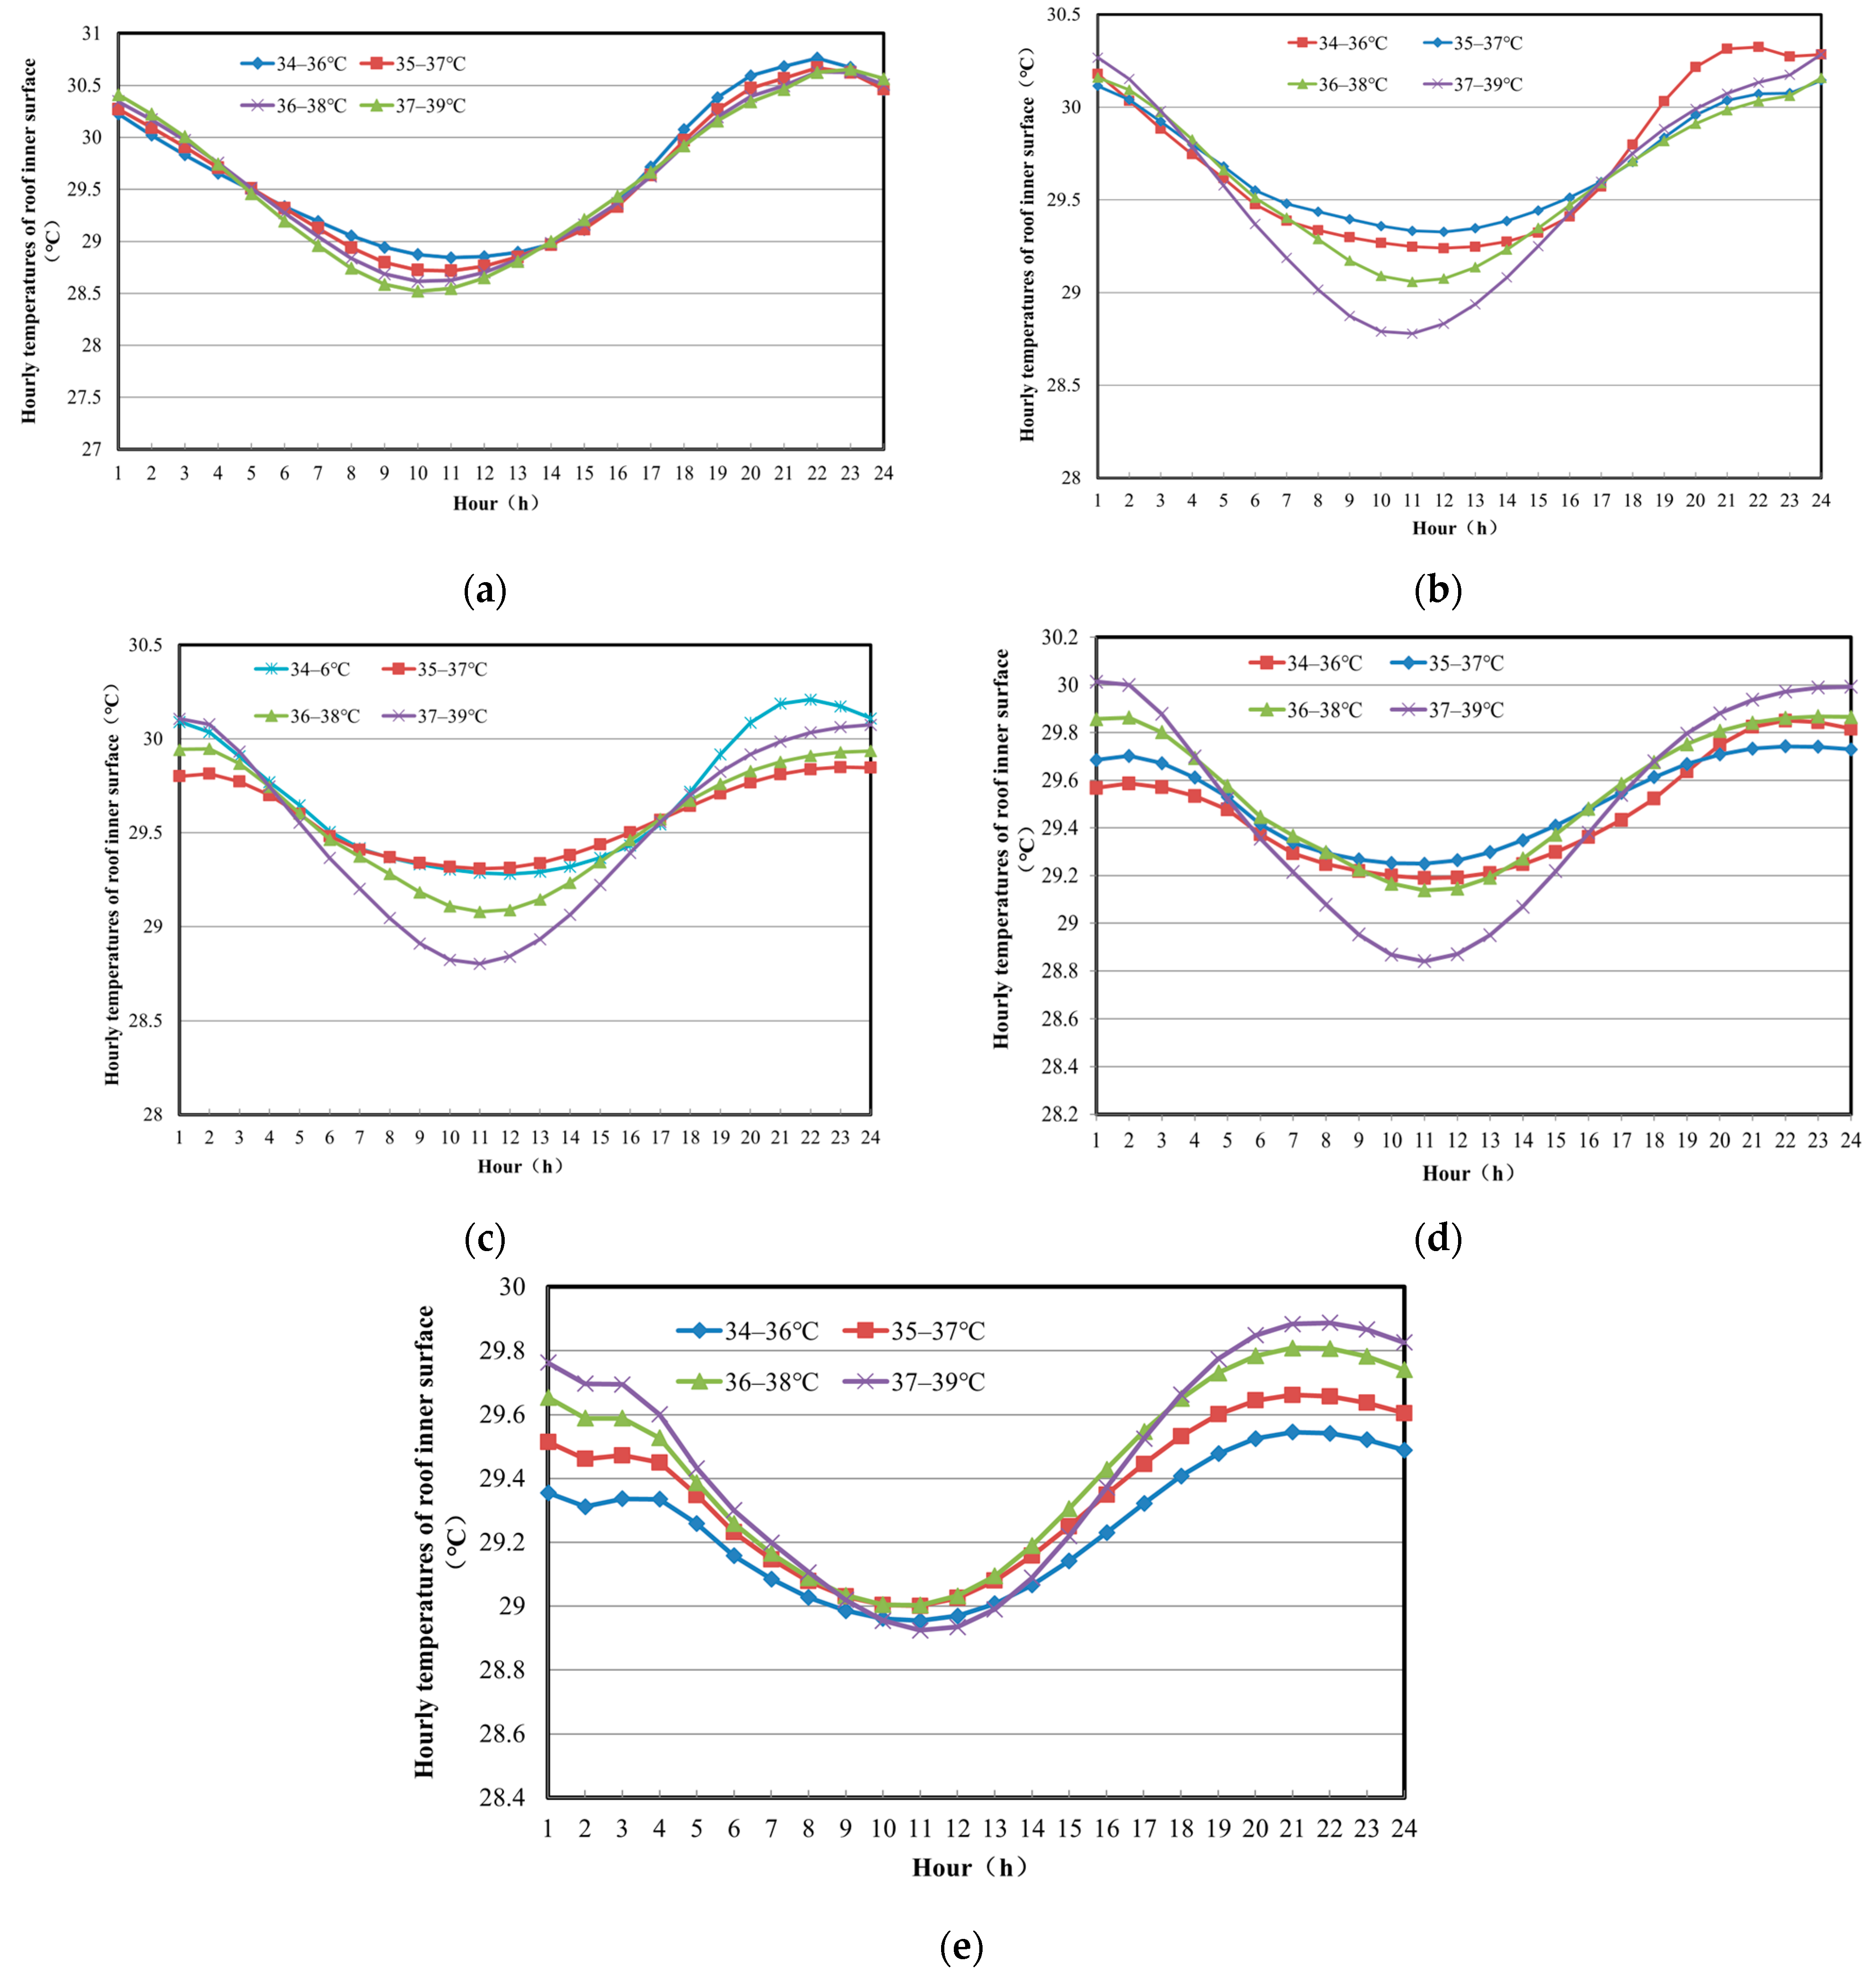
With the shape-stabilized PCM placed in the upper layer, the thermal performance of the roofs with different PCM thicknesses (20 mm, 30 mm, 35 mm, 40 mm and 50 mm) and different melting temperatures (34~36 °C, 35~37 °C, 36~38 °C and 37~39 °C) is shown in
Figure 14 and
Table 6.
Due to space limitations, in the analysis of the thermal performance of VRSP
o and VRSP
I, the hourly liquid phase ratio of PCM was not depicted; however, the latent heat utilization rate was directly calculated. As
Figure 14 and
Table 6 show, the influences of the melting temperature and thickness on the thermal performance of VRSP
O are consistent with the VRSP
M. Comparing the thermal performance and latent heat utilization rate of PCM comprehensively, it can be concluded that, for the VRSP
O, the optimum thickness of PCM is 35 mm, and the optimum melting temperature is 35~37 °C. At the optimum condition, the average inner surface temperature is 29.58 °C, the decrement factor is 0.019, the time lag is 10 h, and the utilization rate of latent heat in PCM is 96.05%.
- (3)
The VRSPI
With the shape-stabilized PCM placed in the inside layer, the hourly temperatures of the inner surface and the thermal performance evaluation indexes of VRSP
I with different PCM layer thicknesses (15 mm, 20 mm and 25 mm) and different melting temperatures (28~30 °C, 29~31 °C and 30~32 °C) are shown in
Figure 15 and
Table 7.
As
Figure 15 and
Table 7 show, with the increase in thickness of PCM, the roof shows better heat insulation; however, the average utilization rate of latent heat decreases gradually. When the thickness of PCM is 20 mm or 25 mm, the average utilization rate of latent heat is lower than 50%. When the thickness of PCM is 15 mm, the average utilization rate of latent heat is the highest, at 61.30%. In addition, with the increase in melting temperature, the effect of thermal insulation and the utilization rate of latent heat are improved.
Therefore, to achieve better thermal performance and a higher utilization rate of latent heat, the optimum thickness of PCM is 15 mm, and the optimum melting temperature is 30~32 °C for the VRSPI.
3.1.2. Mechanical Ventilation Speed
Based on the above research, this section studies the influence of different ventilation speeds (0.5 m/s, 1.0 m/s, 1.5 m/s, 2.0 m/s and 2.5 m/s) on the thermal performance of VRSP with the conditions of the optimum thickness of PCM and the optimum melting temperature of VRSP.
- (1)
The VRSPM
With the thickness of PCM at 25 mm and the melting temperature at 33~35 °C, the hourly temperatures of the roof’s inner surface and cavity ventilation times of the VRSP
M at different ventilation speeds are shown in
Figure 16. The thermal performance evaluation indexes of the roof are shown in
Table 8. With the ventilation speed increasing, the peak temperature, minimum temperature, average temperature and temperature amplitude of the roof’s inner surface all decrease, whereas the average latent heat utilization rate of PCM is growing. The fitting curve between the average temperature of the roof’s inner surface and ventilation speed is shown in
Figure 17. According to the fitting formula, when the ventilation speed is 2.5 m/s, the decreasing speed of the roof’s inner surface average temperature is 0, and the roof’s inner surface temperature is the lowest. Therefore, the optimum ventilation speed is 2.5 m/s.
- (2)
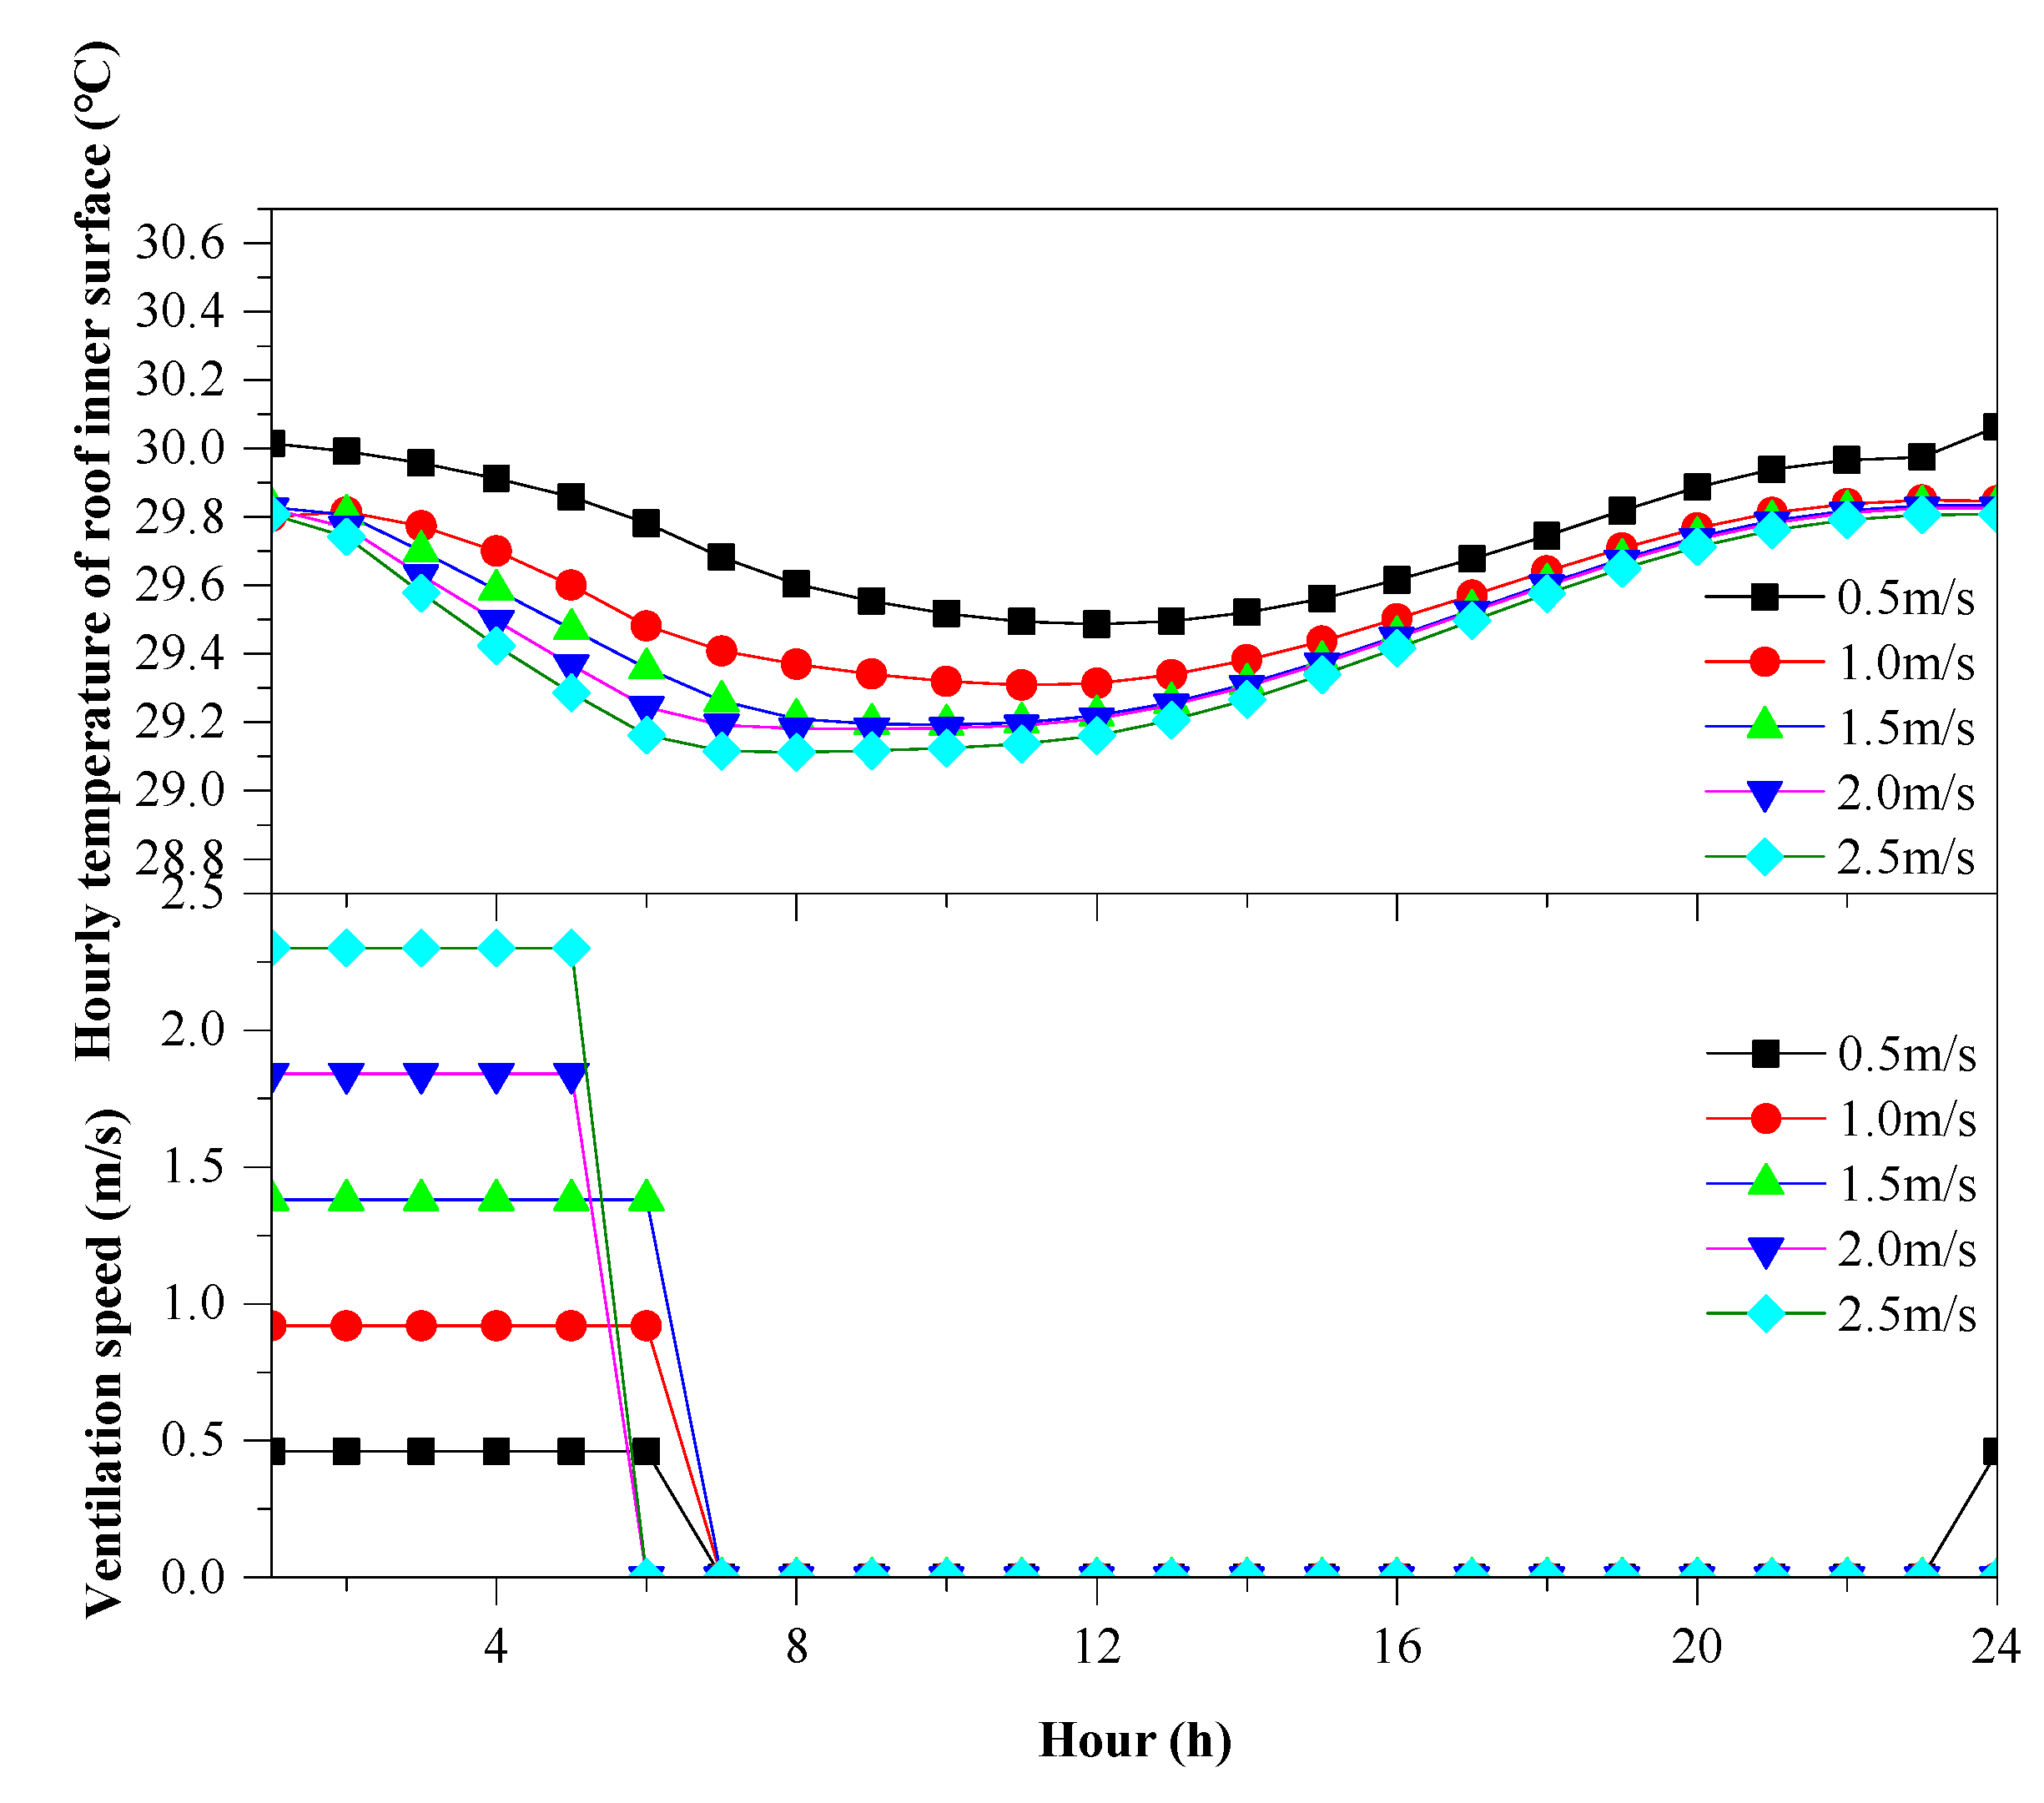
The VRSPO
With the thickness of PCM as 35 mm and melting temperature as 35~37 °C, the hourly temperatures of the roof’s inner surface and cavity ventilation times of VRSP
O at different ventilation speeds are shown in
Figure 18. The thermal performance of the roof is shown in
Table 9. When the ventilation speed increases from 0.5 m/s to 2.5 m/s, the average temperature of the inner surface decreases by 0.31 °C, and the ventilation time decreases from 6 h to 4 h based on the automatic ventilation control method, whereas the latent heat utilization rate of PCM increases gradually because the minimum liquid rate is reduced at night. The fitting curve of the average temperature of the inner surface and ventilation speed is shown in
Figure 19. With the increase in ventilation speed, the decrease in the average temperature of the interior surface decreases gradually. According to the fitting formula, when the ventilation speed is 2.5 m/s, the decreasing speed of the roof’s inner surface average temperature is 0, and the average temperature is the lowest. Therefore, the optimum ventilation speed is additionally 2.5 m/s.
- (3)
The VRSPI
With the thickness of PCM as 15 mm and melting temperature as 30~32 °C, the hourly temperatures of the roof’s inner surface and cavity ventilation times of the VRSP
I at different ventilation speeds are shown in
Figure 20. The thermal performance of the roof is shown in
Table 10. The fitting curve of the average temperature of the roof’s inner surface and ventilation speed is shown in
Figure 21. It can be concluded that the results are similar to those of the VRSP
M and VRSP
O. According to the fitting formula, when the ventilation speed is 2.6 m/s, the decrement in the roof’s inner surface average temperature is 0; therefore, it is the optimum condition of the VRSP
I and the hourly temperature of the inner surface of the roof is lowest (°C).
3.1.3. Cavity Size
The cavity size is an important parameter for the VRSP. It can influence the ventilation volume and the heat conductivity coefficient of the slab. An amount of 40 mm is a typical cavity radius, which is stipulated in the national standard (GB/T 14040-2007) [
48] and is widely used in practice. This section will study the optimal cavity size that can improve the thermal performance of the roof and meet the demands of the structure.
Based on the simulation results, the thermal performances of the VRSPM and VRSPO with cavity radii of 35 mm, 40 mm and 45 mm were studied. When the cavity radius is 40 mm, the optimum ventilation speed is 2.5 m/s. In the case of the same ventilation air volume, the ventilation speeds are 3.625 m/s and 1.975 m/s when the cavity radii are 35 mm and 45 mm, respectively.
Portraying the optimum design (for VRSP
M, the melting temperature was 33~35 °C and the PCM layer thickness was 25 mm; for VRSP
O, the melting temperature was 35~37 °C and the PCM layer thickness was 35 mm), the hourly inner surface temperature of the roof with different cavity radii at the same ventilation air volume is shown in
Figure 22. When the air volume is constant, as the radius of the cavity increases, the ventilation speed in the cavity decreases, and the hourly inner surface temperature decreases. As the variation trend is the same, therefore the case for VRSP
I is not studied. For the middle layer and the outer layer of phase change roofing, both were studied, and the cavity size of 40 cm was selected considering the strength of the roof panel. Considering the consistent trend of influence, that is, as the size of the cavity increases, the better the insulation performance of the roof panel, it is necessary to meet the requirements of strength; therefore, the 40 cm specified in the specification of the cavity panel was selected.
According to the “Central and South China Engineering Construction Standard Design Atlas”, when the precast concrete hollow floor slab thickness is 120 mm, to meet the stress and strength requirements of the slab structure, the suitable cavity radius is 40 mm. The latent heat utilization of each PCM layer is shown in
Table 11. As shown in
Table 11, when the cavity radius is 40 mm, the average latent heat utilization rate is the highest for both VRSP
M and VRSP
O, reaching 89.72% and 97.51%, respectively. Therefore, considering the structural requirements and the thermal performance, under the outdoor climatic conditions of a typical summer day in Wuhan, the optimum cavity radius is 40 mm regardless of the position of the PCM.
3.2. Comprehensive Comparative Analysis
According to the above simulation results, the optimum design parameters were obtained. For the VRSPM, the PCM thickness is 25 mm, the melting temperature is 33~35 °C and the ventilation speed is 2.5 m/s. For the VRSPO, the PCM thickness is 35 mm, the melting temperature is 35~37 °C and the ventilation speed is 2.5 m/s. For the VRSPI, the PCM thickness is 15 mm, the melting temperature is 29~31 °C and the ventilation speed is 2.6 m/s; in addition, the optimum cavity radii of the roofs are all 40 mm.
In order to analyze the thermal performances and energy-saving effects of the three kinds of VRSPs comparatively, the optimum structures of these three roofs were simulated and analyzed under several different weather conditions and compared with a non-phase change ventilated roof. The non-phase change ventilated roof is the structure that replaced the PCM layer of VRSPM or VRSPo with a concrete layer, and the cavity was not ventilated.
The outdoor sol-air temperature on a typical summer day (design day for an air-conditioning system) in Wuhan is 66.9 °C; therefore, 5 different days were selected in the range of 40 °C to 65 °C with a gradient of 5 °C. The meteorological parameters for each day are shown in
Table 12, and the hourly outdoor sol-air temperatures for five days are shown in
Figure 23. The comparison results of three VRSPs and a common roof are shown in
Figure 24 and
Figure 25, and the decrease in heat transfer is shown in
Figure 26.
As shown in
Figure 24 and
Figure 25, compared with the common roof, the VRSP
O performed best in decreasing peak temperature, the average temperature of the roof’s inner surface and heat transfer during the several design days. However, the PCM layer thicknesses of the three VRSPs were different, which might lead to differences in thermal performance. In order to study the thermal performance of the three optimal VRSPs when the thicknesses of the PCM layers were the same, the thicknesses of the PCM layers of the optimal structures of the VRSP
I and the VRSP
M were set for 35 mm as well, with the other parameters unchanged. The simulation results under the outdoor weather conditions of Design Day 1 were as follows: the average temperature of the inner surface of the optimal structure of the VRSP
O was 28.71 °C, and for the VRSP
M and VRSP
I, it was 28.65 °C and 28.59 °C, respectively. Therefore, when the thickness of the PCM layer was the same, the optimal structure of the VRSP
I had a slightly better heat insulation effect; however, the advantage was not distinct, compared with the VRSP
O, since the difference was only 0.12 °C.
Another important consideration in selecting the position of the PCM is the length of the PCM’s working time. The comparison results of the working time for three VRSPs and the common roof are shown in
Table 13. It is found that the PCM can not melt until the outdoor sol-air temperature exceeds a certain value, which is called the critical outdoor sol-air temperature. For the optimum structure of VRSP
O, the critical outdoor sol-air temperature is 43 °C. There are 75 days when the outdoor sol-air temperatures are higher than the critical value, and the number of hours is 372 throughout the whole year. For VRSP
M and VRSP
I, the critical outdoor sol-air temperatures are 48 °C and 49 °C, respectively, and the PCM can work for 60 and 58 days, specifically, 252 h and 230 h. It can be concluded that as the position of the PCM layer approaches the inner surface, the critical outdoor sol-air temperature is increasing, and the number of hours above the critical outdoor sol-air temperature is decreasing. Therefore, the PCM of VRSP
O could be utilized for a longer period of time throughout the year than the other two types.
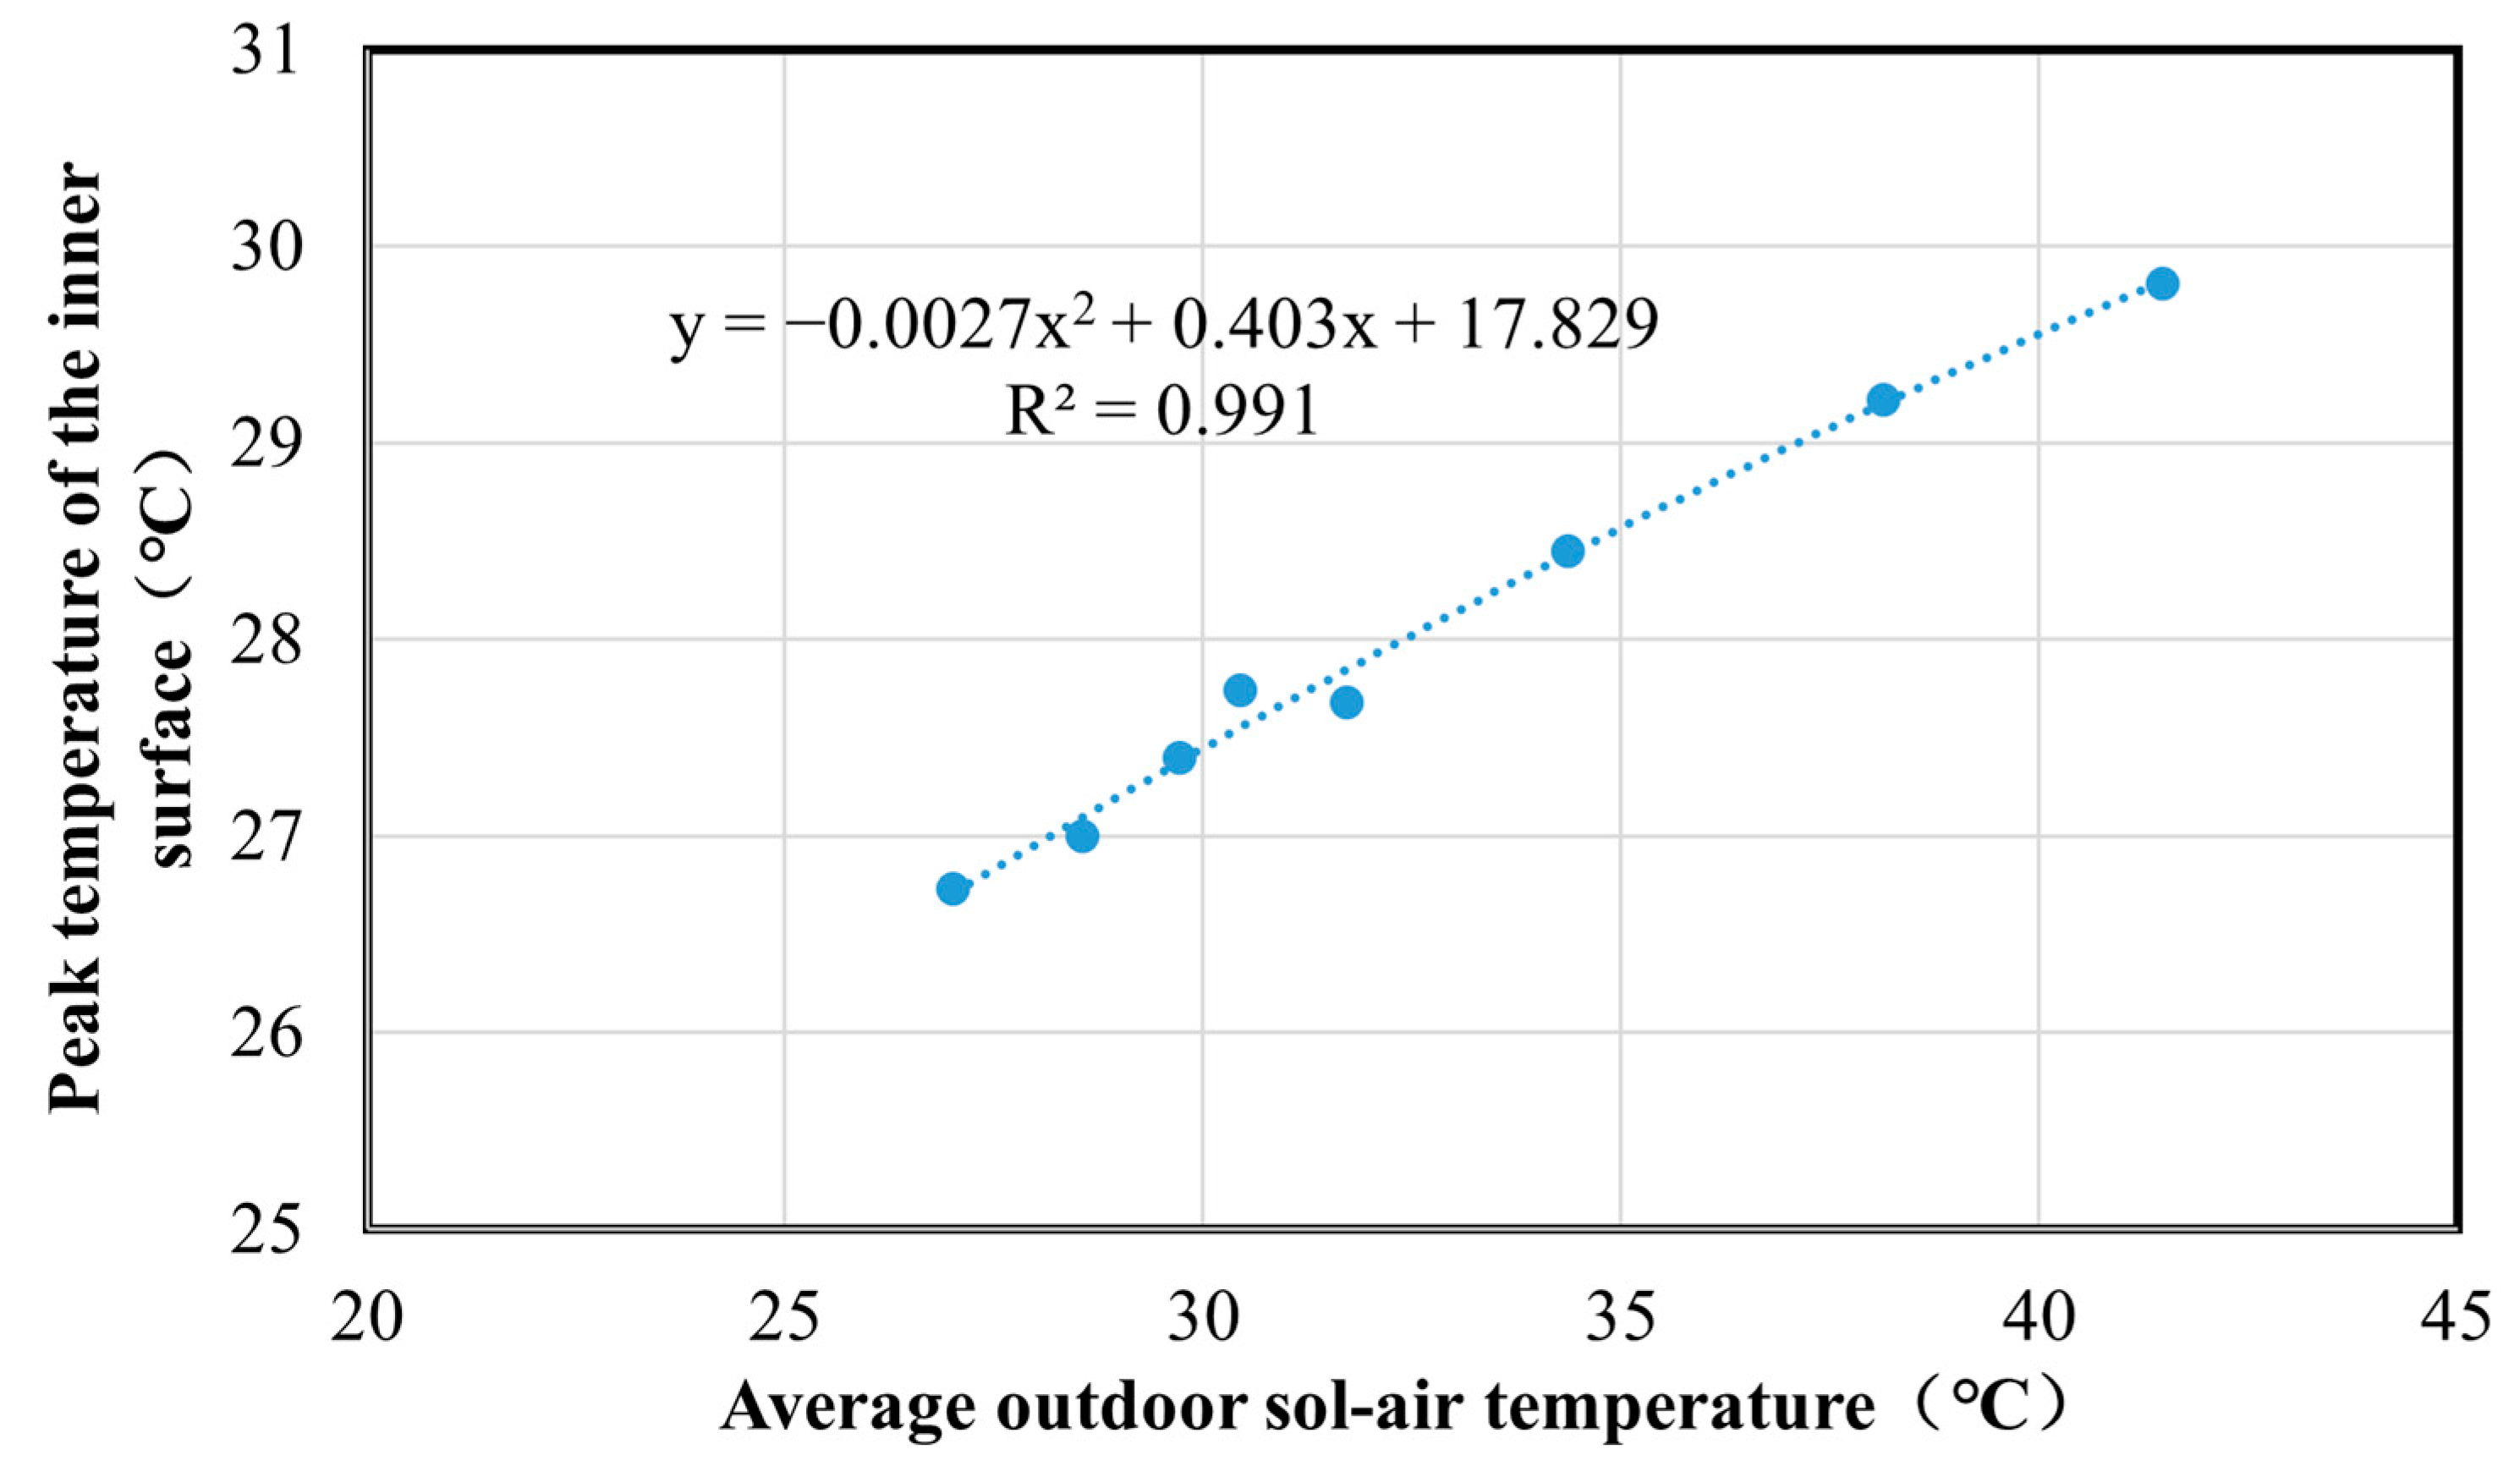
The inner surface temperature varies with the changes in outdoor temperature and solar radiation intensity. For the ventilated roof with PCM, night ventilation can not only take away the latent heat of phase change, however additionally play a certain role in cold storage. The maximum temperature of the inner surface of the roof is affected by solar radiation during the day and cold storage at night.
Figure 27 shows the relationship between the maximum inner surface temperature of VRSP
O and the daily average outdoor sol-air temperature. The formula for calculating the maximum inner surface temperature of VRSP
O, based on the daily average outdoor sol-air temperature is as follows:
where
y is the maximum inner surface temperature of VRSP
O (°C) and x is the daily average outdoor sol-air temperature (°C).
With the increase in the average outdoor sol-air temperature, the maximum inner surface temperature of VRSPO is gradually increasing; however, the rate of increase is gradually decreasing. When the daily average outdoor sol-air temperature is 41.5 °C, the maximum temperature of the inner surface of the roof increases to 29.8 °C; when the daily average outdoor sol-air temperatures x are 40 °C, 35 °C and 30 °C, the maximum inner surface temperatures of VRSPO decrease to 29.6 °C, 28.6 °C and 27.5 °C, respectively.
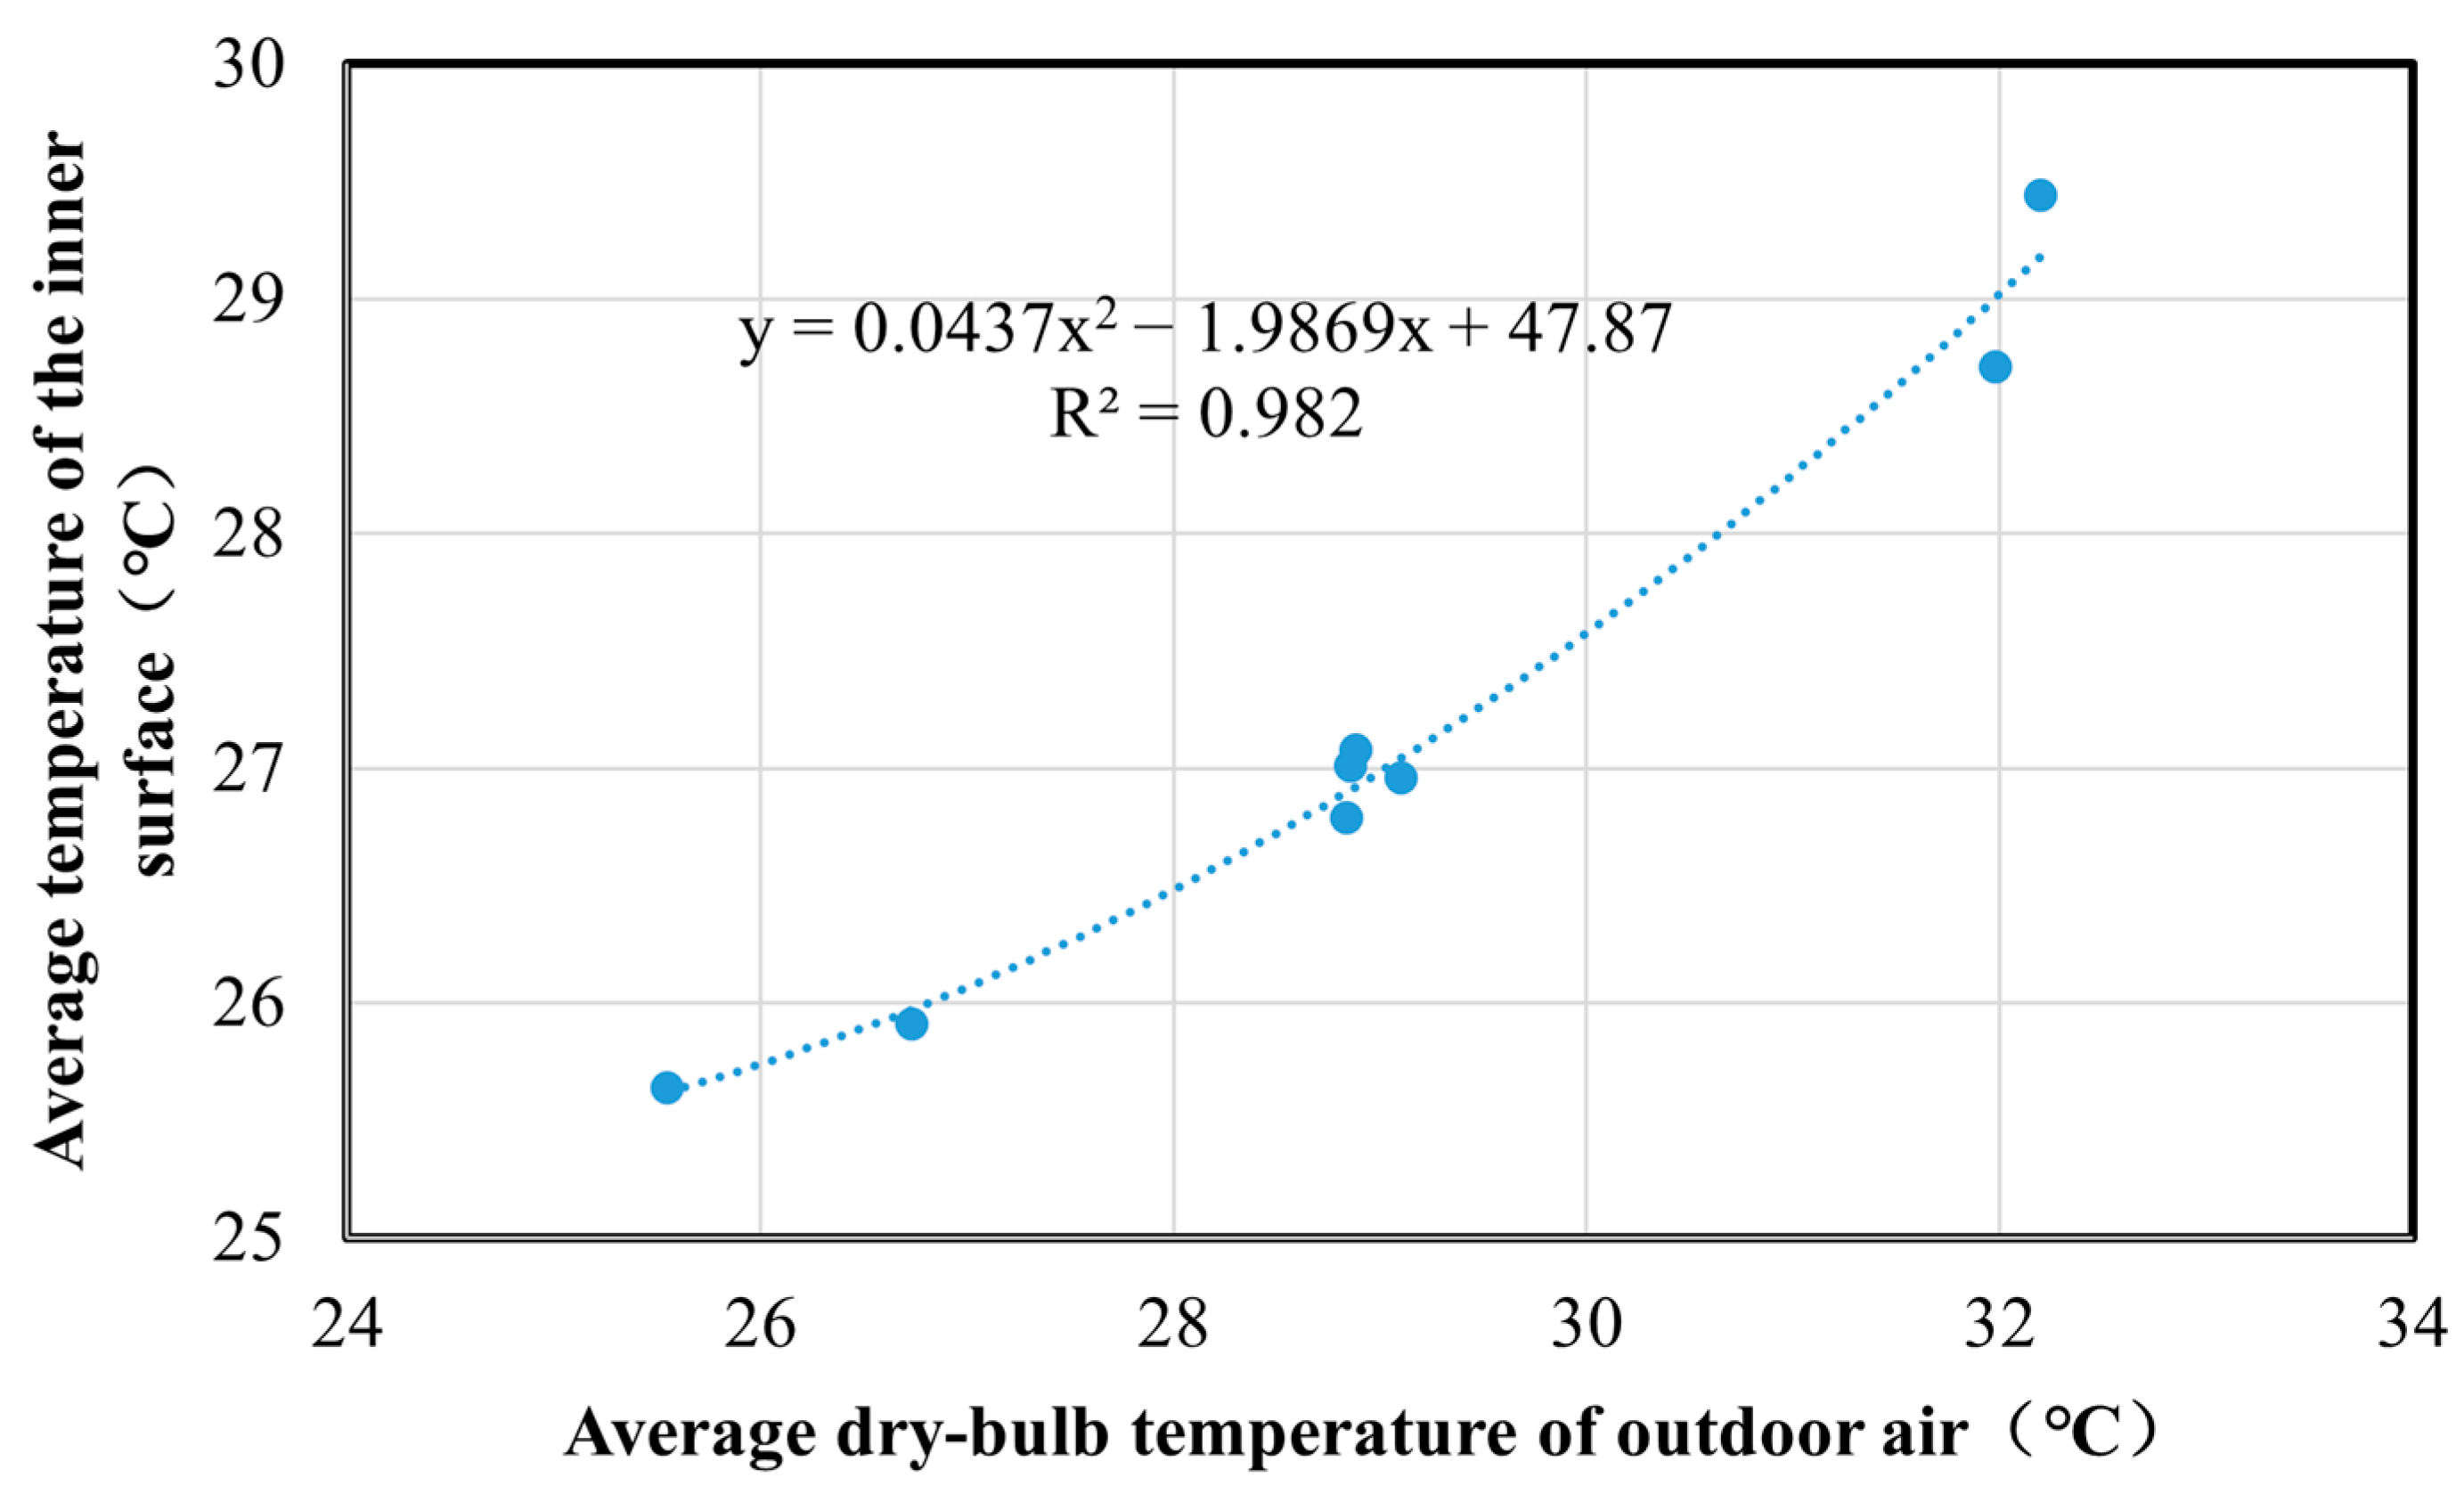
The relationships of delay time and average inner surface temperature with the outdoor average dry bulb temperature are fitted. The fitting curves are shown in
Figure 28 and
Figure 29. The fitting relation between average inner surface temperature and the daily average temperature of outdoor air is as follows:
where
y is the average inner surface temperature of VRSP
O (°C) and
x is the daily average dry-bulb temperature of outdoor air (°C).
The fitting relation between delay time and the daily average temperature of outdoor air is given below:
where
y is the delay time of VRSP
O (h) and
x is the daily average outdoor dry-bulb temperature of outdoor air (°C).
As the average outdoor air temperature increases, the average inner surface temperature and delay time of the roof rise. When the daily average outdoor dry-bulb temperature of the outdoor air is 32.20 °C, the average inner surface temperature and delay time of the roof rise to 29.44 °C and 12 h, respectively.
In this paper, according to the automatic control method by monitoring the ambient temperature and bottom temperature of the cavity surface at night, the daily start and ending times for ventilation are automatically determined. Ventilation time is affected by the outdoor air temperature during the ventilation period. The daily lowest temperature of outdoor air indicates the ventilation cooling capacity, therefore, if the relationship between ventilation time and the daily lowest temperature of outdoor air is fitted (
Figure 30), it can be written as follows:
where,
y is ventilation time (h),
x is the daily average dry-bulb temperature of outdoor air (°C).
With the increase in the daily lowest temperature of outdoor air, the number of ventilation hours decreases. When the daily lowest temperature of outdoor air rises to 29.4 °C, the ventilation time is only 4 h.
4. Discussion
Recently, some studies have additionally been conducted on ventilated roofs. Li et al. [
49] investigated a new type of ventilated roof consisting of multiple PCMs, using experiments and numerical simulations. The ventilated air gap is situated between the external layer and internal layer and is 200 mm thick. Their study additionally utilized
Tsol-air as a boundary condition; however, it was calculated from actual measurement data rather than information data. Additionally, the study defined some parameters to evaluate the performance. The results show that the inclusion of PCM can effectively improve the energy efficiency of the ventilated roof, and controlling the ventilation time can maximize the energy-saving potential. This is consistent with the findings of this study. It can be seen that study on the combination of PCM and ventilated roofs has value in advancing energy efficiency. Navarro [
50] conducted a theoretical analysis of the thermal response of a prefabricated concrete slab with PCM macro-encapsulated in small tubes and inserted into its hollows. Hot air provided by a solar air collector is used to flow through the hollows and store the heat of the PCM in winter, and cool air from the outdoors is injected inside the slab to solidify the PCM. During the day in summer, when cooling is needed, the internal ambient air from the cubicle is pumped through the slab and cooled down due to the heat exchange with the PCM, covering a part of the cooling load. The test results show that in summer, the indoor air temperature was kept to under 25 °C (±0.5 °C) all day without any conventional cooling system, instead with the active slab supply. In winter, 87% of the discharge period did not require the heat pump. It is suitable for the Mediterranean continental climate. In this study, a PCM with a melting temperature of 21–22.5 °C can be used in both summer and winter due to the climate in this area. This is because the climatic conditions of different regions allow the structure to be used in winter and summer, which is not possible with VRSP. It additionally differs from the VRSP in the form of the PCM and the melting temperature. If PCM is designed to store solar heat in the winter, an additional layer of PCM with a low melting temperature is needed for further research.
In this study, the thermal characteristics possessed by the VRSP when placing PCM in different positions in the roof are investigated. It is additionally optimized for the design, which is a guideline for the application of ventilated roofs in reality. The results of this study show that the highest utilization of the PCM can be obtained when the PCM is located in the outermost layer, and night ventilation is used. The cooling season in the city is only 100 days a year, instead of 365 days. The utilization time of PCM increases from 58 to 75 days; in other words, the utilization time of PCM increases from 58% to 75%. This is very valuable. If other optimization evaluation indexes are expected, the optimal location of the PCM should be reconsidered, for example, with the lowest inner roof surface temperature and the least amount of heat passing through the roof. The optimal location of the PCM can additionally be considered according to actual engineering needs, such as safety and maintenance factors. In the actual use of VRSP, it should be selected according to the actual location, climate, building type and design goals. Weighting issues and optimization for other metrics regarding VRSP will be studied in the future.
The Chinese government is printing and distributing “peak carbon dioxide emissions” on 26 October 2021 and clearly requires the promotion of low-carbon urban and rural construction. VRSP is a new type of energy-efficient roof that has a very broad application prospect in hot regions during summer. The roof can be constructed with precast concrete panels and buried ducts, or it can be retrofitted with natural ventilation and PCMs from existing overhead roofs. It has been cooperating with two enterprises to demonstrate the application of this structure in office buildings and residential buildings in the hot summer and cold winter zones of China and then will carry out the promotion application.
This structure additionally has some limitations. First, this structure consumes energy due to the use of fans to remove the PCM condensation heat, and PCM additionally needs an initial investment. Economic studies will be conducted in the future to determine the proper ventilation speed. Second, the noise of the fan should be considered. The determination of wind speed needs to consider noise in addition to the energy consumption of the fan. Third, the structure can sharply reduce the inner surface temperature and cooling requirements in summer. However, in winter, because of the low temperatures, the PCM can not change phase; it acts as a common material, which can play a certain role in thermal insulation to the indoor heat loss in winter. The heating load can be slightly reduced. For its small thickness and low thermal resistance, therefore, the impact of PCM on winter roof performance is very small. Therefore, it is suitable for areas during hot and long summers. Fourth, the material and form of the PCM were not studied. Additionally, no other shapes of the hollow plate were considered. Optimizing structural styles can additionally increase energy-saving potential.
Considering the application and function, a roof can be constructed with precast concrete panels and buried ducts, or it can be retrofitted with natural ventilation and PCMs from existing overhead roofs. The research team has been cooperating with two enterprises to demonstrate the application of this structure and then will carry out the promotion application. This structure has a very broad application prospect in hot regions during summer. The research team will now work with relevant companies to realize the application of phase change ventilated roofs in practice. The research on the optimization and energy conservation properties of phase change materials in energy storage will be further carried out, for example, in combination with solar energy and on the impact of phase change heat exchangers on the energy-saving characteristics of air-conditioning systems.


